

Abstract
Objective
Genomic biomarkers predicting immune checkpoint inhibitor (ICI) treatment outcomes for Asian metastatic melanoma have been rarely reported. This study presents data on next‐generation sequencing (NGS) and tumour microenvironment biomarkers in 33 cases.
Methods
Thirty‐three patients with advanced melanoma, who underwent ICI treatment at the Chang Gung Memorial Hospital in Taiwan, were recruited. The study evaluated clinical outcomes, including response rate, disease control rate, progression‐free survival (PFS) rate and overall survival (OS) rate. Archived tissue samples from 33 cases were subjected to NGS by ACTOnco, and ACTTME was employed in 25 cases.
Results
The most prevalent driver mutations were BRAF mutations (24.2%), followed by NRAS (15.2%), KIT (12.1%), KRAS (9.1%) and NF1 (9.1%) mutations. Acral/mucosal melanomas exhibited distinct mutation patterns compared to non‐acral melanomas. Tumour mutational burden estimated using ACTOnco was not associated with ICI efficacy. Notably, genetic alterations in the p53 pathway (CDKNA2 loss, MDM2 gain/amplification and TP53 mutation) accounted for 36.4% and were significantly associated with unfavourable PFS (median PFS 2.7 months vs. 3.9 months, P = 0.0394). Moreover, 26 genes were identified as differentially expressed genes that were upregulated in patients with clinical benefits compared to those without benefits. Four genes, GZMH, GZMK, AIM2 and CTLA4, were found to be associated with both PFS and OS.
Conclusion
Genetic alterations in the p53 pathway may be critical in Asian patients with melanoma undergoing ICI treatment. Further investigation is required to explore this mechanism and validate these findings.
Keywords: genomic and TME biomarkers, ICIs, melanoma, p53
The genetic landscape of melanoma response to immune checkpoint inhibitors (ICIs) has been previously investigated, but without correlation with modulation of the tumour microenvironment in clinical survival and treatment outcomes. We used next‐generation sequencing to define the genetic biomarkers of Asian melanoma associated with ICI response. The p53 pathway (CDKN2A/MDM2/TP53) is a prognostic factor for progression‐free survival after ICI treatment in Taiwanese patients with melanoma.

Introduction
Immune checkpoint inhibitors (ICIs), which have become essential in the treatment of malignant melanoma, target immune checkpoint proteins such as programmed cell death‐(ligand) 1 (PD‐(L)1) and cytotoxic T‐lymphocyte antigen‐4 (CTLA‐4). Currently, nivolumab, pembrolizumab and ipilimumab are widely used to treat advanced melanoma, regardless of mutation status or PD‐L1 expression. 1 , 2 Recently, the approval of relatlimab, which targets lymphocyte‐activation gene 3 (LAG3), in combination with nivolumab for advanced melanoma represents a significant development. 3 However, ICIs exhibit lower efficacy in Asian melanomas, particularly acral and mucosal melanomas 4 ; therefore, the identification of predictive biomarkers is imperative to selecting the most effective sub‐populations for ICI treatment.
Multiple studies involving next‐generation sequencing (NGS) have investigated the genomic profiles and genetic landscape of melanoma. Analysis of the whole‐genome mutation landscape of melanoma has revealed diverse carcinogenic processes across its subtypes. 5 Specifically, whole‐genome sequencing of acral 6 and mucosal melanomas 7 revealed distinct genomic complexity and diversity, with generally lower tumour mutational burden (TMB) compared to non‐acral melanoma. 5 However, these studies were limited to the genetic landscape without correlation with clinical survival and treatment outcomes in acral and mucosal melanomas, particularly in Asian melanomas. Additionally, besides the genetic alterations of tumours, the modulation of the tumour microenvironment (TME) plays a crucial role in the immune response to ICIs in melanomas. 8 , 9 Therefore, investigating the TME presents an alternative approach to elucidate the interaction between tumours and the TME, leading to the prediction of tumour response to ICIs.
Asian melanomas typically exhibit unfavourable overall survival (OS), stage‐specific survival and a poorer response to immunotherapy compared to Caucasian melanoma. 10 , 11 , 12 , 13 These differences in subtypes and ethnicity are known to influence treatment and survival. 12 To further understand the genetic landscape and TME for the prognosis of Asian melanomas treated with ICIs, this study aimed to evaluate the prognostic impact of genetic alterations. Additionally, it provides a more comprehensive investigation of Asian melanoma.
Results
Patient characteristics
The data of 40 ICI‐naïve patients with advanced melanoma undergoing ICI treatment were retrieved from the Immuno‐Oncology Center of Excellence (IOCOE) database. Five samples that failed quality control and two uveal melanomas were excluded from subsequent analyses; therefore, 33 samples were analysed using ACTOnco. Moreover, 25 archived tissues of good quality were available for ACTTME profiling (Figure 1a).
Figure 1.
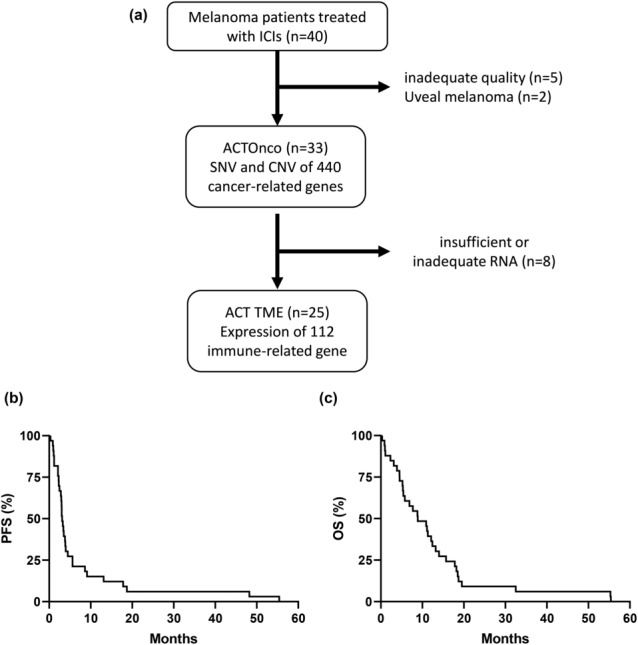
Flowchart, progression‐free survival (PFS) and overall survival (OS) in this study. (a) Flowchart for sample selection. (b) Progression‐free survival (PFS) and (c) overall survival (OS) of 33 patients with melanoma undergoing immune checkpoint inhibitor (ICI) treatment and gene testing, using ACTOnco, a gene panel of 440 single‐nucleotide variations (SNV) and copy number variations (CNV). The median PFS and OS were 3.3 and 11.1 months, respectively.
The median age of the 33 patients was 64 years (44–79 years). Fifteen patients (45.5%) were men and 18 (54.5%) were women. There were 15 acral lentiginous, nine mucosal, six superficial spreading, one nodular and two unknown primary melanomas. All patients were treated with ICIs as a later‐line systemic treatment. Prior treatment included targeted therapy for BRAF mutations, cytokines or chemotherapy. ICI treatment included ipilimumab (N = 4), nivolumab (N = 16), pembrolizumab (N = 5) and combined nivolumab and ipilimumab (N = 8). The clinical characteristics and tumour involvement in patients treated with different regimens are summarised in Table 1.
Table 1.
Patient characteristics (N = 33)
| Characteristics | N (%) |
|---|---|
| Age (years), median (range) | 64 (44–79) |
| ≤ 65 | 18 (54.5) |
| > 65 | 15 (45.5) |
| Gender | |
| Male | 15 (45.5) |
| Female | 18 (54.5) |
| Morphology | |
| Acral lentiginous | 15 (45.4) |
| Mucosal | 9 (27.3) |
| Superficial spreading | 6 (18.2) |
| Nodular | 1 (3.0) |
| Unknown primary | 2 (6.1) |
| Line of ICI treatment | |
| First line | 0 |
| Later line | 33 (100) |
| ICI drug | |
| Ipilimumab | 4 (12.1) |
| Nivolumab | 16 (48.5) |
| Pembrolizumab | 5 (15.2) |
| Nivolumab + Ipilimumab | 8 (24.2) |
ICI, immune checkpoint inhibitor.
Efficacy of ICIs
The best clinical response among the 33 patients was 4 partial responses (PR; 12.1%), 9 stable diseases (SD; 27.3%) and 20 progressive diseases (PD; 60.6%). The objective response rate (ORR) and disease control rate (DCR) in the entire cohort were 12.1% and 39.4%, respectively. The details of the clinical responses regarding melanoma subtypes are summarised in Table 2. After a median follow‐up of 8.7 months, the median PFS and OS were 3.3 (95% confidence interval [CI]: 2.7–3.8) and 11.1 (95% CI: 5.7–16.5) months, respectively (Figure 1b and c).
Table 2.
Efficacy of immunotherapy with different morphological types
| Acral (N = 15) | Mucosal (N = 9) | Cutaneous a (N = 7) | Unknown (N = 2) | All (N = 33) | |
|---|---|---|---|---|---|
| N (%) | N (%) | N (%) | N (%) | ||
| Complete response (CR) | 0 | 0 | 0 | 0 | 0 |
| Partial response (PR) | 2 (13.3) | 1 (11.1) | 0 | 1 (50) | 4 (12.1) |
| Stable disease (SD) | 4 (26.7) | 4 (44.4) | 1 (14.3) | 0 | 9 (27.3) |
| Disease progression (PD) | 9 (60.0) | 4 (44.4) | 6 (85.7) | 1 (50) | 20 (60.6) |
Cutaneous melanoma: superficial spreading, nodular melanoma.
Genetic landscape among patients with melanoma undergoing ICI treatment
The genetic landscape among patients with melanoma undergoing ICI treatment is summarised according to melanoma subtypes in Figure 2 and Supplementary figure 1. Regarding genetic alterations of commonly reported driver mutations, BRAF mutations (24.2%) were the most common, followed by NRAS (15.2%), KIT (12.1%), KRAS (9.1%) and NF1 (9.1%) mutations. Among the eight melanomas harbouring BRAF mutations, six were V600X (five V600E, one V600R) and two were non‐V600 mutations (D22N and R384G). The BRAF V600X mutation rate was 8.3% (2/24), 28.5% (2/7) and 100% (2/2) for acral/mucosal, non‐acral cutaneous and unknown primary melanomas, respectively. NRAS and NF1 mutations were restricted to acral/mucosal melanomas in the current cohort (Figure 2a and Supplementary figure 1a).
Figure 2.
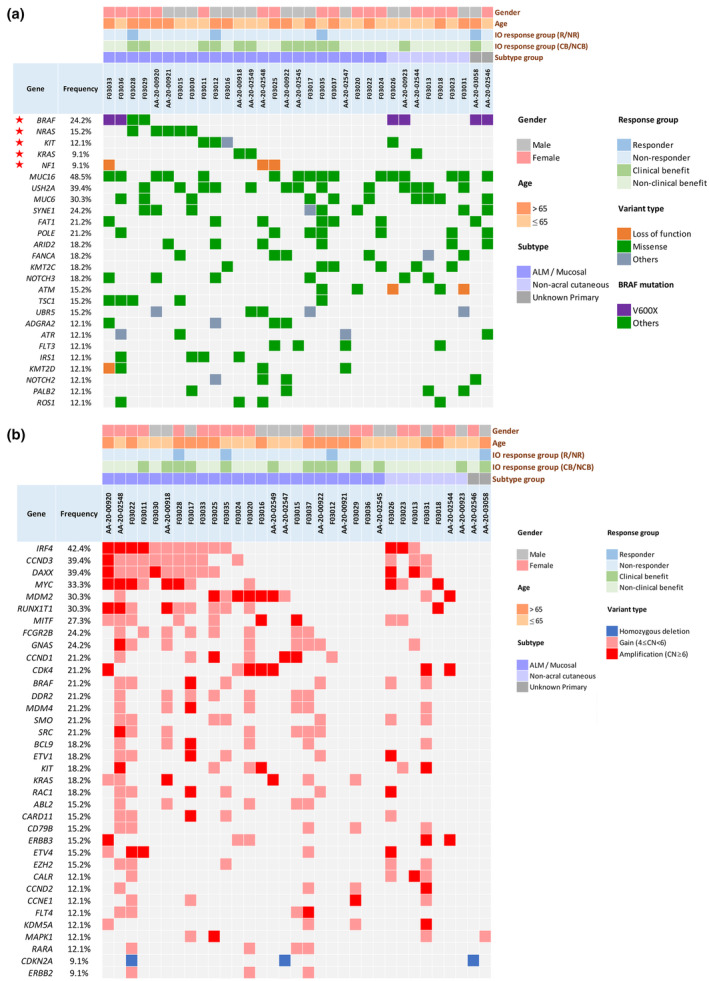
Summary of genomic alterations, clinicopathological features and clinical response to immuno‐oncology (IO) in 33 patients with advanced melanoma. (a) SNV and small insertions and deletions; and (b) CNV of important oncogenic drivers detected in each sample. Data are grouped by melanoma subtypes (acral/mucosal, non‐acral cutaneous and unknown primary melanoma). Hotspot gene alterations are coloured according to mutation type. Copy number changes: homozygous deletion (dark blue), amplification (red) and gain (pink). The frequencies of mutations detected in the whole cohort are shown on the left. Stars indicate driver mutations.
Regarding copy number alterations, gain (copy number of 4–6)/amplification (copy number > 6) of IRF4 was the most common, followed by CCND3 (39.4%), DAXX (39.4%), MYC (33.3%), MDM2 (30.3%) and RUNX1T1 (30.3%). Furthermore, 3 (12.5%) out of 24 acral/mucosal melanomas had ERBB2 gain/amplification, 2 (8.3%) acral/mucosal melanomas had CDKN2A loss and no non‐acral melanomas had ERBB2 gain/amplification or CDKN2A loss (Figure 2b and Supplementary figure 1b).
Association between TMB and ICI treatment
In this cohort, only two melanomas had high TMB (defined to be > 10 mutations per Mb), and the median TMB was 1.9 mutations per Mb. Among the two melanomas with high TMB, one had a partial response (acral melanoma, TMB: 10.4 mutations per Mb) and the other had a mixed response (non‐acral cutaneous melanoma, TMB: 18.8 mutations per Mb) and was defined as PD based on the RECIST criteria. No significant difference in TMB was observed between responders and non‐responders (median TMB: 4.175 vs. 1.24, P = 0.07, Figure 3a) or tumours with clinical benefit (CB) and non‐CB (median TMB: 2.55 vs. 1.9, P = 0.72, Figure 3b). The melanomas with TMB higher or lower than the median TMB (1.9 mutations per Mb) showed no significant difference in PFS (P = 0.92) and OS (P = 0.86) (Figure 3c and d). Therefore, in this cohort, TMB was not a predictive or prognostic biomarker for patients with melanoma treated with ICIs.
Figure 3.
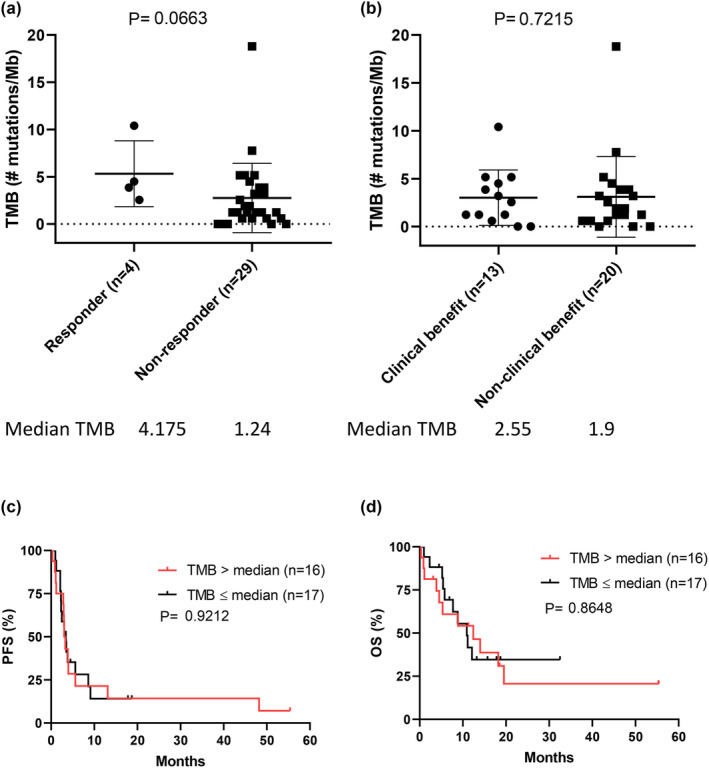
The association between tumour mutational burden (TMB) and treatment outcomes. (a) No significant difference in TMB was noted between responders and non‐responders (P = 0.0663). Responders were classified as tumours with responses. (b) No significant difference in TMB was noted between patients with and without clinical benefit (P = 0.7215). Clinical benefit indicates a tumour with a response and stable disease. No significant difference was noted in (c) PFS and (d) OS between patients with melanoma harbouring higher or lower than median TMB (1.9 mutations per Mb).
Association of driver mutations, cell‐cycle gene alterations and survival
Our cohort included 17 patients with melanoma harbouring driver mutations (BRAF/RAS/NF1) in the MAPK pathway. Driver mutations were not associated with PFS (P = 0.20, Supplementary figure 2a) or OS (P = 0.95, Supplementary figure 2b) in patients with melanoma treated with ICIs.
Cell‐cycle gene alteration in the CDK4 pathway is a frequent event in acral 14 and mucosal melanomas 15 and is considered an essential biomarker in Asian melanoma. 4 , 14 , 15 Our cohort included 15 patients with melanoma harbouring cell‐cycle gene alterations (CCND1 gain/amplification, CDK4 gain/amplification and CDKN2A loss). Cell‐cycle gene alterations were not associated with PFS (P = 0.28, Supplementary figure 2c) or OS (P = 0.63, Supplementary figure 2d) in patients with melanoma treated with ICIs.
Association between genetic alterations in the p53 pathway and survival
Twelve patients with melanoma harbouring alterations in the p53 pathway were included in our cohort (three patients had CDKN2A loss, ten had MDM2 gain/amplification and one had a TP53 mutation; Figure 4a). In patients with melanoma treated with ICIs, alteration of the p53 pathway was a prognostic factor for unfavourable PFS (P = 0.04, Figure 4b) but not for OS (P = 0.22, Figure 4c). The prognostic impacts of CDKN2A loss and MDM2 gain were evaluated separately, and trends were observed; however, no significant differences were found due to the limited number of cases (Supplementary figure 3).
Figure 4.
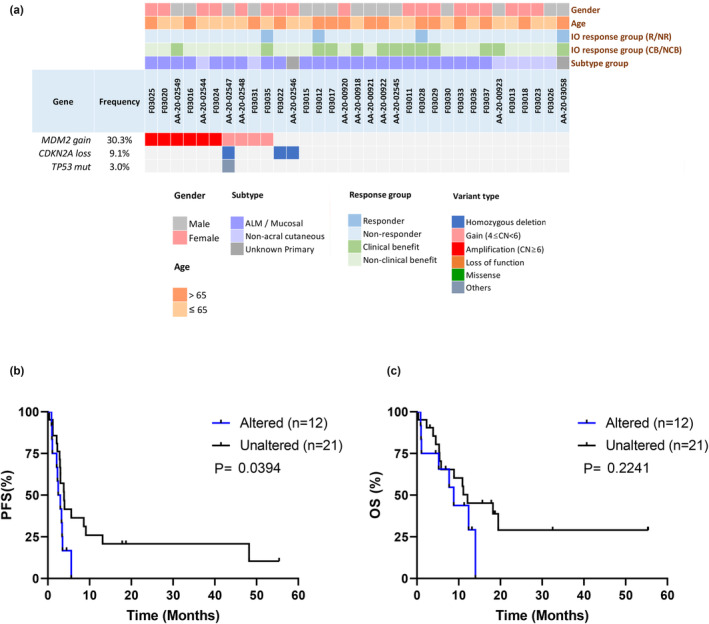
The association between genetic alterations in the CDKN2A/MDM2/TP53 axis and treatment outcomes. (a) The genetic landscape of the p53 pathway (CDKN2A/MDM2/TP53 axis). (b) The PFS and (c) OS between patients with melanoma harbouring p53 pathway alterations (CDKN2A loss, MDM2 gain, TP53 mutation). (b) The melanomas harbouring p53 pathway alterations had worse PFS than those without p53 pathway alterations (median PFS 2.7 months vs. 3.9 months, P = 0.0394).
More studies should be conducted to validate the potential influence of the p53 pathway on ICI efficacy. It is worth noting that the raw sequence data from the NGS used in two previous studies were not publicly available. 16 , 17 Hugo et al. reported the genomic features of the response to anti‐PD‐1 therapy in metastatic melanoma; however, only OS data were available. 18 The findings showed no significant difference in OS among the 37 patients with melanoma harbouring altered and non‐altered p53 pathway genes (Supplementary figure 4). Similarly, Riaz et al. reported genetic alterations in 68 patients with melanoma treated with nivolumab. 19 Neither 33 ipilimumab‐naïve nor 35 ipilimumab‐treated patients demonstrated significant differences in PFS and OS between melanomas harbouring altered and unaltered p53 pathway genes (Supplementary figure 5). 19 Similarly, Liu et al. reported 144 patients with melanoma treated with anti‐PD‐1, including 60 ipilimumab‐treated and 84 ipilimumab‐naïve patients. The results indicated that gene alterations in the p53 pathway did not influence PFS and OS after anti‐PD‐1 treatment (Supplementary figure 6). 20
Potential differentially expressed genes detected by ACTTME and their association with survival
Using the ACTTME assay, 26 genes were identified as potential differentially expressed genes (DEGs) upregulated in the CB cohort compared with the non‐CB cohort, according to the two‐sample t‐test P‐values of the volcano plot (Figure 5 and Table 3). In contrast, no DEGs were found among melanomas with or without CDKN2A/MDM2/TP53 alterations (Supplementary figure 7).
Figure 5.
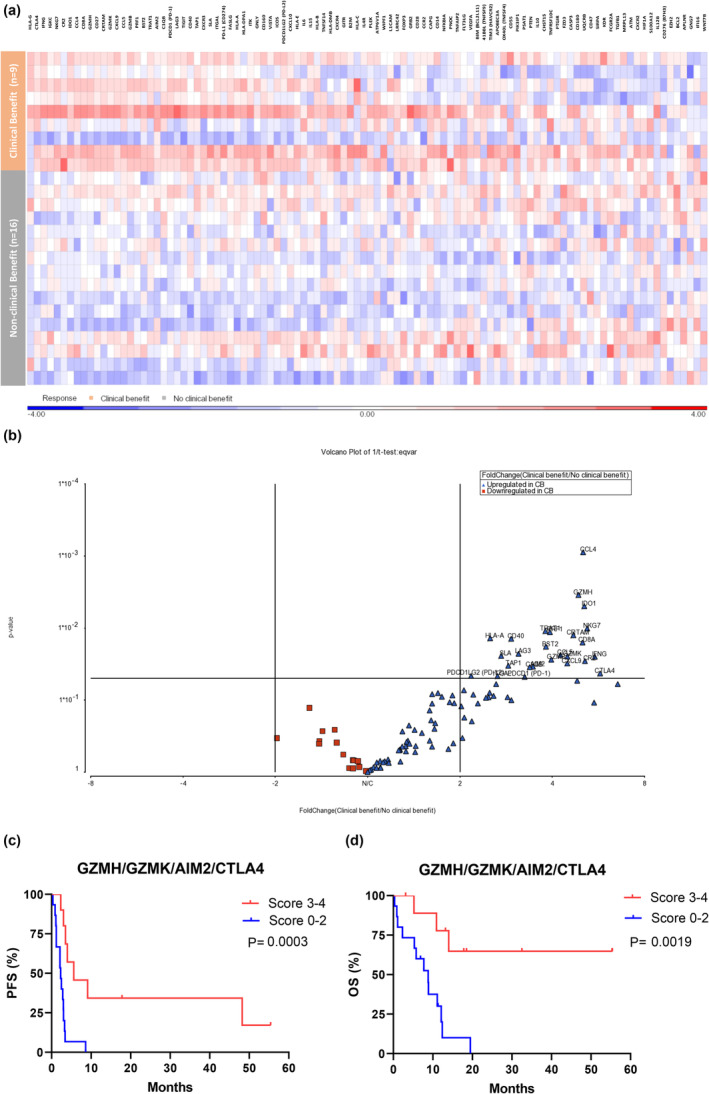
Gene expression in patients with or without clinical benefit. (a) Heatmap of immune‐associated genes and clinical benefit among patients undergoing immunotherapy. (b) A volcano plot showing the significance of immune association genes among patients with or without clinical benefit. (c) PFS and (d) OS of patients with melanoma based on the four‐gene signature.
Table 3.
Upregulated differentially expressed genes in patients with clinical benefit
| Column ID | P‐value | Fold change (Fc) | Group | Subgroup | P‐value (PFS) | P‐value (OS) |
|---|---|---|---|---|---|---|
| CCL4 | 0.0009 | 5.047 | CD4 | Activated CD4T cell | 0.0127 | 0.2580 |
| GZMH | 0.0035 | 4.875 | CD8 | Activated CD8 T cell | 0.0112 | 0.0497 |
| IDO1 | 0.0050 | 5.092 | Immune checkpoints | Immune checkpoint | 0.0030 | 0.1338 |
| NKG7 | 0.0101 | 5.205 | CD8 | Activated CD8 T cell | 0.0710 | 0.0753 |
| TRAT1 | 0.0110 | 3.802 | CD4 | Activated CD4 T cell | 0.0221 | 0.0502 |
| PRF1 | 0.0114 | 3.934 | Microenvironment modulator | Catalytic activity | 0.1390 | 0.1295 |
| CRTAM | 0.0126 | 4.691 | Other cell types | Natural killer cell | 0.0889 | 0.1621 |
| HLA‐A | 0.0139 | 2.511 | Antigen presentation | MHC | 0.0588 | 0.1116 |
| CD40 | 0.0141 | 2.941 | Immune checkpoints | Immune checkpoint | 0.1587 | 0.2909 |
| CD8A | 0.0159 | 5.026 | CD8 | Activated CD8 T cell | 0.0340 | 0.3025 |
| BST2 | 0.0182 | 3.818 | Other cell types | Natural killer cell | 0.2568 | 0.0773 |
| LAG3 | 0.0228 | 3.107 | Immune checkpoints | Immune checkpoint | 0.0918 | 0.3068 |
| CCL5 | 0.0236 | 4.257 | CD4 | Activated CD4 T cell | 0.0110 | 0.2416 |
| SLA | 0.0243 | 2.727 | Other cell types | Activated dendritic cell | 0.0015 | 0.0521 |
| GZMK | 0.0248 | 4.484 | CD8 | Activated CD8 T cell | 0.0404 | 0.0123 |
| IFNG | 0.0250 | 5.512 | Microenvironment modulator | Catalytic activity | 0.3870 | 0.4492 |
| GZMB | 0.0275 | 3.973 | Microenvironment modulator | Catalytic activity | 0.0506 | 0.5671 |
| CR2 | 0.0287 | 5.117 | Other cell types | Activated B cell | 0.1865 | 0.0363 |
| CXCL9 | 0.0309 | 4.481 | Microenvironment modulator | Tumour infiltration chemokines | 0.0273 | 0.1433 |
| TAP1 | 0.0333 | 2.877 | Antigen presentation | MHC | 0.0696 | 0.3332 |
| AIM2 | 0.0343 | 3.463 | CD4 | Activated CD4 T cell | 0.0499 | 0.0135 |
| C1QB | 0.0349 | 3.380 | Other cell types | Activated dendritic cell | 0.0081 | 0.1264 |
| CTLA4 | 0.0427 | 5.736 | Immune checkpoints | Immune checkpoint | 0.0024 | 0.0188 |
| PDCD1LG2 (PD‐L2) | 0.0462 | 2.176 | Immune checkpoints | Immune checkpoint | 0.4466 | 0.7744 |
| ITGAL | 0.0464 | 2.654 | Suppressive cells | MDSC | 0.0961 | 0.1753 |
| PDCD1 (PD‐1) | 0.0476 | 3.254 | Immune checkpoints | Immune checkpoint | 0.0661 | 0.4931 |
Kaplan–Meier survival analyses were performed for PFS and OS to investigate the robustness of these statistically significant DEGs as potential biomarkers for ICI response (Table 3). Twelve and five genes were associated with PFS and OS, respectively (Table 3, Supplementary figures 8 and 9). GZMH, GZMK, AIM2 and CTLA4 were genes commonly associated with PFS and OS, which may be more critical in the current cohort. The four‐gene signature (one score for each gene if gene expression is greater than the median, ranging from 0 to 4) was used to divide patients into favourable (score: 3–4) and unfavourable (score: 0–2) groups. The favourable group experienced better PFS and OS than the unfavourable group (median PFS: 5.6 vs. 2.3 months, P = 0.0003; median OS: not reached vs. 8.8 months, P = 0.0019; Figures 5c and d).
Discussion
This study conducted comprehensive genetic testing on Taiwanese patients with advanced melanoma treated with ICIs. Overall, the efficacy of ORR, DCR, PFS and OS was limited. BRAF mutations were the most frequently observed driver mutations, followed by NRAS, KIT, KRAS and NF1 mutations, and acral/mucosal melanomas displayed distinct mutation patterns compared to non‐acral melanomas. TMB was not associated with ICI efficacy in the current cohort. Genetic alterations in the p53 pathway (CDKNA2 loss, MDM2 gain/amplification and TP53 mutation) were associated with unfavourable PFS in the current cohort but not in the Caucasian cohort. A total of 26 genes were identified as DEGs upregulated in the CB cohort compared to the non‐CB cohort, and high expression of GZMH, GZMK, AIM2 and CTLA4 was associated with favourable PFS and OS.
In this study, we investigated the mutation landscape of melanomas, which revealed diverse carcinogenic processes across its subtypes (acral/mucosal vs. non‐acral cutaneous melanoma; Figure 2 and Supplementary figure 1). These subtypes are molecularly distinct, with a lower rate of BRAF V600 alterations and TMB but a higher rate of copy number alterations in acral and mucosal melanomas, which may potentially contribute to poorer outcomes in Asian melanomas. 21 BRAF mutations were less frequent in acral/mucosal melanomas than in other melanomas, indicating no role for BRAF‐targeted therapy in most Taiwanese melanomas. Conversely, in the present study, NRAS and NF1 mutations were limited to acral/mucosal melanomas. Additionally, CDKN2A loss and TP53 mutations were rare in the current cohort, in contrast to their prevalence in European melanomas. 5 It is worth noting that while SF3B1 mutations have been reported in Caucasian mucosal melanomas, 5 , 7 no SF3B1 mutation was found in mucosal melanoma in the current cohort. Although all studies showed diverse genetic landscapes across melanoma subtypes, the specific alterations differed in Caucasian cohorts. The current cohort highlights the possible genetic backgrounds of different races that play a role in melanoma tumorigenesis.
In the current cohort, two out of fifteen (13.3%) acral and one out of nine (11.1%) mucosal melanomas harboured ERBB2 gain (copy number ≥ 4), implying the potential for targeted therapy against ERBB2. A study reported that for patients with melanoma who had undergone MSK‐IMPACT testing, the ERBB2 amplification rate (copy number > 2) was 3%, 3% and 0% in the acral, mucosal and other subtypes, respectively. 22 Although a stricter definition of amplification was used in our cohort, both studies revealed a higher frequency of ERBB2 gain/amplification in acral/mucosal melanoma compared to non‐acral melanoma. Consequently, further investigation of anti‐HER2 treatment in patients with ERBB2‐amplified melanoma is warranted.
Tumour mutational burden is an essential biomarker for predicting the response to ICIs in cancer, including melanoma, and pembrolizumab has been approved for treating patients with cancers harbouring a high TMB. 23 Existing research indicates that a high TMB is associated with improved OS and PFS in advanced melanomas. 24 , 25 However, in the present study, TMB could not predict the response to ICIs, PFS, or OS. Although the estimation of TMB varies across different NGS panels, TMB was estimated by ACT ONCO by ACT Genomics, which participated in phase II of the Friends of Cancer Research TMB Harmonisation Project and demonstrated comparable reliability in estimating TMB, 26 ensuring the validity of the current study's findings. TMB was generally low, and only two melanomas had a high TMB, which was comparable with another Taiwanese report. 27 This outcome could be attributed to the high incidence of acral and mucosal melanomas. 5
In this study, the efficacy of ICIs was only influenced by the p53 pathway, rather than driver mutations and cell‐cycle gene alterations (Figure 4 and Supplementary figure 3), which is a novel finding and has not been reported previously. Our findings were not validated in other cohorts, 18 , 19 , 20 possibly due to the distinct genetic backgrounds of Western and Asian melanomas. Typically, CDKN2A loss accounts for most gene alterations in the p53 pathway for Caucasian melanomas; however, MDM2 gain was responsible for most alterations in our cohort. This cohort is comparable with a previously reported genetic landscape of Taiwanese melanomas. 27 Therefore, further studies should be conducted in Asian populations, particularly for acral and mucosal melanomas.
Using the ACTTME assay, 26 genes were identified as potential DEGs upregulated in the CB cohort compared to the non‐CB cohort. However, no DEGs were identified among melanomas with or without CDKN2A/MDM2/TP53 alterations, implying that altered pathways influence the efficacy of ICIs through mechanisms other than gene expression. Most of the identified genes were associated with activated CD4+ and CD8+ T cells, highlighting the importance of activating immune cells responsible for tumour immune surveillance in TME to predict the ICIs response in Taiwanese melanomas. This finding is consistent with previous studies that have shown CD4+ and CD8+ T cells to be prognostic factors for melanomas. 28 , 29 Furthermore, we observed associations between GZMH, GZMK, AIM2 and CTLA4 with PFS and OS.
In addition to their potential lack of efficacy, checkpoint inhibitors have a unique and occasionally devastating side‐effect profile. Consequently, there is a pressing need for biomarkers capable of accurately predicting responses and improving treatment outcomes. PD‐L1, the extensively studied biomarker, is not the most appropriate marker for malignant melanoma. 30 TMB stands as a universal biomarker. 23 However, as observed in this study, TMB is low in acral and mucosal melanomas, which could account for the low treatment outcomes in Asian melanoma cases. Numerous other biomarkers have been reported, including conventional serum indices, tumour factors, host factors and some research markers. 31 The widespread availability of NGS techniques enables gene expression profiling. In this study, both tumour and host factors were evaluated. The p53 pathway was found to potentially influence the efficacy of ICIs. Concerning the TME, most DEGs with prognostic significance were associated with CD4+ and CD8+ T cells, which are characterised by their ability to secrete granzyme B and perforin, leading to target cell elimination in an MHC class II‐restricted fashion.
This study had several limitations. First, the study is limited by the number of samples and the heterogeneity of the melanoma types and ICI treatment. Due to the low prevalence of melanoma in Taiwan and other Asian countries, a relatively large cohort would be necessary to conduct a thorough investigation of the biomarkers by NGS for patients with melanoma treated with ICIs in the Asian population. Nevertheless, the study has provided novel insights into the p53 pathway, which should be validated in future studies. Second, validation of our findings using public datasets or databases is essential. However, we were unable to access any available data on Asian melanomas. Therefore, future studies should be performed to validate the outcomes presented in this study.
In conclusion, a comprehensive genomic and TME study was performed on patients with advanced melanoma undergoing ICI treatment. Altered genes associated with the p53 pathway (CDKN2A/MDM2/TP53) are prognostic factors for PFS in ICIs. The four‐gene immune signature is a novel biomarker for predicting the efficacy of ICIs in Taiwanese patients with melanoma.
Methods
Patients
Patient data from Chang Gung Memorial Hospital (CGMH), Linkou, from 2015 to 2020, were examined for patients with histologically confirmed melanoma treated with ICIs. The inclusion criteria were patients with archived tissue samples available for NGS prior to ICI treatment, and the data were retrieved from the IOCOE database. ICI‐naïve patients with advanced melanoma undergoing ICI treatment with nivolumab, pembrolizumab and ipilimumab, alone or in combination, were screened.
Treatment regimens and response evaluation
The treatment regimens comprised ipilimumab (3 mg kg−1 every 3 weeks for a maximum of four cycles), nivolumab (3 mg kg−1 every 2 weeks), pembrolizumab (2 mg kg−1 every 3 weeks) or a combination of ipilimumab and nivolumab/pembrolizumab until disease progression or intolerant toxicities were observed. Tumour response was evaluated regularly by physical examination, chest radiography, computed tomography or positron emission tomography.
Patient characteristics and outcome evaluations
The last follow‐up period included in the study was 31 December 2020. Patient characteristics, including age, gender, melanoma stage and tumour involvement in distant metastases, were recorded. RECIST 1.1 criteria were used to evaluate the best tumour response as complete response (CR), PR, SD or PD. Patients who experienced rapid deterioration or lacked radiological evaluation data before death were classified as having PD. The ORR was the sum of CR and PR; patients who experienced CR/PR of tumours were considered responders. The DCR was computed as the sum of CR, PR and SD and was considered a CB.
Progression‐free survival was defined as the duration from the first day of ICI treatment until the first clinical or radiological evidence of disease progression, death or the latest follow‐up. OS was defined to be the time from the first day of ICI treatment until the date of death or the last follow‐up.
Sample processing and next‐generation sequencing
Uveal melanoma and samples that failed quality control were excluded from the ACTOnco analysis (ACT Genomics, Taipei, Taiwan), an NGS panel sequencing comprising more than 400 genes. Moreover, good‐quality archived tissues were available for ACTTME profiling, which focused on more than 100 genes responsible for the TME and prediction of ICIs. Genomic DNA was extracted from formalin‐fixed paraffin‐embedded (FFPE) tissues using the QIAmp DNA FFPE Tissue Kit (Qiagen, Hilden, Germany) and subjected to library amplification using primers targeting the coding exons of 440 genes. The quality and quantity of the extracted DNA and amplified library were determined using an AATI fragment analyser and Qubit (Invitrogen, Carlsbad, CA, USA). Sequencing was conducted on an Ion Proton sequencer with an Ion P1 chip (Life Technologies, Carlsbad, CA, USA) according to the manufacturer's instructions, with a mean sequencing depth of > 500×. The human genome sequence, hg19 reference genome, was used for read mapping. Single‐nucleotide variations and short insertions/deletions were identified and analysed using the Ion Torrent Suite Server (version 5.0) and Torrent Suite Variant Caller plug‐in (version 5.0). Variants with coverage ≥ 25×, variant allele frequency (VAF) of ≥ 5% and hotspot variants with VAF ≥ 2% were retained and considered mutations. Variants with a minor allele frequency of < 1% in the Genome Aggregation Database were considered single‐nucleotide polymorphisms.
Gene expression analysis was conducted on 25 patient samples using an ACTTME assay (ACT Genomics). The E‐value was derived by transforming gene Ct values from the ACTTME assay. E‐value is positively regulated by gene expression (i.e. a higher E‐value indicates higher gene expression levels). Low expression of selected genes was determined by the median cut‐off (i.e. above the median was defined as relatively high expression).
External validation
Next‐generation sequencing data were collected from previous studies on ICIs for advanced melanoma to validate the findings obtained from the CGMH cohort. 18 , 19 , 20 In a study by Liu et al., mutation status and copy number alterations were available and could be downloaded for analysis. 20 However, this information was unavailable in the other two studies. 18 , 19 Therefore, we downloaded the raw sequence data from the NCBI Sequence Read Archive database (PRJNA307199, PRJNA343789 and PRJNA359359) and processed it using our modified version of the NCI's Genomic Data Commons DNA‐Seq analysis pipeline to obtain the mutation status and copy number alterations. 32 After obtaining the FASTQ file, Trimmomatic 33 was used to trim adapters and remove sequences with poor sequencing quality. Subsequently, the reads were aligned to the GRCh38 version of the human reference sequence using the Burrows‐Wheeler Alignment MEM algorithm. 34 SAMtools software 35 was then converted to the BAM format, and Picard was used for sorting BAM and marking duplicates (http://broadinstitute.github.io/picard/). Finally, a base quality score recalibration procedure was applied using GATK4. 36 Subsequently, the processed BAM file was obtained for variant and copy number calling. Variant calling was performed using GATK4, and copy number alterations were identified using CNVkit. 37
The criteria set for altering the p53 pathway included (1) CDKN2A loss (copy number < 2), (2) MDM2 gain/amplification (copy number ≥ 4) and (3) TP53 mutation. PFS and OS rate were evaluated in patients with melanoma harbouring altered p53 pathway genes.
Statistical analysis
Survival was estimated using the Kaplan–Meier method and compared using the log‐rank test using GraphPad Prism version 9 (GraphPad Software, San Diego, CA, USA). A P‐value < 0.05 was considered statistically significant. NGS and TME data were analysed to explore prognostic biomarkers. Fold‐change (Fc) analysis used a parametric two‐sample t‐test to measure the quantity difference between CB and non‐CB measurements. The significance level was set at a P‐value < 0.05. The Mann–Whitney U‐test was performed to select the statistically significant genes (Fc > 2 or < −2 and P‐value < 0.05) to assess the significance of genes identified as potential DEGs from Fc analysis. This study was approved by the Institutional Review Board of CGMH (201901160B0). Due to the retrospective nature of this study, which was approved by the Institutional Review Board of CGMH, patient consent to participate was not required.
Author contributions
Conceptualisation: JWCC, CJH, WKH, CEW. Data curation: JWCC, CJH, YCW, CEW. Formal analysis: CLW, YHW, SJC, KTT. Funding acquisition: CEW. Investigation: JJH, YYC, YLH. Methodology: CLW, YHW, SJC, KTT. Validation: CJH, WKH. Project administration: JWCC, CEW. Resources: JWCC and CEW. Software: WKH and CEW. Supervision: JWCC, CEW. Visualisation: CPC. Writing—Original draft: CEW. Writing—Review and editing: JWCC, CEW. All authors have read and agreed to the published version of this manuscript.
Conflict of interest
KTT was an employee of ACT Genomics Co., Ltd. CLW, YHW and SJC are employees of ACT Genomics Co., Ltd. The other authors declare that the research was conducted without commercial or financial relationships that could be construed as potential conflicts of interest.
Funding
This study was supported by grants from Linkou Chang‐Gung Memorial Hospital (CORPG3J0151~2 to JWCC, CMRPG3M0971 and CMRPG3K2171 to CEW), the National Science and Technology Council (Grant no. 109‐2314‐B‐182‐080‐MY3, 111‐2811‐B‐182‐017 to CEW) and ACT Genomics Co., Ltd.
Ethics approval
The protocol for human sample biobanking was approved (ethics, scientific and final) by the Institutional Review Board of Linkou Chang‐Gung Memorial Hospital, Protocol Number: IRB # 201901160B0. Due to the retrospective nature of this study, which was approved by the Institutional Review Board of CGMH, patient consent to participate was not required.
Supporting information
Supplementary figure 1
Supplementary figure 2
Supplementary figure 3
Supplementary figure 4
Supplementary figure 5
Supplementary figure 6
Supplementary figure 7
Supplementary figure 8
Supplementary figure 9
Acknowledgments
This study was supported by the Immuno‐Oncology Center of Excellence (IOCOE), Chang‐Gung Memorial Hospital, Linkou, Taiwan.
Data availability statement
Data are available upon reasonable request.
References
- 1. Larkin J, Chiarion‐Sileni V, Gonzalez R et al. Five‐year survival with combined nivolumab and ipilimumab in advanced melanoma. N Engl J Med 2019; 381: 1535–1546. [DOI] [PubMed] [Google Scholar]
- 2. Robert C, Ribas A, Schachter J et al. Pembrolizumab versus ipilimumab in advanced melanoma (KEYNOTE‐006): Post‐hoc 5‐year results from an open‐label, multicentre, randomised, controlled, phase 3 study. Lancet Oncol 2019; 20: 1239–1251. [DOI] [PubMed] [Google Scholar]
- 3. Tawbi HA, Schadendorf D, Lipson EJ et al. Relatlimab and nivolumab versus nivolumab in untreated advanced melanoma. N Engl J Med 2022; 386: 24–34. [DOI] [PMC free article] [PubMed] [Google Scholar]
- 4. Mao L, Qi Z, Zhang L, Guo J, Si L. Immunotherapy in acral and mucosal melanoma: Current status and future directions. Front Immunol 2021; 12: 680407. [DOI] [PMC free article] [PubMed] [Google Scholar]
- 5. Hayward NK, Wilmott JS, Waddell N et al. Whole‐genome landscapes of major melanoma subtypes. Nature 2017; 545: 175–180. [DOI] [PubMed] [Google Scholar]
- 6. Newell F, Wilmott JS, Johansson PA et al. Whole‐genome sequencing of acral melanoma reveals genomic complexity and diversity. Nat Commun 2020; 11: 5259. [DOI] [PMC free article] [PubMed] [Google Scholar]
- 7. Newell F, Kong Y, Wilmott JS et al. Whole‐genome landscape of mucosal melanoma reveals diverse drivers and therapeutic targets. Nat Commun 2019; 10: 3163. [DOI] [PMC free article] [PubMed] [Google Scholar]
- 8. Falcone I, Conciatori F, Bazzichetto C et al. Tumor microenvironment: Implications in melanoma resistance to targeted therapy and immunotherapy. Cancer 2020; 12: 2870. [DOI] [PMC free article] [PubMed] [Google Scholar]
- 9. Huang AC, Zappasodi R. A decade of checkpoint blockade immunotherapy in melanoma: Understanding the molecular basis for immune sensitivity and resistance. Nat Immunol 2022; 23: 660–670. [DOI] [PMC free article] [PubMed] [Google Scholar]
- 10. Chang JW, Guo J, Hung CY et al. Sunrise in melanoma management: Time to focus on melanoma burden in Asia. Asia Pac J Clin Oncol 2017; 13: 423–427. [DOI] [PubMed] [Google Scholar]
- 11. Wu CE, Yang CK, Peng MT et al. Immune checkpoint inhibitors for advanced melanoma: Experience at a single institution in Taiwan. Front Oncol 2020; 10: 905. [DOI] [PMC free article] [PubMed] [Google Scholar]
- 12. Bai X, Shoushtari AN, Betof Warner A et al. Benefit and toxicity of programmed death‐1 blockade vary by ethnicity in patients with advanced melanoma: An international multicentre observational study. Br J Dermatol 2022; 187: 401–410. [DOI] [PubMed] [Google Scholar]
- 13. Wu CE, Yang CK, Peng MT et al. The association between immune‐related adverse events and survival outcomes in Asian patients with advanced melanoma receiving anti‐PD‐1 antibodies. BMC Cancer 2020; 20: 1018. [DOI] [PMC free article] [PubMed] [Google Scholar]
- 14. Kong Y, Sheng X, Wu X et al. Frequent genetic aberrations in the CDK4 pathway in acral melanoma indicate the potential for CDK4/6 inhibitors in targeted therapy. Clin Cancer Res 2017; 23: 6946–6957. [DOI] [PubMed] [Google Scholar]
- 15. Xu L, Cheng Z, Cui C et al. Frequent genetic aberrations in the cell cycle related genes in mucosal melanoma indicate the potential for targeted therapy. J Transl Med 2019; 17: 245. [DOI] [PMC free article] [PubMed] [Google Scholar]
- 16. Snyder A, Makarov V, Merghoub T et al. Genetic basis for clinical response to CTLA‐4 blockade in melanoma. N Engl J Med 2014; 371: 2189–2199. [DOI] [PMC free article] [PubMed] [Google Scholar]
- 17. Van Allen EM, Miao D, Schilling B et al. Genomic correlates of response to CTLA‐4 blockade in metastatic melanoma. Science 2015; 350: 207–211. [DOI] [PMC free article] [PubMed] [Google Scholar]
- 18. Hugo W, Zaretsky JM, Sun L et al. Genomic and transcriptomic features of response to anti‐PD‐1 therapy in metastatic melanoma. Cell 2016; 165: 35–44. [DOI] [PMC free article] [PubMed] [Google Scholar]
- 19. Riaz N, Havel JJ, Makarov V et al. Tumor and microenvironment evolution during immunotherapy with nivolumab. Cell 2017; 171: 934–949.e16. [DOI] [PMC free article] [PubMed] [Google Scholar]
- 20. Liu D, Schilling B, Liu D et al. Integrative molecular and clinical modeling of clinical outcomes to PD1 blockade in patients with metastatic melanoma. Nat Med 2019; 25: 1916–1927. [DOI] [PMC free article] [PubMed] [Google Scholar]
- 21. Shoushtari AN, Bao R, Luke JJ. PD‐1 blockade in Chinese versus western patients with melanoma. Clin Cancer Res 2020; 26: 4171–4173. [DOI] [PMC free article] [PubMed] [Google Scholar]
- 22. Gottesdiener LS, O'Connor S, Busam KJ et al. Rates of ERBB2 alterations across melanoma subtypes and a complete response to trastuzumab emtansine in an ERBB2‐amplified acral melanoma. Clin Cancer Res 2018; 24: 5815–5819. [DOI] [PMC free article] [PubMed] [Google Scholar]
- 23. Marabelle A, Fakih M, Lopez J et al. Association of tumour mutational burden with outcomes in patients with advanced solid tumours treated with pembrolizumab: Prospective biomarker analysis of the multicohort, open‐label, phase 2 KEYNOTE‐158 study. Lancet Oncol 2020; 21: 1353–1365. [DOI] [PubMed] [Google Scholar]
- 24. Hodi FS, Wolchok JD, Schadendorf D et al. TMB and inflammatory gene expression associated with clinical outcomes following immunotherapy in advanced melanoma. Cancer Immunol Res 2021; 9: 1202–1213. [DOI] [PMC free article] [PubMed] [Google Scholar]
- 25. Ning B, Liu Y, Wang M, Li Y, Xu T, Wei Y. The predictive value of tumor mutation burden on clinical efficacy of immune checkpoint inhibitors in melanoma: A systematic review and meta‐analysis. Front Pharmacol 2022; 13: 748674. [DOI] [PMC free article] [PubMed] [Google Scholar]
- 26. Vega DM, Yee LM, McShane LM et al. Aligning tumor mutational burden (TMB) quantification across diagnostic platforms: Phase II of the Friends of Cancer Research TMB Harmonization Project. Ann Oncol 2021; 32: 1626–1636. [DOI] [PubMed] [Google Scholar]
- 27. Sheen YS, Tan KT, Tse KP et al. Genetic alterations in primary melanoma in Taiwan. Br J Dermatol 2020; 182: 1205–1213. [DOI] [PubMed] [Google Scholar]
- 28. Fu Q, Chen N, Ge C et al. Prognostic value of tumor‐infiltrating lymphocytes in melanoma: A systematic review and meta‐analysis. Onco Targets Ther 2019; 8: 1593806. [DOI] [PMC free article] [PubMed] [Google Scholar]
- 29. Johansson PA, Hayward NK, Pritchard AL. Immune signatures in cutaneous melanoma correlate with survival independently of immunotherapy treatment. Pigment Cell Melanoma Res 2023; 36: 246–251. [DOI] [PubMed] [Google Scholar]
- 30. Wolchok JD, Chiarion‐Sileni V, Gonzalez R et al. Overall survival with combined nivolumab and ipilimumab in advanced melanoma. N Engl J Med 2017; 377: 1345–1356. [DOI] [PMC free article] [PubMed] [Google Scholar]
- 31. Burdett N, Desai J. New biomarkers for checkpoint inhibitor therapy. ESMO Open 2020; 5: e000597. [DOI] [PMC free article] [PubMed] [Google Scholar]
- 32. Grossman RL, Heath AP, Ferretti V et al. Toward a shared vision for cancer genomic data. N Engl J Med 2016; 375: 1109–1112. [DOI] [PMC free article] [PubMed] [Google Scholar]
- 33. Bolger AM, Lohse M, Usadel B. Trimmomatic: A flexible trimmer for illumina sequence data. Bioinformatics 2014; 30: 2114–2120. [DOI] [PMC free article] [PubMed] [Google Scholar]
- 34. Li H, Durbin R. Fast and accurate short read alignment with burrows‐wheeler transform. Bioinformatics 2009; 25: 1754–1760. [DOI] [PMC free article] [PubMed] [Google Scholar]
- 35. Li H, Handsaker B, Wysoker A et al. The sequence alignment/map format and SAMtools. Bioinformatics 2009; 25: 2078–2079. [DOI] [PMC free article] [PubMed] [Google Scholar]
- 36. Van der Auwera GA, Carneiro MO, Hartl C et al. From FastQ data to high confidence variant calls: The genome analysis toolkit best practices pipeline. Curr Protoc Bioinformatics 2013; 43: 11.10.1–11.10.33. [DOI] [PMC free article] [PubMed] [Google Scholar]
- 37. Talevich E, Shain AH, Botton T, Bastian BC. CNVkit: Genome‐wide copy number detection and visualization from targeted DNA sequencing. PLoS Comput Biol 2016; 12: e1004873. [DOI] [PMC free article] [PubMed] [Google Scholar]
Associated Data
This section collects any data citations, data availability statements, or supplementary materials included in this article.
Supplementary Materials
Supplementary figure 1
Supplementary figure 2
Supplementary figure 3
Supplementary figure 4
Supplementary figure 5
Supplementary figure 6
Supplementary figure 7
Supplementary figure 8
Supplementary figure 9
Data Availability Statement
Data are available upon reasonable request.