Abstract
Analysis of biomarkers in geological materials such as shales is very crucial because they can provide useful information on the depositional conditions and environments, organic matter input, thermal maturity as well as the geological age of shales in some cases. The paleoenvironment, and its impact on organic matter enrichment of the shales, plays a vital role in the exploration and development of the resource. Paleoenvironmental reconstruction can be conducted using elemental, isotopic, maceral, and biomarker proxies. However, the literature on the biomarkers for paleoenvironment reconstruction to reveal the organic matter enrichment of shales in many petroleum systems throughout the world is still insufficient. Hence, this paper seeks to critically review the application of biomarkers during paleoenvironmental reconstruction in shales. The uses of biomarkers as indicators of modern and ancient marine and brackish/saline lacustrine depositional environments are considered. This review shows that biomarkers could be used to establish the sedimentary depositional environments, redox conditions, and organic matter enrichments of shales that are critical to deep energy exploitation. Nevertheless, despite the fact that biomarkers are significant indicators of depositional conditions, secondary processes such as source facies, thermal maturity, migration, and reservoir alteration can greatly influence their uses as paleoenvironmental condition indicators in source rocks and oils. Hence, for a reliable paleoenvironmental evaluation, there is a need to combine isotopic, elemental and maceral proxies with biomarkers.
This review shows that biomarkers could be used to establish the sedimentary depositional environments, redox conditions, and organic matter enrichments of shales that are critical to the deep energy exploitation.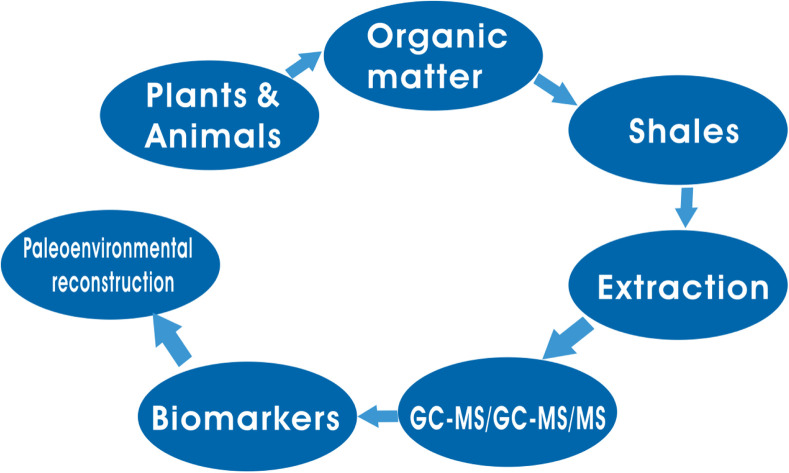
1. Introduction
Paleoenvironmental reconstruction has gained global attention of researchers because of its importance to conventional hydrocarbon resources and unconventional oil and gas exploration. Different depositional environments and conditions may have different assemblages of organisms, and thus contribute different biomarkers to the sediment. For instance, terrigenous, marine, deltaic, and hypersaline environments all show characteristic differences in biomarker compositions.1–3 The redox state of the environment in which shales were deposited can be inferred from the abundance and ratios of certain biomarkers in the shales.3 Biomarkers are complex molecular fossils that have been preserved in sediments from once-living organisms.1–3 A biomarker is a substance that maintains the structure of its biological precursor.1,3,4 The use of biomarkers to infer paleoflora, paleoenvironments, and the origin of life on Earth, as well as to provide a zonation for diagenetic change, has been reported.1,4–7 Early research has shown that the information contained in biomarker distribution can be successfully used for the differentiation and assessment of depositional environments,8–10 particularly for the characterization and distinction of ancient marine and non-marine petroleum source rocks,11,12 or even more detailed sub-environments, such as lacustrine freshwater and hypersaline, marine carbonate and deltaic sediments.12–16 The components of sediment extracts and oils are a reflection of both paleoenvironmental conditions and precursor compounds in the organisms that contributed organic matter (OM) at the time of sediment deposition, and thus can provide valuable information about the organic matter input and the prevailing depositional environment.8,9 The source facies can be distinguished by comparing structurally similar chemicals in sediments and crude oils with their likely biological precursors.8,9,17,18 The thermal history of the oil can be reconstructed by altering the biomarker structure.3,17,18 Some biomarkers are biochemical processes or environmental indicators. Triterpenoids and steroids were thoroughly investigated. During diagenesis, sterols are easily changed, whereas polycyclic terpenoids are more resistant19 Any organic structures that emerge in sediments before the oil is expelled from the source rock can be used for correlation, not just biological structures, for example, diamondoids were formed during catagenesis.20 As a result, biomarkers from oil provide valuable information on depositional paleoenvironments,21 maturity,22 and organic input, as well as, in some instances, the age of the source rocks.23,24 Numerous studies on paleoenvironments based on marine and lacustrine sediments have been conducted.25–32 Depositional conditions of the organic-rich source rocks have long been a main focus of research into the vast petroleum-prone source rock formation.32–35
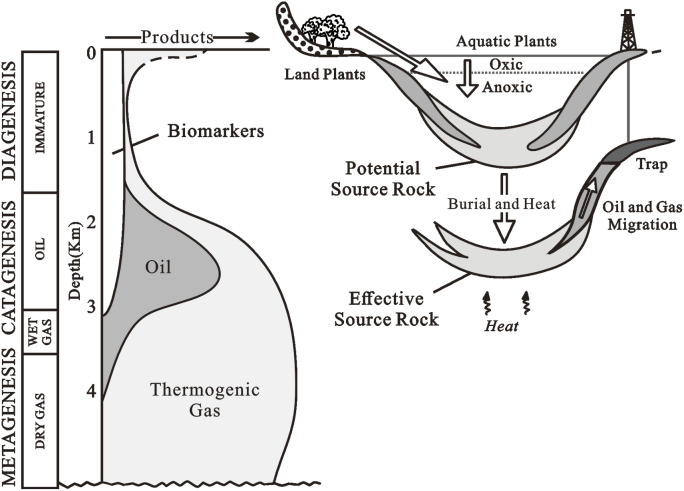
The essential structures of biomarkers are mainly preserved during sedimentation and diagenesis (Fig. 1).3,6 The term “diagenesis” refers to the biological, physical, and chemical changes that occur in organic matter in sediments before major heat (usually 50 °C)-induced alterations.1,3,4,6 Catagenesis is the thermal alteration of organic materials in rocks caused by burial and heating at temperatures between 50 and 150 °C under typical burial settings over millions of years.1,3,4,6 Biomarkers undergo structural changes during catagenesis that can be used to determine the degree of heating of their source rocks or the amount of oil expelled from these rocks.3,6,36,37 Furthermore, because biomarkers indicate a distinct group of contributing organisms, their distribution in an effective source rock serves as a fingerprint that can be utilized to link the rock to the expelled crude oil that may have traveled hundreds of kilometers.3,6,36,37 Before greenschist metamorphism, organic molecules are broken to gas at temperatures between 150 and 200 °C, a process known as metagenesis. Because of their volatility, biomarkers lose a significant amount of concentration or are eliminated in these settings through several paths: (1) cracking of very mature particulate organic matter, (2) breakdown of residual oil in petroleum source rocks, and (3) secondary cracking of oil in reservoir rocks can all result in deep hydrocarbon gas accumulations.5,7,38 In the oil–oil, and oil–source rock correlation studies, biomarkers are commonly utilized.36,37n-Alkane indices, in combination with sterane and aromatic ratios, can help distinguish between terrestrial and marine organic matter inputs; the ratio of hopanes to steranes can help distinguish prokaryotic versus eukaryotic input; and various saturated and aromatic hydrocarbon ratios can help suggest thermal maturity, lithology, and depositional environments.19
Fig. 1. Generalized evolution of organic matter after deposition. Many biomarkers transform to other structures during late diagenesis and much of catagenesis before their destruction during late catagenesis and metagenesis (left).3.
Shale is defined as a fine-grained sedimentary rock that exhibits fissility and a more general classification of mudstone.39 Organic-rich shale refers to the shale with elevated total organic carbon contents (generally TOC >2.0% (ref. 40)), which commonly acts as important petroleum sources, reservoirs for shale oil and gas, and seals in conventional reservoirs.41–46 Organic-rich shales are widespread in salinized lacustrine basins throughout China, such as the Middle Permian Lucaogou Formation in Junggar and Santanghu basins in northwest China,47,48 the Upper Jurassic Yanchang Formation in Ordos Basin in central China,49 the Upper Cretaceous Qingshankou and Nenjiang formations in Songliao Basin in northeast China,50 and the Eocene Shahejie Formation in Bohai Bay Basin in east China.43,51 These salinized lacustrine organic-rich shale (SLORS) have been proven as crucial source rocks for conventional oil, as well as sources and reservoirs for unconventional oil.52 The abundance of organic carbon and heteroatoms in shale layers, which are deposited in source rocks in the form of organic matter, leads to the generation of hydrocarbon through thermal maturation. The solid-state organic compound (known as kerogen) of these atoms breaks down and undergoes a significant structural and compositional transformation during thermal maturation.53,54
To date, however, while there are many studies reported on the paleoenvironmental reconstruction in shales using elemental, maceral, and isotopic proxies, the literature on the biomarkers for paleoenvironment reconstruction to reveal the organic enrichment of shales in many petroleum systems throughout the world is still insufficient. Thus, the aim of this paper is to critically review the significance of biomarkers during paleoenvironmental reconstruction in shales.
2. Lacustrine versus marine environments
Lake and ocean environments differ in many ways, resulting in different quantities and qualities of OM in their sediments.3,6,55–58 Due to the smaller size and shallower depth, lakes generally receive a more turbulent influx. Similarly, compared to the deep oceans, land-derived nutrients are more abundant in lakes, boosting primary production.3,6,55–58 Lake sedimentation rates (∼1 m/1000 years) frequently exceed those in seas and oceans (∼1–10 cm/1000 years), therefore OM gets buried more quickly, aiding preservation.3,6,55–58 Because they receive huge amounts of terrigenous OM and deposited quite quickly (10–100 cm/1000 years), coastal marine sediments are more similar to lake sediments.3,6,55–58 Lacustrine sediments typically contain tens of percent TOC, whereas deep ocean sediments contain only a few tenths. Lacustrine benthic creature diversity is lower, and their bioturbation depth is lower than that of marine fauna.58 In seawater, dissolved sulfate is a major ion, whereas it is usually low or absent in lakes.59 As a result, sulfate reduction is significant in the microbial reworking of marine OM, but not in the reworking of lacustrine OM. Carroll and Bohacs (2001) suggested a three-fold lithofacies categorization for lacustrine petroleum source rocks that accounts for the most relevant characteristics.58 These lithofacies correspond to their algal-terrestrial, algal, and hypersaline algal organic facies, and comprise the fluvial-lacustrine, fluctuating pro-fundal, and evaporative lithofacies. All three lacustrine facies are found in the Eocene Green River Formation in Wyoming and the Upper Permian non-marine facies of the southern Junggar Basin in China.3,6
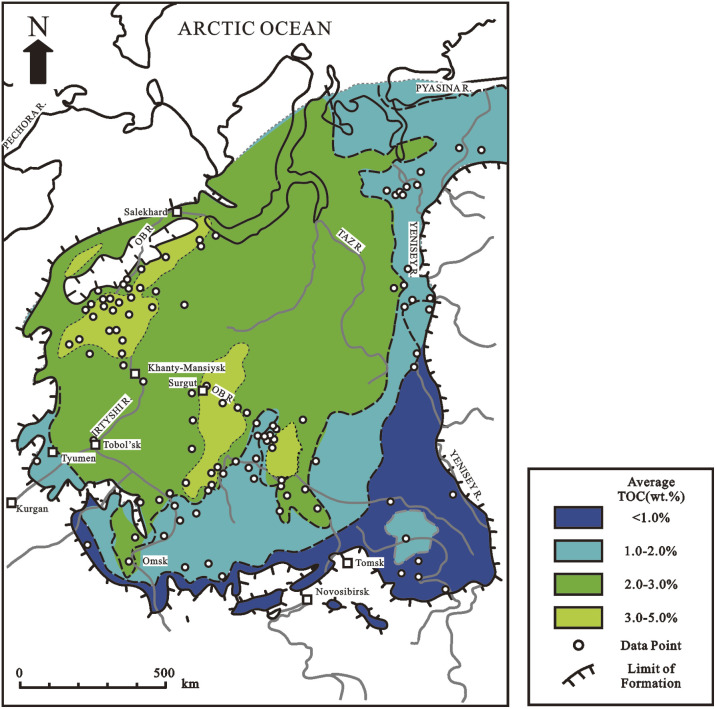
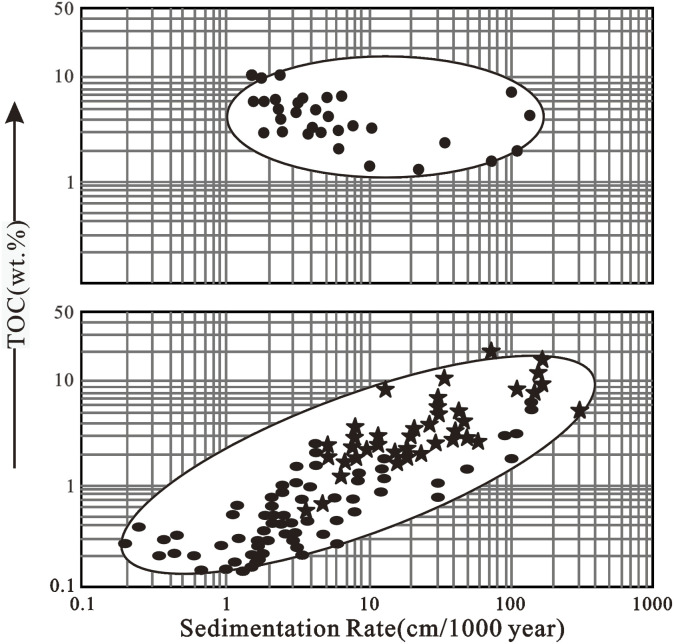
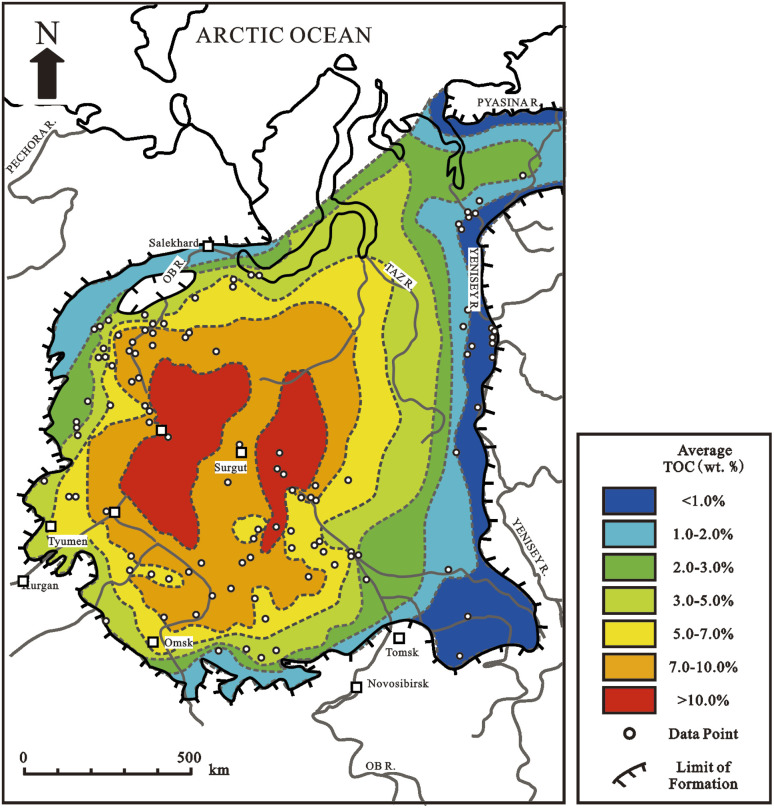
OM has a varied pattern of increasing concentration further from the source of the organic matter at the margin of the basin toward deep water in deltaic or paralic environments dominated by terrigenous detritus.59 The Mississippi and Mahakam deltas are typically modern examples, whereas the Miocene Mahakam Delta and the Lower-Middle Jurassic in West Siberia are typically ancient examples (Fig. 2). Although most deltaic environments are very oxic, OM can also be preserved if it is buried quickly, successfully protecting it from metazoan attack (Fig. 3).
Fig. 2. Map of total organic carbon (TOC) distribution for Lower-Middle Jurassic shales, including the Middle Jurassic Tyumen Formation in West Siberia.60.
Fig. 3. Schematic comparison of sedimentation rate versus total organic carbon in sediments.66–69.
3. Oxic versus anoxic depositional condition
Biomarker compositions can be used to distinguish oils from various source rocks, but they can also be used to show regional differences in organic facies within the same source rock or between oils from the same source rock.61 Because biomarker patterns in oils are inherited from their source rocks, these uses are possible. Within the same source rock, lateral and vertical variations of organic facies emerge from differences in the type of organic matter and the characteristics of the depositional environment. An organic facies is a mappable subdivision of a stratigraphic unit defined by its organic components.62–65 Understanding the paleo-oceanographic influences on petroleum source rock deposition can help with regional mapping of organic facies and predicting promising regions for future development.62,64,65 Under certain atmospheric circumstances, aerobic microorganisms rapidly oxidize organic materials from dead plants or animals. Aqueous sedimentation of organic matter can occur under a variety of redox circumstances, with the availability of molecular oxygen being the most important factor. The terms in Table 1 can be used to characterize the various redox conditions and their corresponding microbial biofacies (determined by metabolism).
Common terminology describing the redox conditions in sedimentary environments and the metabolism of the corresponding microbial populations (biofacies)3,64.
3.1. Oxic condition
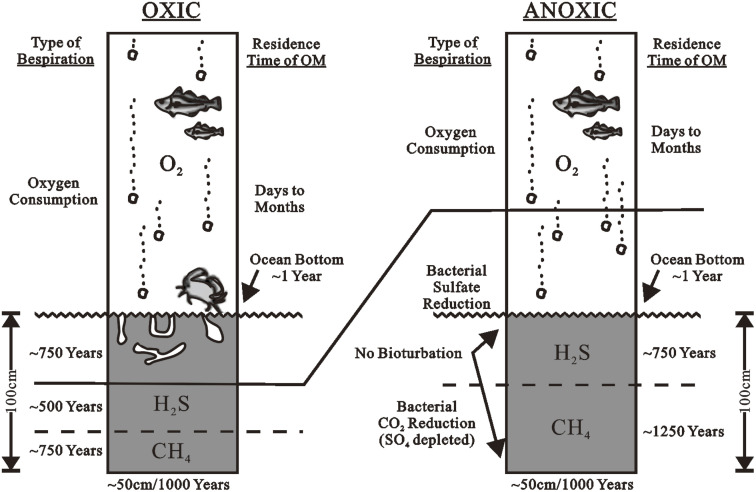
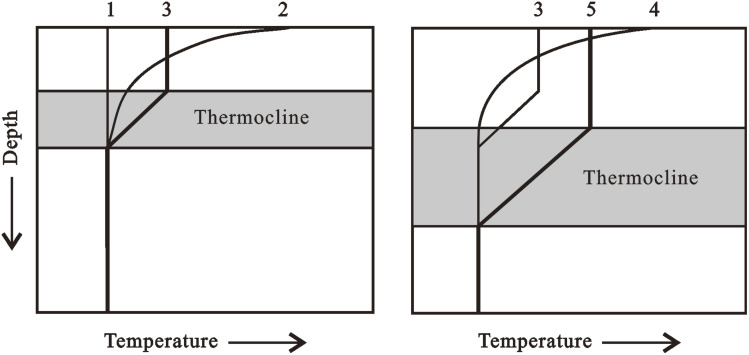
Aerobic bacteria and other organisms decompose organic materials settling from the photic zone in an oxic deposition (Fig. 4). There are 6–8 ml of oxygen per liter in normal seawater. Biological oxygen demand (BOD) is created by respiratory processes. If enough organic matter remains after all available oxygen has been used up, anaerobic organisms continue to oxidize it with other oxidants like nitrate or sulfate. In the water column or the bottom sediments, the boundary between aerobic and anaerobic metabolism (oxic versus anoxic environments) can occur. Metazoa, such as multicellular burrowing organisms like clams and worms, typically bioturbated benthic sediments that contain interstitial oxygen. Massive textures without lamination characterize oxic deposits preserved in the geologic record. Because of the combined effects of BOD and restricted replenishment by oxygenated water, lakes and oceanic basins can become oxygen-depleted (stagnant). Basin shape, water temperature, and salinity gradients are all elements that influence water recharge. For example, a thermocline is a layer of water in which the temperature decreases with depth more than the underlying and above water (Fig. 5). When the air temperature is high and the shallow water gets more heat than it loses through radiation and convection, thermoclines can form in lakes and the ocean. When the surface water heats, a small negative temperature gradient occurs. Although wind mixing of the surface waters lowers the surface temperature, the overall impact is downward heat transmission and the establishment of an isothermal layer warmer than the underlying water. As a result, a strong thermocline forms between the isothermal surface layer and the cooler water beneath it. Warm surface waters in the oceans usually extend to a depth of 150–300 m. The thickness of the underlying thermocline ranges from 300 to 900 m. Below the thermocline, the temperature drops more slowly and reaches 1–4 °C towards the bottom of the ocean.
Fig. 4. The O2–H2S–CH4 level in oxic (left) and anoxic (right) depositional environments generally result in poor and good preservation of deposited organic matter, respectively.71.
Fig. 5. Schematic showing the formation of a thermocline in watermass. If air temperature rises above water temperature for water having constant temperature versus depth (1), then the surface water begins to warm (2). Mixing of surface waters by wind lowers surface temperature, resulting in the formation of an isothermal layer having a higher temperature than the thermocline and deeper water (3, left). Further warming (4) and mixing of the surface water result in net downward transport of heat and a deeper, and commonly thicker, thermocline (5).3.
Because of the humid atmosphere and lack of major seasonal temperature variations, equatorial lakes, such as Lake Tanganyika in the East African rift-lake system, are particularly prone to severe thermoclines.71 Due to the thermocline, oxygen lost from deep water due to BOD is not rapidly replaced by mixing with shallower water, and anoxia develops. Anoxic conditions exist below 150 meters in Lake Tanganyika, which is 1500 meters deep. The Eocene Green River Formation in Colorado and Utah have laminated, organic-rich marlstones that were deposited in a vast anoxic lake. Non-marine Lower Cretaceous source rocks from China (Songliao Basin), Brazil (Lagoa Feia Formation), and West Africa (Bucomazi Formation) are also instances.
A halocline or density-stratified water column can form when fresh water is pumped into a silled marine basin with limited evaporation, especially when deep saline water is separated from open ocean water by the sill. The Black Sea is primarily a sluggish marine basin. Excess fresh water from riverine input pours into the Mediterranean Sea through a 27 m deep sill at the Bosphorus. The upshot of this positive water balance is low-salinity surface water relative to the Black Sea's deeper, more saline water and a permanent halocline at depth. The halocline is a chemocline that distinguishes between oxic and anoxic conditions. At 80–100 m depth, the current chemocline is found within the photic zone, where hydrogen sulfide first develops and oxygen vanishes. Isorenieratene and related compounds found in Black Sea sediments suggest that photosynthetic green sulfur bacteria (Chlorobiaceae) have been active in the Black Sea for at least 6000 years and that anaerobic water penetration of the photic zone is not a recent phenomenon.69 The Upper Jurassic of West Siberia (Bazhenov Formation) and the North Sea (Kimmeridge hot shales), as well as the latest Albian in North America, are examples of anoxic marine source rocks deposited under similar conditions (Mowry Shale).
3.2. Anoxic conditions
OM and fine-grained sediments get concentrated in concentric or bull's-eye patterns in deep quiet water near source-rock depocenters in anoxic marine silled basins and anoxic lakes where sediment thickness is the greatest.72 The Black Sea and the Caspian Sea are modern instances of this concentric distribution of organic carbon, while the Upper Jurassic in West Siberia (Fig. 6), the lower Jurassic of the northern North Sea, and the lower Toarcian and Hettangian/Sinemurian of the Paris Basin are ancient examples. Anoxic conditions range from less than ∼1 wt% total organic carbon to more than 20 wt% total organic carbon (TOC). Turbidity currents and related gravity flows may muddle the aforementioned concentric distributions by transporting organic matter or sediments into deep water via pathways that aren't predicted by basic depositional models.
Fig. 6. Map of total organic carbon (TOC) distribution for marine shales of the Upper Jurassic Bazhenov Formation in West Siberia, deposited in a large anoxic silled basin.85.
The implications of oxic vs. anoxic deposition on the quantity rather than the quality of preserved OM were examined by Pedersen and Calvert.72 Anoxic conditions appear to enhance the preservation of hydrogen-rich, oil-prone organic materials. Peters and Simoneit (1982),73 for example, found identical TOC content in alternating layered (anoxic) and homogeneous (oxic) diatomaceous oozes in the Gulf of California, similar to.74 Higher Rock-Eval pyrolysis hydrogen indices and lower oxygen indices imply that the laminated zones in these sediments contain more hydrogen-rich organic matter than the homogeneous zones. If anoxia is unimportant in the preservation of OM, it is difficult to explain the widespread correlation between oil-prone, organic-rich petroleum source rocks and faunal or sedimentologic traits indicating anoxia, according to.75 The majority of source rocks are laminated and lack signs of active infauna. Biomarkers and supporting parameters in petroleum source rock extracts indicate anoxic conditions (e.g., high vanadium/nickel porphyrin, low pristane/phytane, and high C35 homohopane indices).3
Because both metazoa (multicellular aerobic organisms) and aerobic bacteria demand higher amounts of oxygen, aerobic breakdown of organic matter is significantly limited in anoxic or suboxic water (less than ∼0.2 ml oxygen/l water) (Fig. 4, right). Bioturbation of benthic sediments does not occur below ∼0.1 ml of oxygen/l water due to the absence of metazoa, leaving only anaerobic bacteria and probably some benthic foraminifera to rework the organic matter. Interstitial oxygen, nitrate, Mn4+ oxides, Fe3+ oxides, and sulfate are the oxidants employed by benthic organisms in general.76,77 Because sulfate is abundant in seawater (0.028 M), sulfate reduction is usually the major mode of respiration after the advent of anaerobic conditions in marine settings.78 The absence of bioturbation allows the formation of tiny laminations that record depositional cycles, as seen in effective petroleum source rocks. Glacial varves in fjords, for example, reflect yearly depositional cycles that often comprise a thin layer of dark-colored organic-rich clay grading upward from a layer of light-colored sand or silt. Laminated sediments at British Columbia's Saanich Inlet, a silted, fjord-like area, contain up to 9% organic matter.79 Free hydrogen sulfide (H2S) generated by sulfate-reducing bacteria is accumulated in euxinic sediments under marine, anoxic conditions.80
During sediment deposition, traces of animal activity provide information about water chemistry.81 For example, few ichnofossils (trace fossils) other than very shallow Helminthoides burrows consisting of short, monospecific horizontal mining and grazing traces can be found in Lower to Middle Triassic mudrocks from the Barents Sea.75 Due to the lack of evidence for burrowing, these mudrocks were deposited in dysoxic to anoxic conditions, resulting in better OM preservation, high TOC, and high algal/amorphous OM. In marine sediments, Savrda (1995) summarized connections between oxicity and burrow type or density.81 However, systematic correlations between redox conditions and bioturbation in lacustrine sediments are poorly established.82 Anaerobic degradation of organic materials is less effective thermodynamically than aerobic degradation.83 This finding backs up the widely held assumption that anoxia is to blame for the increased preservation of hydrogen- and lipid-rich organic materials in petroleum source rocks.55 Even when organic productivity is high, and oxic conditions present, organic matter is generally lost by sedimentation and diagenesis. Most polar locations in current oceans, for example, have high primary productivity, but low organic carbon in the oxic bottom sediments. Organic productivity, rather than anoxia, is the fundamental restriction on the buildup of organic-rich marine sediments, according to.60,73 They cited sources that suggested that the rates of the breakdown of organic matter under oxic and anoxic circumstances are equal and cannot be used to imply increased retention of OM under anoxic conditions, based mostly on laboratory incubation tests. They found no increase in carbon content in alternating anoxic and oxic sediments in the central Gulf of California.74 In comparison to analogous, oxygenated environments, data from anoxic sediments in the Black Sea reveal that organic carbon accumulation rates are not especially high.84 The distribution of current organic-rich sediments around the planet does not appear to be correlated with high productivity in the underlying water column.55 Because of the significant circulation of cold, oxygen-rich waters that successfully satisfy all BOD imposed by settling the organic matter, surface waters near Antarctica, for example, display great productivity, but the underlying sediments are organic-lean. Modern organic-rich sediments are found in areas with high productivity and anoxia at the bottom of the water column.3
4. Methods of biomarker analyses
The analytical methods applied in the analyses of biomarkers and characterizations are reported below.
4.1. Extraction
The shale samples are usually crushed with agate mortar and powdered to less than 100 mesh size before extraction. About 50 g powdered samples (although this generally depends on the extractable organic matter (EOM) contents in shale) are Soxhlet extracted with an azeotropic mixture of dichloromethane : methanol (93 : 7, v/v) for 72 h. To eliminate elemental sulfur from the extracts, activated copper powder is widely used. The excess solvent is then distilled out with a rotary evaporator to a 3 ml aliquot volume. After transferring the aliquot into a clean, weighed vial with a micropipette, the remaining solvent is removed under nitrogen gas flow at a temperature below 50 °C.86 Alternatively, microwave-assisted extraction (MAE) can be applied using hexane/acetone (1 : 1). Other solvents that can be used for the MAE include tetrachloroethylene, methylene chloride/acetone (1 : l), toluene/methanol (l0 : l), methylene chloride, and toluene/methanol (1 : 10). Soxtec extraction can also be employed using hexane/acetone (l : l), and that for ultra-sonic extraction, methylene chloride/acetone (9 : 1) is used.87
4.2. Column chromatography
To fractionate extracts, column chromatography (some automatic instruments are also used to separate the EOM into SARA) with silica gel/alumina as the stationary phase is commonly utilized. A standard glass column measures 50 cm in length and has a 0.5 cm internal diameter. DCM and light petroleum spirits are used to rinse the column twice (petroleum ether). The column is then rinsed with n-hexane and plugged with a cotton wool to serve as a resting pad for the stationary phase, which is silica gel (SiO2). The stationary phase (SiO2) is then added. Two (2 g) of alumina (Al2O3) is used to stabilize the surface. The saturated, aromatic hydrocarbon and polar fractions are eluted using 70 ml of n-hexane, 70 ml of dichloromethane/n-hexane (2 : 1, v/v), and 70 ml of dichloromethane/methanol (1 : 1, v/v). Each fraction is recovered by carefully evaporating solvents on a rotary evaporator, followed by the removal of the remaining solvent under the influence of a nitrogen gas stream.87 Gas chromatography (GC), gas chromatography-mass spectrometry (GC-MS), and gas chromatography coupled to tandem mass spectrometry (GC/MS/MS) can now be used to analyze the recovered saturated hydrocarbon, aromatic hydrocarbon, and polar fractions.88
4.3. Gas chromatography (GC)
The aliphatic fractions are commonly analyzed by capillary gas chromatography for the characterization of the n-alkanes, pristane, and phytane (GC). Typically, a Hewlett Packard 5890 Series II is used, which is equipped with a Gerstel on-column injector, an electronic pressure control (EPC), a fused silica capillary column (HP Ultra I) of 50 m length, 0.2 mm inner diameter, and 0.33 m film thickness, as well as a standard flame ionization detector (FID). At a flow rate of 1 ml min−1, hydrogen is widely utilized as a carrier gas (pressure controlled). The oven temperature is commonly programmed from 90 °C (hold time 5 min) to 310 °C at a rate of 4 °C min−1 (for some unusual biomarkers, some special temperature programs are also used). A Multichrom 2-online data system (Fisons) is commonly used to store and process retention times and peak areas.
4.4. Gas chromatography-mass spectrometry (GC-MS)
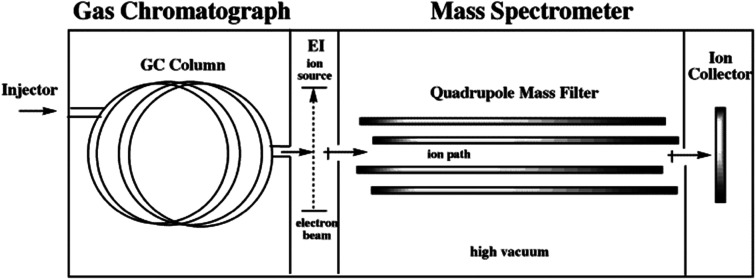
Gas chromatography-mass spectrometry (GC-MS) (Fig. 7) analyses are exceedingly sensitive, allowing for the analysis of very small amounts of material. The combination of MS and GC for detection offers a unique capability for identifying unknown substances or confirming the presence of target molecules in complex mixtures.89–92 GC-MS is a widely used analytical technique for a variety of purposes, including the analysis of geological samples, pharmaceuticals, pesticides, environmental pollutants, xenobiotics, and toxins.93–95 During the separation and detection of substances, GC-MS instrumentation necessitates the utilization of increased temperatures in the injector, column, detector, and transfer line to the MS.89–92 The injector temperature must be higher than the boiling point of the primary substance in the mixture to be examined. The standard capillary columns employed in these analyses have a column length of 15 to 30 m. The flow rate of the mobile phase (gas) is modest, around 1 ml min−1 or less. The current GC-MS technique has a significant restriction in that it can only analyze a limited number of volatile, thermally stable compounds. The individual biomarkers are commonly identified based on comparison of elution sequences, relative retention times, and mass spectra with the NIST Chemistry WebBook (https://webbook.nist.gov/chemistry/) and those previously reported.96–98
Fig. 7. Schematic diagram of GC-MS.
4.5. Gas chromatography-mass spectrometry-mass spectrometry (GC-MS-MS)
Gas chromatography tandem mass spectrometry (GC/MS/MS) is a more powerful analytical technique. The most common application of GC/MS/MS is for trace quantitative analysis in complex matrices, such as geological samples.99,100 The system's ability to choose against the matrix (lower chemical noise) is an important performance component to consider. The signal-to-noise ratio (S/N) can be used to demonstrate this.99,100 Furthermore, an S/N ratio ensures that instruments are not contaminated during installation, while low-level precision and instrument detection limits (IDL) provide the full image.99,100 The physical and chemical properties of analytes of interest, as well as their interaction with the analytical column's stationary phase, are used to separate samples in a gaseous form for GC-MS/MS analysis. The analytes enter the tandem mass spectrometer (MS/MS) after departing the analytical column, which is made up of two scanning mass analyzers separated by a collision cell.99,100 In the collision cell, fragments picked in the first analyzer react with inert gas, resulting in additional fragmentation. These daughter product ions are then resolved and analyzed in the third quadrupole. Liquids, gases, and solids can all be analyzed using GC-MS/MS. The sample is directly introduced into the GC for liquids. Gaseous components are transferred directly into the GC using gastight syringes. Solvent extraction, outgassing, or pyrolysis analysis are all options for solids analysis. Following that, the analytes of interest are measured by comparing them to external or internal standards. GC-MS/MS is highly suited for the detection of unknown volatile components using mass fragmentation patterns and mass transitions associated with the unknown analyte, in addition to quantification.
4.6. Comprehensive two-dimensional gas chromatography time-of-flight mass spectrometry (GC × GC-TOFMS)
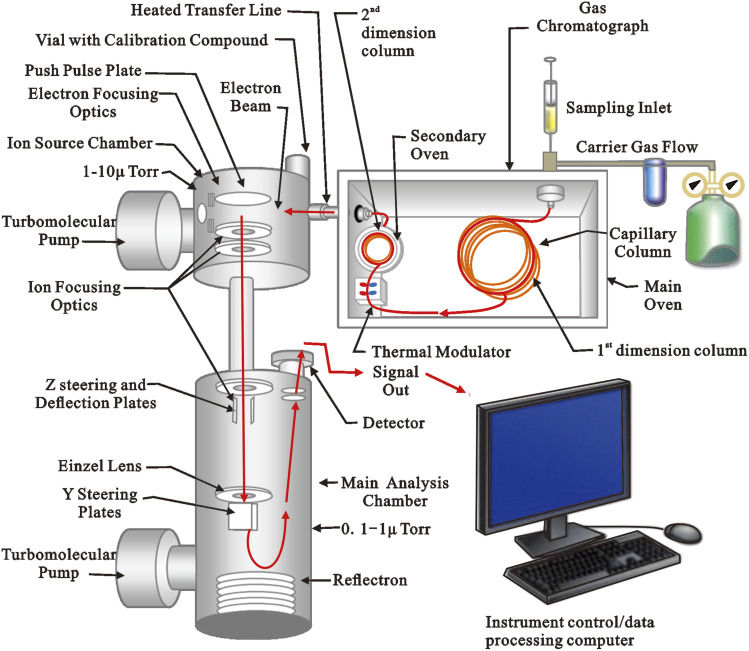
Comprehensive two-dimensional gas chromatography (GC × GC) has shown remarkable potential for the investigation of complex mixtures since its inception in the 1990s.101–103 Furthermore, considering the importance of biomarkers in geochemical and environmental studies, a precise and complete investigation of their composition in oils and source rocks is required. Capillary gas chromatography (GC), which is frequently hyphenated with mass spectrometry (MS),90–93 and tandem MS (MS-MS) are the most popular techniques used to study biomarkers.99,100 Although the abilities of these techniques are well established, there are certain limitations. The fundamental constraints of both GC-MS and GC-MS-MS are the extremely complex mixture of crude oils and shales, as well as the poor resolution of GC. Oil mixtures are not properly clarified, despite the better separation capabilities of multiple reaction monitoring (MRM) or MS-MS techniques. Comprehensive two-dimensional gas chromatography (GC × GC) is one of the most powerful analytical methods for separating complex mixtures with great resolution. The GC × GC is great for separating complex matrices and identifying isomers and other molecules with similar chemical structures. In bidimensional space, different well-ordered chemical groups can be recognized, providing extra information on the molecular composition. For retrieving biomarker structural information encoded in complex petroleum samples, detection using a time of flight mass spectrometry (TOFMS) device is required after the GC × GC separations. Because mass spectra are available for chemical identification and structure elucidation, the TOFMS can be regarded as a third analytical dimension. The non-scanning capabilities of TOF technology, as well as its rapid acquisition rate, are two of its most important advantages. On the one hand, the non-scanning capability is the most significant advantage over scanning MS instruments (quadrupole, ion trap), which produce non-skewed peaks. The entire chromatogram is obtained with non-distorted mass spectra, allowing for rapid spectral deconvolution and a reliable comparison with commercially available MS libraries. Rapid acquisition, on the other hand, is required for accurately reconstructing the narrow peaks generated during GC × GC separation modulation. To enable chromatographic resolution, provide sufficient MS information per peak, and efficiently deconvolve the compounds that co-elute, a high acquisition frequency is required during the time unit. The GC × GC-TOFMS (Fig. 8) is ideal for analyzing complex samples, especially for identifying unusual compounds or potential biomarkers that are rarely detected in routine 1D GC or GC-MS analyses, due to its better chromatographic resolution, well ordered 2D structures, mass spectral information, and deconvolution. GC × GC-TOFMS has been used in a variety of applications during the last few decades, including oil analysis.93,104,105 Aguiar et al. (2010, 2011) used GC × GC to identify new compounds in crude oils and to evaluate Brazilian petroleum systems.106,107 Ventura et al. (2010) investigated reservoir compartmentalization using GC × GC fingerprinting of several oils.103 The same group compared the compositions of different oils a year later using multiway principal components analysis (MPCA) on data from GC × GC studies.94 Silva et al. (2011) offered a detailed biomarker examination of Colombian oils,106 while Eiserbeck et al. (2011) accurately measured significant biomarkers using baseline separation in a GC × GC analysis.94 Oliveira et al. (2012) used GC × GC to explore branched-cyclic hydrocarbon heterogeneity in crude oil samples from two basins and to describe aromatic steroids and hopanoids from marine and lacustrine crude oils.36,37 Eiserbeck et al. (2012) compared the differences and advantages of various chromatographic separation and detection techniques, such as GC-MS, GC × GC-FID, and GCGC-TOFMS, for biomarker identification.108 The resolution of GC × GC is superior to that of classic 1D GC approaches, according to their research. The GC × GC-TOFMS technique produces a high-resolution separation and complete mass spectra across the whole chromatogram. Silva et al. (2013) and Soares et al. (2013) used GC × GC-TOFMS to examine information on oil maturity and biodegradation.109,110 Many saturated and aromatic biomarkers in extra heavy gas oil were successfully.100,111 Recently, Kiepper et al. (2014) used GC × GC-TOFMS to characterize the biomarkers in the crude oils from the Cumuruxatiba and Espírito Santo basins, Brazil.112
Fig. 8. Schematic diagram of GC × GC-TOFMS-instrument.
5. Biomarkers for paleoenvironmental reconstructions
Biomarker distributions in the OM have been widely utilized to describe the paleoenvironmental conditions.3,6,95,113–120 Diverse depositional environments may have different assemblages of organisms, resulting in different biomarkers being contributed to the sediment. For example, biomarker compositions differ significantly in terrigenous, marine, deltaic, and hypersaline environments.3 Details of biomarkers for paleoenvironments based on n-alkanes, isoprenoids, terpanes, and sterane, as well as some aromatic biomarkers, will be discussed in the following sections.
5.1. Saturated compounds
5.1.1. Normal and branched alkanes
Coal, sediments, and petroleum all contain n-alkanes (m/z 85).121 They provide information about the biological sources of OM.6,121 Due to their biosynthesis from fatty acids by enzymatic decarboxylation, organism usually have odd numbers of C-atoms.121 Waxes of higher plants are responsible for n-alkanes in the C27 to C31 range, which show a distinct odd over even predominance (OEP).122 Short-chain n-alkanes (C15 to C19) with an OEP are thought to originate from algae (marine environment),2 implying that aquatic OM has a large role in deposition.3,114,115 Ratios can be used to express the influence of various contributors on the distribution of n-alkanes. For example, the ATRHC (aquatic/terrigenous ratio of hydrocarbons, Wilkes et al. (1999)) is a parameter used to determine the amounts of aquatic to terrigenous derived n-alkanes, or short-chain to long-chain n-alkanes:123
 |
1 |
Long-chain n-alkanes, or organic matter derived from terrigenous OM, contribute significantly to values of 0.5. The ratio depends on the maturity of the samples and is only distinctive for immature organic matter. Samples of low maturity normally show the biogenic distribution of n-alkanes. With increasing organic matter maturity, the predominance of odd-numbered n-alkanes over even-numbered n-alkanes becomes less pronounced. Due to thermal cracking, an increase of short-chain n-alkanes can be observed, leading to equal proportions of odd and even-numbered n-alkanes.121 In estimating the thermal maturity of fossil fuels, the ratio of odd/even carbon-numbered n-alkanes has been used.2,124 These ratios are expressed as the carbon preference index, CPI125 or enhanced odd-to-even predominance, OEP.124 The CPI and OEP values less or greater than 1.0 indicate low thermal maturity while values around 1.0 suggest, but do not prove, that an oil or rock extract is thermally mature. The CPI or OEP values below 1.0 are unusual and typify low maturity oils or bitumen from carbonate or hypersaline environments.3,126 These ratios are affected by organic matter type and therefore are mostly applied with caution.
 |
2 |
5.1.2. Acyclic isoprenoids
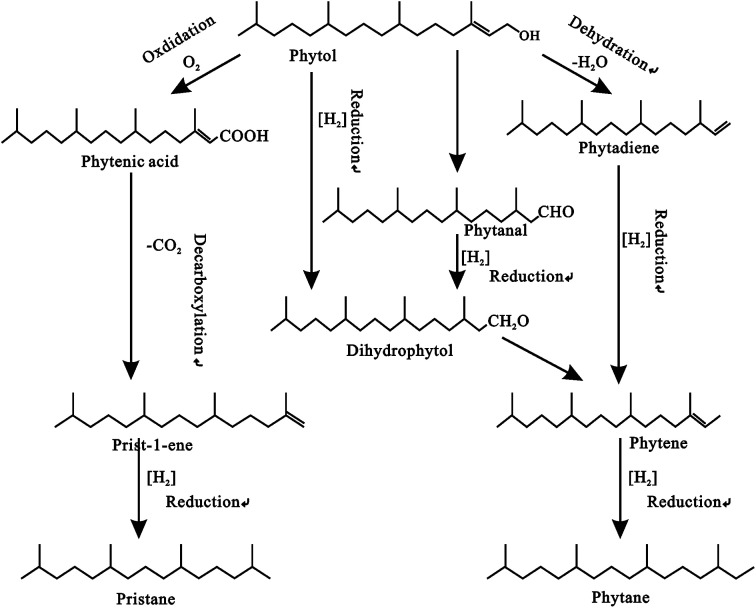
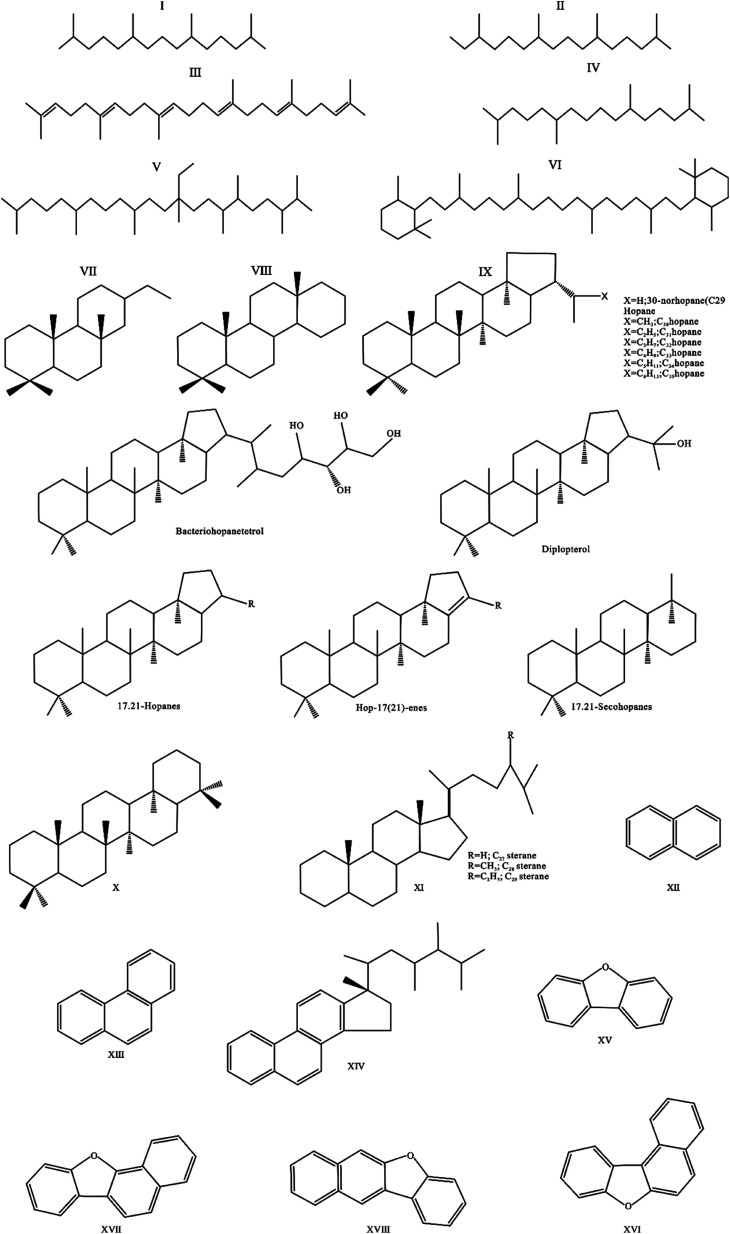
These compounds have been found in all types of geologic samples.127 They are known constituents of plants, animal tissues, and bacterial cell walls. The presence of acyclic isoprenoids in the biosphere is due to the phytol side chain of chlorophyll-a. They are composed of three types of linkages: head-to-tail (the most common, including compounds such as pristane (Pr), phytane (Ph), and homologs up to C45); tail-to-tail (squalane, perhydro-carotane, lycopane, and others); and head-to-head (C32–C40 typical of thermophilic and other archaebacteria). The phytol side chain of chlorophyll-a gives rise to Pr (2, 6, 10, 14-tetramethylpentadecane) (I) and Ph (2,6,10,14-tetramethylhexadecane) (II) (Fig. 9). The most abundant isoprenoids in the aliphatic hydrocarbon fraction are pristane and phytane.6,128 Phytane is the product of the dehydration and reduction of phytol, whereas pristane is derived from the oxidation and decarboxylation of phytol (Fig. 8). These isoprenoids are possible indicators of redox conditions during sedimentation and diagenesis because they represent the palaeoenvironmental conditions of source rocks.129–131 The pristane/phytane (Pr/Ph) ratio is a widely used geochemical parameter that has been utilized as a depositional environment indicator, but, it has low specificity due to thermal maturity interferences and preliminary assessment of OM inputs.3 It's also a common indicator of the redox conditions of the depositional environments. According to Ten Haven,132 high Pr/Ph (>3.0) indicates terrigenous input under oxic conditions, while low Pr/Ph (0.8) indicates anoxic, hypersaline, or carbonate environments. Low Pr/Ph levels (<2) suggest reducing conditions in aquatic depositional settings such as marine, fresh, and brackish water, whereas high values (up to 10) indicate oxidizing conditions in peat swamp depositional environments.133 Pr/Ph values are also influenced by maturity, and/or different precursors of pristane (tocopherols or chromas). Another important method for determining the source of organic matter is the Pr/n-C17 ratio. It is also widely used as an indicator of the redox potential of the depositional environment.
Fig. 9. Formation of pristane and phytane from phytol.140.
Squalane (III) has been proposed as a halophilic archaea indicator and hence a molecular diagnostic of hypersaline environment.134,135 Crocetane (IV) has been identified as a marker for methane-oxidizing archaea because it is depleted in 13C to a value as low as −100‰.136 Thiel et al. (2001) discovered that the n-C23 alkane, which is depleted in 13C (13C values less than −70), is an indicator of anaerobic methane oxidation.137 Methanogenic bacteria have been shown to contain isoprenoids such as penta- and tetramethylicosane.138 Archaea produce isoprenoids that are linked head-to-head.139
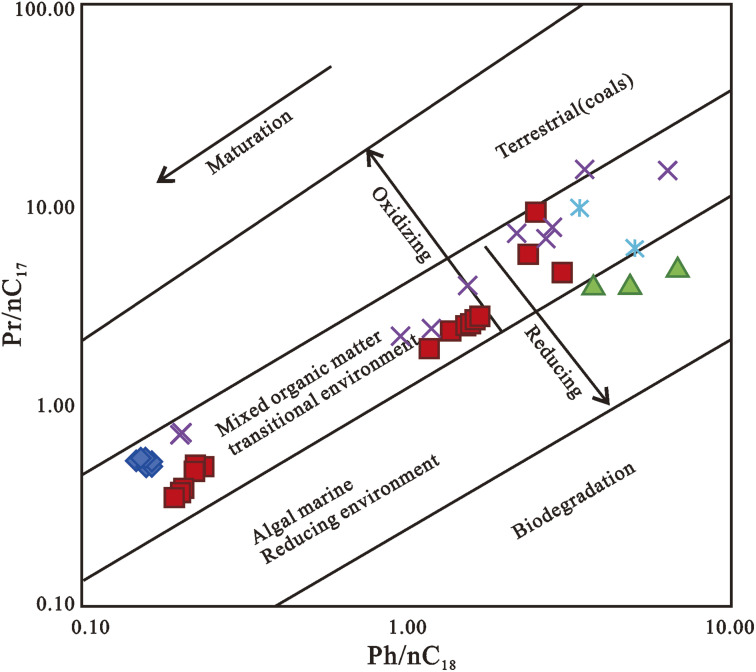
OM derived from terrestrial sources is assigned to values above 0.6, whereas organic material generated from marine sources is attributed to values below 0.5.6 The pristane/normal alkane (Pr/n-C17) and phytane/normal alkane (Ph/n-C18) ratios have also been employed to determine redox conditions during sediment deposition (Fig. 10).3,18,128,141 The Pr/n-C17 and Ph/n-C18 ratios are also influenced by maturity and biodegradation.141
Fig. 10. Plot of Pr/n-C17 against Ph/n-C18 ratios of oils from Niger Delta.18,141.
Botryococcane (V) is a branched hydrocarbon derived from botryococcene, an unsaturated hydrocarbon that has been linked to an organism that will only develop in a specific type of environment.141Botryococcus braunii, a fresh or brackish water alga, was shown to have botryococcane concentrations of 70 to 90 percent in its senescent phase. Moldowan and Seifert (1980) utilized the peculiar occurrence of this compound in Botryococcus braunii as evidence that certain oil deposits in Sumatra,142 Indonesia, were formed primarily from the prehistoric source material in a fresh or brackish lagoonal-type environment.134B. braunii can contribute both unsaturated hydrocarbons, which are potential precursors of botryococcanes, and long-chain n-alkanes to freshwater (lacustrine) sediments since it exists as two physiologically distinct clonal races.142 For the first time in an Australian crude oil, biomarkers found in coastal bitumens from the western Otway Basin confirmed the presence of substantial amounts of botryococcane.143 The waxy quality of the three main bitumen types found in the Otway Basin, as well as their botryococcane content, has been attributed to botryococcus blooms deposited in deep lakes under anoxic or micro-oxic circumstances.144
β-Carotane (VI), a saturated hydrocarbon generated from a pigment with a C40 carotenoid structure, was initially discovered in the Eocene Green River Shale of Colorado and has since been discovered in a variety of sedimentary rocks and crude oils. Although most carotenoids do not survive early diagenetic processes, β-carotane is well preserved in sediments and oils in many environments.145–150 β-Carotane is well known as a marker for saline and reducing lacustrine environments as well as extremely restricted marine environments.11,151,152 Carotenoids are the biological precursors of β-carotane and are produced by algae, cyanobacteria, and higher plants.11,48,151,153 β-Carotane is abundant in the eocene oils of the Bohai Bay Basin.154 The Eocene Shahejie (Es) formation, particularly the third (Es3) and fourth (Es4) members, is the principal source rock for both conventional and “shale oil-producing” formations in the Dongying depression, as several studies have shown.155–157 The levels of -carotane in the oils vary greatly between the Es3 and Es4 members. β-Carotane concentrations in the Es4 Member's oils ranged from 105 to 303 μg g−1 oil (averaged at 218 μg g−1 oil), whereas the Es3 Member's oils had a range of 73–145 μg g−1 oil. In a heavily biodegraded oil. The concentration of -carotane in a heavily biodegraded oil reached 1044 g g−1 oil. Wang et al. (2021) recently discovered β-carotane in a suite of lacustrine oils from the Dongying Depression, Bohai Bay Basin, Eastern China, and classified the oils into two groups based on β-carotane parameters.158 The ratios -carotane/C24 tetracyclic terpane, β-carotane/(C19 + C20) tricyclic terpanes, and β-carotane/(18(H)-22,29,30-trisnorneohopane+17(H)-22,29,30-trisnorhopane) have been proposed to be useful for distinguishing oils derived from different depositional environments.158,159
5.1.3. Tricyclic and tetracyclic terpanes
The tricyclic terpanes (TT) (VII), which are abundant in source rock extracts and crude oils, form a pseudo-homologous series with carbon atoms spanning from C19 to C54. Because the higher members of the family are frequently hidden by hopanes in the m/z 191 mass chromatogram, they are generally recognized up to C29 compounds.160 Because the formation of C22TT and C27TT requires the cleavage of two carbon–carbon bonds, their abundance is particularly low.3 According to Ourisson et al. (1982), the tricyclic terpenes may have been derived from bacterial cell membranes.161 Furthermore, Aquino et al. (1983) claimed that a high abundance of tricyclic terpanes in crude oils could be linked to a higher contribution of marine algae.162 The relationship between high tricyclic terpane concentrations and “tasmanite” oil shale suggests that it may have originated from Tasmanites algae.163–165 However, the fact that it may be found in sediments and oils of various ages suggests that there must be other sources.3 In marine-sourced oils, the C23TT is frequently prominent, whereas a higher amount of C19TT and C24 tetracyclic terpane (TeT) usually indicates the presence of terrigenous organic.13,162,166 The ratio of C26TT to C25TT can be utilized to distinguish between marine and lacustrine source rocks.3,167 The relative distribution of tricyclic terpanes in combination with C24TeT has been widely used as a molecular parameter to distinguish terrestrial versus marine organic matter input, correlate crude oils and source rock extracts, predict source rock characteristics, and decipher source rock lithology.3,13,167 However, Samuel et al. (2010) recommended against such use because tricyclic terpanes and C24TeT distribution patterns in most oils are extremely similar globally.168
Tetracyclic terpanes (VIII) are found in a series ranging from C24 to C27. The ratio of C24TeT over C26TT is a source parameter due to differences in likely precursors of tetracyclic and tricyclic terpanes.168–170 Most marine oils formed from mudstones to carbonate source rocks contained abundant C24TeT.171 C24–C27 tetracyclic terpanes are often referred to as de-E-hopanes, or 17,21-secohopanes and are suggested to be more resistant against biodegradation and maturity effects than hopanes.162
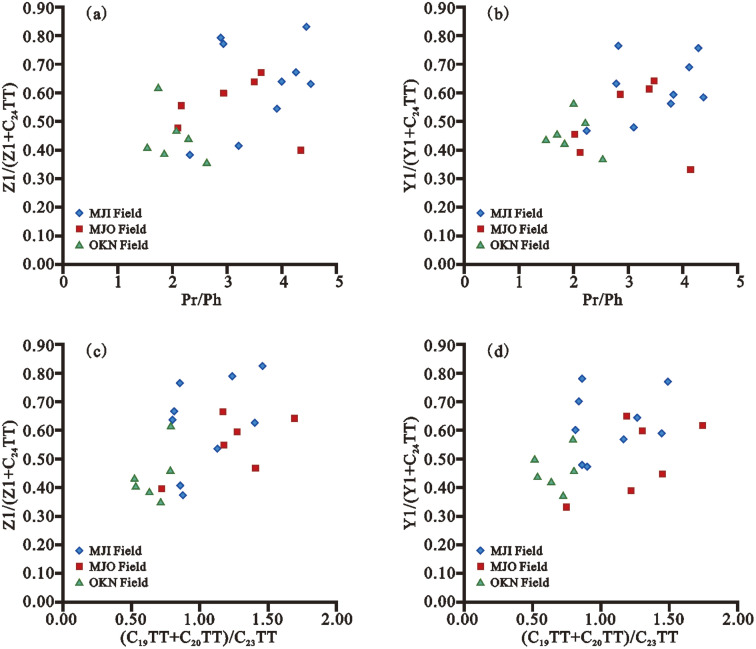
Unusual tri- and tetracyclic terpanes (C21 tricyclic terpanes, C25 tricyclic terpanes, C27 tetracyclic terpanes, C24-des-A-oleanane, C24-des-A-lupane, and C24-des-A-ursane) have recently been reported in crude oils and source rock extracts from the Pearl River Mouth Basin, the Beibuwan Basin, and the Liaohe Basin, China,169,172 and source rock extracts from Niger Delta Basin, Nigeria.17 According to Xiao et al. (2018), these uncommon compounds contain chemical structures that are comparable to oleanane, ursane, and lupane, and are thought to be derived from alcohols or ketone precursors found in higher plants.169 The higher abundance of these tri- and tetracyclic terpanes is likely due to the higher plant material input to the OM content of source rocks.169 Furthermore, the redox conditions and water depth in the depositional environment have a substantial impact on the distribution patterns of the compounds, and they may be easily generated under oxidizing conditions.169 Furthermore, Xiao et al. (2018) and Ogbesejana et al. (2020) found that the values of Pr/Ph in crude oils and source rock extracts from the Pearl River Mouth Basin, Beibuwan Basin, Liaohe Basin, China, and the Niger Delta Basin, Nigeria, were correlated with the values of Z1/(Z1 + C24TT) and Y1/(Y1 + C24TT). This means that Z1/(Z1 + C24TT), Y1/(Y1 + C24TT), and Pr/Ph are all constrained by the same depositional conditions, implying that these newly discovered tetracyclic terpanes were formed in both oxidative and reducing environments.169,170 The Z1/(Z1 + C24TT), Y1/(Y1 + C24TT), and (C19 + C20)TT/C23TT ratios are related to the Pr/Ph and (C19 + C20)TT/C23TT ratios, as shown in Fig. 11a–d.169,170 As a result, these compounds are derived from source rocks containing a mixture of higher plant and marine sources.169
Fig. 11. Cross plots of (a) Z1/(Z1 + C24TT) vs. Pr/Ph, (b) Y1/(Y1 + C24TT) vs. Pr/Ph, (c) Z1/(Z1 + C24TT) vs. (C19 + C20)TT/C23TT, and (d) Y1/(Y1 + C24TT) vs. (C19 + C20)TT/C23TT in source rock extracts from Offshore Niger Delta Basin, Nigeria.169,170.
A ternary diagram based on the relative abundance of C19–C23TTs (C19+20TT, C21TT, and C23TT) (Fig. 12) was successfully used to differentiate the depositional environments of source rocks and crude oils, and the study revealed that four distinct sedimentary environmental zones could be distinguished: marine/saline lacustrine, freshwater lacustrine, fluvial/deltaic, and swamp.170,173,174 Based on C19–C23 TT, Ogbesejana et al. (2020) found that rock samples from the Niger Delta Basin received a mixed input of marine and terrigenous organic matter and were deposited under oxic to sub-oxic conditions in lacustrine-fluvial/deltaic sedimentary conditions (Fig. 11).170
Fig. 12. Ternary plots of C19TT-C23TT (tricyclic terpanes) in source rocks from Offshore Niger Delta Basin, Nigeria.169,170.
5.1.4. Hopanes
Hopane (IX) is the name given to a class of aliphatic biomarkers that have a pentacyclic terpenoic structure with a five-membered E-ring. Sediments, hydrocarbons, and coals all contain hopanes in the C27 to C35 range.175 Biomarkers for bacteria and cyanobacteria are considered as hopanoids.176 Hopanoids are commonly isotopically light (δ13C values ranging from −50‰ to −60‰).177,178 They are derived from natural precursors such as C35-bacteriohopanetetrol (Appendix 1) and similar C30- or C35-bacteriohopanoids found in the cell membranes of a wide variety of bacteria.179,180 These compounds are the counterparts of sterols, which are found in eukaryotes.179,180 Hopanes and their biological precursors have been investigated extensively for decades, yet their diagenesis and catagenesis transition processes remain unknown.181,182 They are frequently used for both maturity and paleoenvironmental assessments.6 For example, high C35-/C31–35 hopane values (HHI = homohopane index) indicate significantly reduced marine environments.183 Bacteriohopanetetrol (Appendix 1) is oxidized to C32-hopanoic acid in non-reducing conditions. When the carboxylic group is removed, the fraction of C30- and C31-hopanes increases. The C31/C30 hopane ratio (also known as C31 22R/C30 hopane) is used to discriminate between marine and lacustrine source-rock depositional settings.3 Oils from marine shale, carbonate, and marl source rocks have a higher C31 22R homohopane/C30 hopane ratio (C31R/C30 > 0.25) than crude oils from lacustrine source rocks. C30 hopane, in combination with other parameters such as C30n-propylcholestane and C26/C25TT, and the canonical variable from stable carbon isotope analyses, is the best way to differentiate marine from lacustrine crude oils.3
In the lacustrine oil samples from the Esprito Santo and Cumuruxatiba basins in Brazil,114 3-methylhopanes and onoceranes were predominant, whereas the relative abundance of 2-methylhopane with an extended side chain was high, and onocerane levels were low only in the marine oil samples from the same basins.114 A new index based on methylhopanes was proposed. For oils with a lacustrine origin, the percentage of C31 3β-methylhopane (3MH31) relative to C30 hopane (H30), 100 × (3MH31/H30), was >1 while for oils with a marine origin, it was 1.114
5.1.5. Gammacerane
Green River Shale extracts were the first to contain gammacerane (X).184 The origin of gammacerane, which is widely applied as a salinity indicator, is unknown. The sole known potential biological precursor of gammacerane is tetrahymanoI, a pentacyclic triterpenoid found in protozoa and fungi.185 Dehydration of tetrahymanol to create gammacer-2-ene, followed by hydrogenation, is most likely the path of digenetic conversion of tetrahymanol to gammacerane. Sulfurization and subsequent cleavage of tetrahymanol can also produce gammacerane.186 Gammacerane is found in a wide range of samples from varied habitats, and its value as a biomarker for salinity is reliant on its relative abundance rather than actual presence.16 In marine and non-marine source-rock depositional systems, gammacerane indicates a stratified water column caused by hypersalinity at depth.186 In addition to β-carotane and related carotenoids, gammacerane is a prominent biomarker in various lacustrine oils and bitumens, particularly the Green River marl and oils from China.11,14,135,146,187,188 Certain marine crude oils derived from carbonate-evaporite source rocks are similarly high in gammacerane.11,16,187,189,190 Gammacerane can be used to distinguish between different petroleum families. For example, Poole and Claypool (1984) used gammacerane to distinguish oils and bitumens from different source rocks in the Great Basin.191
5.1.6. Steranes
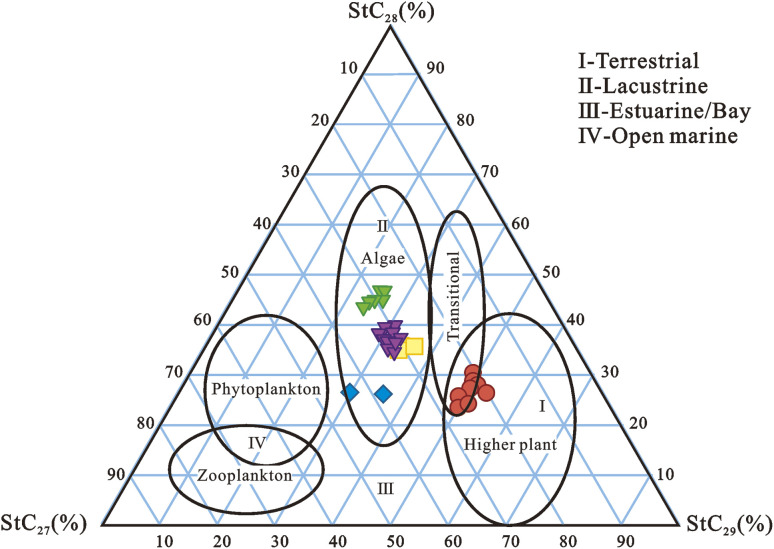
Steranes (XI) are derived from sterols, which are widely distributed in plants and microorganisms, and are typically found in mature sediments and crude oils via diagenesis.127 Sterols are classified as biomarkers of animals and zooplankton, algae, or higher plants based on their C-4 or C-24 substitution.6,192–194 Steranes are key indicators of source facies, depositional environments, and thermal maturity found in crude oils and sedimentary organic matters.195 Sterols are naturally occurring precursors to steranes and diasteranes.139 Sterols undergo changes that result in the formation of steranes and diasteranes during diagenesis.196 Sterenes and diasterenes are the most likely direct precursors of steranes and diasterenes, respectively.139 The hydrogenation produces the saturated isomers. The abundances of C27-, C28-, and C29-steranes and diasteranes provide some insight into the OM origin and depositional conditions (Fig. 13).7 C29-steranes are thought to be derived mostly from higher plants, whereas C27 and C28-steranes are thought to originate from phytoplankton.192 However, significant amounts of C29 steranes have been found in oils and source rocks that are assumed to be mostly marine in origin.15,197 Similarly, Grantham (1986) published an important study that showed that the C29 steranes in crude oils are not necessarily derived from terrestrial sources.198
Fig. 13. Ternary plot of C27, C28, and C29 sterane distributions in source rocks from Niger Delta.18,192.
5.2. Aromatic compounds
Aromatic hydrocarbons are important constituents of petroleum and extracts of both recent and ancient sediments,199–202 and they have the potential to provide important information on sedimentary environments, source input, migration, thermal maturity, and oil-source rock correlations.203 PAHs are not produced by living organisms and are essentially non-existent in natural organic matter.204 During diagenesis and catagenesis, the bulk of PAHs in petroleum are the result of complex chemical changes of naphthenic and/or olefinic biological predecessors.200 Only in favorable conditions, where a characteristic component of the naphthenic structure has been preserved unchanged, can the biological origin of specific PAHs be determined.205 PAHs distributions could be useful in a variety of applications in petroleum geochemistry. Abundance of certain PAHs in sediments and crude oils, such as 1,2,5-trimethylnaphthalene (1,2,5-TMN), 1,2,5,6 tetramethylnaphthalene (1,2,5,6-TeMN), 9-methylphenanthrene (9-MP), 1,7-dimethylphenanthrene (1,7-DMP), originate from diterpenoid and triterpenoid natural products.200
5.2.1. Naphthalene
Fossil fuels contain a lot of naphthalene (XII) and its alkylated derivatives.206,207 The main precursors for methylated naphthalenes are terpenoids produced from terrestrial plants.208 Because of the impacts of source, thermal stress, and biodegradation, their distributions throughout the geosphere are highly varied.208 The ratios computed from methylated naphthalenes are thought to reflect an increase in the abundance of the stable isomers relative to the less stable isomers, which is dictated by 1,2-methyl shift and methyl transfer in the naphthalene carbon skeleton.207
5.2.2. Phenanthrene
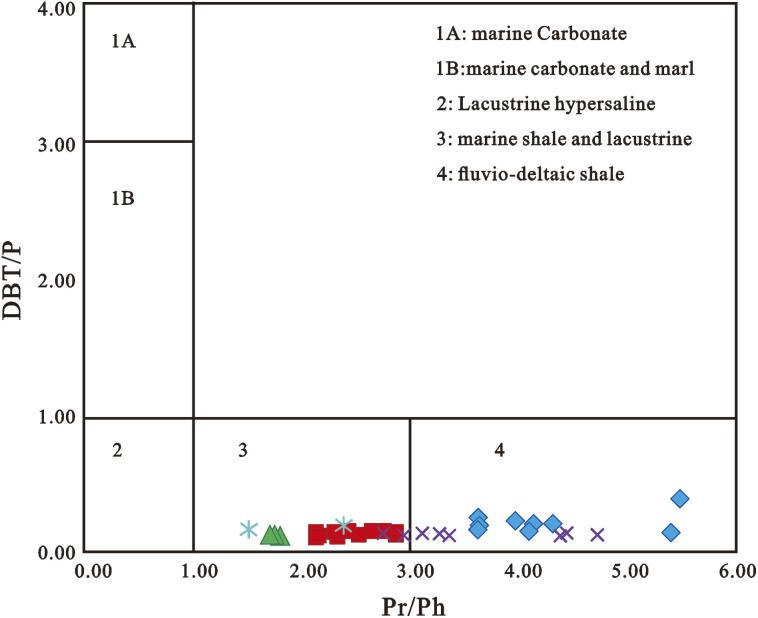
In aromatic fractions, phenanthrene (XIII) is a significant component. The relative concentration of phenanthrene in freshwater source rocks was higher than in marine source rocks.209 The overall naphthalene/phenanthrene ratio (∑N/∑P) of terrestrial freshwater oils was 0.52, that of terrestrial saline oils was 0.64, that of terrestrial hypersaline oils was 0.60, that of marine shales oils was 1.41, and that of marine carbonates oils was up to 1.80. This could indicate that the precursors of phenanthrenes in the crude oils and source rocks investigated come from terrestrial organic matter rather than marine organic matter,209 which would be consistent with prior findings.210,211 However, Jinggui et al. (2005) showed that the composition and abundance of phenanthrene and alkylated analogs in the Tabei and Tazhong uplifts' marine source rocks, as well as the Triassic and Jurassic freshwater source rocks (mudstones and coals) from the Kuche depression, were all very similar.203 The findings revealed that, regardless of source, marine and terrestrial organic matter from various sedimentary environments have relatively significant amounts of phenanthrene derivatives, and that the two types of organic matter are not distinguishable. The dibenzothiophene/phenanthrene (DBT/P) ratio alone is an effective predictor of source rock lithology, with ratios >1 for carbonates and ratios <1 for shales.212 Hughes et al. (1995) and Sivan et al. (2008) have successfully applied the cross plots of DBT/P vs. PrPh ratios to classify source rock paleodepositional settings (Fig. 14).208,212 The classification method is based on the assumption that these ratios indicate diverse Eh–pH regimes arising from substantial microbiological and chemical processes that occur during sediment deposition and early diagenesis. The DBT/P ratio evaluates the availability of reduced sulfur for incorporation into organic matter, whereas the Pr/Ph ratio evaluates the depositional environment's redox conditions.212
Fig. 14. A cross plot of dibenzothiophene/phenanthrene (DBT/P) and pristane/phytane (Pr/Ph) ratios for the Niger Delta oils.18,212.
5.2.3. Triaromatic steroids
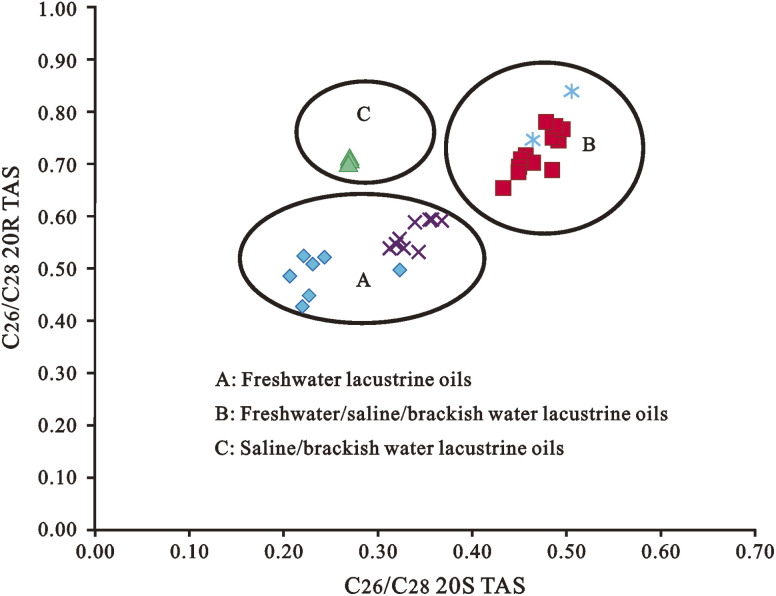
Multiple factors determine the relative abundance of triaromatic steroids (TAS) (XIV), which can be utilized as markers for diverse source inputs and depositional settings. C28-TAS is commonly found in high abundance in freshwater environments, whereas C26-TAS is commonly found in high abundance in saline and brackish water environments.213–216 TAS can result from the aromatization of monoaromatic steroids and the loss of a methyl group (–CH3).3 C26, C27, and C28 triaromatic steroids, like C27, C28, and C29 normal steranes, may retain genetic information about petroleum and source rocks.3 Peters et al. (2005) and Li et al. (2012b) employed a cross plot of C26/C28 20S versus C27/C28 20R TAS ratios to identify petroleum systems (Fig. 15).3,217 According to Zhang et al. (2002) and Mi et al. (2007), C26 20S, C26 20R + C27 20S, and C27 20R TAS were relatively high in oils derived from Cambrian source rocks, whereas C28 20S and C28 20R TAS were relatively high in oils derived from Middle-Upper Ordovician carbonate source rocks in the Lunnan oil field, Tarim Basin. TAS has also been used to determine the thermal maturity of crude oils and source rocks.214,216,218
Fig. 15. Cross plot of C27/C28 20R TAS versus C26/C28 20S TAS for Niger Delta crude oils.215,217.
5.2.4. Dibenzofurans and benzo[b]naphthofurans
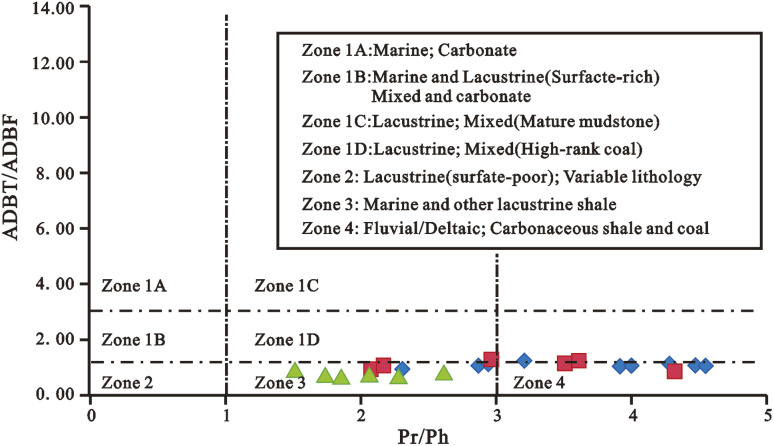
Dibenzofurans (DBFs) (XV), their alkylated homologs, and benzo[b]naphthofurans (BNFs) (XVI to XVIII) are the major oxygen heterocyclic aromatic compounds found in oils, coals, sediment extracts, and tar deposits. The source of DBFs in oils and sedimentary organic matter is still a point of contention. DBFs may be derived from dehydrated and condensed polysaccharides or the oxidative coupling of phenols, according to previous research.219–221 DBF, DBT, and biphenyl abundances in Permian rocks (East Greenland) were most likely produced from phenolic compounds in the lignin of woody plants.222 The bulk of natural compounds linked to dibenzofuran are lichen or higher fungus metabolites. The carbon–carbon oxidative coupling of orsellinic acid and its homologs appears to be the source of lichen dibenzofurans.223 As a result, Radke et al. (2000) proposed that DBFs in crude oils and sediment extracts may be used as lichen biomarkers.202 However, more research is needed to confirm the lichen-DBF precursor-product link.224 Biphenyl with oxygen can produce dibenzofuran, according to simulation experiments and geological evidence.205 Similarly, methyl-substituted biphenyls can combine with methylated DBFs to synthesize methylated DBFs. In the laboratory, biphenyl derivatives are often employed as reactants to synthesize dibenzofurans.223 To completely comprehend the origin and evolution of DBFs in the geosphere, further geological evidence and laboratory studies are required. Dibenzofuran and its alkylated homologs (abbreviated as DBFs) as well as benzo[b]naphthofurans have been used as key molecular markers in organic geochemistry. DBF occurrence and distribution are primarily influenced by source rock type and/or depositional environment.170,202,209,225 DBFs appear to predominate in freshwater source rocks, terrestrial oils, and coals,170,209,225–227 whereas their sulfur-heterocyclic counterparts dibenzothiophenes (DBTs) appear to predominate in marine shales and carbonates.212,227,228 Radke et al. (2000), Asif (2010), and Kruge (2000) indicated that the relative abundance of alkyldibenzothiophene (ADBT) compared to alkyldibenzofuran (ADBF) may be used to identify depositional settings (Fig. 16).202,205,229 Variations in the relative abundances of fluorenes, dibenzofurans, and dibenzothiophenes have been reported to be a reliable indicator of source rock sedimentary settings.203,230 The concentrations of the dibenzothiophene series were high in marine carbonate source rocks, while those of fluorenes and dibenzofurans series were high in freshwater source rocks.209,226,227,230 As a result, the fluorene, dibenzofuran, and dibenzothiophene series can be further used in the oil-source rock correlation study.
Fig. 16. Cross plots of ADBT/ADBF versus Pr/Ph.202.
Li and Ellis (2015) identified benzo[b]naphthofurans (benzo[b]naphtho[2,1-d]furan (BN21F), benzo[b]naphtho[1,2-d]furan (BN12F), and benzo[b]naphtho[2,3-d]furan (BN23F)) in crude oils and rock extracts by co-injecting authentic standards and proposed that this ratio may be a potential molecular geochemical parameter to indicate oil migration pathways and distances.224 In the Northern (Poland) and Southern (Argentina), these compounds have been found in bitumen from fluvial-deltaic siltstone and charcoal from Jurassic records of wildfires.231,232 There is currently no clear understanding of the factors that influence benzo[b]naphtho[d]furan isomerization, and the source of these compounds is unknown. Such oxygenated chemicals, on the other hand, are thought to come from terrigenous organic matter, which would explain their high abundance in coal and coaly shales.224 Li and Ellis (2015) found BNFs in fluids and source rocks from various depositional settings in a more extensive investigation of the BNFs.224 In pyrolysates from a sub-bituminous coal (random vitrinite reflectance Rr = 0.42 percent) and a high volatile bituminous coal (random vitrinite reflectance Rr = 0.56%), Vukovic et al. (2016) found a larger abundance of [2,1] and [1,2]BNFs compared to [2,3]BNF. They suggested that the water produced by kerogen, in combination with the clay minerals, undergoes numerous interactions with OM, and that these reactions could be the source of diverse oxygenated PAHs.233 Cesar and Grice (2017), recently reported benzonaphthofurans in crude oils and source rocks from the Dampier sub-basin in Western Australia, noting that clay catalysis appears to impact the formation of [1,2]BNF and that the ratio [2,1]/[1,2]BNF might be utilized to explain lithofacies. When compared to clay-depleted sediments from marine environments, this ratio was substantially lower in the fluvial-deltaic system (carbonate sequences). The authors proposed that the ternary plot of [2,1]-[1,2]-[2,3]BNFs could be used for fluid–fluid and fluid–source rock correlations based on their findings.234
6. Conclusion and outlook
This paper reviews the early and modern applications of biomarkers for paleoenvironmental reconstruction. The oxic and anoxic depositional conditions, and lacustrine and marine depositional environments were compared. The experimental and instrumental methods for analyzing biomarkers in shales were then discussed. Saturated and aromatic biomarkers were discussed as indicators of marine sedimentary depositional environments, fluvial/deltaic, freshwater, saline/brackish water depositional environments, and redox conditions. This review showed that biomarkers could be used to establish the sedimentary depositional environments, redox conditions, and organic matter enrichments of shales which are critical to deep energy exploitation. However, because biomarker geochemistry is a rich field for the paleoenvironmental reconstruction of source rocks and oils, many biomarker classes remain to be discovered and studied for the understanding of paleoenvironmental reconstruction. Hence, abundant opportunities exist for exploring new classes of biomarkers and their paleoenvironmental significance. Improvements can be made in the chromatographic separation and instrumental analyses of biomarkers by applying some automatic instruments that can separate EOM and oils to SARA and GC × GC-TOFMS which can eliminate the problems of co-elution and poor resolution usually encountered in GC-MS and at times GC-MS/MS. Also, for a more reliable paleoenvironmental reconstructions, there is a need to combine isotopic, elemental and maceral proxies with biomarkers.
Appendix 1: biomarkers mentioned in the text
Author contributions
Conceptualization, Abiodun Busuyi Ogbesejana and Bo Liu; writing—original draft preparation, Abiodun Busuyi Ogbesejana; writing—review and editing, Abiodun Busuyi Ogbesejana, Bo Liu, Oluwasesan Michael Bello, Segun Ajayi Akinyemi, Yu Song and Shuo Gao; supervision, Bo Liu; project administration, Abiodun Busuyi Ogbesejana and Bo Liu; funding acquisition, Bo Liu. All authors have read and agreed to the published version of the manuscript.
Conflicts of interest
The authors declare that there is no conflict of interest regarding the publication of this paper.
Supplementary Material
Acknowledgments
This research was financially supported by the Science and Technology Project of Heilongjiang Province (2020ZX05A01). The authors appreciate the anonymous reviewers and editors, whose constructive comments have greatly improved the quality of this paper.
References
- Mackenzie A. S. Brooks J. Welte D. Applications of biological markers in petroleum geochemistry. Adv. Pet. Geochem. 1984;1:115–214. [Google Scholar]
- Welte D. and Tissot P., Petroleum formation and occurrence, Springer-verlag, 1984 [Google Scholar]
- Peters K. E.; Peters K. E.; Walters C. C. and Moldowan J., The biomarker guide, Cambridge university press, 2005, vol. 1 [Google Scholar]
- Huc A.-Y., Petroleum Geochemistry and Geology, by ed. J. M. Hunt. Chemical Geology, 1997 [Google Scholar]
- Brassell S. C., The Importance of the Diagenetic Continuum, Organic Matter: Productivity, Accumulation, Preservation in Recent Ancient Sediments, 1992, vol. 339 [Google Scholar]
- Peters K. E. and Moldowan J. M., The biomarker guide: interpreting molecular fossils in petroleum and ancient sediments, 1993 [Google Scholar]
- Simoneit B. R., Biomarker PAHs in the environment, PAHs Related Compounds, Chemistry, 1998, pp. 175–221 [Google Scholar]
- Brassell S.; Eglinton G.; Maxwell J. and Philp R., Natural background of alkanes in the aquatic environment, in Aquatic pollutants, Elsevier, 1978, pp. 69–86 [Google Scholar]
- Jiamo F. Guoying S. Jiayou X. Eglinton G. Gowar A. Rongfen J. Shanfa F. Pingan P. Application of biological markers in the assessment of paleoenvironments of Chinese non-marine sediments. Org. Geochem. 1990;16(4–6):769–779. [Google Scholar]
- Farrimond P., Toarcian and Cenomanian/Turonian oceanic anoxic events, University of Bristo, 1987 [Google Scholar]
- Moldowan J. M. Seifert W. K. Gallegos E. J. Relationship between petroleum composition and depositional environment of petroleum source rocks. AAPG Bull. 1985;69(8):1255–1268. [Google Scholar]
- Brassell S. C. Eglinton G. Marlowe I. Pflaumann U. Sarnthein M. Molecular stratigraphy: a new tool for climatic assessment. Nature. 1986;320(6058):129–133. [Google Scholar]
- Philp R. t. Gilbert T. Biomarker distributions in Australian oils predominantly derived from terrigenous source material. Org. Geochem. 1986;10(1–3):73–84. [Google Scholar]
- Fu J. Peculiarities of salt lake sediments as potential source rocks in China. Org. Geochem. 1986;10:119–126. [Google Scholar]
- Palacas J. G.; Anders D. E. and King J. D., South Florida basin-a prime example of carbonate source rocks of petroleum, 1984 [Google Scholar]
- Mello M. Gaglianone P. Brassell S. Maxwell J. Geochemical and biological marker assessment of depositional environments using Brazilian offshore oils. Mar. Pet. Geol. 1988;5(3):205–223. [Google Scholar]
- Ogbesejana A. B. Bello O. M. Ali T. Uduma U. A. Kabo K. S. Akintade O. O. Geochemical significance of tricyclic and tetracyclic terpanes in source rock extracts from the Offshore Niger Delta Basin, Nigeria. Acta Geochim. 2021;40:184–198. [Google Scholar]
- Ogbesejana A. B. Bello O. M. Okunola O. J. Occurrence and geochemical significance of fluorene and alkylfluorenes in crude oils and source rock extracts from Niger Delta basin, Nigeria. Heliyon. 2021;7(3):e06616. doi: 10.1016/j.heliyon.2021.e06616. [DOI] [PMC free article] [PubMed] [Google Scholar]
- Baydjanova S. George S. C. Depositional environment, organic matter sources, and variable 17α (H)-diahopane distribution in Early Permian samples, southern Sydney Basin, Australia. Org. Geochem. 2019;131:60–75. [Google Scholar]
- Petrov A. Arefjev O. A. Yakubson Z. V. Hydrocarbons of adamantane series as indices of petroleum catagenesis process. Adv. Org. Geochem. 1974:517–552. [Google Scholar]
- Bechtel A. Gawlick H.-J. Gratzer R. Tomaselli M. Püttmann W. Molecular indicators of palaeosalinity and depositional environment of small scale basins within carbonate platforms: The Late Triassic Hauptdolomite Wiestalstausee section near Hallein (Northern Calcareous Alps, Austria) Org. Geochem. 2007;38(1):92–111. [Google Scholar]
- Farrimond P. Taylor A. TelnÆs N. Biomarker maturity parameters: the role of generation and thermal degradation. Org. Geochem. 1998;29(5–7):1181–1197. [Google Scholar]
- George S. C. Volk H. Dutkiewicz A. Ridley J. Buick R. Preservation of hydrocarbons and biomarkers in oil trapped inside fluid inclusions for> 2 billion years. Geochim. Cosmochim. Acta. 2008;72(3):844–870. [Google Scholar]
- Pomerantz A. E. Ventura G. T. McKenna A. M. Cañas J. A. Auman J. Koerner K. Curry D. Nelson R. K. Reddy C. M. Rodgers R. P. Combining biomarker and bulk compositional gradient analysis to assess reservoir connectivity. Org. Geochem. 2010;41(8):812–821. [Google Scholar]
- Jenkyns H. Cretaceous anoxic events: from continents to oceans. J. Geol. Soc. 1980;137(2):171–188. [Google Scholar]
- Barron E. J. s. A warm, equable Cretaceous: the nature of the problem. Earth-Sci. Rev. 1983;19(4):305–338. [Google Scholar]
- Arthur M. A. Dean W. E. Pratt L. M. Geochemical and climatic effects of increased marine organic carbon burial at the Cenomanian/Turonian boundary. Nature. 1988;335(6192):714–717. [Google Scholar]
- Arthur M. A. Sageman B. B. Marine black shales: depositional mechanisms and environments of ancient deposits. Annu. Rev. Earth Planet. Sci. 1994;22(1):499–551. [Google Scholar]
- Huber B. T. Norris R. D. MacLeod K. G. Deep-sea paleotemperature record of extreme warmth during the Cretaceous. Geology. 2002;30(2):123–126. [Google Scholar]
- Wagner T. Herrle J. O. Damsté J. S. S. Schouten S. Stüsser I. Hofmann P. Rapid warming and salinity changes of Cretaceous surface waters in the subtropical North Atlantic. Geology. 2008;36(3):203–206. [Google Scholar]
- Wagreich M. Hu X. Sageman B. Causes of oxic–anoxic changes in Cretaceous marine environments and their implications for Earth systems—an introduction. Sediment. Geol. 2011;235(1–2):1–4. [Google Scholar]
- Song Z. Qin Y. George S. C. Wang L. Guo J. Feng Z. A biomarker study of depositional paleoenvironments and source inputs for the massive formation of Upper Cretaceous lacustrine source rocks in the Songliao Basin, China. Palaeogeogr., Palaeoclimatol., Palaeoecol. 2013;385:137–151. [Google Scholar]
- Wanli Y. Yongkang L. Ruiqi G. Qingfu G. Type and evolution model of continental kerogen in the Songliao Basin. Sci. China. 1981;8:1000–1008. [Google Scholar]
- Huang D. and Li J., Lacustrine Petroleum Formation of China. Petroleum Industry Press, Beijing, 1982, p. 232 [Google Scholar]
- Demaison G. J. Moore G. T. Anoxic environments and oil source bed genesis. AAPG Bull. 1980;64(8):1179–1209. [Google Scholar]
- Oliveira C. R. Ferreira A. A. Oliveira C. J. Azevedo D. A. Neto E. V. S. Neto F. R. A. Biomarkers in crude oil revealed by comprehensive two-dimensional gas chromatography time-of-flight mass spectrometry: Depositional paleoenvironment proxies. Org. Geochem. 2012;46:154–164. [Google Scholar]
- Oliveira C. R. Oliveira C. J. Ferreira A. A. Azevedo D. A. Neto F. R. A. Characterization of aromatic steroids and hopanoids in marine and lacustrine crude oils using comprehensive two dimensional gas chromatography coupled to time-of-flight mass spectrometry (GCxGC-TOFMS) Org. Geochem. 2012;53:131–136. [Google Scholar]
- Lorant F. Behar F. Late generation of methane from mature kerogens. Energy Fuels. 2002;16(2):412–427. [Google Scholar]
- Aplin A. C. Macquaker J. H. Mudstone diversity: Origin and implications for source, seal, and reservoir properties in petroleum systems. AAPG Bull. 2011;95(12):2031–2059. [Google Scholar]
- Hosterman J. and Whitlow S., Munsell color value as related to organic carbon in Devonian shale of the Appalachian basin: USGS Open-File Report 80-660, US Geological Survey, Reston, VA: 1980 [Google Scholar]
- Jarvie D. M. Hill R. J. Ruble T. E. Pollastro R. M. Unconventional shale-gas systems: The Mississippian Barnett Shale of north-central Texas as one model for thermogenic shale-gas assessment. AAPG Bull. 2007;91(4):475–499. [Google Scholar]
- Abouelresh M. O. Slatt R. M. Lithofacies and sequence stratigraphy of the Barnett Shale in east-central Fort Worth Basin, Texas. AAPG Bull. 2012;96(1):1–22. [Google Scholar]
- Liang C. Jiang Z. Cao Y. Wu J. Wang Y. Hao F. Sedimentary characteristics and origin of lacustrine organic-rich shales in the salinized Eocene Dongying Depression. Geol. Soc. Am. Bull. 2018;130(1–2):154–174. [Google Scholar]
- Lee H. Abarghani A. Liu B. Shokouhimehr M. Ostadhassan M. Molecular weight variations of kerogen during maturation with MALDI-TOF-MS. Fuel. 2020;269:117452. [Google Scholar]
- Liu B. Song Y. Zhu K. Su P. Ye X. Zhao W. Mineralogy and element geochemistry of salinized lacustrine organic-rich shale in the Middle Permian Santanghu Basin: Implications for paleoenvironment, provenance, tectonic setting and shale oil potential. Mar. Pet. Geol. 2020;120:104569. [Google Scholar]
- Liu K.-Q. Jin Z.-J. Zeng L.-B. Sun M.-D. Liu B. Jang H. W. Safaei-Farouji M. Shokouhimer M. Ostadhassan M. Microstructural analysis of organic matter in shale by SAXS and WAXS methods. Pet. Sci. 2022;19(3):979–989. [Google Scholar]
- Carroll A. R. Upper Permian lacustrine organic facies evolution, southern Junggar Basin, NW China. Org. Geochem. 1998;28(11):649–667. [Google Scholar]
- Liu B. Bechtel A. Sachsenhofer R. F. Gross D. Gratzer R. Chen X. Depositional environment of oil shale within the second member of Permian Lucaogou Formation in the Santanghu Basin, Northwest China. Int. J. Coal Geol. 2017;175:10–25. [Google Scholar]
- Zhang K. Liu R. Liu Z. Li B. Han J. Zhao K. Influence of volcanic and hydrothermal activity on organic matter enrichment in the Upper Triassic Yanchang Formation, southern Ordos Basin, Central China. Mar. Pet. Geol. 2020;112:104059. [Google Scholar]
- Bechtel A. Jia J. Strobl S. A. Sachsenhofer R. F. Liu Z. Gratzer R. Püttmann W. Palaeoenvironmental conditions during deposition of the Upper Cretaceous oil shale sequences in the Songliao Basin (NE China): Implications from geochemical analysis. Org. Geochem. 2012;46:76–95. [Google Scholar]
- Liang C. Cao Y. Jiang Z. Wu J. Guoqi S. Wang Y. Shale oil potential of lacustrine black shale in the Eocene Dongying depression: Implications for geochemistry and reservoir characteristics. AAPG Bull. 2017;101(11):1835–1858. [Google Scholar]
- Wang M. Guo Z. Jiao C. Lu S. Li J. Xue H. Li J. Li J. Chen G. Exploration progress and geochemical features of lacustrine shale oils in China. J. Pet. Sci. Eng. 2019;178:975–986. [Google Scholar]
- Durand B., Sedimentary organic matter and kerogen. Definition and quantitative importance of kerogen, Kerogen: insoluble organic matter from sedimentary rocks, 1980, pp. 13–34 [Google Scholar]
- Rullkötter J. Michaelis W. The structure of kerogen and related materials. A review of recent progress and future trends. Org. Geochem. 1990;16(4–6):829–852. [Google Scholar]
- Emerson S., Organic carbon preservation in marine sediments, The carbon cycle atmospheric CO2: natural variations Archean to present, 1985, vol. 32, pp. 78–87 [Google Scholar]
- Gogou A. Stratigakis N. Kanakidou M. Stephanou E. G. Organic aerosols in Eastern Mediterranean: components source reconciliation by using molecular markers and atmospheric back trajectories. Org. Geochem. 1996;25(1–2):79–96. [Google Scholar]
- Meyers P. A. Organic geochemical proxies of paleoceanographic, paleolimnologic, and paleoclimatic processes. Org. Geochem. 1997;27(5–6):213–250. [Google Scholar]
- Carroll A. R. Bohacs K. M. Lake-type controls on petroleum source rock potential in nonmarine basins. AAPG Bull. 2001;85(6):1033–1053. [Google Scholar]
- Sinninghe Damsté J. S. Strous M. Rijpstra W. I. C. Hopmans E. C. Geenevasen J. A. Van Duin A. C. Van Niftrik L. A. Jetten M. S. Linearly concatenated cyclobutane lipids form a dense bacterial membrane. Nature. 2002;419(6908):708–712. doi: 10.1038/nature01128. [DOI] [PubMed] [Google Scholar]
- Calvert S. Karlin R. Toolin L. Donahue D. Southon J. Vogel J. Low organic carbon accumulation rates in Black Sea sediments. Nature. 1991;350(6320):692–695. [Google Scholar]
- Jones R.; Brooks J. and Welte D., Advances in petroleum geochemistry. Acadcmic Press, 1987; pp. 1–90 [Google Scholar]
- Ibach L. E. J. Relationship between sedimentation rate and total organic carbon content in ancient marine sediments. AAPG Bull. 1982;66(2):170–188. [Google Scholar]
- Algeo T. J. Li C. Redox classification and calibration of redox thresholds in sedimentary systems. Geochim. Cosmochim. Acta. 2020;287:8–26. [Google Scholar]
- Algeo T. J. Liu J. A re-assessment of elemental proxies for paleoredox analysis. Chem. Geol. 2020;540:119549. [Google Scholar]
- Bennett W. W. Canfield D. E. Redox-sensitive trace metals as paleoredox proxies: A review and analysis of data from modern sediments. Earth-Sci. Rev. 2020;204:103175. [Google Scholar]
- Rhoads D. C. Morse J. W. Evolutionary and ecologic significance of oxygen-deficient marine basins. Lethaia. 1971;4(4):413–428. [Google Scholar]
- Stein R. Organic carbon and sedimentation rate—further evidence for anoxic deep-water conditions in the Cenomanian/Turonian Atlantic Ocean. Mar. Geol. 1986;72(3–4):199–209. [Google Scholar]
- Pelet R. A model of organic sedimentation on present-day continental margins. Geological Society, London, Special Publications. 1987;26(1):167–180. [Google Scholar]
- Huc A., Aspects of depositional processes of organic matter in sedimentary basins, in Organic Geochemistry in Petroleum Exploration, Elsevier, 1988, pp. 263–272 [Google Scholar]
- Tyson R. V. Pearson T. H. Modern and ancient continental shelf anoxia: an overview. Geological Society, London, Special Publications. 1991;58(1):1–24. [Google Scholar]
- Sinninghe Damsté J. S. Wakeham S. G. Kohnen M. E. Hayes J. de Leeuw J. W. A 6,000–year sedimentary molecular record of chemocline excursions in the Black Sea. Nature. 1993;362(6423):827–829. doi: 10.1038/362827a0. [DOI] [PubMed] [Google Scholar]
- Pedersen T. Calvert S. Anoxia vs. productivity: what controls the formation of organic-carbon-rich sediments and sedimentary rocks? AAPG Bull. 1990;74(4):454–466. [Google Scholar]
- Peters K. E. Simonite B. Rock-Eval pyrolysis of Quaternary sediments from Leg 64, sites 479 and 480, Gulf of California. Init. Rpts. DSDP. 1982:789–814. [Google Scholar]
- Isaksen G. Bohacs K. Geological controls of source rock geochemistry through relative sea level; Triassic, Barents Sea. Petroleum source rocks. 1995:25–50. [Google Scholar]
- Froelich P. N. Klinkhammer G. Bender M. L. Luedtke N. Heath G. R. Cullen D. Dauphin P. Hammond D. Hartman B. Maynard V. Early oxidation of organic matter in pelagic sediments of the eastern equatorial Atlantic: suboxic diagenesis. Geochim. Cosmochim. Acta. 1979;43(7):1075–1090. [Google Scholar]
- Rice D. D. Claypool G. E. Generation, accumulation, and resource potential of biogenic gas. AAPG Bull. 1981;65(1):5–25. [Google Scholar]
- Schulz H. D. Dahmke A. Schinzel U. Wallmann K. Zabel M. Early diagenetic processes, fluxes, and reaction rates in sediments of the South Atlantic. Geochim. Cosmochim. Acta. 1994;58(9):2041–2060. [Google Scholar]
- Nissenbaum A. Baedecker M. Kaplan I. Studies on dissolved organic matter from interstitial water of a reducing marine fjord. Adv. Org. Geochem. 1971:427–440. [Google Scholar]
- Raiswell R. Berner R. A. Pyrite formation in euxinic and semi-euxinic sediments. Am. J. Sci. 1985;285(8):710–724. [Google Scholar]
- Savrda C. E. Bottjer D. J. Trace-fossil model for reconstruction of paleo-oxygenation in bottom waters. Geology. 1986;14(1):3–6. [Google Scholar]
- Savrda C. E. Ichnologic applications in paleoceanographic, paleoclimatic, and sea-level studies. Palaios. 1995:565–577. [Google Scholar]
- Claypool G. E. Kaplan I. R. The origin and distribution of methane in marine sediments. Natural gases in marine sediments. 1974:99–139. [Google Scholar]
- Calvert S. and Pedersen T., Organic Carbon Accumulation and Preservation, Organic matter: productivity, accumulation, and preservation in recent and ancient sediments, 1992, p. 231 [Google Scholar]
- Kontorovich A. E., Geochemical methods for the quantitative evaluation of the petroleum potential of sedimentary basins, 1984 [Google Scholar]
- Li M. Shi S. Wang T.-G. Identification and distribution of chrysene, methylchrysenes and their isomers in crude oils and rock extracts. Org. Geochem. 2012;52:55–66. [Google Scholar]
- Lopez-Avila V. Young R. Beckert W. F. Microwave-assisted extraction of organic compounds from standard reference soils and sediments. Anal. Chem. 1994;66(7):1097–1106. [Google Scholar]
- Onojake M. Osuji L. Oforka N. Bulk geochemical characteristics of crude oils from the Umutu/Bomu Fields, Niger Delta, Nigeria. Pet. Sci. Technol. 2014;32(5):618–624. [Google Scholar]
- Nytoft H. P. Bojesen-Koefoed J. A. Christiansen F. G. Fowler M. G. Oleanane or lupane? Reappraisal of the presence of oleanane in Cretaceous–Tertiary oils and sediments. Org. Geochem. 2002;33(11):1225–1240. [Google Scholar]
- Farrimond P. Talbot H. Watson D. Schulz L. Wilhelms A. Methylhopanoids: molecular indicators of ancient bacteria and a petroleum correlation tool. Geochim. Cosmochim. Acta. 2004;68(19):3873–3882. [Google Scholar]
- Azevedo D. Tamanqueira J. Dias J. Carmo A. Landau L. Gonçalves F. Multivariate statistical analysis of diamondoid and biomarker data from Brazilian basin oil samples. Fuel. 2008;87(10–11):2122–2130. [Google Scholar]
- Springer M. Garcia D. Gonçalves F. Landau L. Azevedo D. Diamondoid and biomarker characterization of oils from the Llanos Orientales Basin, Colombia. Org. Geochem. 2010;41(9):1013–1018. [Google Scholar]
- Adahchour M. Beens J. Vreuls R. Brinkman U. T. Recent developments in comprehensive two-dimensional gas chromatography (GC × GC): I. Introduction and instrumental set-up. TrAC, Trends Anal. Chem. 2006;25(5):438–454. [Google Scholar]
- Aguiar A. Júnior A. I. S. Azevedo D. A. Neto F. R. A. Application of comprehensive two-dimensional gas chromatography coupled to time-of-flight mass spectrometry to biomarker characterization in Brazilian oils. Fuel. 2010;89(10):2760–2768. [Google Scholar]
- Eiserbeck C. Nelson R. K. Grice K. Curiale J. Reddy C. M. Raiteri P. Separation of 18α (H)-, 18β (H)-oleanane and lupane by comprehensive two-dimensional gas chromatography. J. Chromatogr. A. 2011;1218(32):5549–5553. doi: 10.1016/j.chroma.2011.06.021. [DOI] [PubMed] [Google Scholar]
- Holba A. Dzou L. Wood G. Ellis L. Adam P. Schaeffer P. Albrecht P. Greene T. Hughes W. Application of tetracyclic polyprenoids as indicators of input from fresh-brackish water environments. Org. Geochem. 2003;34(3):441–469. [Google Scholar]
- Jiang L. George S. C. Biomarker signatures of Upper Cretaceous Latrobe Group hydrocarbon source rocks, Gippsland Basin, Australia: Distribution and palaeoenvironment significance of aliphatic hydrocarbons. Int. J. Coal Geol. 2018;196:29–42. [Google Scholar]
- Jiang L. George S. C. Biomarker signatures of Upper Cretaceous Latrobe Group petroleum source rocks, Gippsland Basin, Australia: Distribution and geological significance of aromatic hydrocarbons. Org. Geochem. 2019;138:103905. [Google Scholar]
- Jiang L. Ding W. George S. C. Late cretaceous–paleogene palaeoclimate reconstruction of the gippsland basin, SE Australia. Palaeogeogr., Palaeoclimatol., Palaeoecol. 2020;556:109885. [Google Scholar]
- Reddy C. M. Nelson R. K. Sylva S. P. Xu L. Peacock E. A. Raghuraman B. Mullins O. C. Identification and quantification of alkene-based drilling fluids in crude oils by comprehensive two-dimensional gas chromatography with flame ionization detection. J. Chromatogr. A. 2007;1148(1):100–107. doi: 10.1016/j.chroma.2007.03.001. [DOI] [PubMed] [Google Scholar]
- Ávila B. M. Aguiar A. Gomes A. O. Azevedo D. A. Characterization of extra heavy gas oil biomarkers using comprehensive two-dimensional gas chromatography coupled to time-of-flight mass spectrometry. Org. Geochem. 2010;41(9):863–866. [Google Scholar]
- Frysinger G. S. Gaines R. B. Separation and identification of petroleum biomarkers by comprehensive two-dimensional gas chromatography. J. Sep. Sci. 2001;24(2):87–96. [Google Scholar]
- Tran T. C. Logan G. A. Grosjean E. Ryan D. Marriott P. J. Use of comprehensive two-dimensional gas chromatography/time-of-flight mass spectrometry for the characterization of biodegradation and unresolved complex mixtures in petroleum. Geochim. Cosmochim. Acta. 2010;74(22):6468–6484. [Google Scholar]
- Ventura G. T. Raghuraman B. Nelson R. K. Mullins O. C. Reddy C. M. Compound class oil fingerprinting techniques using comprehensive two-dimensional gas chromatography (GC× GC) Org. Geochem. 2010;41(9):1026–1035. [Google Scholar]
- Aguiar A. Aguiar H. G. Azevedo D. A. Aquino Neto F. R. Identification of methylhopane and methylmoretane series in Ceará Basin oils, Brazil, using comprehensive two-dimensional gas chromatography coupled to time-of-flight mass spectrometry. Energy Fuels. 2011;25(3):1060–1065. [Google Scholar]
- Wang H. Weng N. Zhang S. Zhu G. Wei C. Comparison of geochemical parameters derived from comprehensive two-dimensional gas chromatography with time-of-flight mass spectrometry and conventional gas chromatography-mass spectrometry. Sci. China: Earth Sci. 2011;54:1892–1901. [Google Scholar]
- Silva R. S. Aguiar H. G. Rangel M. D. Azevedo D. A. Neto F. R. A. Comprehensive two-dimensional gas chromatography with time of flight mass spectrometry applied to biomarker analysis of oils from Colombia. Fuel. 2011;90(8):2694–2699. [Google Scholar]
- Ventura G. T. Hall G. J. Nelson R. K. Frysinger G. S. Raghuraman B. Pomerantz A. E. Mullins O. C. Reddy C. M. Analysis of petroleum compositional similarity using multiway principal components analysis (MPCA) with comprehensive two-dimensional gas chromatographic data. J. Chromatogr. A. 2011;1218(18):2584–2592. doi: 10.1016/j.chroma.2011.03.004. [DOI] [PubMed] [Google Scholar]
- Eiserbeck C. Nelson R. K. Grice K. Curiale J. Reddy C. M. Comparison of GC–MS, GC–MRM-MS, and GC× GC to characterise higher plant biomarkers in Tertiary oils and rock extracts. Geochim. Cosmochim. Acta. 2012;87:299–322. [Google Scholar]
- Silva R. C. Silva R. S. de Castro E. V. Peters K. E. Azevedo D. A. Extended diamondoid assessment in crude oil using comprehensive two-dimensional gas chromatography coupled to time-of-flight mass spectrometry. Fuel. 2013;112:125–133. [Google Scholar]
- Soares R. F. Pereira R. Silva R. S. Mogollon L. Azevedo D. A. Comprehensive two-dimensional gas chromatography coupled to time of flight mass spectrometry: new biomarker parameter proposition for the characterization of biodegraded oil. J. Braz. Chem. Soc. 2013;24:1570–1581. [Google Scholar]
- Ávila B. M. Pereira R. Gomes A. O. Azevedo D. A. Chemical characterization of aromatic compounds in extra heavy gas oil by comprehensive two-dimensional gas chromatography coupled to time-of-flight mass spectrometry. J. Chromatogr. A. 2011;1218(21):3208–3216. doi: 10.1016/j.chroma.2010.09.051. [DOI] [PubMed] [Google Scholar]
- Kiepper A. P. Casilli A. Azevedo D. A. Depositional paleoenvironment of Brazilian crude oils from unusual biomarkers revealed using comprehensive two dimensional gas chromatography coupled to time of flight mass spectrometry. Org. Geochem. 2014;70:62–75. [Google Scholar]
- Abubakar M. Dike E. Obaje N. Wehner H. Jauro A. Petroleum prospectivity of Cretaceous formations in the Gongola Basin, Upper Benue Trough, Nigeria: an organic geochemical perspective on a migrated oil controversy. J. Pet. Geol. 2008;31(4):387–407. [Google Scholar]
- Hakimi M. H. Abdullah W. H. Organic geochemical characteristics and oil generating potential of the Upper Jurassic Safer shale sediments in the Marib-Shabowah Basin, western Yemen. Org. Geochem. 2013;54:115–124. [Google Scholar]
- Hakimi M. H. Abdullah W. H. Source rock characteristics and hydrocarbon generation modelling of upper Cretaceous Mukalla Formation in the Jiza-Qamar Basin, eastern Yemen. Mar. Pet. Geol. 2014;51:100–116. [Google Scholar]
- Hakimi M. H. Abdullah W. H. Shalaby M. R. Organic geochemical characteristics of crude oils from the Masila Basin, eastern Yemen. Org. Geochem. 2011;42(5):465–476. [Google Scholar]
- Sun T. Wang C. Duan Y. Li Y. Hu B. The organic geochemistry of the Eocene–Oligocene black shales from the Lunpola Basin, central Tibet. J. Asian Earth Sci. 2014;79:468–476. [Google Scholar]
- Yandoka B. M. S. Abdullah W. H. Abubakar M. Hakimi M. H. Adegoke A. K. Geochemical characterisation of Early Cretaceous lacustrine sediments of Bima Formation, Yola Sub-basin, Northern Benue Trough, NE Nigeria: Organic matter input, preservation, paleoenvironment and palaeoclimatic conditions. Mar. Pet. Geol. 2015;61:82–94. [Google Scholar]
- Yandoka B. M. S. Abubakar M. Abdullah W. H. Hassan M. A. Adamu B. U. Jitong J. S. Aliyu A. H. Adegoke A. K. Facies analysis, palaeoenvironmental reconstruction and stratigraphic development of the Early Cretaceous sediments (Lower Bima Member) in the Yola Sub-basin, Northern Benue Trough, NE Nigeria. J. Afr. Earth Sci. 2014;96:168–179. [Google Scholar]
- Makeen Y. M. Abdullah W. H. Hakimi M. H. Elhassan O. M. Organic geochemical characteristics of the lower Cretaceous Abu Gabra formation in the great Moga oilfield, Muglad Basin, Sudan: Implications for depositional environment and oil-generation potential. J. Afr. Earth Sci. 2015;103:102–112. [Google Scholar]
- Killops V. J. and Killops S. D., Introduction to organic geochemistry, John Wiley & Sons, 2013 [Google Scholar]
- Eglinton G. Hamilton R. The distribution of alkanes. Chem. Plant Taxon. 1963;187:217. [Google Scholar]
- Wilkes H. Ramrath A. Negendank J. F. Organic geochemical evidence for environmental changes since 34,000 yrs BP from Lago di Mezzano, central Italy. J. Paleolimnol. 1999;22:349–365. [Google Scholar]
- Scalan E. Smith J. An improved measure of the odd-even predominance in the normal alkanes of sediment extracts and petroleum. Geochim. Cosmochim. Acta. 1970;34(5):611–620. [Google Scholar]
- Bray E. Evans E. Distribution of n-paraffins as a clue to recognition of source beds. Geochim. Cosmochim. Acta. 1961;22(1):2–15. [Google Scholar]
- Bo L. Yanfang L. Yuanlin M. Xinning L. Xiaobo G. Qiang M. Wanchun Z. Petrologic characteristics and genetic model of lacustrine lamellar fine-grained rock and its significance for shale oil exploration: A case study of Permian Lucaogou Formation in Malang sag, Santanghu Basin, NW China. Pet. Explor. Dev. 2015;42(5):656–666. [Google Scholar]
- Gonzalez-Vila F. J. Polvillo O. Boski T. Moura D. de Andrés J. R. Biomarker patterns in a time-resolved Holocene/terminal Pleistocene sedimentary sequence from the Guadiana river estuarine area (SW Portugal/Spain border) Org. Geochem. 2003;34(12):1601–1613. [Google Scholar]
- Powell T. McKirdy D. Relationship between ratio of pristane to phytane, crude oil composition and geological environment in Australia. Nat. Phys. 1973;243:37–39. [Google Scholar]
- Didyk B. Simoneit B. Brassell S. t. Eglinton G. Organic geochemical indicators of palaeoenvironmental conditions of sedimentation. Nature. 1978;272(5650):216–222. [Google Scholar]
- Chandra K. Mishra C. Samanta U. Gupta A. Mehrotra K. Correlation of different maturity parameters in the Ahmedabad-Mehsana block of the Cambay basin. Org. Geochem. 1994;21(3–4):313–321. [Google Scholar]
- Escobar M. Márquez G. Inciarte S. Rojas J. Esteves I. Malandrino G. The organic geochemistry of oil seeps from the Sierra de Perijá eastern foothills, Lake Maracaibo Basin, Venezuela. Org. Geochem. 2011;42(7):727–738. [Google Scholar]
- Ten Haven H. Applications and limitations of Mango's light hydrocarbon parameters in petroleum correlation studies. Org. Geochem. 1996;24(10–11):957–976. [Google Scholar]
- Roushdy M. El Nady M. Mostafa Y. El Gendy N. S. Ali H. Biomarkers characteristics of crude oils from some oilfields in the Gulf of Suez, Egypt. J. Am. Sci. 2010;6(11):911–925. [Google Scholar]
- Ten Haven H. Rullkötter J. The diagenetic fate of taraxer-14-ene and oleanene isomers. Geochim. Cosmochim. Acta. 1988;52(10):2543–2548. [Google Scholar]
- Grice K. Schouten S. Nissenbaum A. Charrach J. Damsté J. S. S. A remarkable paradox: sulfurised freshwater algal (Botryococcus braunii) lipids in an ancient hypersaline euxinic ecosystem. Org. Geochem. 1998;28(3–4):195–216. [Google Scholar]
- Thiel V. Peckmann J. Seifert R. Wehrung P. Reitner J. Michaelis W. Highly isotopically depleted isoprenoids: molecular markers for ancient methane venting. Geochim. Cosmochim. Acta. 1999;63(23–24):3959–3966. [Google Scholar]
- Thiel V. Peckmann J. Richnow H. H. Luth U. Reitner J. Michaelis W. Molecular signals for anaerobic methane oxidation in Black Sea seep carbonates and a microbial mat. Mar. Chem. 2001;73(2):97–112. [Google Scholar]
- Vink A. Schouten S. Sephton S. Damsté J. S. S. A newly discovered norisoprenoid, 2, 6, 15, 19-tetramethylicosane, in Cretaceous black shales. Geochim. Cosmochim. Acta. 1998;62(6):965–970. [Google Scholar]
- de Leeuw J. and Baas M., Biological markers in the sedimentary record, chapter Early-stage diagenesis of steroids, Elsevier, Amsterdam, 1986 [Google Scholar]
- Armstroff A., Geochemical significance of biomarkers in Paleozoic coals, Techn. Univ., Diss., Berlin, 2004, vol. 2004 [Google Scholar]
- Shanmugam G. Significance of coniferous rain forests and related organic matter in generating commercial quantities of oil, Gippsland Basin, Australia1. AAPG Bull. 1985;69(8):1241–1254. [Google Scholar]
- Moldowan J. M. Seifert W. K. First discovery of botryococcane in petroleum. J. Chem. Soc. Chem. Commun. 1980;19:912–914. [Google Scholar]
- McKirdy D. Cox R. Volkman J. Howell V. Botryococcane in a new class of Australian non-marine crude oils. Nature. 1986;320(6057):57–59. [Google Scholar]
- Philp R. P. Lewis C. A. Organic geochemistry of biomarkers. Annu. Rev. Earth Planet. Sci. 1987;15(1):363–395. [Google Scholar]
- Murphy M. T. McCormick A. Eglinton G. Perhydro-β-carotene in the Green River shale. Science. 1967;157(3792):1040–1042. doi: 10.1126/science.157.3792.1040. [DOI] [PubMed] [Google Scholar]
- Jiang Z. Fowler M. G. Carotenoid-derived alkanes in oils from northwestern China. Org. Geochem. 1986;10(4–6):831–839. [Google Scholar]
- Peters K. Moldowan J. M. Driscole A. Demaison G. Origin of Beatrice oil by co-sourcing from Devonian and Middle Jurassic source rocks, inner Moray Firth, United Kingdom. AAPG Bull. 1989;73(4):454–471. [Google Scholar]
- Koopmans M. P. De Leeuw J. W. Damsté J. S. S. Novel cyclised and aromatised diagenetic products of β-carotene in the Green River Shale. Org. Geochem. 1997;26(7–8):451–466. [Google Scholar]
- Grba N. Šajnović A. Stojanović K. Simić V. Jovančićević B. Roglić G. Erić V. Preservation of diagenetic products of β-carotene in sedimentary rocks from the Lopare Basin (Bosnia and Herzegovina) Geochemistry. 2014;74(1):107–123. [Google Scholar]
- Ding X. Gao C. Zha M. Chen H. Su Y. Depositional environment and factors controlling β-carotane accumulation: A case study from the Jimsar Sag, Junggar Basin, northwestern China. Palaeogeogr., Palaeoclimatol., Palaeoecol. 2017;485:833–842. [Google Scholar]
- Hall P. B. and Douglas A. G., The distribution of cyclic alkanes in two lacustrine deposits, in Advances in Organic Geochemistry, ed. M. Bjorøy, Editions Technip, Paris, 1983, pp. 576–587 [Google Scholar]
- Requejo A. Allan J. Creaney S. Gray N. Cole K. Aryl isoprenoids and diaromatic carotenoids in Paleozoic source rocks and oils from the Western Canada and Williston Basins. Org. Geochem. 1992;19(1–3):245–264. [Google Scholar]
- Brocks J. J. Schaeffer P. Okenane, a biomarker for purple sulfur bacteria (Chromatiaceae), and other new carotenoid derivatives from the 1640 Ma Barney Creek Formation. Geochim. Cosmochim. Acta. 2008;72(5):1396–1414. [Google Scholar]
- Wang G. Wang T.-G. Simoneit B. R. Zhang L. Investigation of hydrocarbon biodegradation from a downhole profile in Bohai Bay Basin: Implications for the origin of 25-norhopanes. Org. Geochem. 2013;55:72–84. [Google Scholar]
- Guangyou Z. Qiang J. Shuichang Z. Jinxing D. Linye Z. Jian L. Distribution characteristics of effective source rocks and their control on hydrocarbon accumulation: a case study from the Dongying Sag, Eastern China. Acta Geol. Sin. 2004;78(6):1275–1288. [Google Scholar]
- Wang Y. Li M. Pang X. Zhang S. Shi D. Fault-fracture mesh petroleum plays in the Zhanhua Depression, Bohai Bay Basin: Part 1. Source rock characterization and quantitative assessment. Org. Geochem. 2005;36(2):183–202. [Google Scholar]
- Pang X. Li M. Li S. Jin Z. Geochemistry of petroleum systems in the Niuzhuang South Slope of Bohai Bay Basin: Part 3. Estimating hydrocarbon expulsion from the Shahejie formation. Org. Geochem. 2005;36(4):497–510. [Google Scholar]
- Wang Q. Huang H. Li Z. Ma Y. Zeng J. Larter S. Geochemical significance of β-carotane in lacustrine oils from the Shahejie Formation of the Dongying Depression, eastern China. Org. Geochem. 2021;156:104241. [Google Scholar]
- Liu B. Song Y. Ye X. Zhu K. Yan M. Wan L. Li C. Li Z. Tian W. Algal-microbial community, paleoenvironment, and shale oil potential of lacustrine organic-rich shale in the upper Cretaceous Nenjiang formation of the southern central depression, Songliao Basin (NE China) ACS Earth Space Chem. 2021;5(10):2957–2969. [Google Scholar]
- Huang H. Zhang S. Su J. Geochemistry of tri-and tetracyclic terpanes in the palaeozoic oils from the Tarim Basin, Northwest China. Energy Fuels. 2015;29(11):7014–7025. [Google Scholar]
- Ourisson G. Albrecht P. Rohmer M. Predictive microbial biochemistry—from molecular fossils to procaryotic membranes. Trends Biochem. Sci. 1982;7(7):236–239. [Google Scholar]
- Aquino N. F., Occurrence and formation of tricyclic and tetracyclic terpanes in sediments and petroleum. Advances in organic geochemistry 1981, 1983, pp. 659–667 [Google Scholar]
- Simoneit B. R. Schoell M. Dias R. F. de Aquino Neto F. R. Unusual carbon isotope compositions of biomarker hydrocarbons in a Permian tasmanite. Geochim. Cosmochim. Acta. 1993;57(17):4205–4211. [Google Scholar]
- Marynowski L. Czechowski F. Simoneit B. R. Phenylnaphthalenes and polyphenyls in Palaeozoic source rocks of the Holy Cross Mountains, Poland. Org. Geochem. 2001;32(1):69–85. [Google Scholar]
- Revill A. Volkman J. O'leary T. Summons R. Boreham C. Banks M. Denwer K. Hydrocarbon biomarkers, thermal maturity, and depositional setting of tasmanite oil shales from Tasmania, Australia. Geochim. Cosmochim. Acta. 1994;58(18):3803–3822. [Google Scholar]
- Kruge M. A. Hubert J. F. Akes R. J. Meriney P. E. Biological markers in Lower Jurassic synrift lacustrine black shales, Hartford basin, Connecticut, USA. Org. Geochem. 1990;15(3):281–289. [Google Scholar]
- Volk H. George S. C. Middleton H. Schofield S. Geochemical comparison of fluid inclusion and present-day oil accumulations in the Papuan Foreland–evidence for previously unrecognised petroleum source rocks. Org. Geochem. 2005;36(1):29–51. [Google Scholar]
- Samuel O. J. Kildahl-Andersen G. Nytoft H. P. Johansen J. E. Jones M. Novel tricyclic and tetracyclic terpanes in Tertiary deltaic oils: structural identification, origin and application to petroleum correlation. Org. Geochem. 2010;41(12):1326–1337. [Google Scholar]
- Xiao H. Wang T.-G. Li M. Fu J. Tang Y. Shi S. Yang Z. Lu X. Occurrence and distribution of unusual tri-and tetracyclic terpanes and their geochemical significance in some Paleogene oils from China. Energy Fuels. 2018;32(7):7393–7403. [Google Scholar]
- Ogbesejana A. B. Bello O. M. Distribution and geochemical significance of dibenzofurans, phenyldibenzofurans and benzo [b] naphthofurans in source rock extracts from Niger Delta basin, Nigeria. Acta Geochim. 2020;39(6):973–987. [Google Scholar]
- Clark J. Philp R. Geochemical characterization of evaporite and carbonate depositional environments and correlation of associated crude oils in the Black Creek Basin, Alberta. Bull. Can. Pet. Geol. 1989;37(4):401–416. [Google Scholar]
- Ma N. Hou D. Shi H. Novel tetracyclic terpanes in crude oils and source rock extracts in Pearl River Mouth basin and their geological significance. J. Earth Sci. 2014;25:713–718. [Google Scholar]
- Xiao H. Li M. Wang W. You B. Liu X. Yang Z. Liu J. Chen Q. Uwiringiyimana M. Identification, distribution and geochemical significance of four rearranged hopane series in crude oil. Org. Geochem. 2019;138:103929. [Google Scholar]
- Xiao H. Li M. Yang Z. Zhu Z. Distribution patterns and geochemical implications of C19–C23 tricyclic terpanes in source rocks and crude oils occurring in various depositional environments. Geochimica. 2019;48(2):161–170. [Google Scholar]
- Simoneit B. T. Cyclic terpenoids of the geosphere. Methods Geochem. Geophys. 1986;24:43–99. [Google Scholar]
- Ourisson G. Albrecht P. Hopanoids. 1. Geohopanoids: the most abundant natural products on Earth? Acc. Chem. Res. 1992;25(9):398–402. [Google Scholar]
- Grice K. Audino M. Boreham C. J. Alexander R. Kagi R. I. Distributions and stable carbon isotopic compositions of biomarkers in torbanites from different palaeogeographical locations. Org. Geochem. 2001;32(10):1195–1210. [Google Scholar]
- Neunlist S. Rodier C. Llopiz P. Isotopic biogeochemistry of the lipids in recent sediments of Lake Bled (Slovenia) and Baldeggersee (Switzerland) Org. Geochem. 2002;33(10):1183–1195. [Google Scholar]
- Ourisson G. Albrecht P. Rohmer M. The hopanoids: palaeochemistry and biochemistry of a group of natural products. Pure Appl. Chem. 1979;51(4):709–729. [Google Scholar]
- Ourisson G. Rohmer M. Poralla K. Prokaryotic hopanoids and other polyterpenoid sterol surrogates. Annu. Rev. Microbiol. 1987;41(1):301–333. doi: 10.1146/annurev.mi.41.100187.001505. [DOI] [PubMed] [Google Scholar]
- Farrimond P. Bevan J. C. Bishop A. N. Hopanoid hydrocarbon maturation by an igneous intrusion. Org. Geochem. 1996;25(3–4):149–164. [Google Scholar]
- Farrimond P. Head I. Innes H. Environmental influence on the biohopanoid composition of recent sediments. Geochim. Cosmochim. Acta. 2000;64(17):2985–2992. [Google Scholar]
- Peters K. Moldowan J. Effects of source, thermal maturity, and biodegradation on the distribution and isomerization of homohopanes in petroleum. Org. Geochem. 1991;17(1):47–61. [Google Scholar]
- Eglinton G., Henderson W. and Wollrab V., Identification of steranes and triterpanes from a geological source by capillary gas liquid chromatography and mass spectrometry, 1969 [Google Scholar]
- Venkatesan M. Organic geochemistry of marine sediments in Antarctic region: Marine lipids in McMurdo Sound. Org. Geochem. 1988;12(1):13–27. [Google Scholar]
- Damsté J. S. S. Kenig F. Koopmans M. P. Köster J. Schouten S. Hayes J. de Leeuw J. W. Evidence for gammacerane as an indicator of water column stratification. Geochim. Cosmochim. Acta. 1995;59(9):1895–1900. doi: 10.1016/0016-7037(95)00073-9. [DOI] [PubMed] [Google Scholar]
- Jiamo F. Guoying S. Dehan L. Organic geochemical characteristics of major types of terrestrial petroleum source rocks in China. Geological Society, London, Special Publications. 1988;40(1):279–289. [Google Scholar]
- Brassell S. Eglinton G. Sheng G. Fu J. Biological markers in lacustrine Chinese oil shales. Geological Society, London, Special Publications. 1988;40(1):299–308. [Google Scholar]
- Rohrback B. Crude oil geochemistry of the Gulf of Suez. Adv. Org. Geochem. 1981:39–48. [Google Scholar]
- Moldowan J. M. Lee C. Y. Watt D. S. Jeganathan A. Slougui N.-E. Gallegos E. J. Analysis and occurrence of C26-steranes in petroleum and source rocks. Geochim. Cosmochim. Acta. 1991;55(4):1065–1081. [Google Scholar]
- Poole F. G. Claypool G. E. Petroleum Source Rock Potential and Crude Oil Correlation in Great Basin. AAPG Bull. 1985;69(5):861. [Google Scholar]
- Huang W.-Y. Meinschein W. Sterols as ecological indicators. Geochim. Cosmochim. Acta. 1979;43(5):739–745. [Google Scholar]
- Mackenzie A. Brassell S. Eglinton G. Maxwell J. Chemical fossils: the geological fate of steroids. Science. 1982;217(4559):491–504. doi: 10.1126/science.217.4559.491. [DOI] [PubMed] [Google Scholar]
- Volkman J. K. Barrett S. M. Blackburn S. I. Eustigmatophyte microalgae are potential sources of C29 sterols, C22–C28 n-alcohols and C28–C32 n-alkyl diols in freshwater environments. Org. Geochem. 1999;30(5):307–318. [Google Scholar]
- Curiale J. A review of the occurrences and causes of migration-contamination in crude oil. Org. Geochem. 2002;33(12):1389–1400. [Google Scholar]
- Brassell S. C. Eglinton G. Mo F. J. Biological marker compounds as indicators of the depositions! history of the Maoming oil shale. Org. Geochem. 1986;10(4–6):927–941. [Google Scholar]
- Walters C. C. Cassa M. R. Regional organic geochemistry of offshore Louisiana. AAPG Bull. 1985:113–115. [Google Scholar]
- Grantham P. The occurrence of unusual C27 and C29 sterane predominances in two types of Oman crude oil. Org. Geochem. 1986;9(1):1–10. [Google Scholar]
- Blumer M. Youngblood W. W. Polycyclic aromatic hydrocarbons in soils and recent sediments. Science. 1975;188(4183):53–55. doi: 10.1126/science.188.4183.53. [DOI] [PubMed] [Google Scholar]
- Radke M. Organic geochemistry of aromatic hydrocarbons. Adv. Pet. Geochem. 1987;2:141–207. [Google Scholar]
- Radke M. Vriend S. Schaefer R. Geochemical characterization of lower Toarcian source rocks from NW Germany: Interpretation of aromatic and saturated hydrocarbons in relation to depositional environment and maturation effects. Journal of petroleum geology. 2001;24(3):287–307. [Google Scholar]
- Radke M. Vriend S. Ramanampisoa L. Alkyldibenzofurans in terrestrial rocks: influence of organic facies and maturation. Geochim. Cosmochim. Acta. 2000;64(2):275–286. [Google Scholar]
- Jinggui L. Philp P. Zifang M. Wenhui L. Jianjing Z. Guojun C. Mei L. Zhaoyun W. Aromatic compounds in crude oils and source rocks and their application to oil–source rock correlations in the Tarim basin, NW China. J. Asian Earth Sci. 2005;25(2):251–268. [Google Scholar]
- Hase A. Hites R. A. On the origin of polycyclic aromatic hydrocarbons in recent sediments: biosynthesis by anaerobic bacteria. Geochim. Cosmochim. Acta. 1976;40(9):1141–1143. [Google Scholar]
- Asif M., Geochemical applications of polycyclic aromatic hydrocarbons in crude oils and sediments from Pakistan, University Of Engineering And Technology; Lahore, Pakistan, 2010 [Google Scholar]
- Bastow T. P. Alexander R. Kagi R. I. Sosrowidjojo I. B. The effect of maturity and biodegradation on the enantiomeric composition of sedimentary dihydro-ar-curcumene and related compounds. Org. Geochem. 1998;29(5–7):1297–1304. [Google Scholar]
- van Aarssen B. G. Bastow T. P. Alexander R. Kagi R. I. Distributions of methylated naphthalenes in crude oils: indicators of maturity, biodegradation and mixing. Org. Geochem. 1999;30(10):1213–1227. [Google Scholar]
- Sivan P. Datta G. C. Singh R. R. Aromatic biomarkers as indicators of source, depositional environment, maturity and secondary migration in the oils of Cambay Basin, India. Org. Geochem. 2008;39(11):1620–1630. [Google Scholar]
- Fan P. Philp R. Li Z. Yu X. Ying G. Biomarker distributions in crude oils and source rocks from different sedimentary environments. Chem. Geol. 1991;93(1–2):61–78. [Google Scholar]
- Mair B. J. Terpenoids, fatty acids and alcohols as source materials for petroleum hydrocarbons. Geochim. Cosmochim. Acta. 1964;28(8):1303–1321. [Google Scholar]
- Greiner A. C. Spyckerelle C. Albrecht P. Ourisson G. Hydrocarbures aromatiques d’origine géologique V-Dérivés mono-et di-aromatiques du hopane. J. Chem. Res. 1977:3828–3836. [Google Scholar]
- Hughes W. B. Holba A. G. Dzou L. I. The ratios of dibenzothiophene to phenanthrene and pristane to phytane as indicators of depositional environment and lithology of petroleum source rocks. Geochim. Cosmochim. Acta. 1995;59(17):3581–3598. [Google Scholar]
- Ling M. Zhihuan Z. Aromatic geochemical characteristics of crude oil of beach area in Nanpu Sag. Int. J. Oil, Gas Coal Technol. 2009;31(2):11–15. [Google Scholar]
- Chang X. Han Z. Shang X. Yan C. Geochemical characteristics of aromatic hydrocarbons in crude oils from the Linnan Subsag, Shandong Province, China. Chin. J. Geochem. 2011;30:132–137. [Google Scholar]
- Ogbesejanana A. B. The Distributions and Geochemical Significance of Triaromatic Steroids and Aromatic Dinosteroids in Crude Oils from Niger Delta Basin, Nigeria. J. Sci. Ind. Res. 2018;2(1):55–70. [Google Scholar]
- Ogbesejana A. Bello O. Uduma A. Characterization of source rocks from off-shore Niger Delta Basin, Nigeria. J. Appl. Sci. Environ. Manage. 2018;22(3):356–361. [Google Scholar]
- Li M. Wang T.-G. Lillis P. G. Wang C. Shi S. The significance of 24-norcholestanes, triaromatic steroids and dinosteroids in oils and Cambrian–Ordovician source rocks from the cratonic region of the Tarim Basin, NW China. Appl. Geochem. 2012;27(8):1643–1654. [Google Scholar]
- Asif M. Fazeelat T. Petroleum geochemistry of the Potwar Basin, Pakistan: II–Oil classification based on heterocyclic and polycyclic aromatic hydrocarbons. Appl. Geochem. 2012;27(8):1655–1665. [Google Scholar]
- Sephton M. Looy C. Veefkind R. Visscher H. Brinkhuis H. De Leeuw J. Cyclic diaryl ethers in a Late Permian sediment. Org. Geochem. 1999;30(4):267–273. [Google Scholar]
- Pastorova I. Botto R. E. Arisz P. W. Boon J. J. Cellulose char structure: a combined analytical Py-GC-MS, FTIR, and NMR study. Carbohydr. Res. 1994;262(1):27–47. [Google Scholar]
- Born J. Louw R. Mulder P. Formation of dibenzodioxins and dibenzofurans in homogenous gas-phase reactions of phenols. Chemosphere. 1989;19(1–6):401–406. [Google Scholar]
- Fenton S. Grice K. Twitchett R. J. Böttcher M. E. Looy C. V. Nabbefeld B. Changes in biomarker abundances and sulfur isotopes of pyrite across the Permian–Triassic (P/Tr) Schuchert Dal section (East Greenland) Earth Planet. Sci. Lett. 2007;262(1–2):230–239. [Google Scholar]
- Sargent M. V. and Stransky P. O., Dibenzofurans, in Advances in heterocyclic chemistry, Elsevier, 1984, vol. 35, pp. 1–81 [Google Scholar]
- Li M. Ellis G. S. Qualitative and quantitative analysis of dibenzofuran, alkyldibenzofurans, and benzo [b] naphthofurans in crude oils and source rock extracts. Energy Fuels. 2015;29(3):1421–1430. [Google Scholar]
- Ogbesejana A. B. Ningning Z. Sonibare O. O. Occurrence and distribution of dibenzofurans and benzo [b] naphthofurans in the crude oils from the Northern and offshore Niger Delta basin, Nigeria. Pet. Sci. Technol. 2019;37(18):1969–1977. [Google Scholar]
- Pu F. Philip R. Zhenxi L. Guangguo Y. Geochemical characteristics of aromatic hydrocarbons of crude oils and source rocks from different sedimentary environments. Org. Geochem. 1990;16(1–3):427–435. [Google Scholar]
- Li M. Wang T. Zhong N. Zhang W. Sadik A. Li H. Ternary diagram of fluorenes, dibenzothiophenes and dibenzofurans: Indicating depositional environment of crude oil source rocks. Energy Explor. Exploit. 2013;31(4):569–588. [Google Scholar]
- Hughes W. B., Use of thiophenic organosulfur compounds in characterizing crude oils derived from carbonate versus siliciclastic sources, 1984 [Google Scholar]
- Kruge M. A. Determination of thermal maturity and organic matter type by principal components analysis of the distributions of polycyclic aromatic compounds. Int. J. Coal Geol. 2000;43(1–4):27–51. [Google Scholar]
- Li J. Li M. Wang Z. Dibenzofuran series in terrestrial source rocks and curde oils and applications to oil-source rock correlations in the Kuche depression of Tarim Basin, NW China. Chin. J. Geochem. 2004;23(2):113–123. [Google Scholar]
- Marynowski L. Simoneit B. R. Widespread Upper Triassic to Lower Jurassic wildfire records from Poland: evidence from charcoal and pyrolytic polycyclic aromatic hydrocarbons. Palaios. 2009;24(12):785–798. [Google Scholar]
- Marynowski L. Scott A. C. Zatoń M. Parent H. Garrido A. C. First multi-proxy record of Jurassic wildfires from Gondwana: evidence from the Middle Jurassic of the Neuquén Basin, Argentina. Palaeogeogr., Palaeoclimatol., Palaeoecol. 2011;299(1–2):129–136. [Google Scholar]
- Vuković N. Životić D. Mendonça Filho J. G. Kravić-Stevović T. Hamor-Vido M. de Oliveira Mendonça J. Stojanović K. The assessment of maturation changes of humic coal organic matter—Insights from closed-system pyrolysis experiments. Int. J. Coal Geol. 2016;154:213–239. [Google Scholar]
- Cesar J. Grice K. The significance of benzo [b] naphtho [d] furans in fluids and source rocks: New indicators of facies type in fluvial-deltaic systems. Org. Geochem. 2017;113:175–183. [Google Scholar]


