Abstract
Cerebrovascular dysregulation is a hallmark of Alzheimer’s Disease (AD), but the changes that occur in specific cell-types have not been fully characterized. Here, we profile single-nucleus transcriptomes in human cerebrovasculature in 6 brain regions from 220 individuals with AD and 208 age-matched control individuals. We annotate 22,514 cerebrovascular cells, including 11 subtypes of endothelial, pericyte, smooth muscle, perivascular fibroblast, and ependymal cells. We identify 2,676 differentially expressed genes in AD, including downregulation of PDGFRB in pericytes, and of ABCB1 and ATP10A in endothelial cells, and validate the downregulation of SLC6A1 and upregulation of APOD, INSR, and COL4A1 in post-mortem AD brain tissues. We find the vasculature-glial-neuronal co-expressed gene modules, suggesting coordinated neurovascular unit dysregulation in AD. Integration with AD genetics reveals 125 AD-differentially expressed genes directly linked to AD-associated genetic variants. Lastly, we show that APOE4-genotype associated differences are significantly enriched among AD-associated genes in capillary and venule endothelial cells, and subsets of pericytes and fibroblasts.
Introduction
Blood-brain barrier (BBB) breakdown may be an early feature of Alzheimer’s disease (AD), preceding dementia and neurodegeneration, suggesting a critical role of neurovascular unit dysfunction in the progression of AD1. This breakdown leads to the entrance of toxic molecules, pathogens, and cells from peripheral blood into the central nervous system (CNS), triggering inflammatory and immune responses2.
The combination of single nucleus RNA sequencing (snRNA-seq) technologies and vessel enrichment protocols has provided an atlas of brain vasculature cell types in human and mouse3–5. However, cell sorting and enrichment protocols can introduce technical biases in cell type composition. Thus, molecular characterization of human cerebrovascular cell types using sorting-free and enrichment-free methods is still needed to understand the cellular basis of the neurovascular unit. Moreover, different brain regions have been shown to possess cellular, morphological and functional differences in vasculature6. Understanding this molecular heterogeneity can provide insights into the unique vulnerabilities of different brain regions to disease.
Here, we report an atlas of 22,514 transcriptomes of cerebrovascular single nuclei from 6 brain regions across 220 AD and 208 age-matched control individuals, covering 11 cell types. We find substantial proportional and transcriptional differences between brain regions, highlighting the regional heterogeneity of the BBB. We also find 2,676 cell-type-specific differentially-expressed genes in AD. Differential cell-cell communication analysis suggests mechanistic mediators of neurovascular unit dysregulation in AD. Integration with AD genetics reveals ~37% of AD-differential genes can be linked to AD-associated genetic variants. Lastly, we show that APOE4-genotype associated differences are significantly enriched in subsets of endothelial cells, pericytes and fibroblasts, which underlie the vascular dysregulation in APOE4-associated cognitive decline.
Results
Brain vasculature characterization across six brain regions
To characterize human cerebrovascular cells and their transcriptomic differences in AD, we profiled and analyzed the transcriptome of 22,514 single nuclei from 725 post-mortem brain samples of 220 AD and 208 control individuals (Supplementary Table 1 and Supplementary Fig. 1a–c) across 6 brain regions: prefrontal cortex area BA9, hippocampus, mid-temporal cortex, angular gyrus, entorhinal cortex, and thalamus. We defined controls (non-AD) as individuals with little to no AD pathology, whereas cases (AD) included a spectrum of AD pathology and cognition pathology (Supplementary Fig. 1a, Methods). We annotated 11 vascular cell types, including three types of endothelial cells (marked by FLT1, CLDN5), two types of pericytes (marked by RGS5, PDGFRB), two types of smooth muscle cells (SMCs, marked by ACTA2), three types of fibroblasts (marked by COL3A1), and ependymal cells (marked by TTR) (Fig. 1a–b), using expression of canonical markers3,4 (Fig. 1c,d and Extended Data Fig. 1a). Consistent with two recent studies4,5, we found distinct transcriptomic signatures of arterial, capillary, and venule endothelial cells, arterial and venule SMCs, showing specialized functions in different types of vessels (Supplementary Table 2–3, Methods). The inclusion of ependymal cells by our marker-based in silico cell sorting highlights the transcriptional commonalities of cerebrospinal fluid (CSF) and the BBB. Integration with an independent vessel-enrichment-based dataset5 confirmed the vascular cell types and subtypes we characterized (Extended Data Fig. 1b–e, Methods), suggesting that the technical difference between the two studies does not impact identification at the single cell level.
Figure 1.
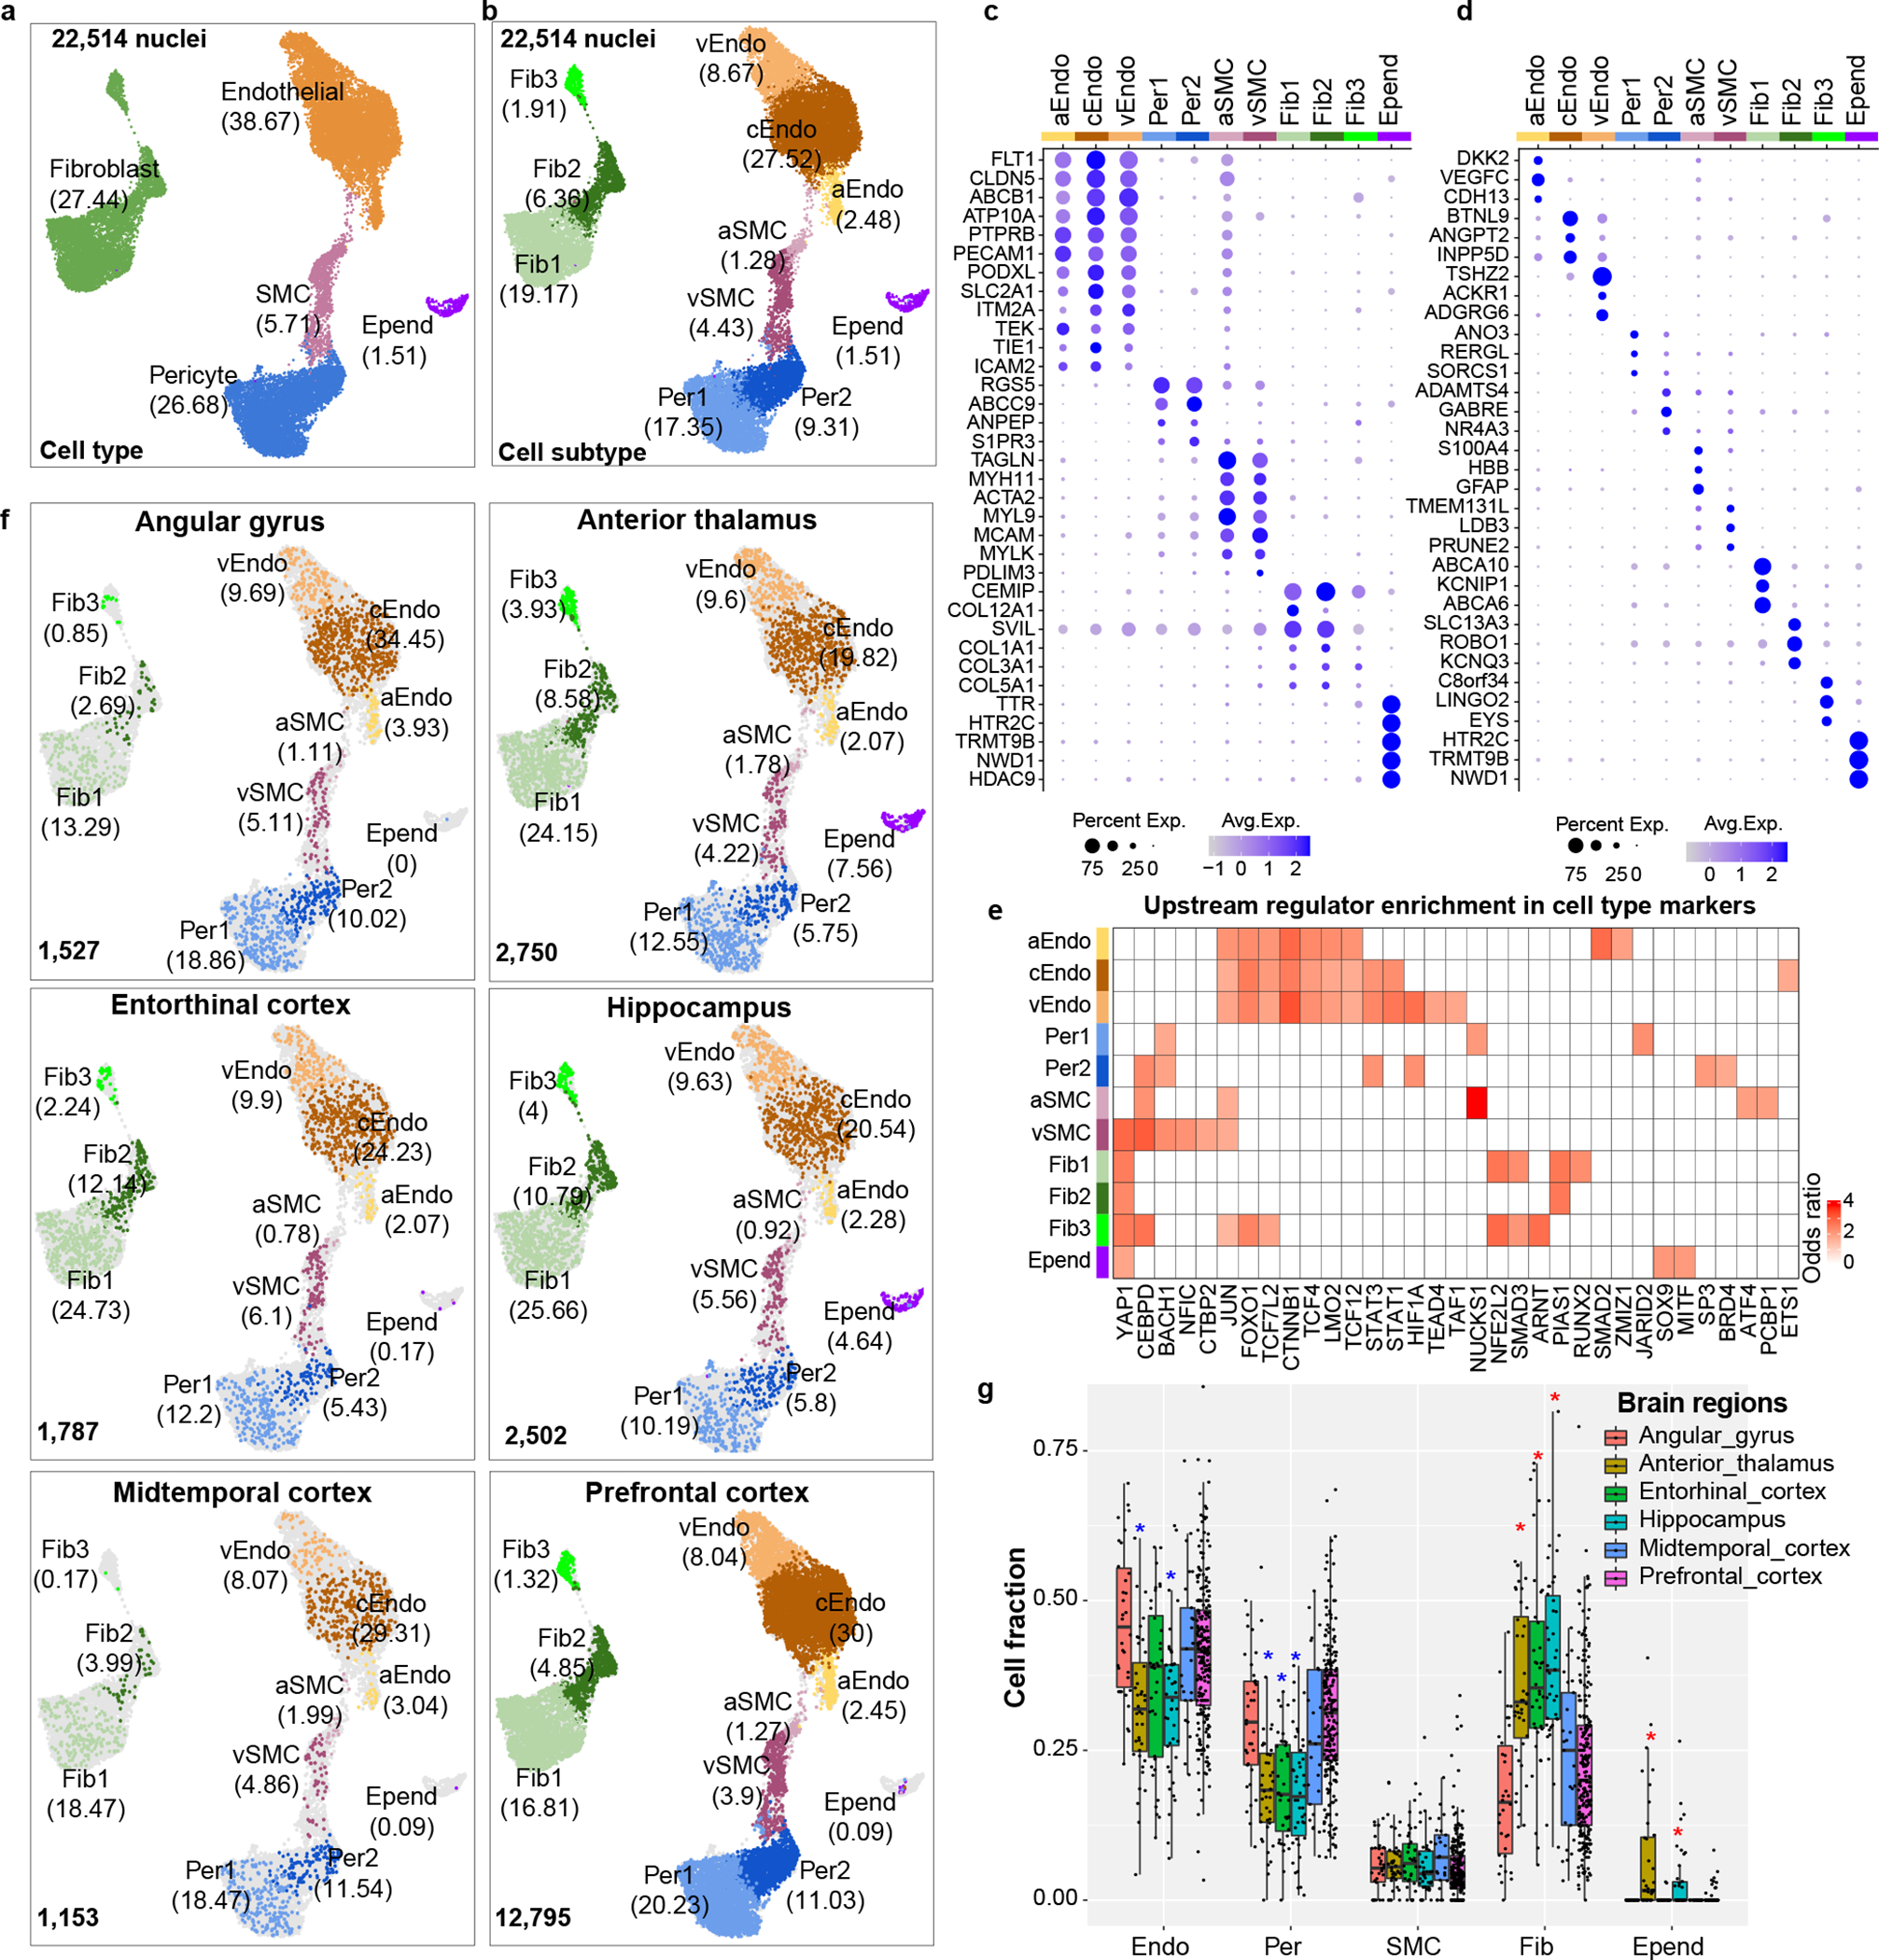
Brain vasculature characterization across six brain regions. a-b. UMAP of 22,514 in silico sorted brain vascular nuclei from postmortem tissues labeled by cell type (a) and cell subtype (b), the percentage of cells in each cell type is shown. c-d. Top 5 markers for vascular cell types (c) and cell subtypes (d). The size of dots represents the percentage of cells with expression. The color of dots represents the scaled average expression level. e. Heatmap to show the enrichment of upstream regulators for cell subtype markers. Odds ratio represents the enrichment. Enrichr package in R based on three libraries including TRANSFAC and JASPAR, ChEA, and ENCODE TF ChIP-seq data was used to predict upstream regulators (proportion test, adjusted p-value <0.05 as a cut-off). Only the regulators with significantly high expression in the corresponding cell types are shown. f. UMAP of vascular nuclei for each brain region. The percentage of cells in each cell type is shown. g. Distribution of cell fraction across six brain regions in major cell types. The stars represent the significance of cell types enriched(red star)/depleted(blue star) in specific regions compared to the overall fraction by the Wilcoxon rank test adjusted p-value <0.05 (two-sided). n=409 in PFC; 47 in angular gyrus, mid-temporal cortex and thalamus; 45 in entorhinal cortex; 84 in hippocampus. The box starts in the first quantile (25%) and ends in the third (75%). The line inside represents the median. Two whiskers represent the maximum and minimum without outliers.
To gain insights into gene regulatory mechanisms, we next predicted upstream regulators whose activities are associated with molecular function and cell identity. We found that the major cell types tended to share upstream regulators, but still show subtype specificity (Fig. 1e). Some of the top regulators of cell identity show high enrichment in endothelial cells such as CTNNB1, which is associated with maintenance of BBB integrity through endothelial β-Catenin signaling7. For pericytes, we found enrichment of BACH1, consistent with its transcriptional regulation of pro-angiogenic activity via modulating the expression of angiopoietin-18.
We next evaluated whether vascular cells show differences in abundance across brain regions and phenotypic variables. We found significantly higher proportions of fibroblasts and lower proportions of pericytes and capillary endothelial cells in entorhinal cortex, hippocampus and thalamus (Fig. 1f–g and Extended Data Fig. 2a; FDR<0.05 by Wilcoxon Rank Sum test), consistent with the paucity of small vessels in the brain9. In contrast to these regional differences, we observed that vascular cell fractions did not differ by sex, AD pathology, age, or post-mortem interval (PMI) (Extended Data Fig. 2b–h; FDR<0.05 by Wilcoxon Rank Sum test). We also found no statistically significant differences in vascular fractions between this study and the other datasets10–12 ( Supplementary Fig. 2a), suggesting the cell capture rate is similar across different studies when there is no enrichment for vascular cells. We also found no significant correlation between the number of detected genes or captured cells and cell fraction (Supplementary Fig. 2b–e). However, we found a significantly higher proportion of fibroblasts (Fib1 and Fib2) in this study in both hippocampus and frontal cortex (Extended Data Fig. 2i–j; FDR<0.05 by Wilcoxon Rank Sum test, Methods) compared with a vessel-enrichment dataset, suggesting that the capturing of perivascular-like fibroblasts might be sensitive to the techniques.
In addition, we found that vasculature cells showed extensive gene expression differences between brain regions, with 1,745 differentially-expressed genes between brain regions (brDEGs) in the six cell types that had enough cells from each region to be included in this analysis, showing many region-specific pathway enrichments, highlighting the regional heterogeneity of the BBB (Extended Data Fig. 3, Supplementary Table 4–5, Methods).
Cell-type-specific brain vasculature changes in AD
To investigate the vascular gene expression association with AD, we identified 2,676 differentially expressed genes (adDEGs) between AD and control individuals by combining the cells from different brain regions across all cell types (306 on average for each cell type) using a single-cell-based method with the consideration of covariates. This number of adDEGs is significantly more than expected by permutation analysis (t-test p-value=0.007, Extended Data Fig. 4a, Methods) and confirmed at the pseudo-bulk level (Extended Data Fig. 4b, Methods). Of these, 2,142 were unique to only one cell type, highlighting the cell-type-specificity of adDEGs (Fig. 2a–b, Supplementary Table 6). Notably, capillary endothelial cells had the highest number of adDEGs, which we recapitulated through a downsampling analysis (Extended Data Fig. 4c), suggesting the importance of transcriptional differences in capillary endothelial functions associated with AD pathology (Fig. 2a).
Figure 2.
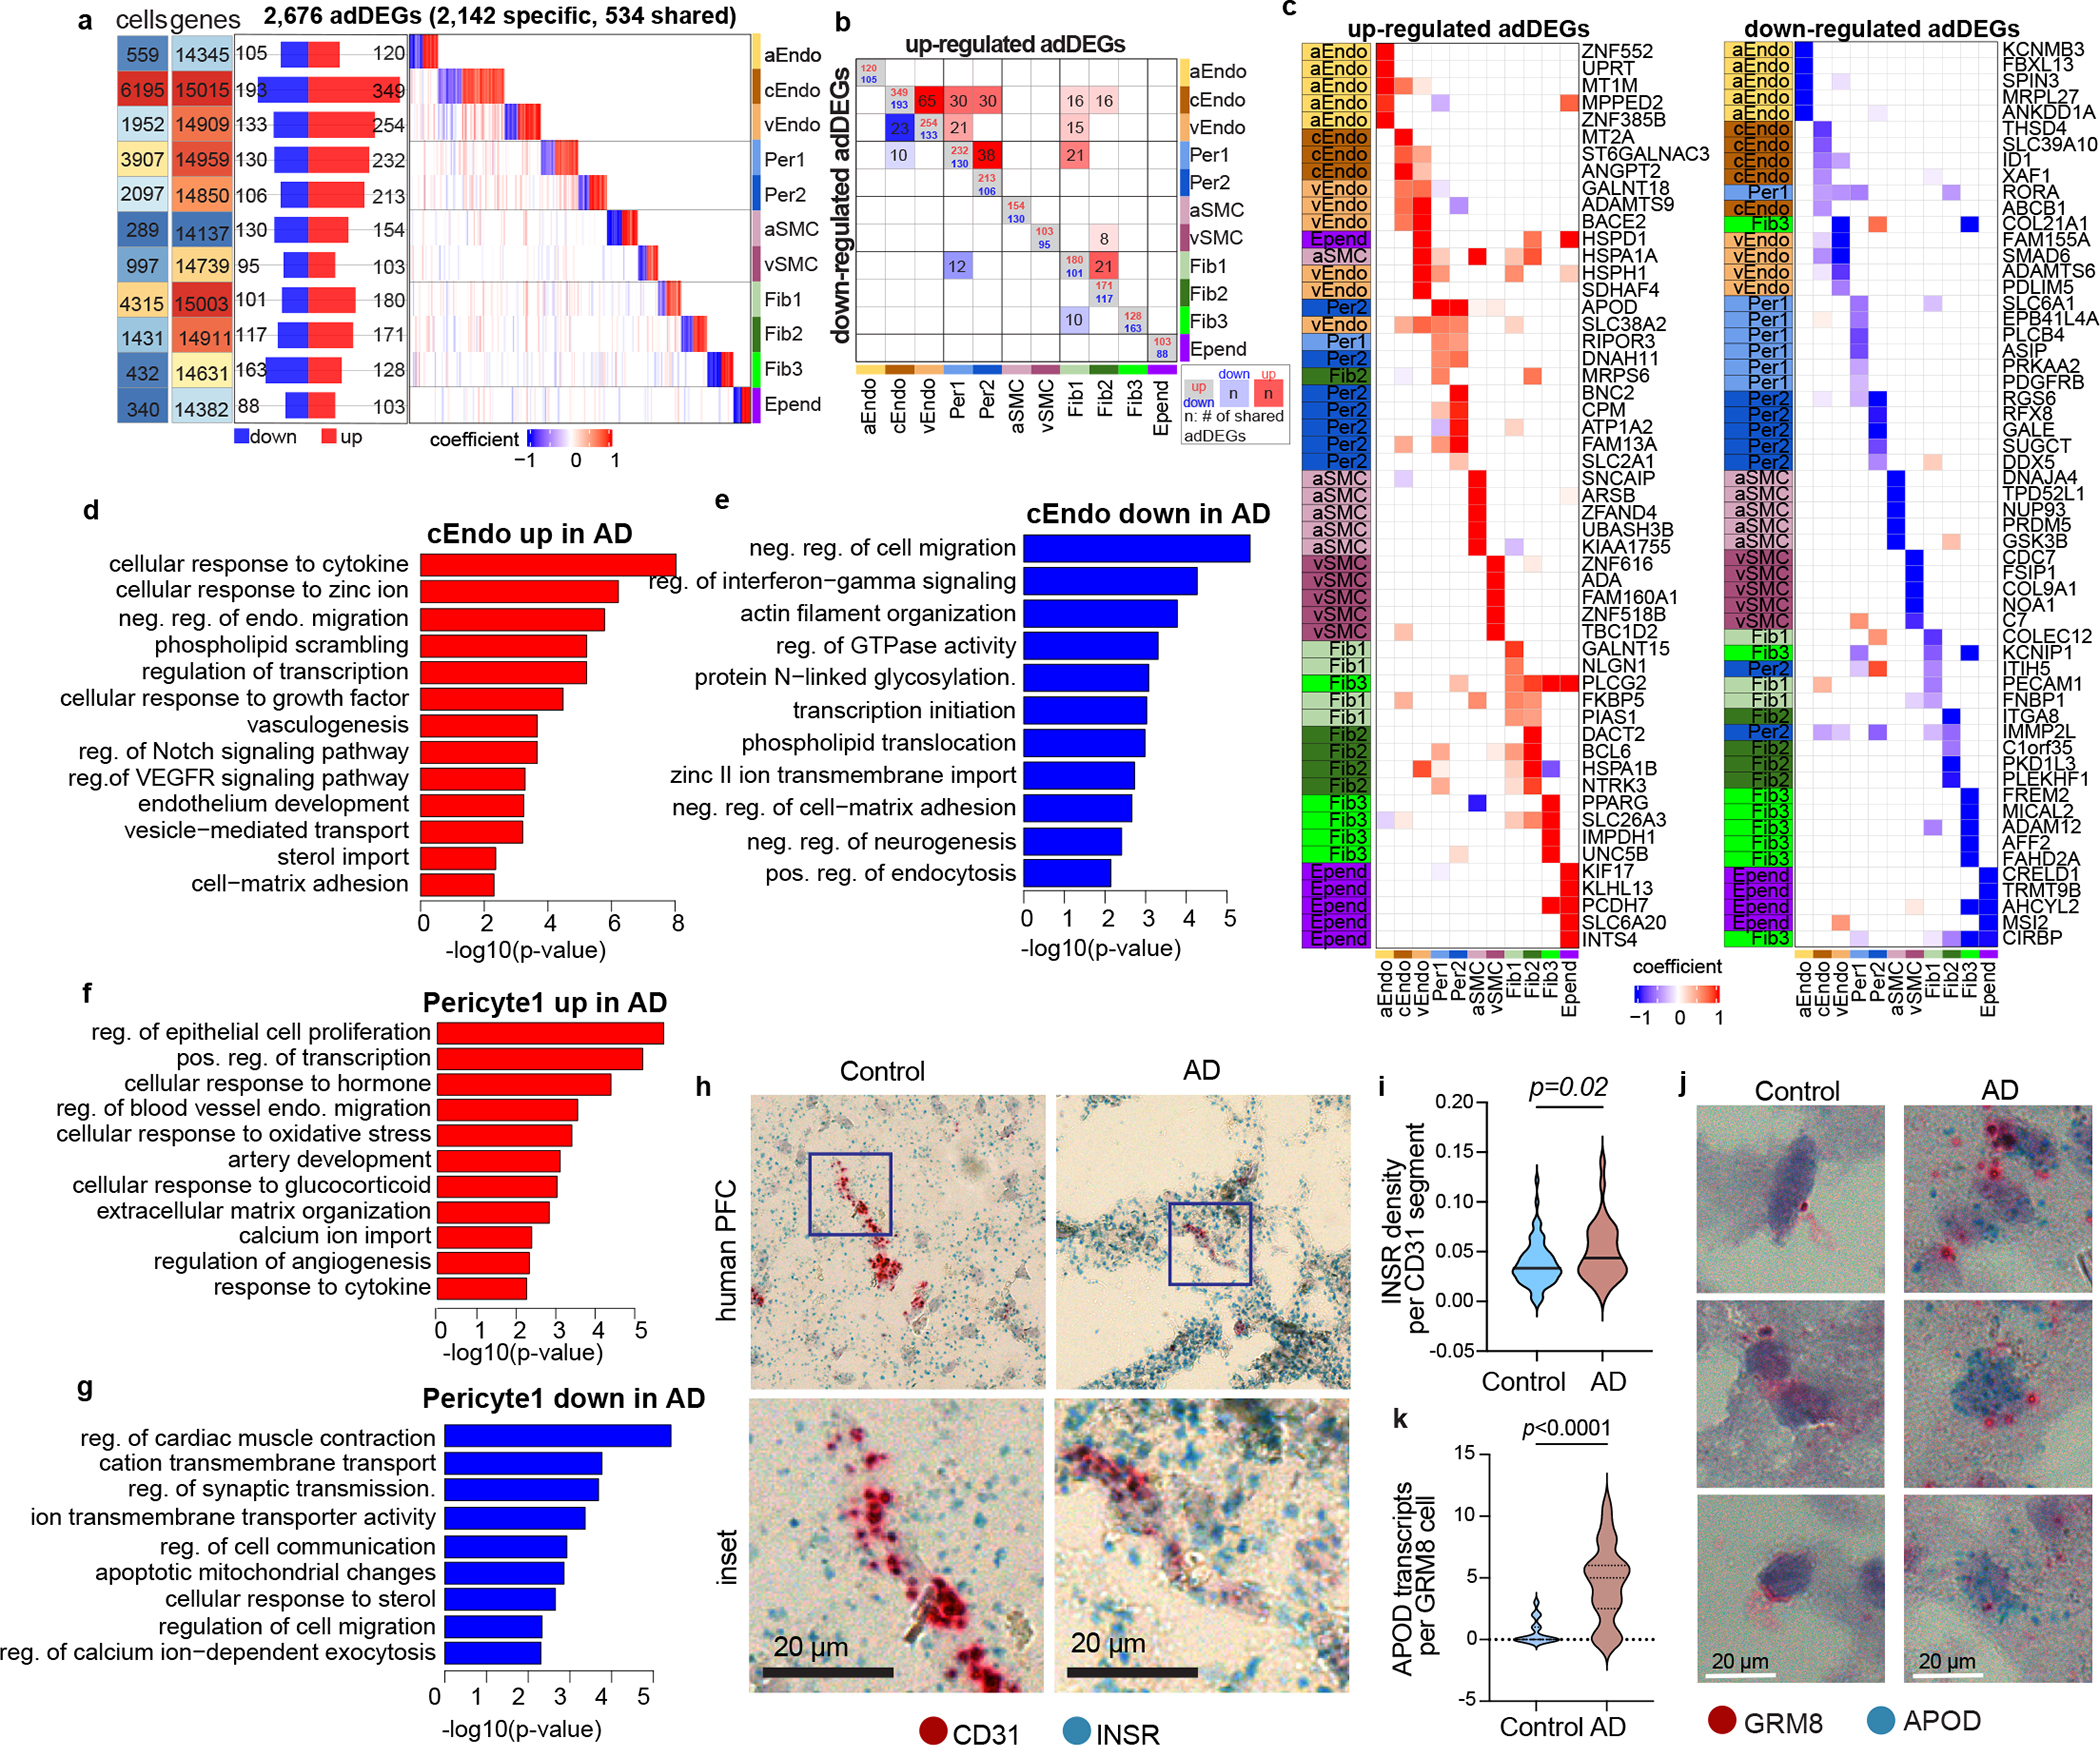
Cell-type-specific brain vasculature changes in AD. a. Overview of adDEGs in each cell type. From left to right panels, it shows the numbers of cells and expressed genes in each cell type, the number of down-regulated and up-regulated adDEGs in AD, and the heatmap with each gene in column and each cell type in row. b. The number and significance of adDEGs overlap between cell types in both directions (upper triangle: upregulated adDEGs; lower triangle: down-regulated adDEGs). The blocks with blue or red shade represent the significant overlap. More dark, more significant. c. Top5 up- and down-regulated adDEGs in AD in each cell type. The highest effect size for each gene is colored by the cell type on the left column of the heatmap. d-g. Enriched Gene Ontology biological processes in upregulated (d) and down-regulated (e) adDEGs in capillary endothelial cells (cEndo), upregulated (f) and down-regulated (g) adDEGs in Per1. Enrichr in R was used to perform GO enrichment (proportion test, adjusted p-value < 0.05 as cutoff). h-i. Representative images (h) and quantification (i) of INSR transcripts in CD31+ endothelial cells from control and AD prefrontal cortex tissues by RNA in situ hybridization (t-test, adjusted p-value < 0.05). n=4 for AD and n=4 for nonAD individuals. j-k. Representative images (j) and quantification (k) of APOD transcripts in GRM8+ pericytes from control and AD prefrontal cortex tissues by RNA in situ hybridization (t-test, adjusted p-value < 0.05). n=4 for AD and n=4 for nonAD individuals.
Among the top adDEGs are cell junction and adhesion associated genes including APOD, PECAM1, and COLEC12; transporters including SLC38A2, SLC2A1 and SLC6A1; and sterol-import associated genes including RORA, PRKAA2, and PPARG (Fig. 2c), indicating that these fundamental functions of vascular cell types may be dysregulated in AD. As expected, we detected downregulation of PDGFRB in pericytes of AD samples (Fig. 2c), alluding to pericyte injury and dysfunction of BBB integrity in AD1,13. We also found that ABCB1, encoding P-glycoprotein, was significantly down-regulated in capillary endothelial cells (Fig. 2c), consistent with its role in amyloid-β clearance in the neurovascular unit in AD14 and the observations that individuals with early AD develop widespread reductions in P-glycoprotein BBB function in multiple brain regions15.
To evaluate if these adDEGs are consistent across six brain regions, we identified adDEGs for each region and found significant overlap of adDEGs between regions in six cell types that had enough cells for analysis (Extended Data Fig. 4d, Methods). Notably, the three cell types with the highest number of cells (cEndo, Per1 and Fib1) showed the most overlap. Further research with more cells from each brain region would improve the power to detect region-specific transactional changes in AD.
Gene Ontology enrichment analysis of adDEGs showed that multiple broad functional pathways were shared across cell types, suggesting that transcriptional changes in AD converge to common functionalities at the pathway level, however multiple pathways were more cell-type specific (Fig. 2d–g, Extended Data Fig. 5a–b, Supplementary Table 7, Methods). For example, we found immune response (cytokine, IL-17 signaling, and inflammatory response) was broadly enriched in fibroblast, endothelial cell, and pericyte upregulated adDEGs, suggesting the potential inflammatory microenvironment in AD individuals. We found that synaptic transmission, cytoskeleton remodeling and contraction were specially enriched in pericyte down-regulated adDEGs, consistent with loss of neuronal signal sensing and impaired blood flow control in AD pericytes16,17.
Notably, our analysis revealed that insulin signaling genes were dysregulated in AD across multiple cell types (cEndo, pericyte, fibroblast, SMC and ependymal, Extended Data Fig. 4d). To validate our snRNA-based observation that INSR, encoding insulin cognate receptor, was upregulated in endothelial cells from AD individuals (P < 0.0019), we performed RNA in situ hybridization (Methods)18, and found CD31+ vascular segments harbored a higher density of INSR1 transcripts in AD individuals. We found a subset of CD31+ endothelial cells from AD brains possessed higher density of INSR+ punctae (Fig. 2h–i). These suggest that subsets of endothelial cells may express differential levels of the insulin receptor, potentially rendering cells more or less sensitive to insulin signaling. We also observed that APOD, encoding a component of high-density lipoprotein (HDL), was up-regulated in AD mural cells (particularly pericytes, P < 3.9e-12, Fig. 2c), consistent with the previously-reported upregulation of APOD in AD19. To validate upregulation in AD pericytes, we quantified APOD transcript abundance in GRM8-labeled cells (a previously-validated marker for pericytes4 that is not significantly differentially expressed in AD) using in situ hybridization and observed higher APOD expression in GRM8+ pericytes in AD individuals (Fig. 2j–k). We did not use PDGFRB as a pericyte marker as it is downregulated in AD (Fig. 2c). The functional consequences of APOD’s upregulation in pericytes, and impacts on lipid transport within the neurovascular unit, will form the basis of future studies. Additionally, we validated the downregulation of SLC6A1 in AD pericytes (ABCC9 as marker) using RNAscope (Extended Data Fig. 6a–b) and upregulation of COL4A1 (encoding Collagen4) in endothelial cells of AD at the protein level using immunohistochemistry staining (Extended Data Fig. 6c–d).
Our results show no significant change in vascular cell proportions between non-AD and AD individuals (Extended Data Fig. 2d–f), and in fact a modest but non-significant high in the median number of capillary endothelial cells and pericytes in AD individuals, consistent with an observed higher proportion of endothelial cells in AD in two recent studies10,20 that also did not rely on any vessel-enrichment protocols. However, we found that several of our downregulated adDEGs were cell-type marker genes, including PDGFRB (pericytes), ABCB1, ATP10A, PTPRB and TEK (capillary endothelial cells), suggesting potential loss of vascular cell type integrity in AD. Such loss of vascular integrity, and decreased expression of cell-type-specific markers, could result in an apparent decrease in vascular cell proportions in studies that rely on enrichment protocols.
Upstream regulators of differentially expressed genes in AD
To gain insights into the transcriptional regulatory mechanisms, we inferred upstream regulators of adDEGs, including transcription factors, co-factors, and epigenetic enzymes (Methods, Supplementary Table 8). We identified 118 upstream regulators of upregulated adDEGs (Fig. 3a) and 81 regulators of downregulated adDEGs (Fig. 3b), of which 66 targeted both up- and downregulated adDEGs across cell types. Seventeen of these 133 regulators were themselves significant adDEGs corresponding to the differential direction of their targets.
Figure 3.
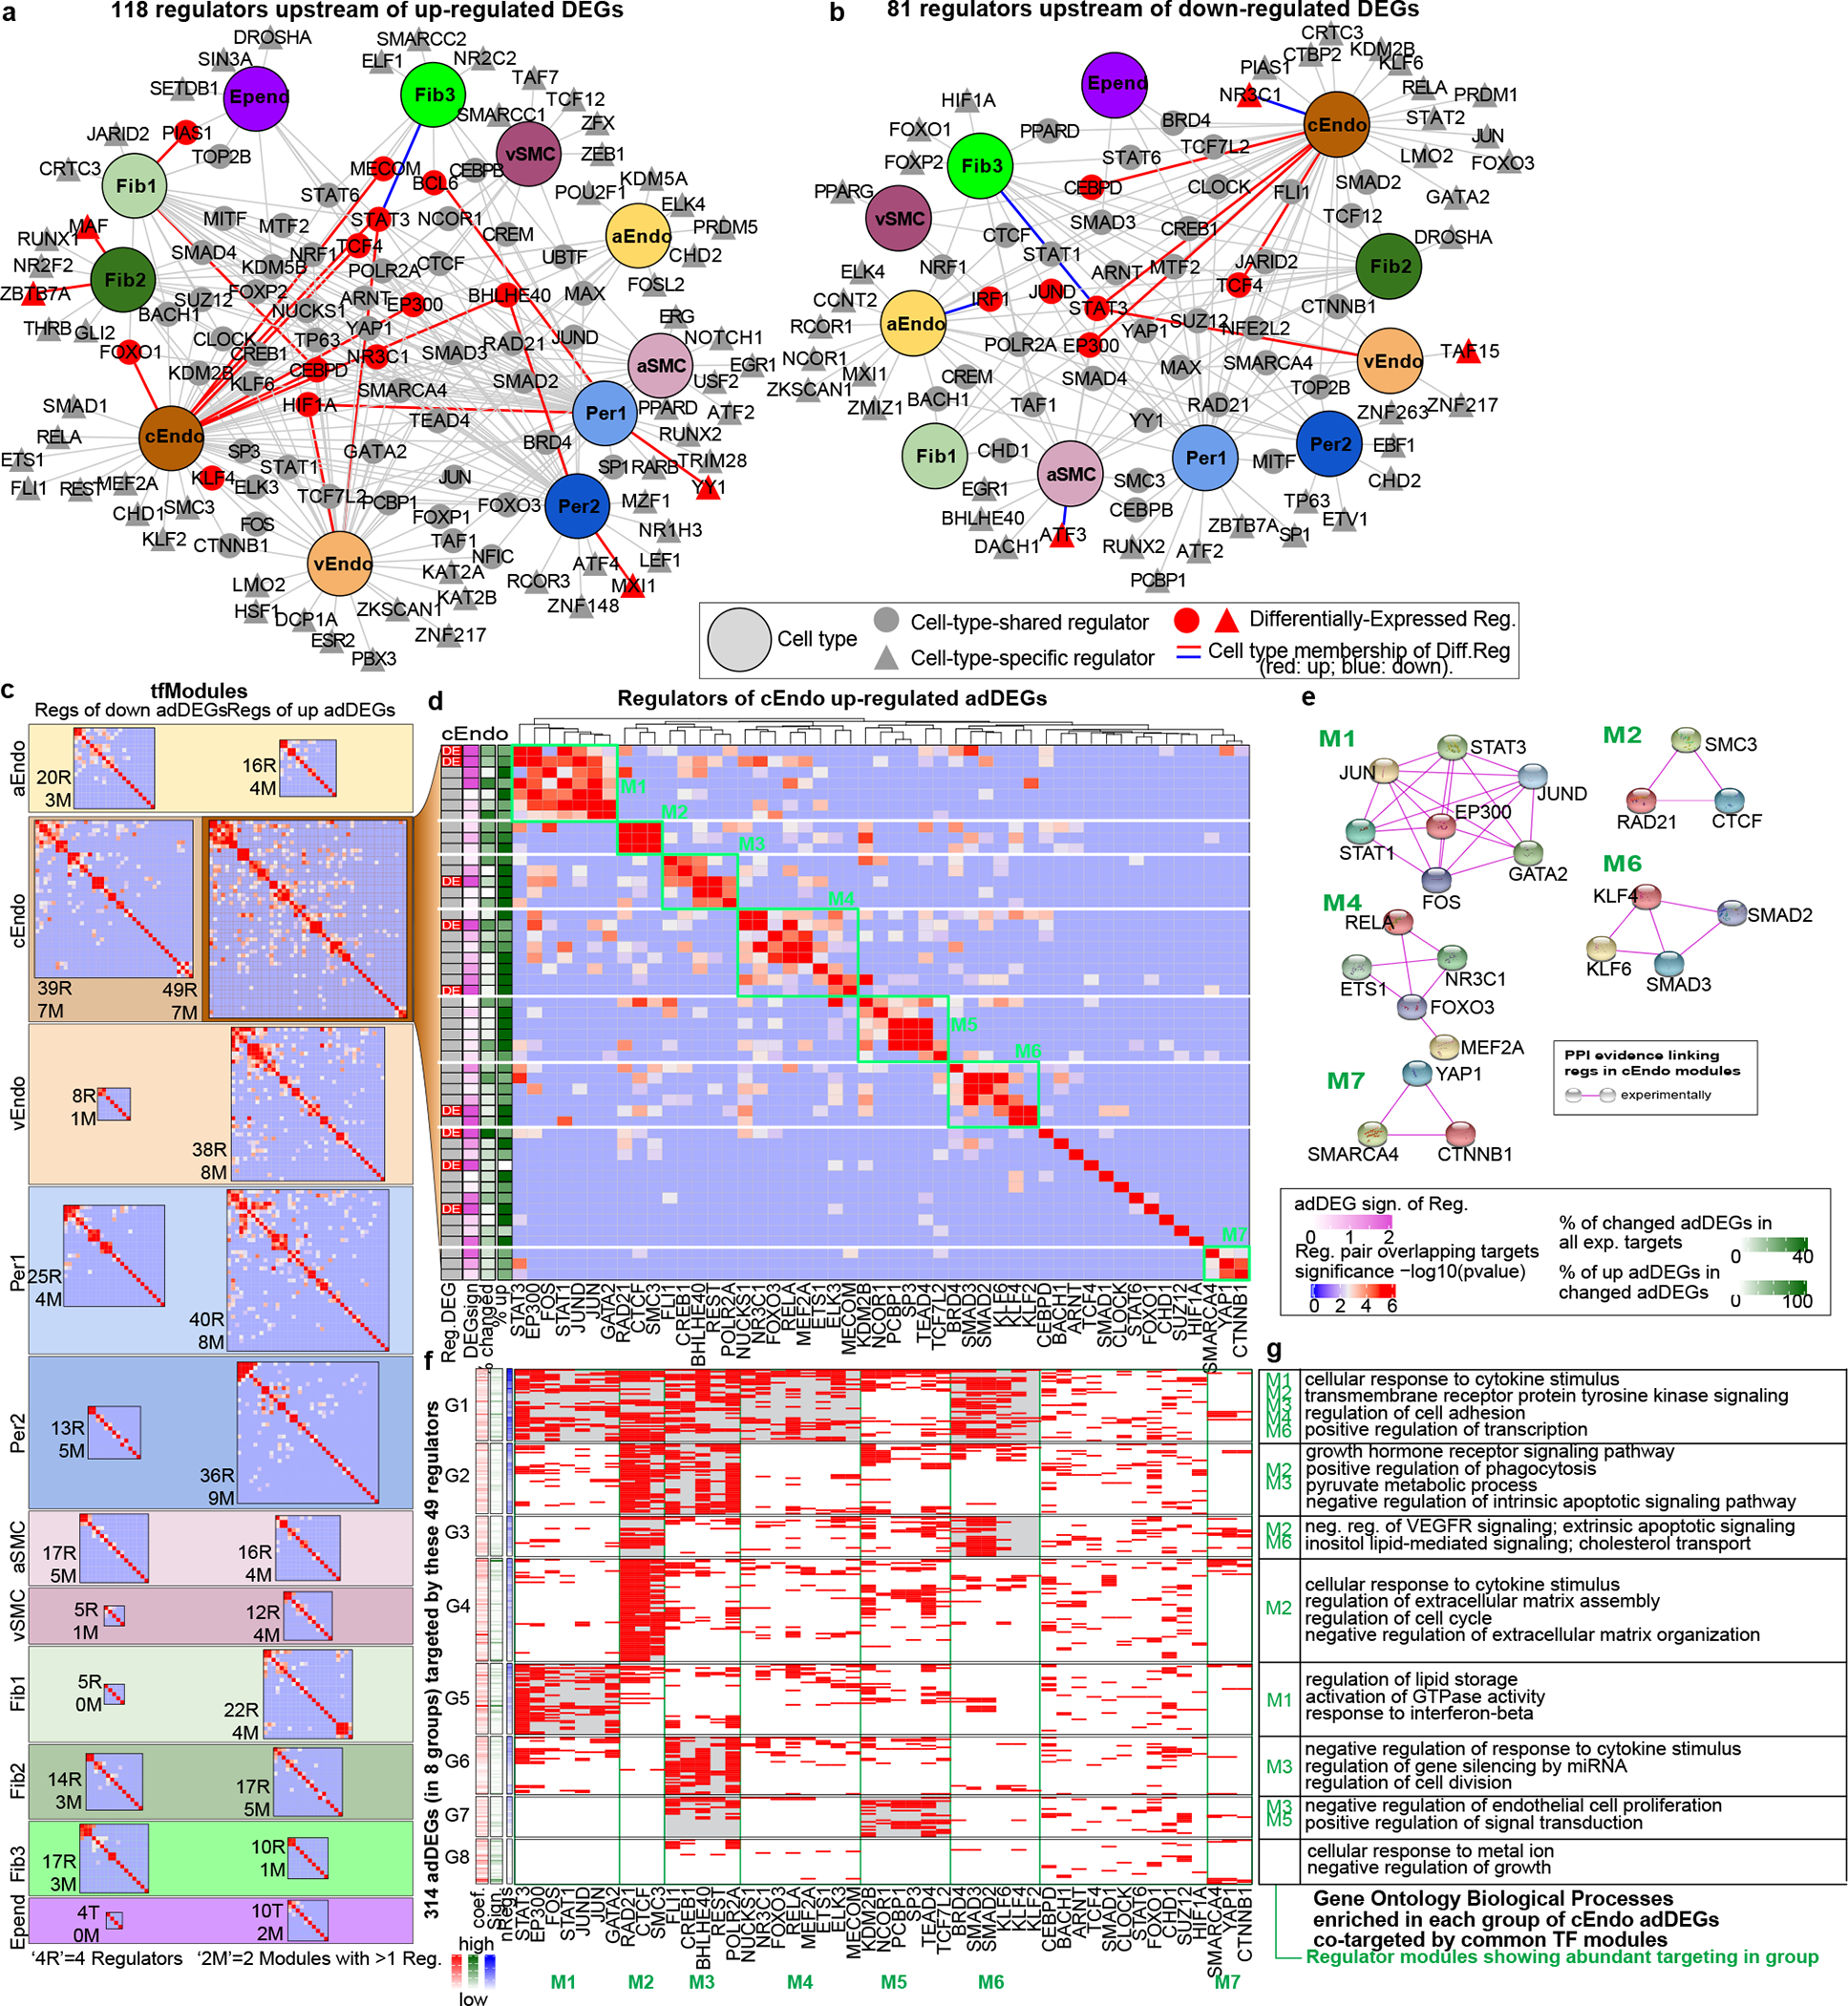
Upstream regulators of differentially expressed genes in AD. a-b. Regulator-cell type networks in upregulated (a) and down-regulated (b) adDEGs. Enrichr is used to predict regulators (proportion test, adjusted p-value < 0.05 as cut-off). The large nodes represent cell types. Triangle nodes represent cell type specific regulators. Gray nodes represent regulators with expression but not differentially expressed. Red nodes represent differentially expressed regulators. Red edges represent the corresponding differentially expressed regulators in relevant cell types. c. Overview of heatmaps to show co-regulatory tfModules for all adDEGs sets (up and down for each cell type). For each cell type, there are two heatmaps to show the tfModules (up adDEGs and down adDEGs). The size of each heatmap reflects the number of regulators. The values in the heatmap are −log10(p-value) to represent the significance of overlapping targets between regulators as (d). Fisher’s exact test is used (adjusted p-value < 0.05 as cutoff) d. Co-regulatory modules of upregulated adDEGs in capillary endothelial cells (cEndo). Seven modules are boxed in green. The values in the heatmap are the significance of overlapping targets between regulators (−log10(p-value)) as (c). On the left, column 1: the regulator is differentially expressed; 2: differential significance ; 3: the percentage of targeted adDEGs in all targets of each regulator and the percentage of targeted upregulated adDGEs in all targeted adDEGs. e. Physical protein-protein interaction networks for 5 of 7 co-regulatory modules. f. Heatmap showing the eight adDEG groups that were targeted by regulators shown in (d). Red indicates that a gene in a row is targeted by the regulator in the column. The gray shaded blocks highlight the regulation of specific co-regulatory modules on
We next grouped these regulators into co-regulatory modules (defined as tfModules) for each cell type (Fig. 3c, Extended Data Fig. 7) when regulators showed significant sharing of target genes. Focusing on upregulated adDEGs in capillary endothelial cells (cEndo), which showed the largest number of adDEGs and upstream regulators, we identified seven regulatory tfModules (Fig. 3d) encompassing 38 regulators, and 11 regulators outside tfModules. Although our tfModules were discovered solely based on their shared target genes, 5 of 7 modules were additionally supported by independent experimental evidence of physical interactions21 (Fig. 3e), which were significantly enriched by a permutation test (FDR < 0.05, Methods). Moreover, regulators in the same tfModule were frequently found to have related functions; for example, Module M1 regulators have roles in vascular endothelial cell function, growth, and adhesion22–30.
Within each tfModule, regulators varied in their number of target genes, their differential expression in AD, and the differential expression of their targets (Fig. 3d, left). For example, in tfModule 4, MECOM, which has been linked to high expression in vascular endothelial cells31 and AD-association31, showed a 1.37-fold upregulation in AD (P=8.8e-6) and 53 adDEG targets, with 100% of those targets upregulated in AD. In tfModule 6 (KLF and SMAD family), KLF4, which has been linked to anti-inflammatory properties in endothelial cells32, showed a 1.21-fold down-regulation in AD (P=8.2e-4) and 47 (100% upregulated) adDEG targets, suggesting the activation of inflammatory response in AD. Not all regulators in each tfModule were themselves DEGs, suggesting that some regulators may act through collaboration with differentially-expressed regulators; for example, STAT3 and EP300 are significant adDEGs in module M1, but JUN, JUND, and GATA2 are not.
We used these tfModules to partition their target adDEGs into sub-groups, mediated by distinct combinations of tfModules (Methods). For cEndo up-regulated adDEGs, we found groups targeted by a single tfModule (e.g. G4, G5, G6), and other groups targeted by multiple tfModules (e.g. G1, G2) (Fig. 3f), with distinct enrichments in common functional categories (Fig. 3g). For example, tfModule 2 (chromatin modulators, RAD21, CTCF, SMC3) targeted 58% of upregulated adDEGs (groups G1-G4), consistent with the known role of these regulators on chromatin structure maintenance33. Conversely, adDEGs in G1 were targeted by regulators from most tfModules (M1-M4, M6) and were significantly enriched in cytokine response, cell adhesion, and transcription regulation. Genes in several groups (G3, G7, G8) were enriched in repression of endothelial cell proliferation and apoptotic signaling pathways, suggesting endothelial injury response in AD, consistent with BBB breakdown.
Dynamics of cell-cell communications in AD
We next sought to understand the mechanistic basis of vascular communications with glia or neurons in the neurovascular unit and how this communication is altered in AD. We predicted bidirectional cell-cell communication between vascular and neuronal or glial cells using covariation analysis of gene modules (defined as degModules) across 409 individuals (Extended Data Fig. 8a, Methods). We identified 301 upregulated interactions in AD, where one or both interacting degModules showed upregulation in AD, and conversely 276 downregulated interactions in AD, where one or both interacting degModules showed decreased expression in AD(Fig. 4a–b, Supplementary Table 9). We found that the communications from Per1 and cEndo to neurons, microglia, and astrocytes dominate the increased cell-cell interactions in AD, while communications from astrocytes and neurons to cEndo and Fib1 are mainly decreased in AD.
Figure 4.
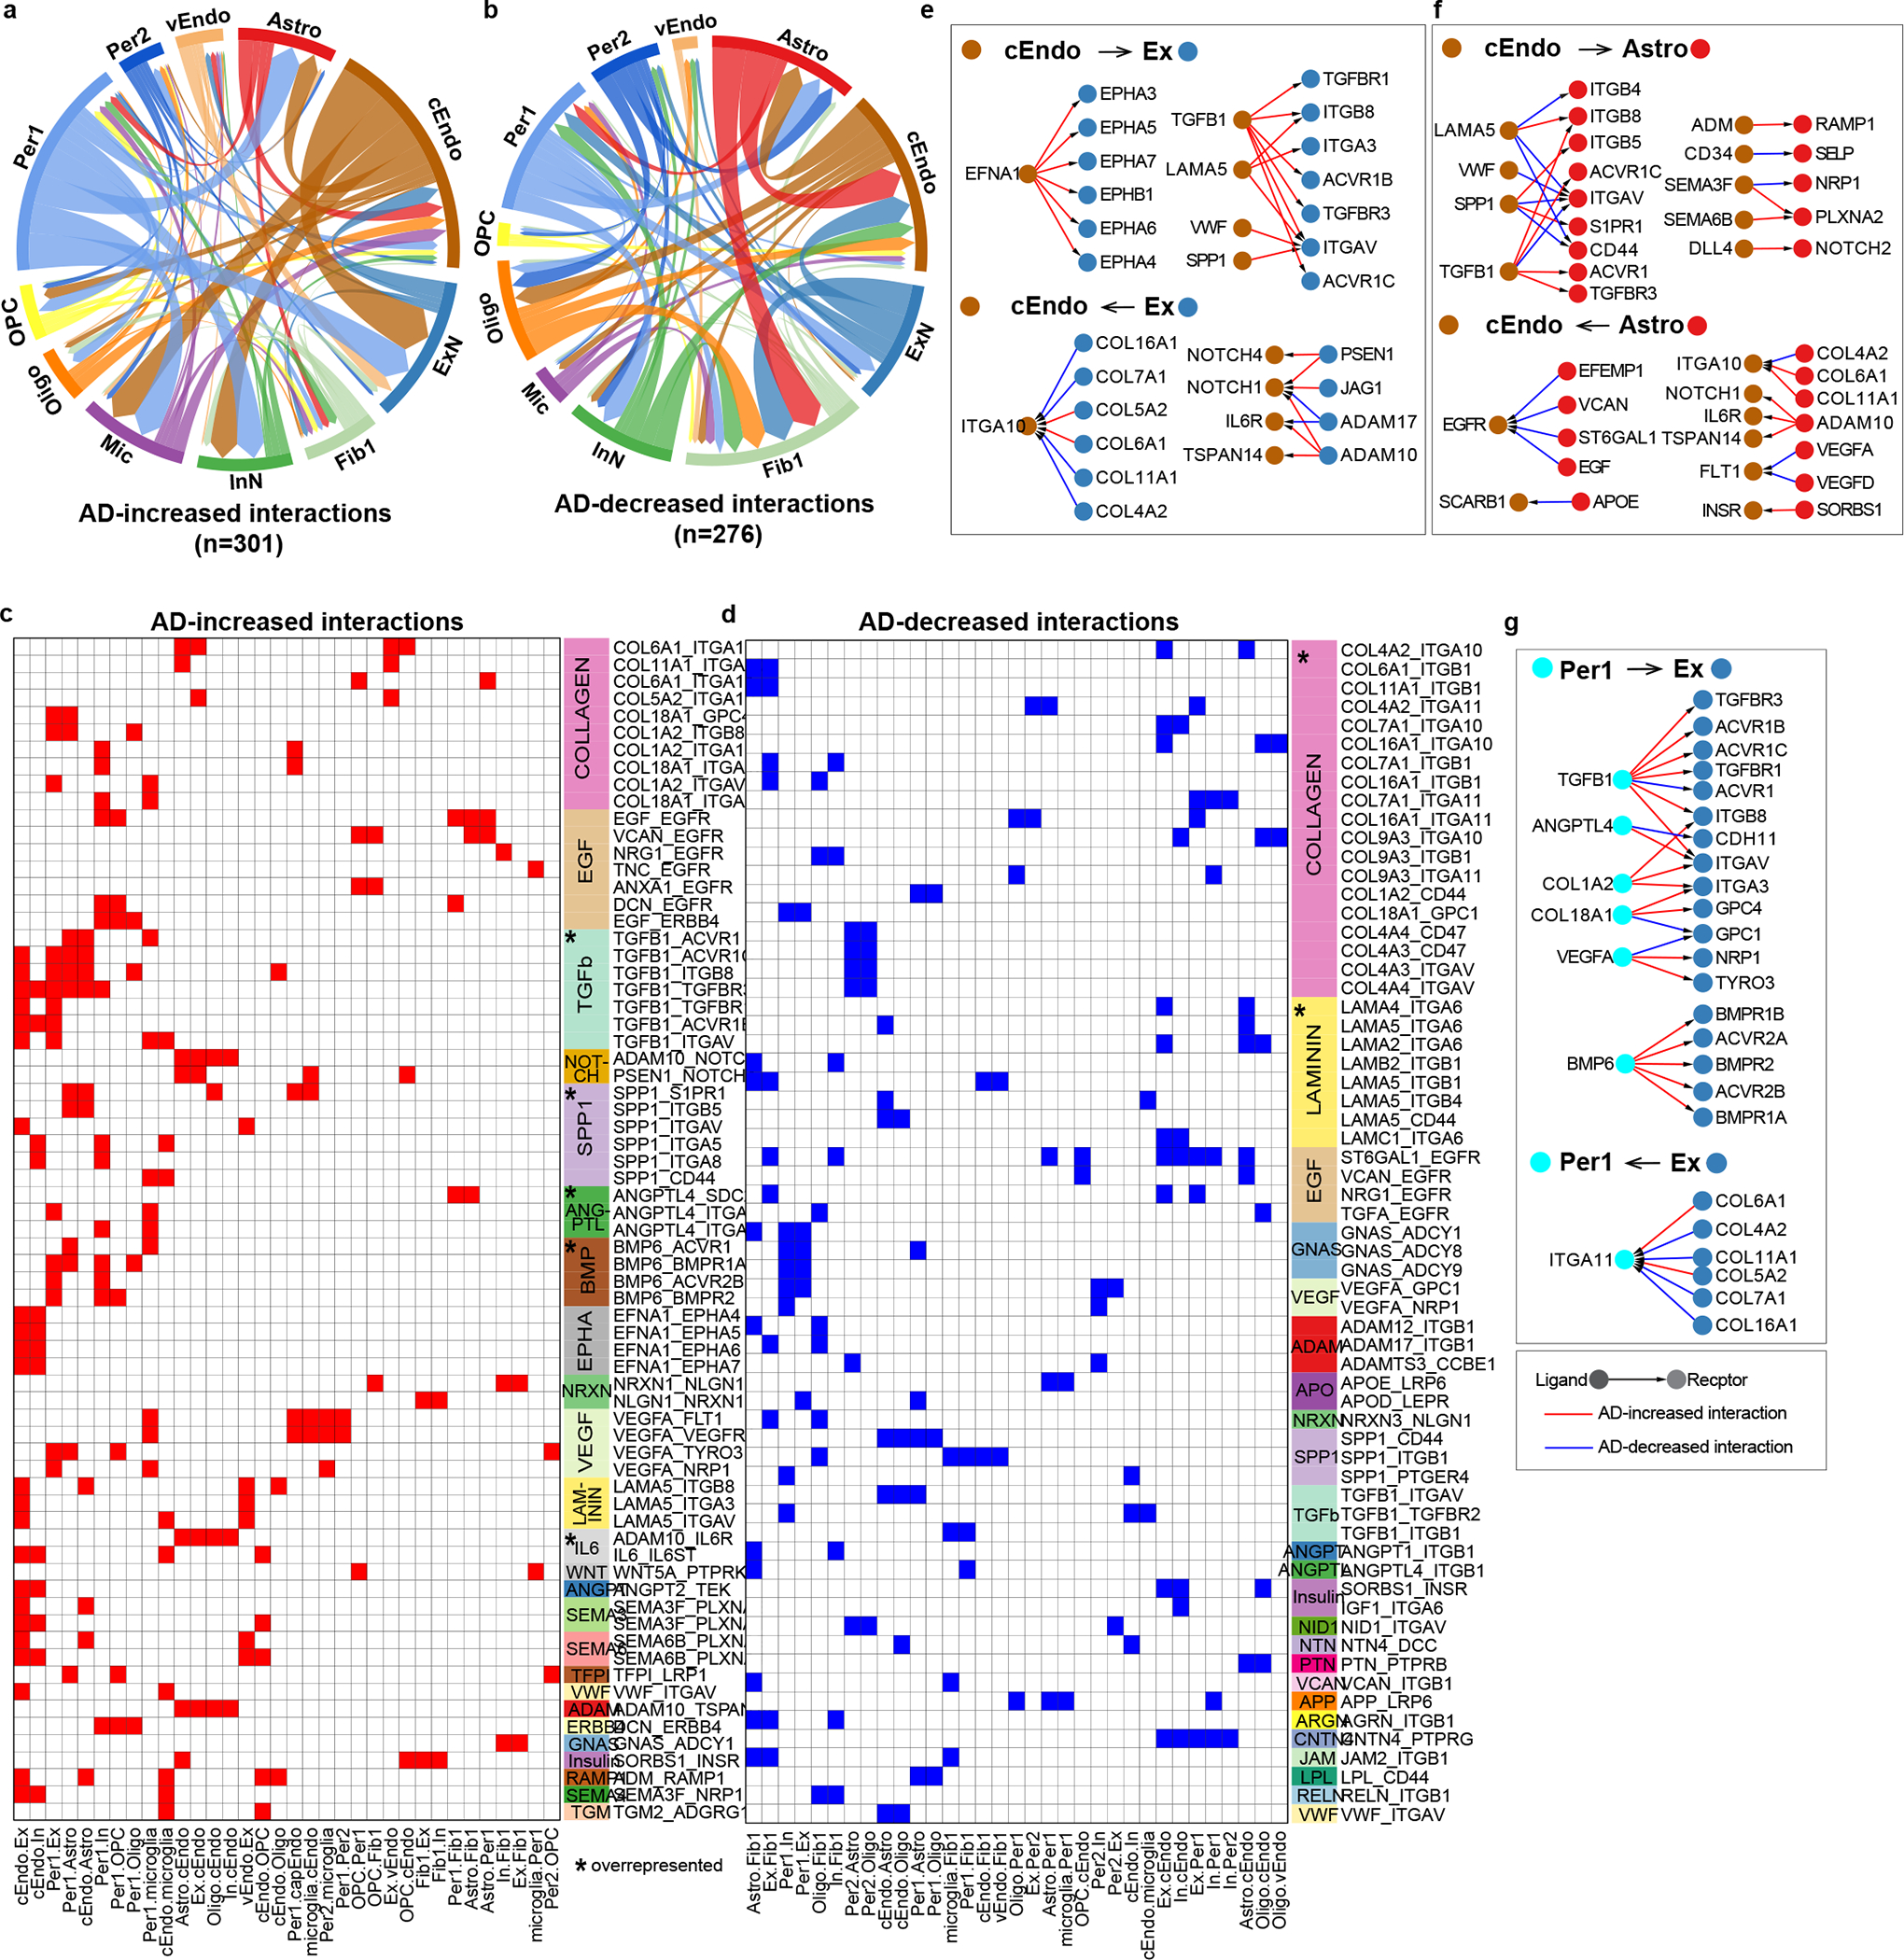
Dynamics of cell-cell communications between vascular cell types and neuron/glial cells in AD. a-b. Summary of Increased (a) and decreased (b) interactions in AD mediated by ligand-receptor signaling between vascular cell types and neuron/glial/microglial cell types in AD. The arrow represents the direction of cell-cell interactions. The width of the edge reflects the number of interactions (the number of ligand-receptor pairs) between two cell types. c-d. Ligand-receptor pairs (row) in each pair of cell types (column) for increased (c) and decreased (d) interactions in AD. The signaling pathway is shown on the right of the heatmap. The star in the signaling pathway column indicates that the signaling pathway was significantly overrepresented (Fisher’s exact test, p-value < 0.01 as cutoff, two-sided). e-g. The ligand-receptor networks in three pairs of interacting cell types: cEndo-Ex (e), cEndo-Astro (f), and Per1-Ex (g). Ligand-receptor interactions with direction were shown in the network. The color of nodes represents the cell type. Red edges represent AD-increased interactions, while blue edges are for AD-decreased interactions.
To characterize ligand-receptor signaling pathways for these differential cell-cell communications, we aggregated individual interactions mediated by the same ligand-receptor pair, and classified the ligand-receptor pairs into 62 signaling pathways based on KEGG, ligand family, and receptor family annotations (Methods). The signaling pathways mediated by TGF-β, SPP1, BMP, ANGPTL and IL6 are significantly overrepresented for AD-increased interactions, while collagen and laminin, the major ECM proteins forming the basement membrane of the BBB34, are overrepresented for AD-decreased interactions (Fig. 4c–d, Supplementary Table 9, Methods), suggesting a disruption of BBB structure in AD.
We performed a permutation test (adj.p value < 0.01, Extended Data Fig. 8b, Methods) and found that most bidirectional cell-cell interaction changes in AD for each pair of cell types were significant, suggesting that the dysregulated genes in AD are highly related to multicellular interactions. We next separated the bidirectional AD-differential cell-cell interactions into “forward” and “reverse” directions for each pair of cell types and quantified them. Interactions between cEndo/Per1 and excitatory neurons/astrocytes show the most interactions (Extended Data Fig. 8c–d). We then built ligand-receptor networks for the three cell-cell pairs with the largest number of interactions (cEndo-Ex, cEndo-Astro, and Per1-Ex) to highlight specific ligand-receptor signaling pathways (Fig. 4e–g). For example, TGFB1, which has been shown to exacerbate BBB permeability and regulate pericyte inflammatory response35,36, wass highly expressed in capillary cell types in AD (cEndo and Per1), and mediated communications with excitatory neurons (Fig. 4e,g). BMP6 mediates the AD-increased interactions between pericytes (Per1) and excitatory neurons (Ex), suggesting its function in pericytes governing impaired neurogenesis in AD37. The AD-decreased interactions between astrocyte and capillary endothelial cells mediated by EGF signaling pathways suggest inhibition of capillary endothelial proliferation in AD38 (Fig. 4f).
AD GWAS loci linked to brain vascular adDEGs
We next sought to gain insight into how AD risk loci may lead to vasculature breakdown at the molecular level. We integrated AD-associated loci from genome-wide association studies (GWAS)39–41 with our adDEGs (Fig. 5a) to predict their candidate target genes and directionality of effect (up- or downregulated in AD) (Fig. 5b), their cell types of action (Fig. 5c,d), and the direct (Fig. 5a–g) or indirect (Fig. 5h–j) mechanisms through which they can lead to vascular gene expression changes (Extended Data Fig. 9a).
Figure 5.
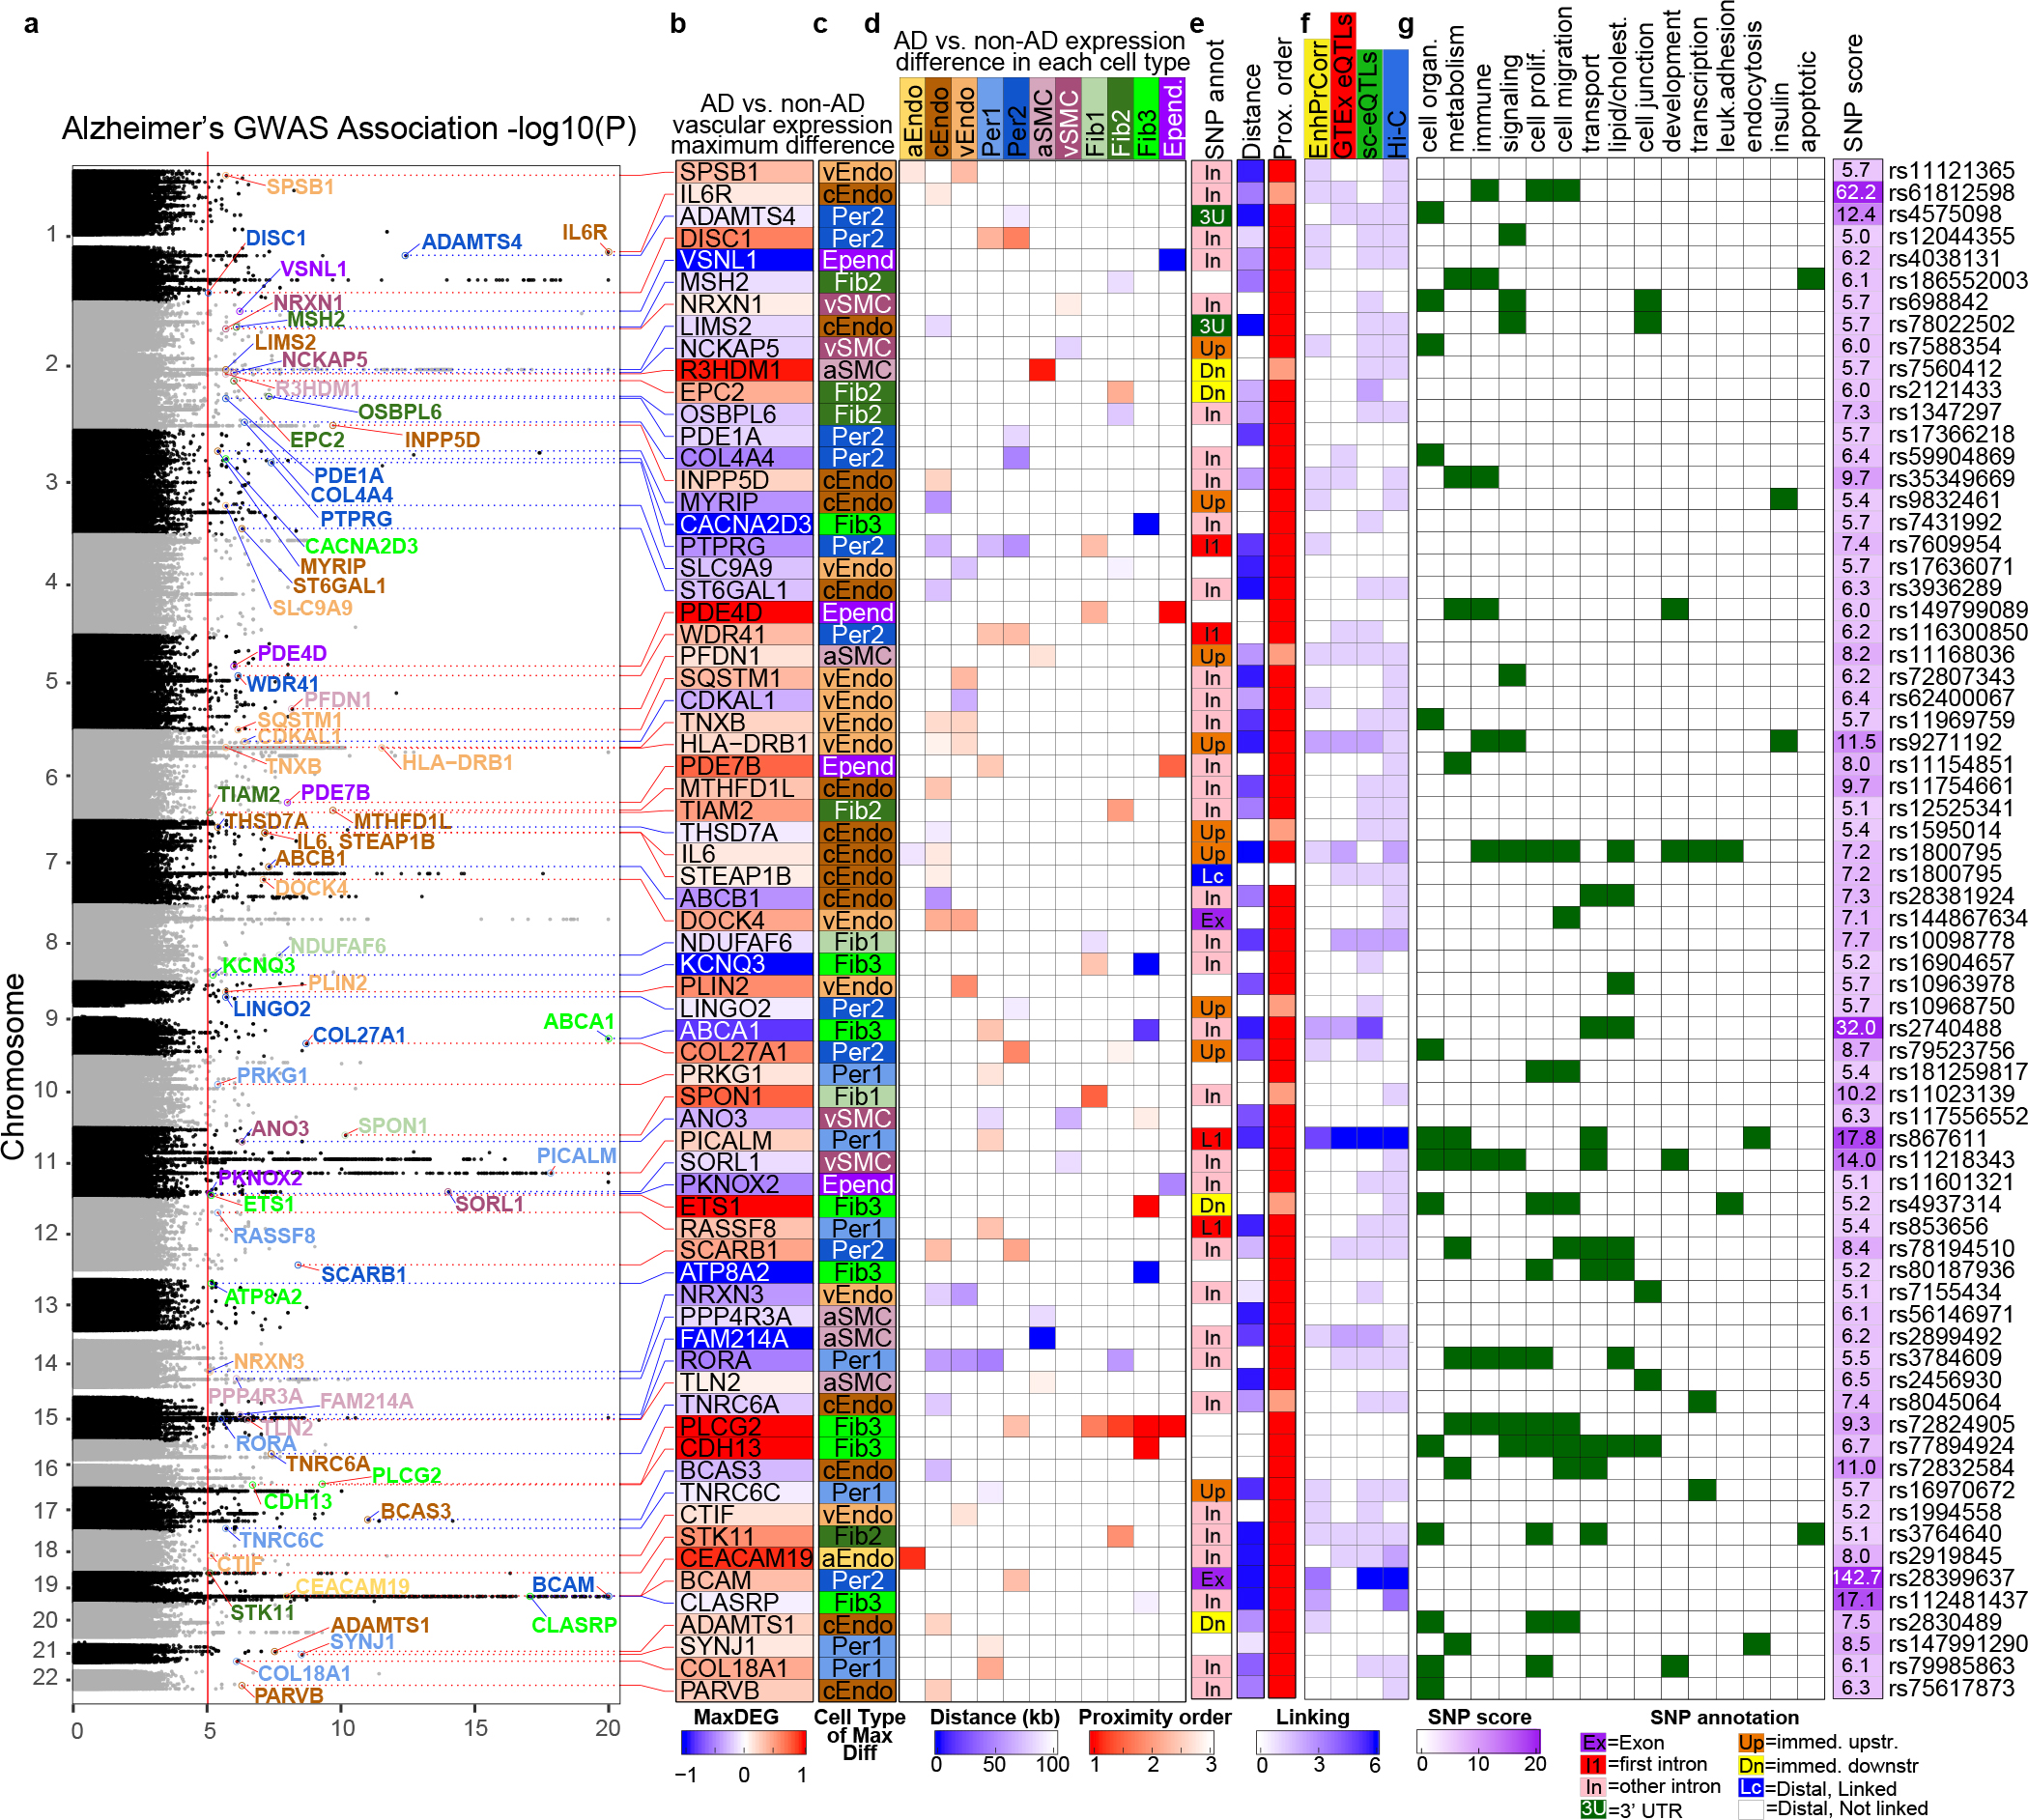
AD GWAS loci directly linked to brain vascular adDEG. a-g. Direct (cis) regulated adDEGs by AD-associated variants. Shown are the AD GWAS loci associated with significant adDEGs. a. Gene names with the maximum effect size for a given AD GWAS loci are labeled on the plot. The color of the lines connecting the gene names in (a) and (b), and the shade of the box in the heatmap in column (b) indicate direction of regulation in AD. c. The cell-type in which the largest differential expression occurs.d. Heatmap showing differential expression across all cell types represented by effect size. e. Left column: the genomic annotation for SNPs of the adDEGs; middle column: heatmap of the distance between variant and adDEG transcription starting site (TSS) in kb; right column: the rank of adDEG among all associated genes of the specific variant in terms of proximity. f. Heatmap showing four pieces of linking evidence, values are the number of appearances in the used datasets. g. Heatmap to highlight the enriched functions of adDEGs. Rightmost column shows the SNP score represented by −log10 (p-value) of the variants in AD.
First, we focused on direct regulation of vascular adDEGs by nearby genetic variants (“cis-regulation”), and found 197 AD-associated variants in 113 loci42,43 (P<10−5) (Fig. 5a) proximal to 125 vascular adDEGs (Fig. 5b, Supplementary Table 10) that show cell-type-specific expression alterations (Fig. 5c,d). Most adDEGs harbored AD-associated variants within their introns (54.3%), or immediately upstream/downstream with no intervening gene (7.13%) (Fig. 5e), or were linked based on distinct evidence(Fig. 5f, Methods). These AD-associated adDEGs were enriched in multiple processes including cholesterol transport, regulation of endothelial cell migration, and IL6 mediated signaling (Fig. 5g).
We found that 21 GWAS loci were associated with lipid and cholesterol metabolism adDEG genes, consistent with broad dysregulation of brain cholesterol homeostasis in AD44For example, RORA was previously-shown45 to regulate pathological retinal angiogenesis by repressing the inflammation repressor SOCS3, which is itself also upregulated in capillary and venule endothelial cells in AD in our data (Fig. 5b and Extended Data Fig. 10b). ABCA1 (Fig. 5b and Extended Data Fig. 9c), was linked to four AD-associated intronic variants and upregulated in AD pericytes, causing increased pericyte cholesterol efflux to ApoE46. SCARB1 was linked to its own AD-associated intronic variant (rs78194510) (Fig. 5b and Extended Data Fig. 9d), highly expressed in capillary endothelial cells and pericytes in AD, and shown to mediate HDL signaling in endothelial cells47,48.
We also found that nine AD GWAS loci were associated with immune response, insulin secretion, and neurodegenerative pathogenesis, including: IL6 and IL6R (Fig. 5b and Extended Data Fig. 9e) were highly expressed in capillary endothelial cells of AD individuals, suggesting immune response of endothelial cells may be a prominent feature of AD blood vessels49,50;MYRIP, associated with the 100kb upstream variant rs9832461, was downregulated in capillary endothelial cells of AD (Extended Data Fig. 9f); PFDN1, showing decreased expression in venule SMCs of AD patients, was linked to the AD variant rs11168036 (Extended Data Fig. 9g), suggesting the dysregulation of protein folding machinery in cerebrovascular cells in AD.
Second, we searched for indirect genetic evidence for vascular adDEGs whose upstream regulators were directly linked to AD-associated variants (“trans-regulation”) (Fig. 6a). Five of our previously-predicted (Fig. 3a–b) upstream regulators (YAP1, TCF7L2, NFIC, ETS1, DACH1) were directly linked to AD-associated variants, a 2.9-fold enrichment, given that only 33 TFs lie in AD-associated loci (Fisher’s exact test, p-value=0.04). The first four TFs were also predicted to be upstream regulators of cell-type-specific marker genes in our earlier analysis (Fig. 1e). These AD-associated regulators targeted 559 vascular adDEGs across five cell types (Fig. 6a, Supplementary Table 11), showing biologically-meaningful enrichments. For example, the targets of ETS1 were significantly enriched in cytokine and growth factor stimulus response in capillary endothelial cells, consistent with prior work51–54.
Figure 6.
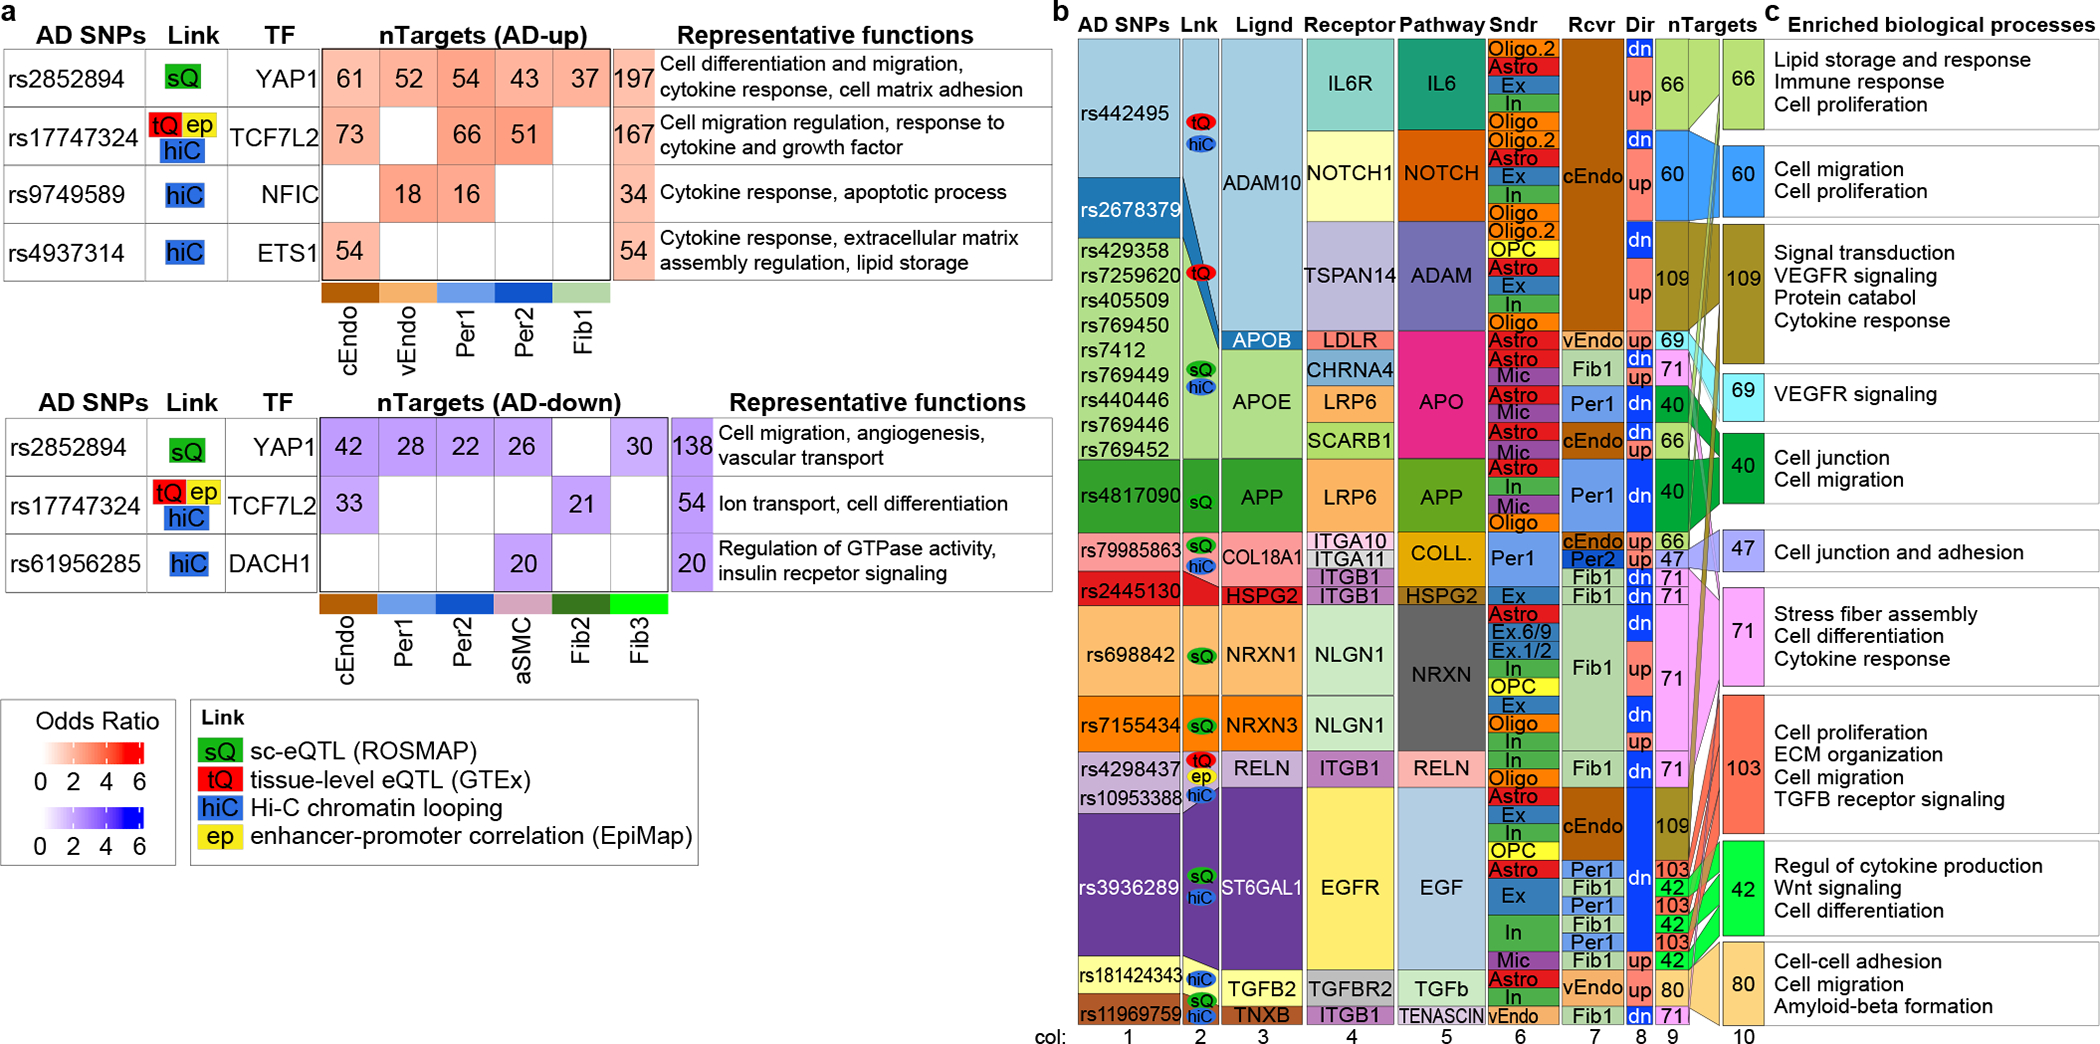
AD GWAS loci indirectly linked to brain vascular adDEG. a. Summary of AD-associated transcription factors: AD-variants, linking evidence, transcription factor, the number of targets in adDEGs for each cell type and summation in all cell types, and representative functions of these targets. The color scale for odds ratio in red/blue refers to the enrichment of up-/down-regulated adDEGs in the regulator’s targets. b. Summary of AD-associated ligands: AD-variants, linking evidence, ligand, receptor, signaling pathway, sender cell type, receiver cell type, differential direction in AD, and number of targeted adDEGs. The colors are matched for the columns of AD-variants, linking evidence, and ligand to show the correspondence between AD-variants and associated ligands. The colors of the sender (“Sndr”) and receiver (“Rcvr”) cell types match the cell types shown in Figure 5c–d. The columns are horizontally aligned to show the correspondence. c. The enriched biological processes of targets shown in (b) and the targets involved in the specific function. Enrichr in R was used to perform GO enrichment
Third, we searched for indirect genetic evidence for vascular adDEGs that were coexpressed with ligand-receptor pairs, when those ligands are 1) directly linked to AD-associated variants and 2) adDEGs in nonvascular brain cells. We call this third type of regulation “intercellular regulation”. We used our previously annotated correlated module pairs (degModules, Fig. 4, Extended Data Fig. 8), and searched for AD-linked adDEG ligands indicative of potential genetic effects. We found 54 pairs (24 upregulated and 30 downregulated in AD) with ligands proximal to AD-associated genetic loci (Fig. 6b), implicating 611 vascular adDEGs, which are linked to 12 AD-associated ligands and 13 receptors (in 18 different ligand-receptor pairs). The 12 AD-associated ligands represent a significant enrichment over expectation (odds ratio=2.52, p-value=0.0016, Fisher’s exact test). Seven of these 12 ligands showed sc-eQTL linking evidence, three showed tissue-level brain-eQTLs evidence from GTEx, and seven showed Hi-C loop linking evidence, including six with multiple lines of evidence (Fig. 6b, col. 2). Their downstream genes were enriched in at least 17 different biological functions (Fig. 6c, Supplementary Table 12). For example, we observed that APOE, the strongest AD genetic associated gene, showing increased expression in microglia and decreased expression in astrocyte, interacts with LRP655(downregulated in AD) to regulate the expression of genes in AD pericytes that were significantly enriched for cell junction and cell migration.
Taken together, we found 1,010 of 2,676 vascular adDEGs in AD can be associated with AD genetics using cis, trans, or intercellular signaling regulatory mechanisms (Extended Data Fig. 9a,h, Supplementary Table 13). These suggest that the effects of genetic risk factors on cerebrovasculature may contribute to the pathogenesis of AD through intracellular dysfunction and intercellular communications between vascular cell types and neural, glial and microglial cells in the brain parenchyma and immune cells in the peripheral blood system.
APOE genotype and cognitive decline in vascular cells
To elucidate the molecular mechanisms and vascular cell types potentially mediating the effects of APOE ε4 on BBB dysfunction and cognitive decline, we searched for APOE-genotype-associated differentially expressed genes (apoeDEGs) betweenAPOE ε3|ε3 homozygous individuals (E3, N=251) and carriers of one or two APOE ε4 alleles (E4, N=101 heterozygous ε3|ε4 and N=7 homozygous ε4|ε4) (Extended Data Fig.10a, Supplementary Table 1, Methods).
We found 2,482 apoeDEGs (Fig. 7a, Supplementary Table 14), largely evenly distributed across cell types (120 APOE4-up and 120 APOE4-down on average) and similar in count to the number of adDEGs. While only a median of 4% of APOE-differential genes were shared with AD-differential genes, the overlap between apoeDEGs and adDEGs was highly significant for a subset of cell types. For capillary endothelial cells (cEndo), 36% of upregulated apoeDEGs were also upregulated adDEGs (12-fold enrichment, p=10−32, Fisher’s exact test) and 21% of downregulated apoeDEGs were also down-regulated adDEGs (12-fold, p=10−20). Strong apoeDEG-adDEG agreement was also found for Fib1 and Per1 (10-fold to 14-fold enrichment), and weaker agreement for Per2 and vEndo upregulated genes (6-fold to 8-fold).
Figure 7.
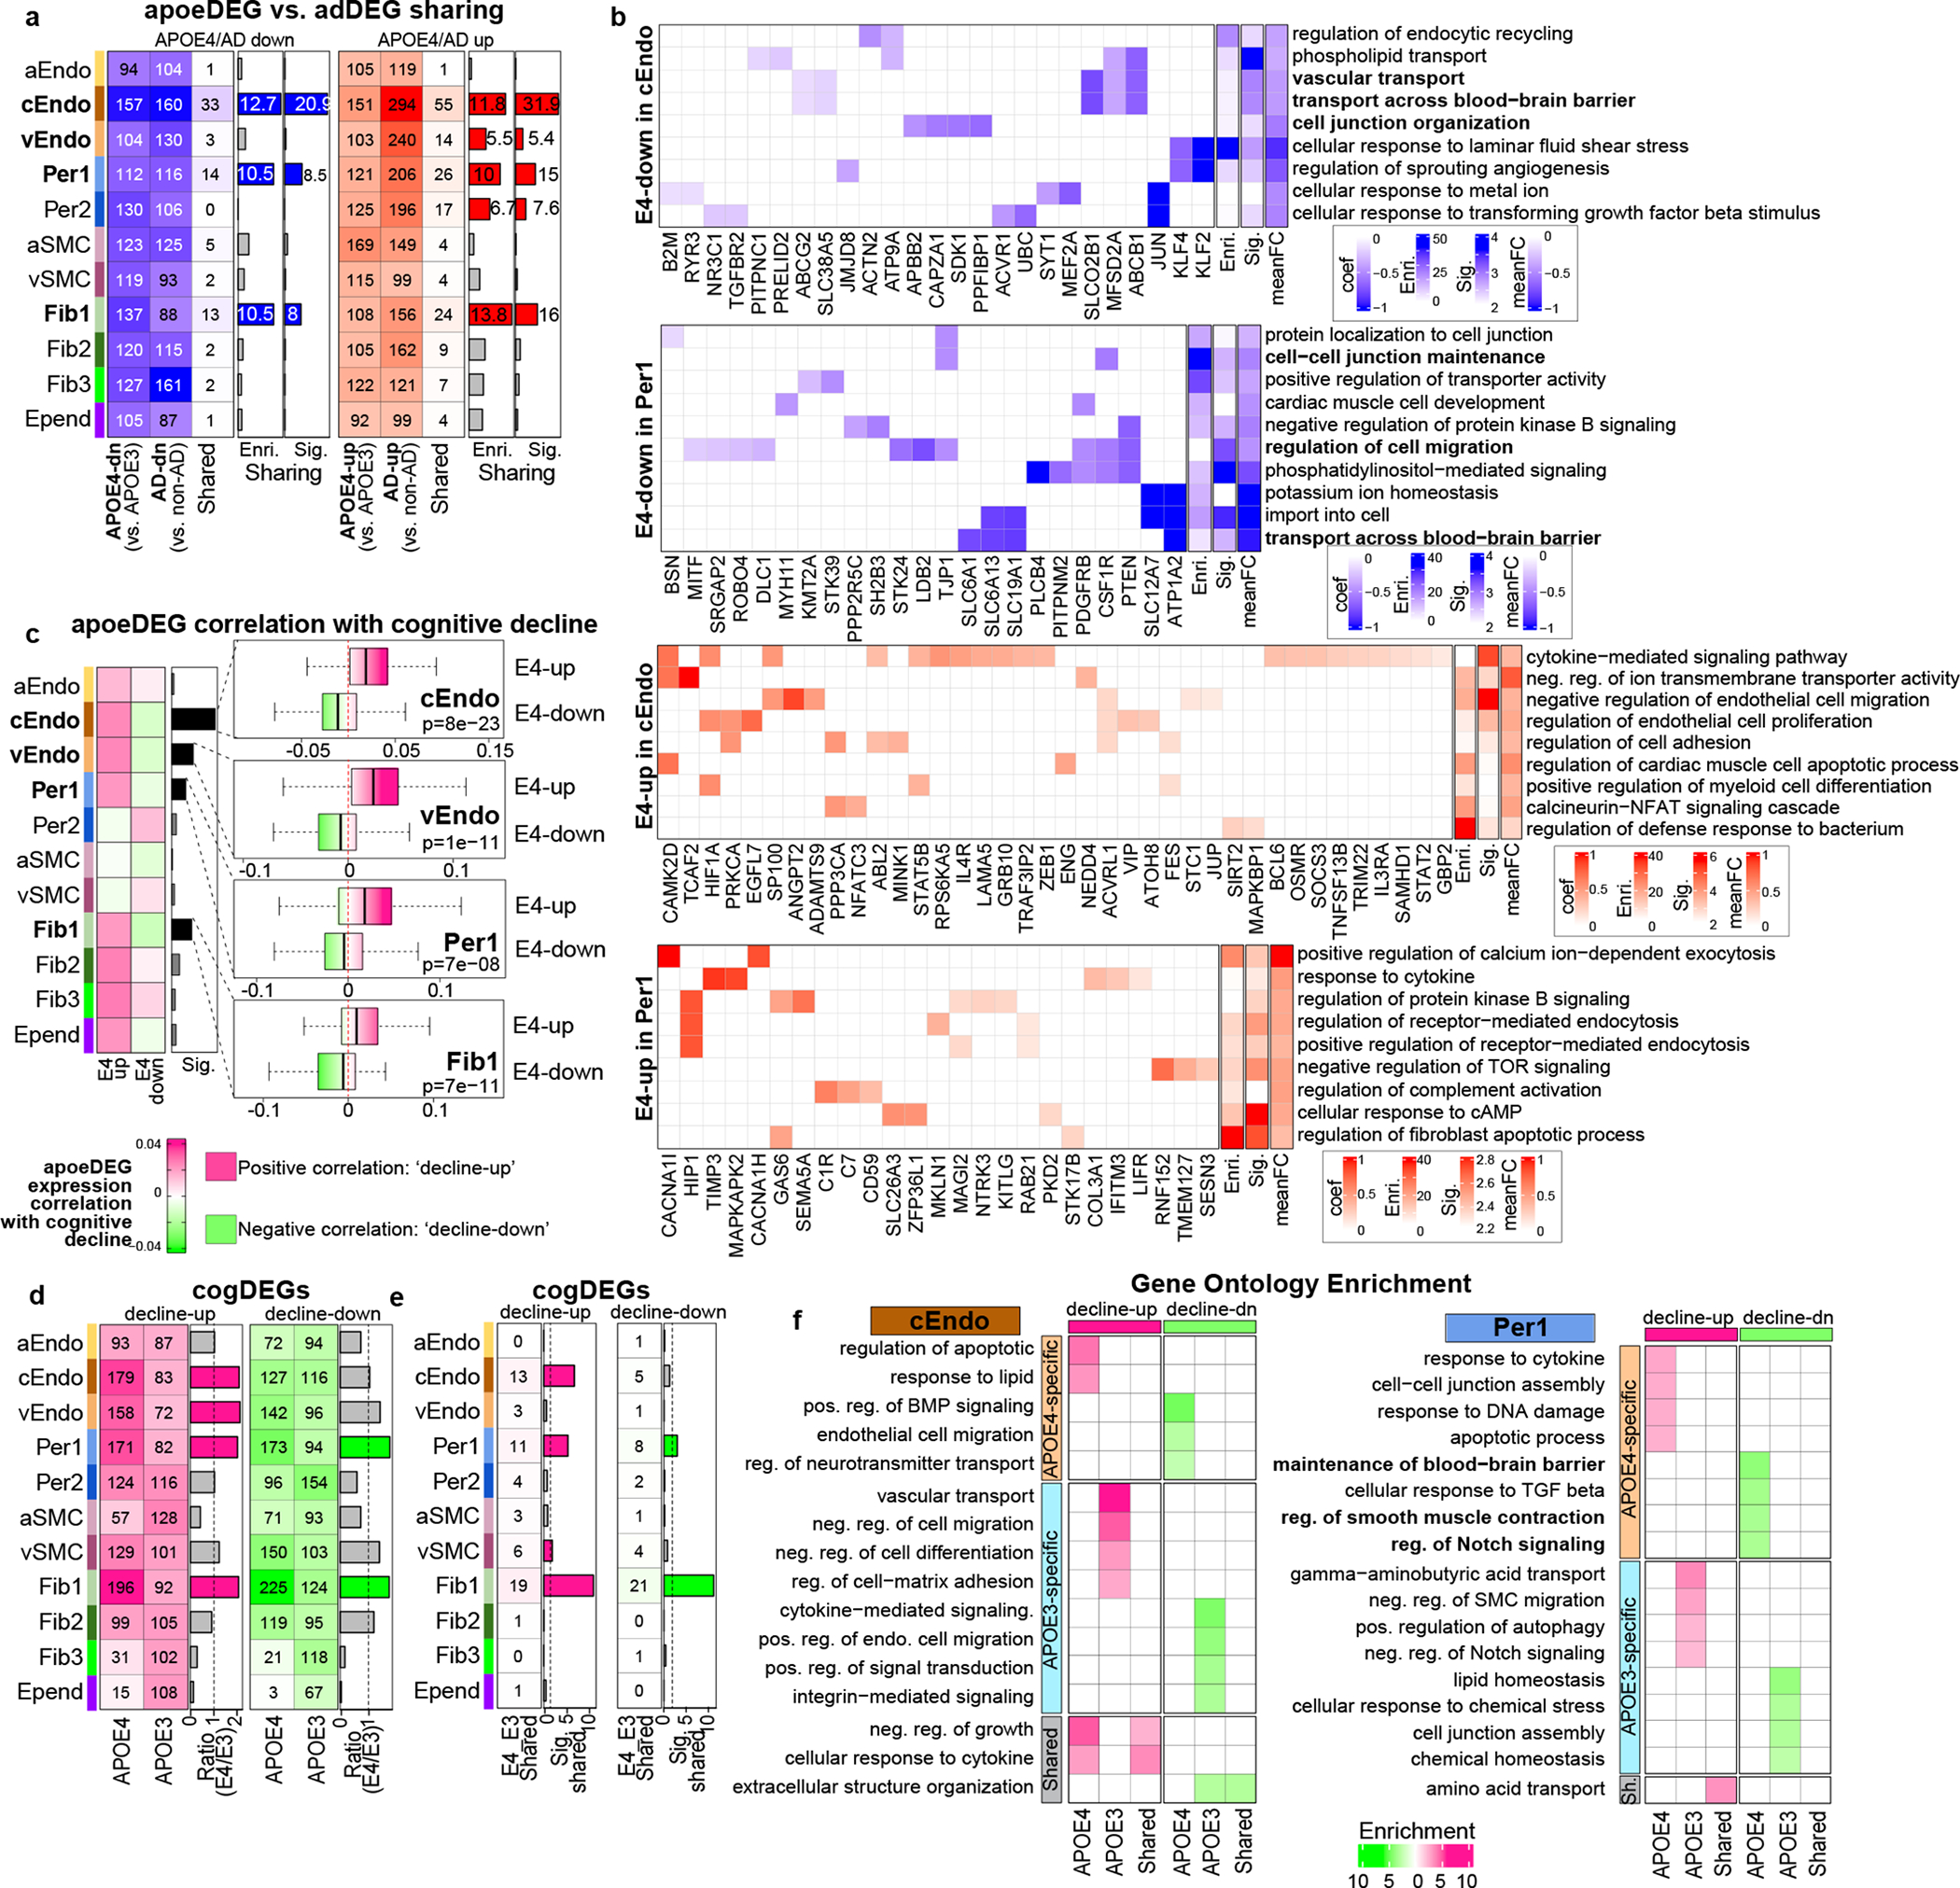
APOE4-associated transcriptional changes and cognitive decline. a. The comparison of apoeDEGs and adDEGs for each cell type. The heatmaps show the number of up- and downregulated apoeDEGs, adDEGs and overlapping DEGs in APOE4 or AD groups. The fold enrichment and adjusted p-value (Fisher’s exact test, < 0.05 as cutoff, two-sided) are shown in the barplot. b. Enriched Gene Ontology biological processes in apoeDEGs in cEndo and Per1. Enrichr was used (proportion test, adjusted p-value < 0.05 as cutoff). The color of the heatmap for each term-gene pair represents the effect size. The last three columns show enrichment, significance of each term, and average effect size of the genes. The representative terms are bolded. c. The difference of correlation of apoeDEGs with cognitive decline between up- and down-regulated apoeDEGs in the APOE4 group. The correlation between apoeDEGs and cognitive decline was calculated. The heatmap shows the average correlation. The barplot shows the significance of higher correlation of apoeDEGs with cognitive decline.The boxplot (right) shows the distribution of correlation with cognitive decline in E4-up and E4-down genes n=428 individuals. The box starts in the first quantile (25%) and ends in the third (75%). The line inside represents the median. Two whiskers represent the maximum and minimum without outliers. T-test is used (adjusted p-value < 0.05 as cutoff). P-value is shown. d. The number of decline-up genes (left) and decline-down genes (right) in APOE4 and APOE3 individuals. The bar plot showed the ratio of cogDEGs in E4 vs. E3 in various cell types with a ratio of >1.5 fold as a cutoff. e. The number and significance of overlapping decline-up/-down regulated genes between APOE4 and APOE3
We searched for enriched biological pathways in up- and down- regulated apoeDEGS in each cell type (Fig. 7b, Supplementary Table 15). In capillary endothelial cells, down-regulated apoeDEGs (“E4-down”) were significantly enriched in transport across blood-brain barrier, cell junction organization and regulation of sprouting angiogenesis. In pericytes down-regulated apoeDEGs were enriched in cell migration regulation, transport across the BBB, and cell-cell junction maintenance (Fig. 7b), consistent with reports of ApoE ε4 individuals showing reduced cerebral blood flow56 and increased cerebrovascular abnormalities57.
We next evaluated the correlation of all apoeDEGs with cognitive decline, and found that upregulated apoeDEGS (“E4-up”) were primarily associated with cognitive decline across all cell types, while down-regulated apoeDEGS (“E4-down”) were primarily associated with cognitive resilience (Fig. 7c, Extended Data Fig. 10b). This effect was strongest for cEndo (p<10−22), vEndo (p<10−11), Fib1 (p<10−11), and Per1 (p<10−8), with substantial and highly significant differences in cognitive decline correlation between E4-up and E4-down genes. Our results are consistent with previous findings that capillary pericytes might mediate the effect of APOE4 on cognitive decline58, and indicate that capillary endothelial cells and fibroblasts subtype 1 might play equally or even more important roles.
We further identified APOE genotype conditional cognitive-decline-correlated differentially-expressed genes (cogDEGs)(Fig. 7d, Supplementary Table 16, Methods), distinguishing “decline-up” cogDEGs that are positively-correlated with cognitive decline, and “decline-down” cogDEGs that are negatively-correlated with cognitive decline. APOE4 individuals showed more cogDEGs than APOE3 individuals (>1.5-fold) for cEndo, vEndo, Per1, and Fib1 (Fig. 7d), especially for decline-up genes (2.1-fold), suggesting specific cerebrovascular cell types might mediate the contribution of the APOE ε4 allele to cognitive decline. Comparing APOE3- with APOE4- cogDEGs, we found the two sets were largely distinct, with only ~5% overall of cogDEGs in common between APOE4 and APOE3 (Fig. 7e), suggesting distinct transcriptional changes and specific mechanisms of cognitive decline between ε3-only and ε4 carriers.
To further investigate the functions of APOE genotype conditional cogDEGs, we performed Gene Ontology enrichment analysis for E3-specific, E4-specific, and E3-E4-shared cogDEGs, in capillary cell types (cEndo and Per1) (Fig. 7f, Supplementary Table 17). For cEndo decline-up cogDEGs, APOE4-specific enrichments included lipid and cytokine response and apoptotic process, and APOE3 enrichments included vascular transport, negative regulation of cell migration, and cell matrix adhesion. For cEndo decline-down cogDEGs, APOE4-specific enrichments included blood vessel development, regulation of BMP signaling and neurotransmitter transport, and APOE3 enrichments included positive regulation of endothelial cell migration and extracellular structure organization. For Per1 decline-up cogDEGs, APOE4-specific enrichments included cytokine response, cell-cell junction assembly, and apoptosis, and APOE3 enrichments included negative regulation of SMC migration and Notch signaling, and autophagy. For Per1 decline-down cogDEGs, APOE4-specific enrichments included BBB-related functions (BBB maintenance, Notch signaling, contraction regulation), whereas APOE3 enrichments included lipid and chemical homeostasis and cell junction assembly, suggesting that APOE ε4-dependent cognitive decline may be primarily mediated by Per1 pericytes (Fig. 7f).
Discussion
In this study, we analyzed the transcriptome of 22,514 single nuclei, identified the molecular signatures and upstream regulators of eleven brain vascular cell types, and characterized region-specific expressed genes and pathways. We identified 2,676 AD-associated differentially expressed genes (adDEGs) with strong cell-type specificity. The identified adDEGs were enriched in multiple biological pathways broadly across cell types and specifically in single cell types. We experimentally validated the upregulation of INSR and COL4A1 in AD endothelial cells, and the upregulation of APOD and downregulation of SLC6A1 in AD pericytes using RNA in situ hybridization and immunohistochemistry staining.We also predicted upstream regulators of adDEGs, and grouped them into collaborative regulator modules, potentially driven by primary regulators. Our analysis provides a general framework for understanding how regulators collaboratively control dysfunctional gene programs in disease and may aid in prioritizing therapeutic targets to restore the function of AD-differential genes, developing iPSC-derived vasculature, and planning perturbation experiments.
We next investigated differential cell-cell communications of neurovascular units in AD. Methodologically, we introduced a new computational framework and identified 577 AD-differential cell-cell communications and the mediated signaling pathways. The dynamics of multi-cellular interactions in AD call attention to the development of multicellular in vitro systems and provide a specific point of view at a multicellular level to therapy in the future.
Moreover, our study yielded insights on interpreting AD genetic variants from genome-wide human genetics studies in cerebrovascular cell types. We proposed and studied three types of mechanisms to understand how AD variants are associated with vascular differential genes in AD: (1) direct regulation in a “cis” way, (2) indirect regulation in a “trans” way through regulators and (3) indirect regulation through intercellular signaling pathways. Altogether, we observed that 1,010 (37.7%) adDEGs could be associated with AD genetics, suggesting the importance of understanding the BBB dysregulation in AD from a genetic perspective and providing a paradigm of associating disease risk genes with differentially expressed genes to be widely applied in multiple scenarios.
Finally, our study sheds light on the molecular and cellular bases of the association between cerebrovasculature and APOE4-associated cognitive decline, suggesting the potential for therapeutic targets related to BBB dysfunctions in specific APOE genotypes. Given the limited number of vascular cells, especially for rare cell types in APOE4, further targeted studies are needed to comprehensively understand the association and causality among APOE genotype, BBB function, cognitive decline, and AD. The computational predictions of apoeDEGs in this study, as well as adDEGs, regulators, signaling pathways, cell-cell interactions, and AD risk genes in vascular cell types, are expected to be experimentally and independently confirmed in future work.
Overall, our multi-region molecular atlas of differential human cerebrovasculature genes and pathways in AD provides an important foundation for guiding AD therapeutics, especially for early-stage interventions where the BBB is increasingly recognized to play a central role.
Methods
Human brain samples from ROSMAP
Human brain tissues in this study were obtained from the Religious Orders Study and Rush Memory and Aging Project (ROSMAP, each approved by an Institutional Review Board (IRB) of Rush University Medical Center) with informed consent, an Anatomic Gift Act for organ donation, and a repository consent to allow the data to be shared59. Quantitative clinical and pathologic phenotypes of AD were used to assess disease severity. These included global cognition proximate to death, and a measure of global AD pathology as well as the molecularly specific beta-amyloid and PHFtau tangles. Specifically, we performed k-means clustering on this quantitative matrix after z-score normalization to group all patients in the cohort into k=3 clusters: non-AD (controls), early-AD, and late-AD (Supplementary Fig. 1a). Controls were defined as individuals with little to no AD pathology, whereas cases (early- and late-AD) included a spectrum of AD pathology and cognition pathology. Thus, case status was based on both AD pathology and cognition pathology, and other variables were allowed to freely associate60–64. In this study, we then combined early-AD and late-AD individuals as one AD group given the limited number of vascular cells. We profiled the prefrontal cortex for 409 individuals, and four other regions for a subset of 48 individuals, including mid-temporal cortex, angular gyrus, entorhinal cortex, thalamus, as well as hippocampus for a subset of 65 individuals and an additional 19 individuals (Supplementary Table 1). We have 455 samples in PFC including 364 individuals with 1 sample, 44 individuals with 2 samples, and 1 individual with 3 samples. For other regions, there was one sample per individual (47 in angular gyrus, mid-temporal cortex and thalamus; 45 in entorhinal cortex; 84 in hippocampus). Thus, we totally have 725 samples from 428 individuals.
Nuclei isolation from frozen postmortem brain tissue and single nuclear RNA sequencing
We isolated nuclei from frozen postmortem brain tissue as previously described (Mathys et al., Nature 2019)65 with some modifications. Briefly, we homogenized the brain tissue in 700 μL Homogenization buffer and filtered the homogenate through a 40 μm cell strainer (Corning, NY), added 450 μL Working solution and loaded it as a 25% OptiPrep solution on top of a 30%/40% OptiPrep density gradient (750 μL 30% OptiPrep solution, 300 μL 40% OptiPrep solution). We separated the nuclei by centrifugation using a fixed rotor, tabletop centrifuge (5 minutes, 10000g, 4°C). We collected the nuclei pellet at the 30%/40% interphase, transferred it on a new tube, washed it twice with 1mL ice-cold PBS containing 0.04% BSA (centrifuged 3 minutes, 300g, 4°C) and finally resuspended it in 100 μL PBS containing 0.04% BSA. After counting, we diluted the nuclei to a concentration of 1000 nuclei per μL. We used the isolated nuclei for the droplet-based 10x scRNA-seq assay, targeting 5000 nuclei per brain region and individual, and prepared libraries using the Chromium Single-Cell 3′ Reagent Kits v3 (10x Genomics, Pleasanton, CA) according to the manufacturer’s protocol. We sequenced pooled libraries using the NovaSeq 6000 S2 sequencing kits (100 cycles, Illumina).
snRNA-seq data preprocessing
We aligned the raw reads to human reference genome version GRCh38 (pre-mRNA) and quantified gene counts using CellRanger software v3.0.1 (10x Genomics)66. The generated cell-gene count matrix was processed using the Seurat R package v.4.0.367. We used a threshold of 500 unique molecular identifiers (UMIs) to select cells, and a cut-off value of 50 cells to select genes for further analysis. We filtered out the cells with more than 10% mitochondrial genes. The gene count was normalized by the total counts for each cell, multiplied by 10000, and then log-transformed. We identified the top 2000 highly variable genes for dimension reduction using Seurat default parameters. We used the top 30 principal components (PCs) as input to calculate the first two components of UMAP. We used Harmony for batch correction68, and DoubletFinder to estimate the doublet score with the parameter of 7.5% doublet formation rate69. The cells with high doublet scores (0.2 as cutoff) were discarded for further analysis. We used the resolution as 0.5 to identify clusters. After generating clusters, a cluster showing high expression of markers of two or more cell types was also treated as doublets and removed for further analysis.
In Silico Sorting to enrich vascular cells and cell type annotation
For the full datasets with all cell types (2.8 million cells), we first annotated the cell type for each cluster based on the canonical markers of major cell types in the brain (including excitatory and inhibitory neuron, astrocyte, oligodendrocyte, OPC, microglia and vascular cell)65 and the enrichment of a large set of markers70 in highly expressed genes of each cluster. We next calculated the cell type scores (i.e. astrocyte, oligodendrocyte, microglia, etc) for each cell, which were represented by the average expression of a group of markers for each cell type70. The cells were then selected as vascular cells for further integrative analysis only if (1) the clusters that the cells belong to were annotated as vascular cell types; and (2) the cells had the highest score for vascular cell types, and 3) the score for vascular cell types was 2-fold higher than the second highest score. For all vascular cells, we followed the same pipeline to perform dimensional reduction and clustering with the same parameter as full datasets. We had previously reported data from control individuals4, and here report data from AD individuals.
Comparison with public datasets
We downloaded the processed dataset from Yang et al., which performed a vessel-enrichment protocol to enrich brain vascular cells in AD and control samples of brain tissue (GSE163577)5,10. We integrated our data with the vessel-enrichment-based dataset reported in Yang et al. by identifying cross-dataset pairs of cells that are in a matched biological state (“anchors”), to correct for technical differences between datasets.The union of highly variable genes (top 2000 for each dataset) were used for Principal component analysis (PCA). The top 30 PCs were used for non-linear dimensionality reduction (UMAP). We visualized the data using UMAP with cell type labels from the original study. We also tested the enrichment of cell type marker genes between the two studies using Fisher’s exact test with multiple testing (with all expressed genes as background) to evaluate if the cell types uncovered by the two studies were consistent (FDR < 0.05 as cutoff).
We also downloaded the processed dataset from Lau et al. (GSE157827)10, which performed snRNA-seq to capture all cell types in the brain without any enrichment, for comparison with the present study. Lau et al. didn’t annotate the detailed vascular cell types but instead used “endothelial” as the annotation for the vascular cells in their data. We performed clustering to further annotate the specific vascular cell types including endothelial cells, pericytes, SMCs and fibroblasts. Given the limited number of rare cell populations, we only identified differentially expressed genes between AD and control in endothelial cells with enough power.
Identification of differentially expressed genes between cell types and between brain regions
We used the Wilcoxon rank-sum test in Seurat with customized parameters (min.pct = 0.25, logfc.threshold = 0.25) to identify 1) highly expressed genes for each cell type or subtype compared with the cells, and 2) differentially expressed genes between brain regions for each cell subtype that had more than 50 cells in each region. We considered a gene differentially expressed if it was detected in at least 25% of cells and the logarithm of fold change was higher than 0.25.
Identification of differentially expressed genes between AD and control
For the comparison between AD and control, we applied MAST, a single-cell based method, to measure the statistical significance for each gene based on a linear model71. The covariates including number of cells, number of expressed genes, age, sex, PMI, race, batch, brain region, and other dementia related pathology (Lewy body dementia, Parkinson’s disease, and vascular contributions to cognitive impairment and dementia (VCID)) were controlled in the model. The genes with p.value < 0.01 and coefficient > 0.02 were selected as adDEGs for further analysis. To confirm that these differences are biological and not statistical artifacts, we permuted the annotation of AD status for each individual 1000 times and identified the adDEGs using the same computational pipeline, and found that the number of adDEGs is significantly higher than expected by chance (p-value < 0.05).
We also applied a pseudo-bulk based method, edgeR72, to detect the differentially expressed genes for each cell type between AD and control using the same covariates as above (p-value < 0.01). We then tested if for the same cell type, the adDEGs identified by the two methods (MAST single-cell and pseudo-bulk edgeR) were significantly overlapped using Fisher’s exact test with all expressed genes as background and adjusted p-value < 0.01. We found the adDEGs were highly consistent between the two methods.
Finally, we also performed a downsampling analysis to confirm the consistency of the number of adDEGs in the cEndo cell subtype using different numbers of cells (1000, 2000, 3000, 4000, 5000 and the original 6195). Specifically, we randomly selected a number of cells without replacement and identified the adDEGs using MAST with the same parameters as above. We compared the adDEGs in terms of effect size by evaluating two parameters. First, we calculated the Pearson’s correlation coefficient (PCC) between each pair of comparisons (i.e. between the adDEG’s identified in the group of 1000 cells and in the group of 2000 cells). Second, we calculated the score defined by the ratio of the number of genes with consistent directional regulation (i.e. upregulated in both data sets, or downregulated in both data sets) to the number of genes with inconsistent directional regulation. These data are visualized in Extended Data Fig. 4c.
RNA in situ hybridization
For human postmortem samples, fresh frozen human PFC samples (BA region 9) were embedded in Tissue-Tek OCT compound (Sakura, #25608–930), cut at 10 μm using a cryostat (Leica, CM3050S) and collected on Superfrost Plus slides (Fisher Scientific, #12-550-15). We collected eight sections (one per individual, n=4 Control subjects and n=4 AD subjects) per slide. Mounted tissue sections were stored at −80°C until further processing. RNAscope chromogenic 2.5 was used for C1 probe hybridization; and xylene was not used prior to mounting. Probes used in this study include CD31 (Advanced Cell Diagnostic, #548451-C2, red), INSR (HD duplex reagent kit (Advanced Cell Diagnostic, #322430) was used to perform RNA in situ hybridization according to the manufacturer’s instructions with the following modifications: tissue was fixed in 4% paraformaldehyde for 30 minutes; 30 minutes were allowed for C2 probe hybridization; overnight at room temperature Advanced Cell Diagnostic, #406411, green), GRM8(Advanced Cell Diagnostic, #563351), APOD(Advanced Cell Diagnostic #445171), ABCC9(Advanced Cell Diagnostic #521881), and SLC6A1(Advanced Cell Diagnostic #545121-C2). Images were acquired using the brightfield settings of a Zeiss LSM 900 microscope. We only captured images where the tissue was in focus of the z-plane, and did not have any technical artifacts.
RNA in situ hybridization analysis
Images were imported into QuPath (version 0.2.0-m8)73. Vessel segments were identified based on CD31+ punctae expression, which formed visually distinct vessel-like segments. For example, to define colocalization between endothelial (CD31-positive) cells and INSR transcript, we used the software QuPath73 to annotate cells positive for the Red signal (i.e. expressing CD31 transcripts), and then quantified the number of Blue punctae (i.e. INSR transcripts) within each cell. This corresponded to the number of INSR transcripts per CD31+ vessel segment. For each image, we then quantified the number of vessel segments with the number of Blue punctae per segment. To account for group differences in overall vascular architecture or CD31 expression, we normalized the number of punctae per area, by calculating vessel segment area using the Annotations feature in QuPath. To detect individual cells, we used the “Analyze” function in QuPath. We then determined the frequency distribution for each density quantification between AD and control patients.
Immunohistochemistry
Individual PFC specimens were removed from −80°C, covered in OCT (Tissue Tek) in a cryomold, and allowed to set for at least two hours at −80°C. Tissue blocks were then cut on a cryostat into 20 μm sections and mounted onto a SuperFrost slide. Tissue sections were fixed using 4% PFA (Electron Microscopy Services) in PBS for one hour, then incubated in the blocking buffer (5% Normal Donkey Serum, 0.5% TritonX in PBS) for 24 hours at 4°C. We then used TrueBlack® Lipofuscin Autofluorescence Quencher (Biotium) to remove background fluorescence according to the manufacturer’s protocol (Protocol 1, Pretreatment with TrueBlack). Tissue sections were incubated with primary antibodies for 3 days at 4°C and then washed with PBS three times, followed by incubation with secondary antibodies for 4 hours, and then finally were mounted with Fluomount-G. Sections were imaged using a Zeiss LSM 900 confocal microscope at 20X or 63X magnification. Images were quantified in FIJI, QuPath, and Imaris by an investigator blinded to diagnosis. For primary antibodies we used Anti-Collagen Type IV Antibody (Sigma-Aldrich #AB769, used at 1:125 concentration) and Lectin-488 (Vector Laboratories #DL-1174, used at 1:125 concentration).
Prediction of upstream regulators of cell type marker genes
We predicted the upstream regulators of cell type markers using Enrichr in R based on three libraries including TRANSFAC and JASPAR, ChEA, and ENCODE TF ChIP-seq data74–76. We used adjusted p-value <0.05 as a cut-off to select the significant regulators (proportion test in Enrichr package). We kept the regulators with detected expression in the relevant cell types for further analysis.
Prediction of upstream regulators of adDEGs
We predicted the upstream regulators of adDEGs using Enrichr in R based on three libraries including TRANSFAC and JASPAR, ChEA, and ENCODE TF ChIP-seq data74–76. We used adjusted p-value <0.05 as a cut-off to select the significant regulators. We kept the regulators with detected expression in the relevant cell types for further analysis. We also checked if the regulators were significantly highly expressed in the corresponding cell types, which are highlighted in Fig. 3a–b. We tested the significance of shared targets between each pair of regulators in each geneset, and grouped these regulators into co-regulatory modules (defined as tfModules) based on the hierarchical clustering of significance (−log10(p-value) by Fisher’s exact test) using the Euclidean distance of the significance matrix as the input for the function “hclust” in R with the default parameters.
We evaluated the regulators within one tfModule by searching the protein-protein interaction network database STRING 21 for physical interactions validated by experiments and downloaded the generated network as supporting information in this study. To evaluate if the physical interactions between regulators within the same module were not by chance, we performed a permutation test by randomly selecting the same number of regulators in the databases of regulator-targets and calculating the interaction score defined by the ratio of number of interactions to the total number of pairs. We permuted 1000 times to calculate the p-value and did multiple testing by FDR adjustment with a cutoff of FDR < 0.05.
We then generated a matrix of zero-one to represent the regulatory relationships between tfModules and target genes and performed hierarchical clustering to separate target genes into distinct clusters. We calculated the percentage of ones in the block formed by a target gene cluster and regulator module to determine if the target gene cluster was regulated by a tfModule. We used 32% as a cutoff based on the boundary of the bimodal distribution shown in Supplementary Fig. 3. One target gene cluster could be regulated by zero, one or multiple regulator modules, and vice versa.
Gene Ontology Enrichment Analysis
We used Enrichr in R to perform enrichment analysis for Gene Ontology biological process (proportion test, one-sided, adjusted p-value < 0.05 as a cutoff)77,78. The selected terms were manually combined according to the general functions including immune response, cell proliferation, cell migration, etc.
Prediction of dynamic cell-cell communications in AD
For each cell type (including vascular and non-vascular cell types in our brain datasets), we first clustered adDEGs into co-expression gene modules (defined as degModules) across all individuals (pairwise Pearson correlation coefficient, adjusted p-value of 0.05 as cutoff), and averaged single-cell expression for each cell type within each individual using AverageExpression function in Seurat. Then, for each pair of cell types, we generated the Pearson correlation coefficient matrix across all module pairs, and estimated the significance using cor.test function in R. We used an adjusted p-value of 0.05 as the cutoff to select the significantly correlated modules between two cell types. For each gene module, we performed Gene Ontology enrichment analysis to measure the importance of the module at the pathway level and removed the gene modules without enriched biological processes and signaling pathways. We combined four ligand-receptor databases (CellChatDB79, CellPhoneDB80, CellTalkDB81, and SingleCellSignalR82) to annotate the correlated modules as evidence for interacting cell-cell pairs mediated by ligand-receptor signaling pathways. We manually curated the selected ligand-receptor pairs in this study to remove the mislabeled or intracellular protein-protein interactions through literature searching and filtering. The final results include the interacting cell types, ligands, ligand-involved functions, receptors, receptor-involved functions, potential targets in signal receiver cell type, and directions of cell-cell communication in AD. For each pathway shown in Fig. 4c–d, we tested if it is overrepresented in AD-increased or AD-decreased interactions using Fisher’s exact test (two-sided) with the complete database as background and p-value < 0.01 as the cutoff.
The eQTLs analysis in vascular cell types
We firstly estimated the average expression for each gene in each vascular cell type using a poisson-gamma model with a cell-level sequencing depth parameter and an individual-level mean parameter for each gene within each individual. The mean parameter was estimated by an integrative variational inference algorithm83. We then estimated the confounding factors on the individual-level gene expression matrix in an adaptive way. For each gene, we defined control genes by taking the top most correlated genes located in different chromosomes. We performed principal component analysis (PCA) and used the top 50 PCs as covariates.
We next built knock-off filters84 for a genotype dosage matrix (0, 1, 2 effect allele count) sampled from a cis-window (1Mb around the gene body) for each gene. We estimated PCs of the sampled genotype matrix by conducting singular value decomposition. Using the first factors that account for the >80% of total genetic variation, we estimated structured confounding factors that capture the dependency structures across individuals and genetic variants. We estimated the knock-off design matrix following scalable approaches85–87.
We then performed multivariate analysis for each gene by regressing the pseudobulk profiles on the observed and knock-off genotype matrix, respectively. We performed a Bayesian spike-and-slab regression prior to measure the posterior inclusion probability (PIP) of each variant. The difference between PIP values on the observed variable and the knockoff counterpart were used to construct knock-off statistics. We determined the threshold for a desired false discovery rate level using the R knockoff package88.
The adDEGs association with AD genetics
We downloaded AD-GWAS associated genes based on GWAS catalog annotation43, and summary statistics from Jansen et al.39 using a subthreshold of −log10(p-value)>5 to match the genes from GWAS catalog annotation. The adDEGs in the AD GWAS catalog were then mapped to AD variants based on the annotation in the catalog. The variant with the lowest p-value for each gene was used to label the position in the Manhattan plot. We used four types of linking evidence to evaluate the association between AD-variant and candidate genes: (a) physical chromatin conformation capture (Hi-C) looping89–92, (b) correlation-based enhancer-gene links93; (c) brain/heart/muscle-specific eQTLs at tissue-level resolution94; and (d) vasculature cell-type specific single-cell eQTLs (sc-eQTLs) (in preparation). AD-variant and candidate gene associations with at least two pieces of linking evidence were selected for visualization. The distance between AD-variant and gene TSS and its ranking according to that distance among variant-associated genes were also calculated and visualized.
We also evaluated the association between AD-variants and predicted regulators of adDEGs using the four types of linking evidence mentioned above. We calculated the number of AD-variant targets for each AD-associated regulator for each cell type and plotted the heatmap to show if the regulation is cell-type-specific or cell-type-shared. Similarly, we evaluated the associations between AD-variant and ligand that meditate AD-related cell-cell communications using the four types of linking evidence, and performed functional enrichment analysis for each target set to measure the functions of those adDEGs as the downstream targets of AD-associated ligands in vascular cell types.
Identification of differentially expressed genes between APOE3 and APOE4 individuals
For the comparison between DEGs in APOE3 and APOE4 individuals, we applied MAST to measure the statistical significance for each gene based on a linear model71. The covariates including number of cells, number of expressed genes, age, sex, PMI, race, batch, brain region, AD status and other dementia related pathology (Lewy body dementia, Parkinson’s disease, and VCID) were controlled in the model. The genes with p.value < 0.01 and coefficient > 0.02 were selected for further analysis.
Identification of APOE-genotype conditional cognitive decline associated genes
To identify APOE-genotype conditional cognitive decline associated genes, we firstly defined APOE ε3|ε3 homozygous individuals and APOE ε4 carriers as APOE3 and APOE4 groups, respectively. For each group, we applied MAST to measure the statistical significance of correlation with cognitive decline for each gene based on a linear model71. The covariates including number of cells, number of expressed genes, age, sex, PMI, race, batch, brain region, AD status, and other dementia related pathology (Lewy body dementia, Parkinson’s disease, and VCID) were controlled in the model. The genes with p.value < 0.01 and coefficient > 0.02 were selected for further analysis.
Extended Data
Extended Data Figure 1. Brain vasculature characterization across six brain regions.
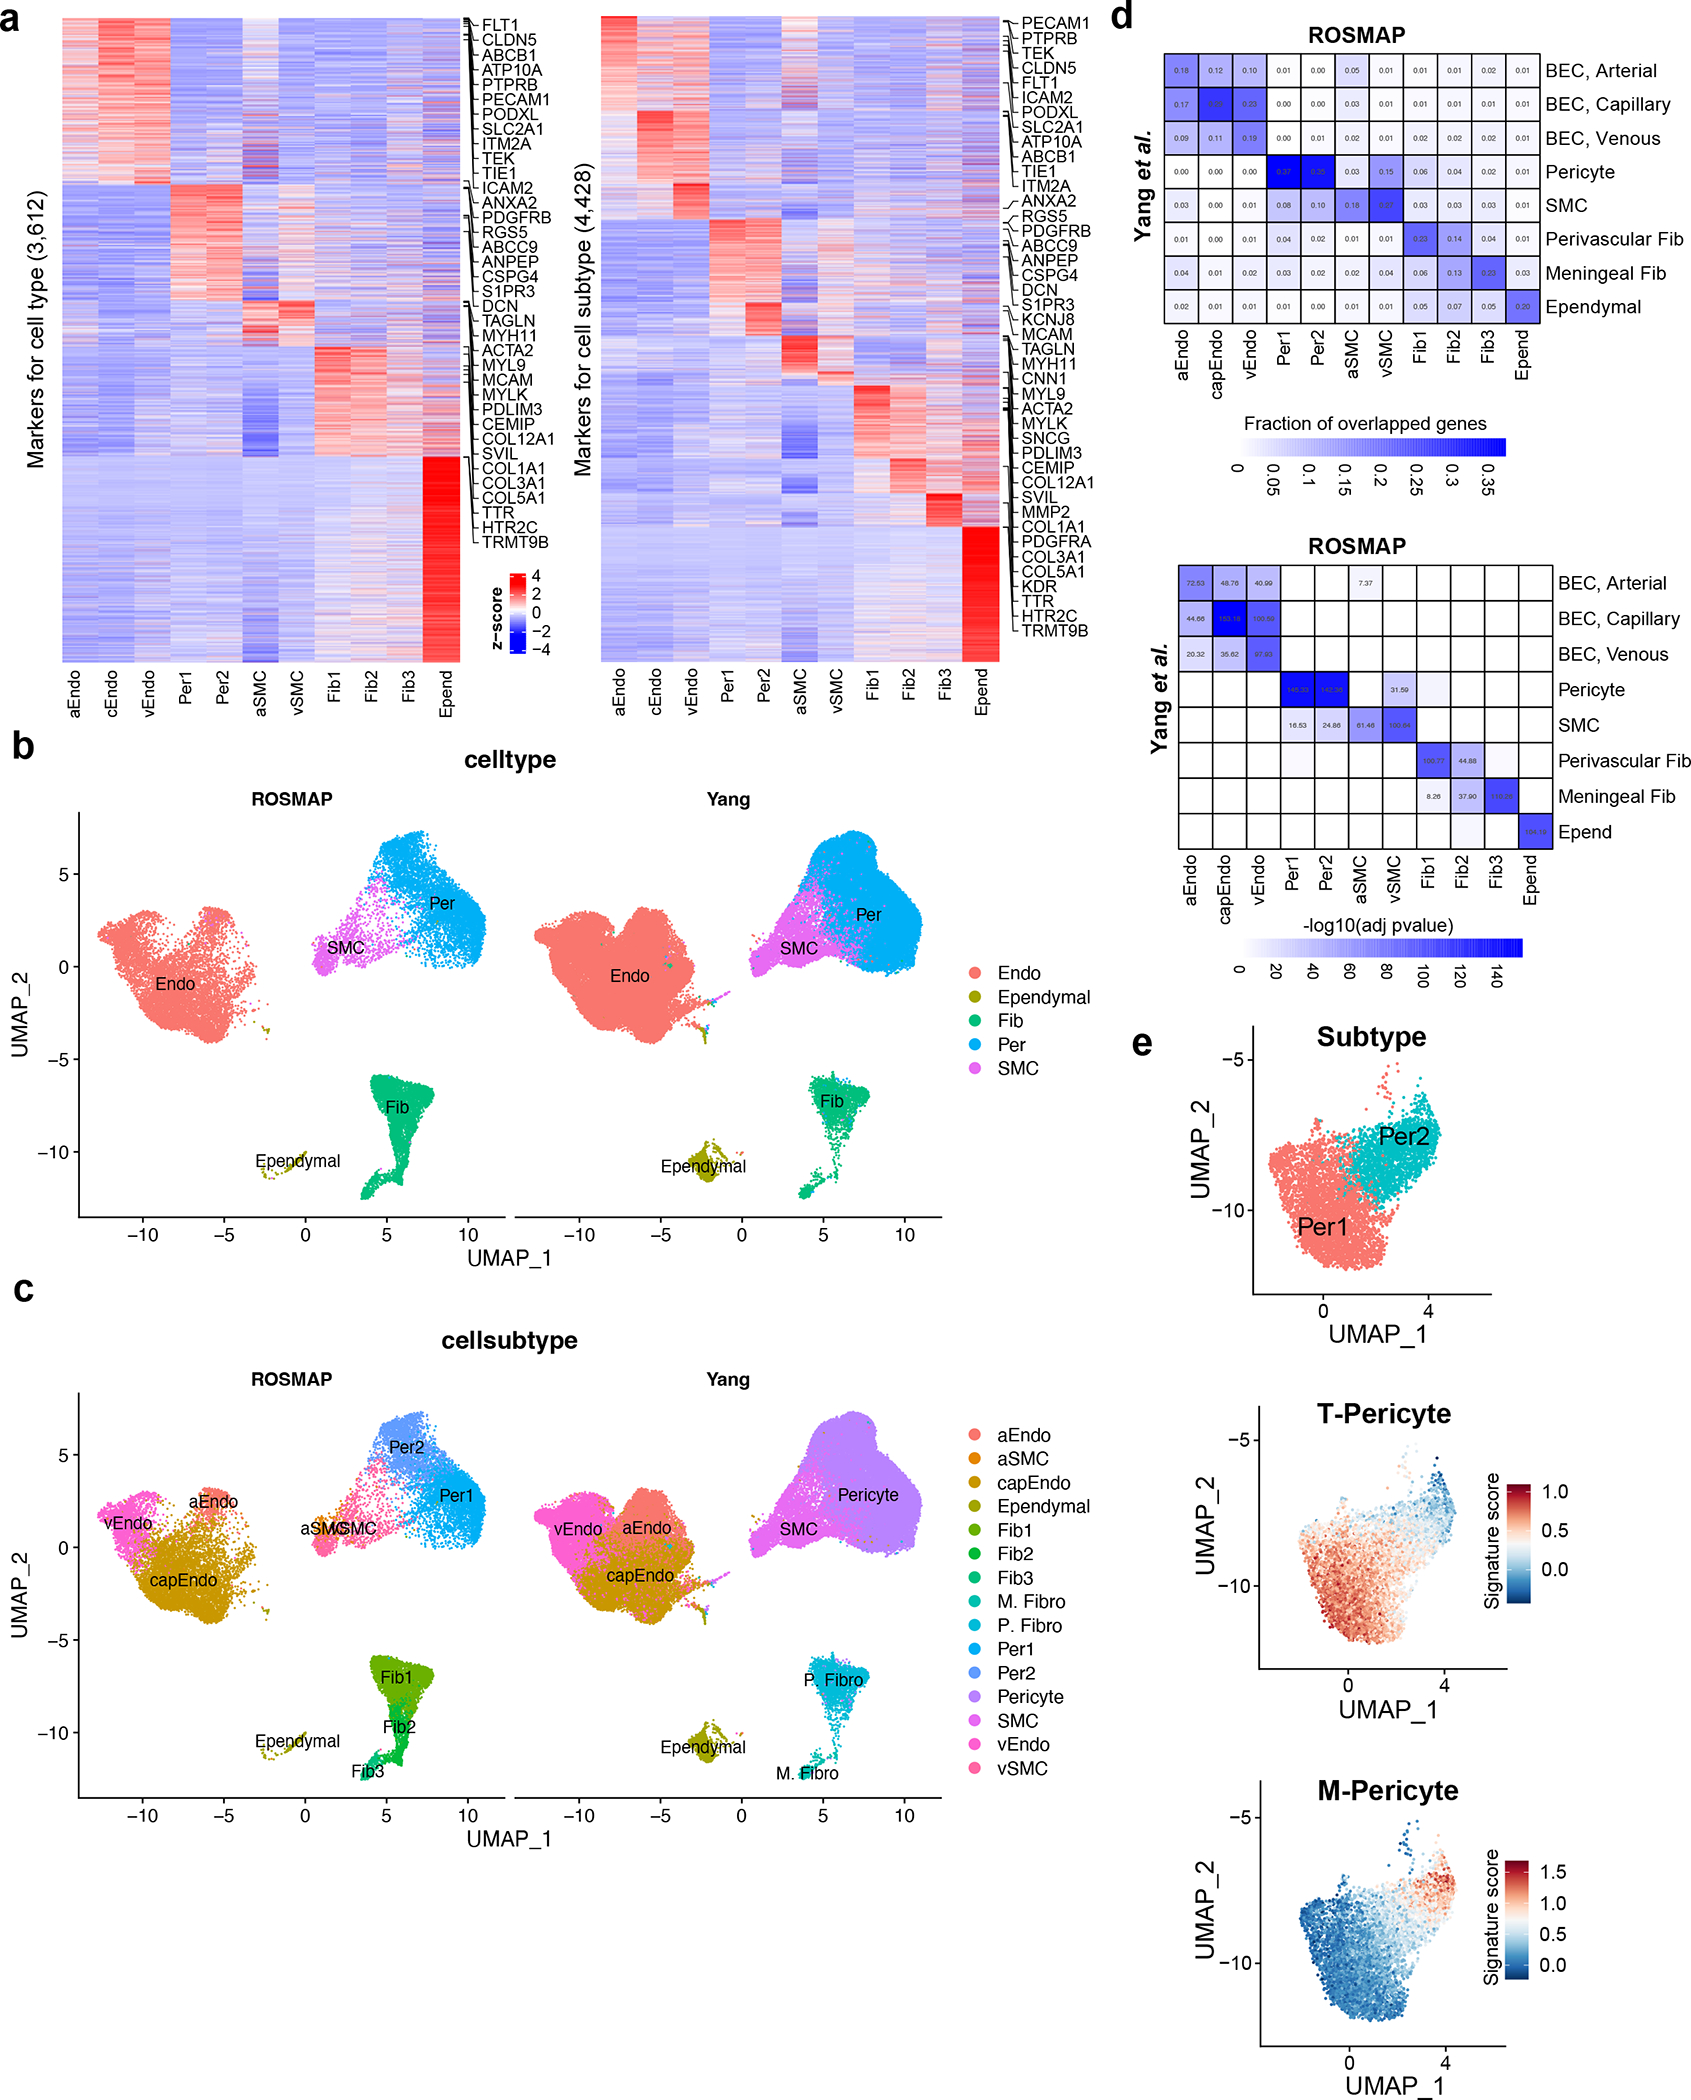
a. Markers for vascular cell types (left) and cell subtypes (right). The z-scores are shown at the pseudo-bulk level. The top 5 markers for each cell type or subtype with highest fold change and the known markers are shown along the right side of the heatmap. b-c. UMAPs showing the comparison of brain vascular nuclei in this study (labeled as “ROSMAP”) and Yang et al. at both the cell type (b) and subtype (c) levels. d. Heatmaps showing the significant overlap of marker genes at the subtype level between this study (labeled as “ROSMAP”) and Yang et al. (top: significance; bottom: the fraction of overlapped genes). The top heatmap shows the fraction of overlapped genes. The −log10(adj. p-value) are shown in the bottom heatmap to represent the significance (Fisher’s exact test, two-sided adjusted p-value < 0.05 as a cutoff). e. UMAPs showing the correspondence of pericyte subtypes between this study and Yang et al.. The top UMAP shows the two subtypes of pericytes identified in this study. The bottom two UMAPs show the T-pericyte and M-pericyte signature score distribution in this study. The signature genes of T-pericyte and M-pericyte were defined in Yang et al..
Extended Data Figure 2. Cell fraction analysis.
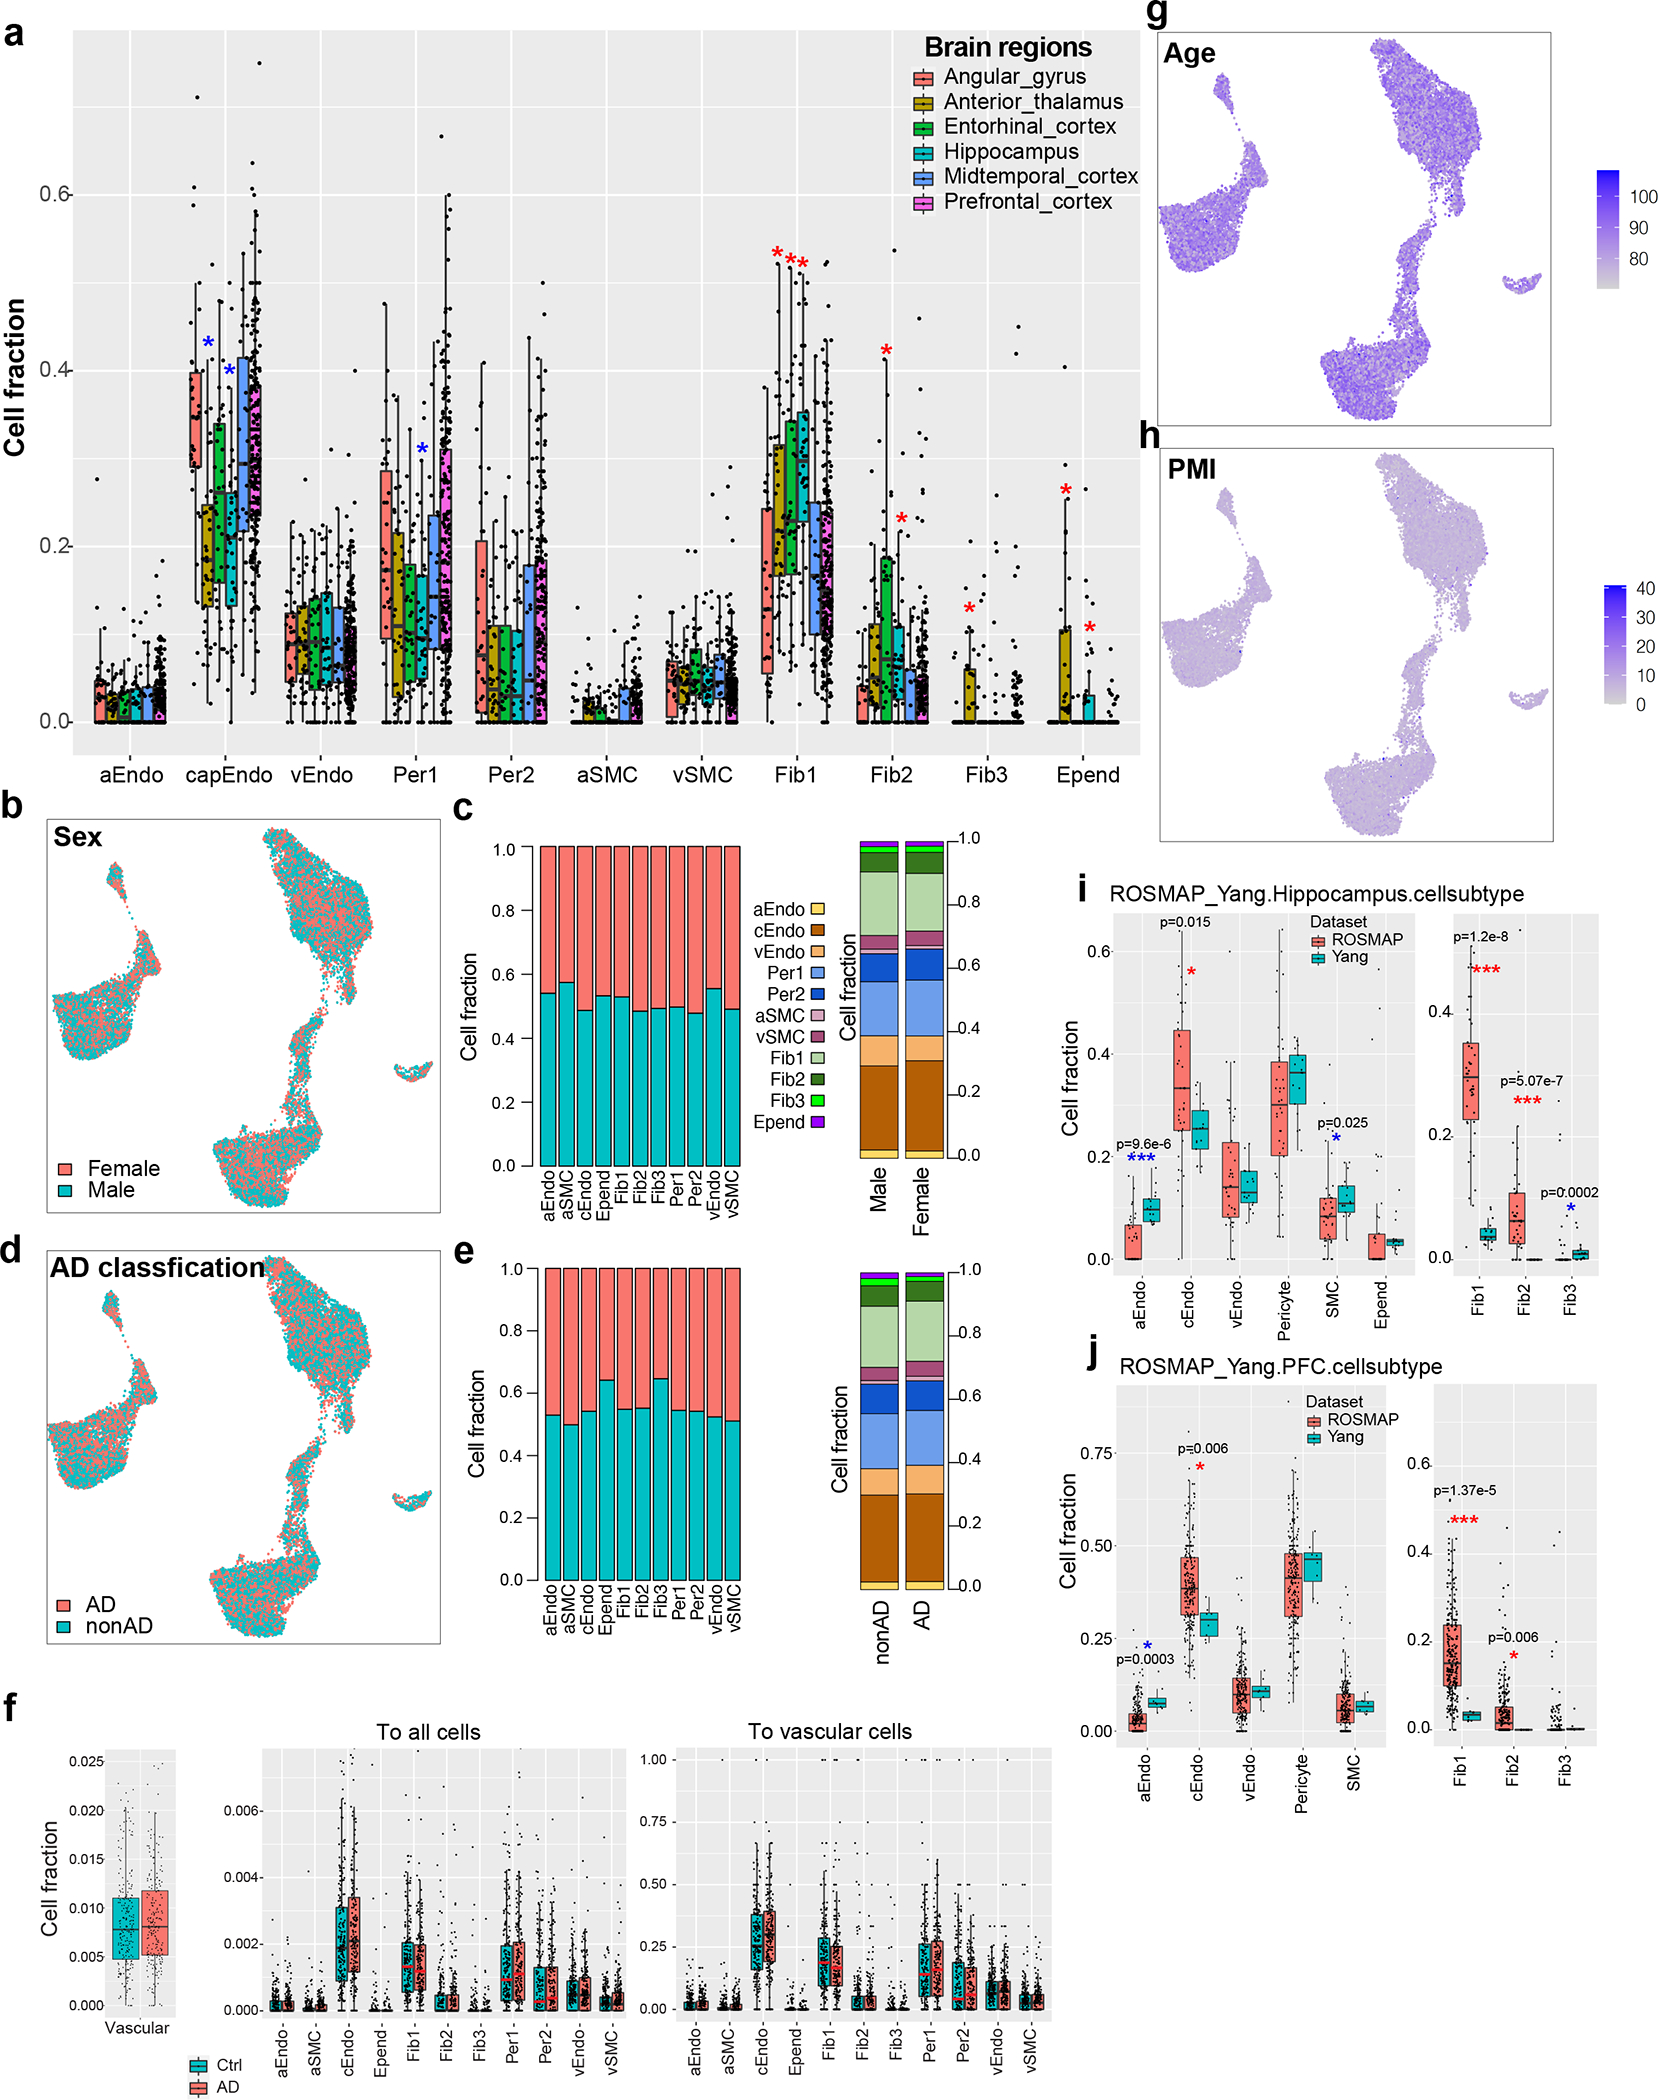
a. Distribution of cell fraction across six brain regions in cell subtypes. The stars represent the significance of cell types enriched(red star) or depleted(blue star) in specific regions compared to the overall fraction by the Wilcoxon rank test adjusted p-value < 0.05, n=409 in PFC; 47 in angular gyrus, mid-temporal cortex and thalamus; 45 in entorhinal cortex; 84 in hippocampus. The box starts in the first quantile (25%) and ends in the third (75%). The line inside represents the median. Two whiskers represent the maximum and minimum without outliers. b-c. Cerebrovascular cell distribution by sex. b. UMAP of brain vascular nuclei colored by sex. c. Cell fraction across sex for each cell type (left) and across cell types for male and female individuals (right). d-e. Cerebrovascular cell distribution by AD classification. d. UMAP of brain vascular nuclei colored by AD classification. e. cell fraction across AD classification for each cell type (left) and across cell types for AD and control individuals (right). f. Cell fraction distribution between control and AD individuals in overall vascular cells (left) and each cell type (middle: in all cells; right: in vascular cells) (n=220 for AD and n=208 for nonAD). The box starts in the first quantile (25%) and ends in the third (75%). The line inside represents the median. Two whiskers represent the maximum and minimum without outliers. g-h. UMAP of brain vascular nuclei colored by age (g) and PMI (h) showing no difference of cell distribution with age or PMI. i-j. Comparison of cell fraction between this study (labeled “ROSMAP”) and Yang et al. in hippocampus (i) and prefrontal cortex (j). Stars represent the statistical significance by the Wilcoxon rank test (*: adjusted p-value < 0.05 ***: adjusted p-value < 0.001). Blue stars indicate a higher fraction in Yang et al. and red stars represent a higher fraction in this study. For hippocampus, n=42 for ROSMAP data, n=17 for Yang et al. data; for PFC, n=233 for ROSMAP data, n=8 for Yang et al. data. The box starts in the first quantile (25%) and ends in the third (75%). The line inside represents the median. Two whiskers represent the maximum and minimum without outliers.
Extended Data Figure 3. Differential gene analysis across brain regions.
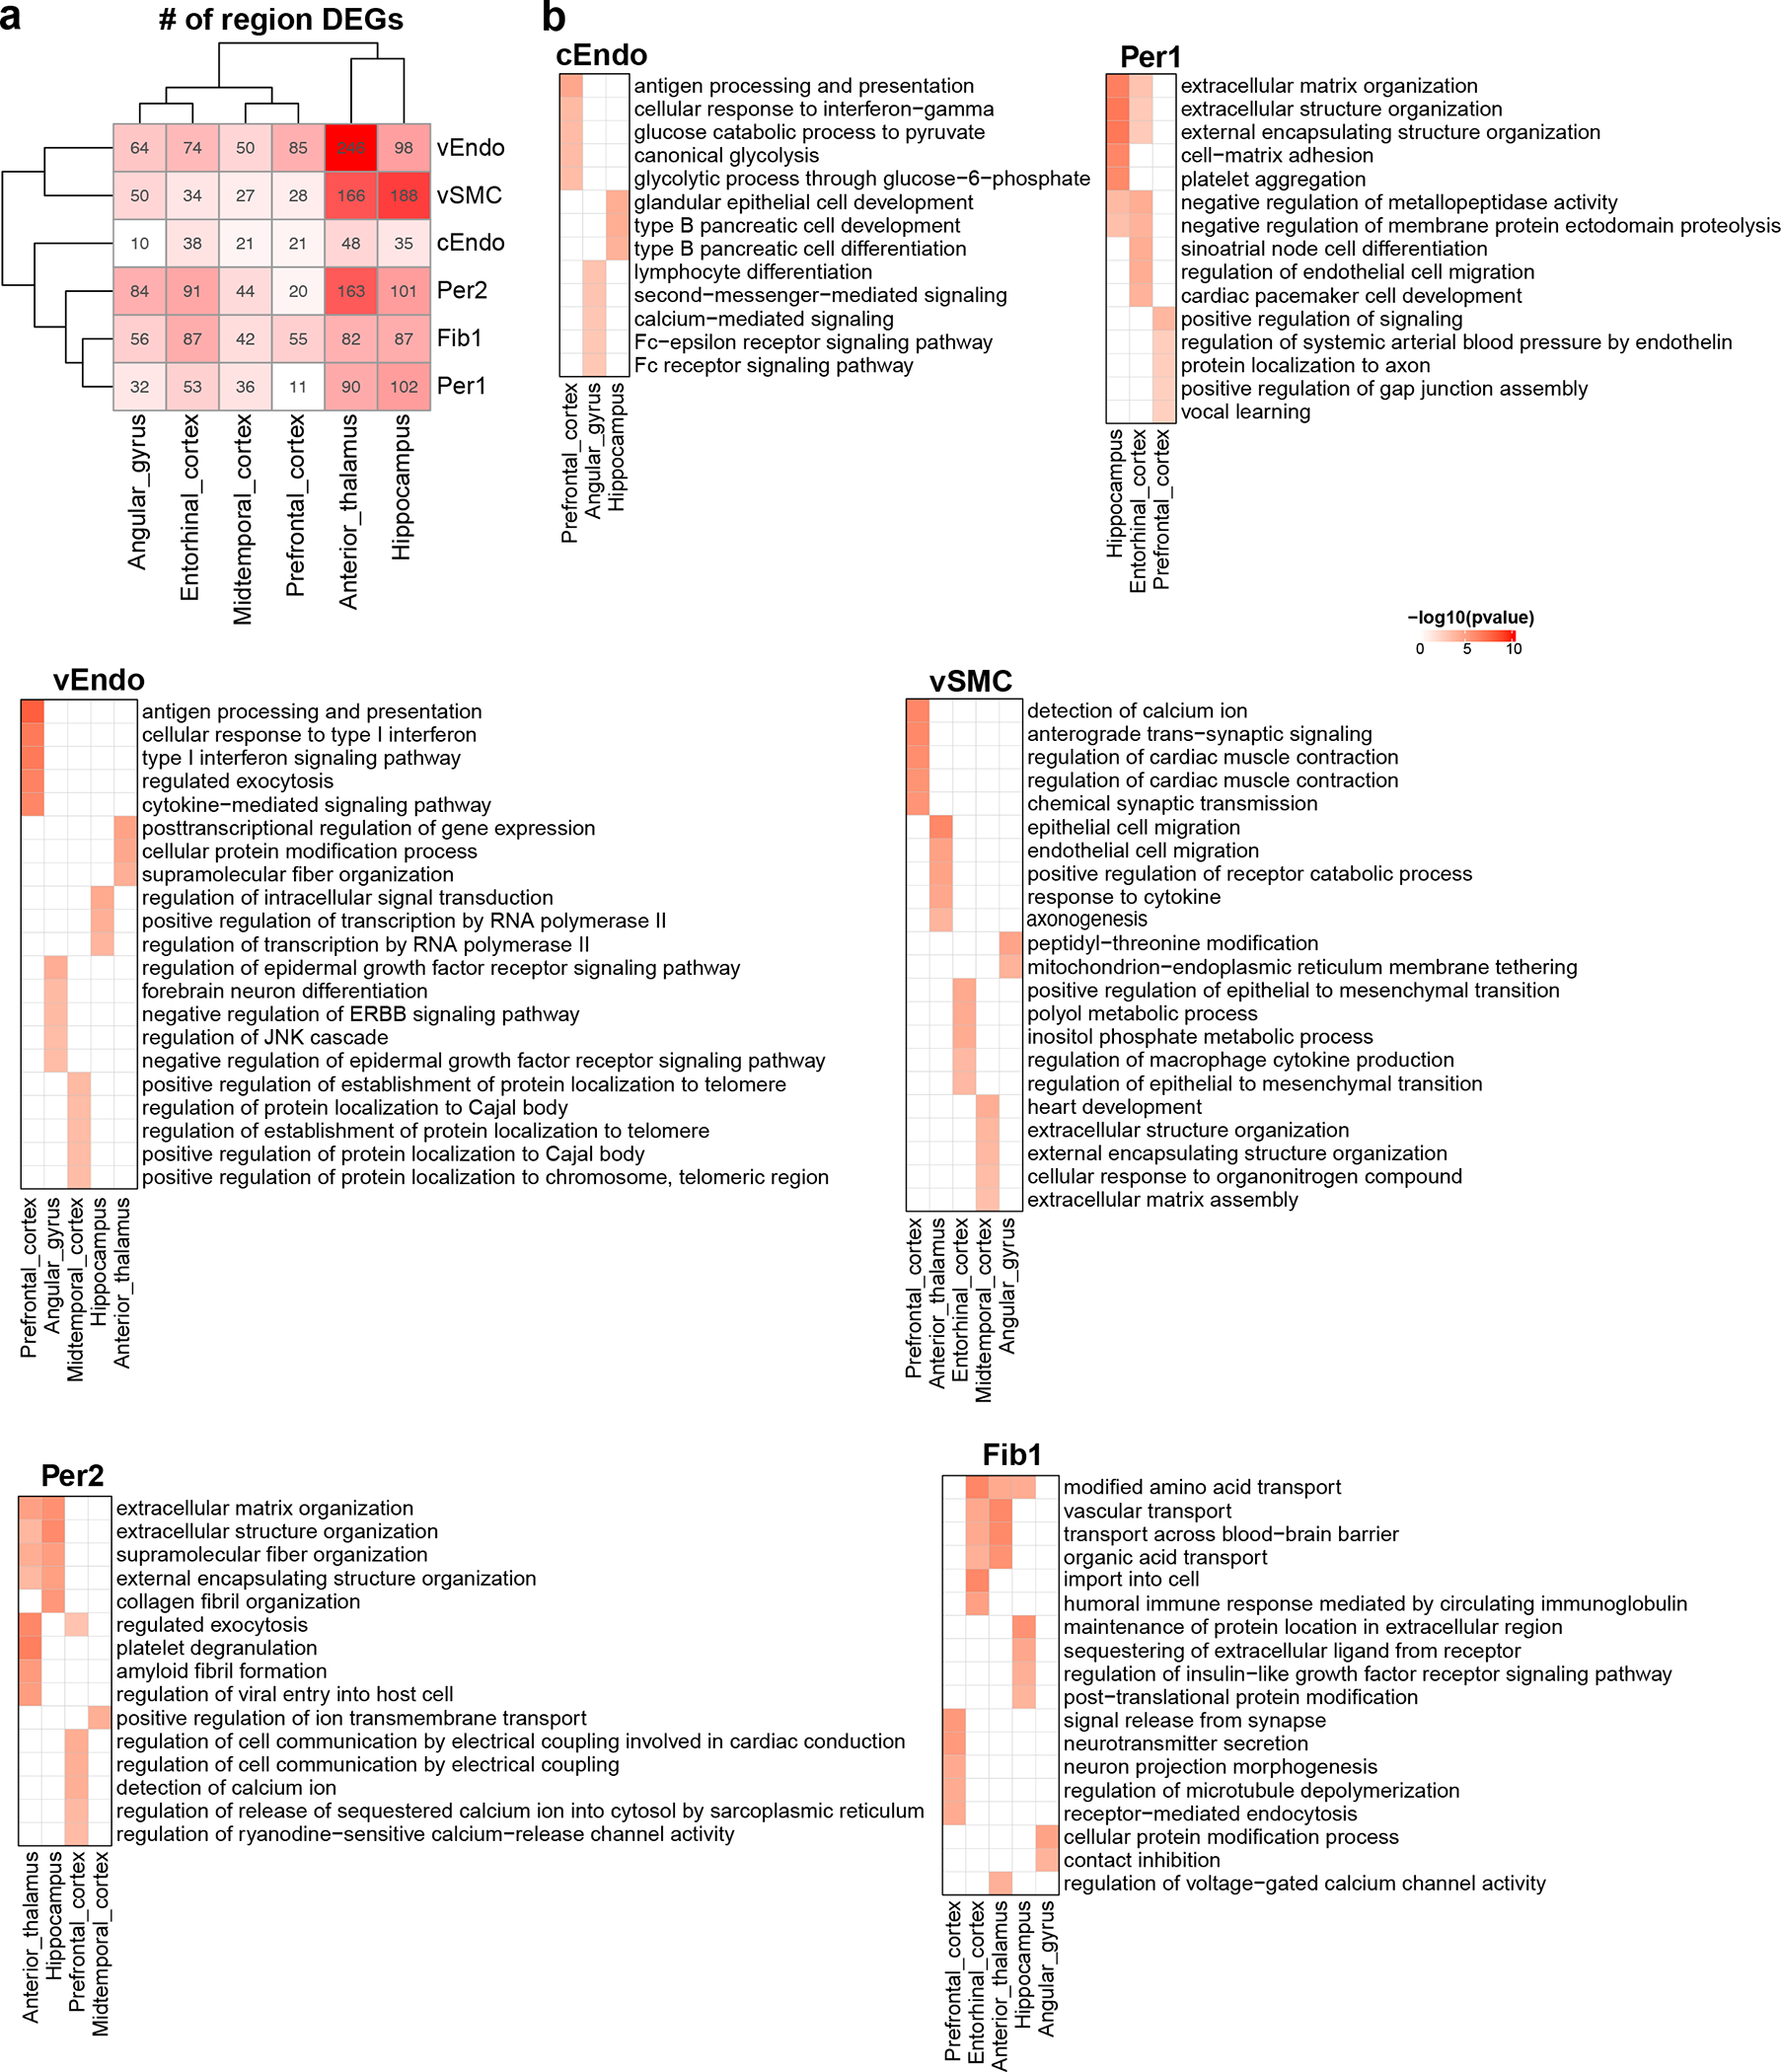
a. Heatmap of the number of highly expressed brDEGs in each region and for each cell type. The intensity of the color corresponds to the quantity of brDEGs (indicated in each cell). b. Enriched Gene Ontology biological processes in each cell type. Heatmap of −log10(p-value) indicates the significance. Enrichr in R was used to perform GO enrichment (proportion test, adjusted p-value < 0.05 as cutoff, one-sided). Only regions with enriched terms were kept.
Extended Data Figure 4. Cell-type-specific brain vasculature changes in AD.
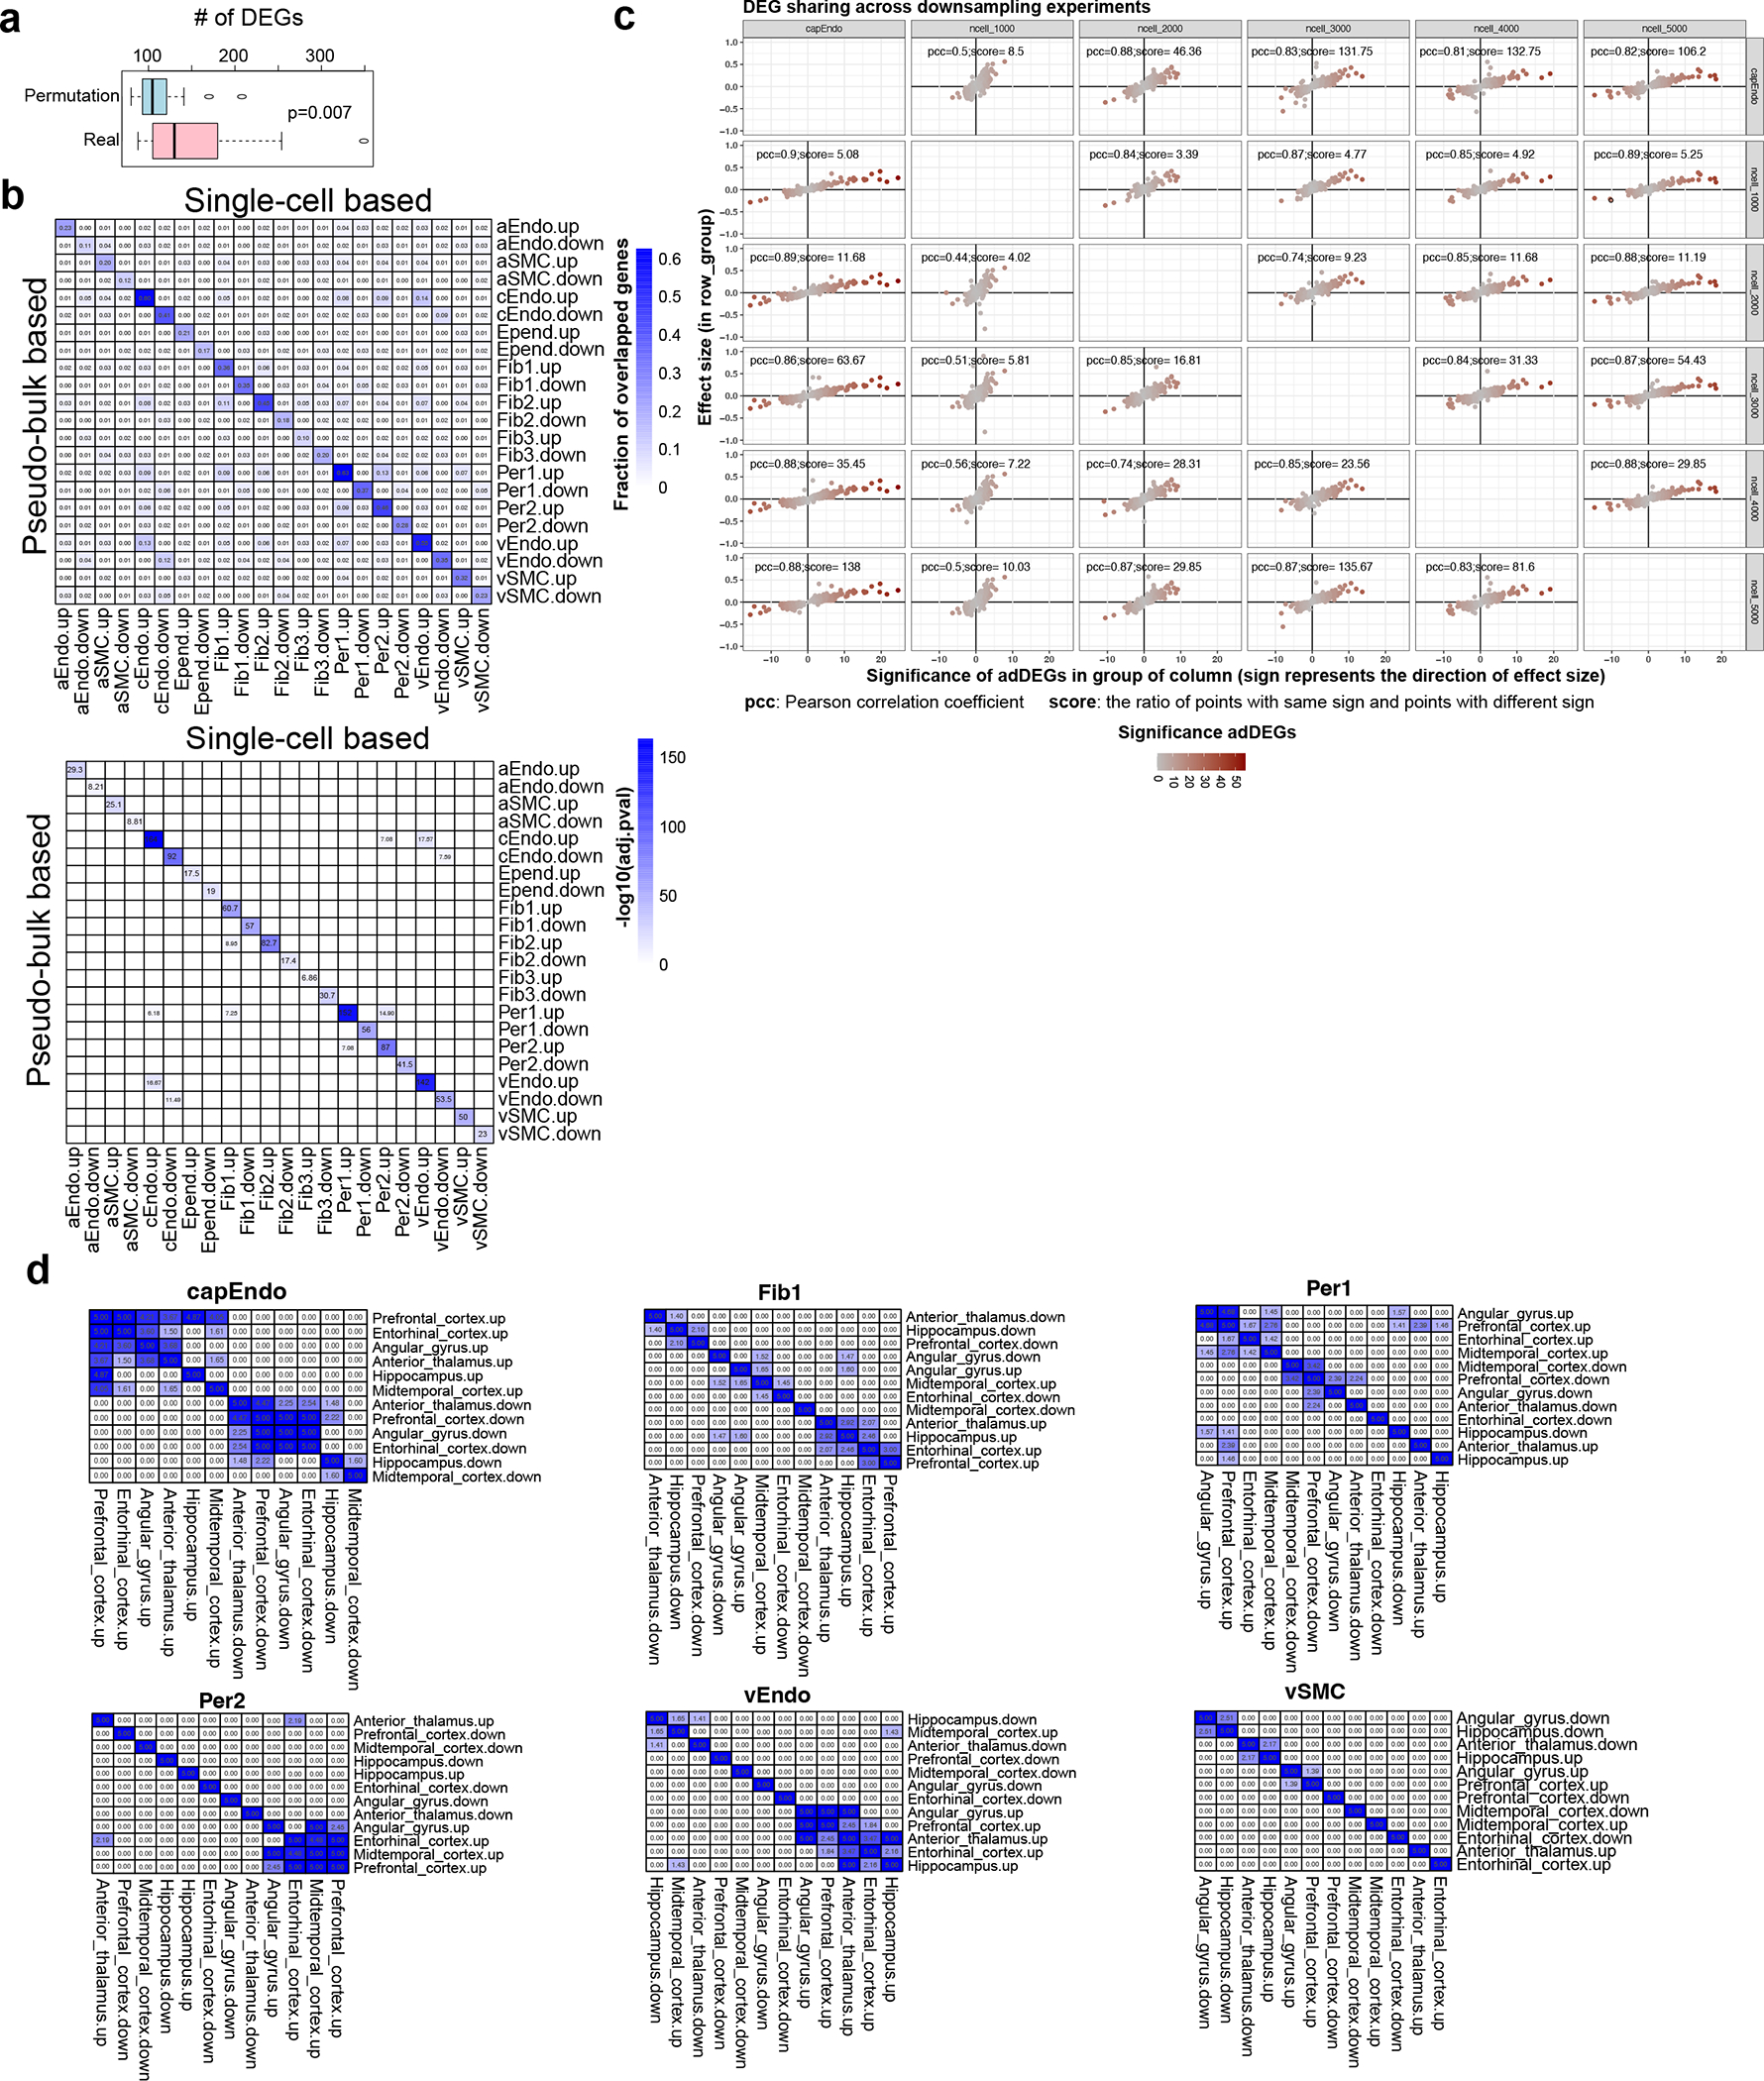
a. The distribution of numbers of adDEGs in permutation and real analysis. The adDEGs were identified based on permuted AD classification for each individual, and the p-value was estimated by t-test. n=428 individuals for permutation analysis. The box starts in the first quantile (25%) and ends in the third (75%). The line inside represents the median. Two whiskers represent the maximum and minimum without outliers. b. Heatmaps of the consistency of adDEGs using single-cell based (MAST) and pseudo-bulk based (edgeR) methods. The fraction of overlapped genes is shown in the top heatmap. The −log10(adj.p-value) by Fisher’s exact test represents the significance and is shown in the bottom heatmap (two-sided). c. The consistency of adDEGs in cEndo using different numbers of cells by downsampling analysis (1000, 2000, 3000, 4000, 5000 and the original 6195 cEndo cells). For each panel, the x-axis represents the significance of adDEGs in the downsampling condition listed at the top of the columns. The significance was measured by log(p-value), and the sign indicates the direction of effect size in this condition. The y-axis shows the effect size in the downsampling condition listed at the right of the rows. The effect size was measured by coefficient in MAST. d. Comparison of adDEGs across brain regions in each cell type. Each heatmap shows the significant overlap of adDEGs between brain regions in one cell type. Significance represented by −log10(adj.p-value) by Fisher’s exact test (two-sided). Six cell types with enough cells to identify adDEGs in each region are included in this analysis.
Extended Data Figure 5. Functional enrichment of adDEGs.
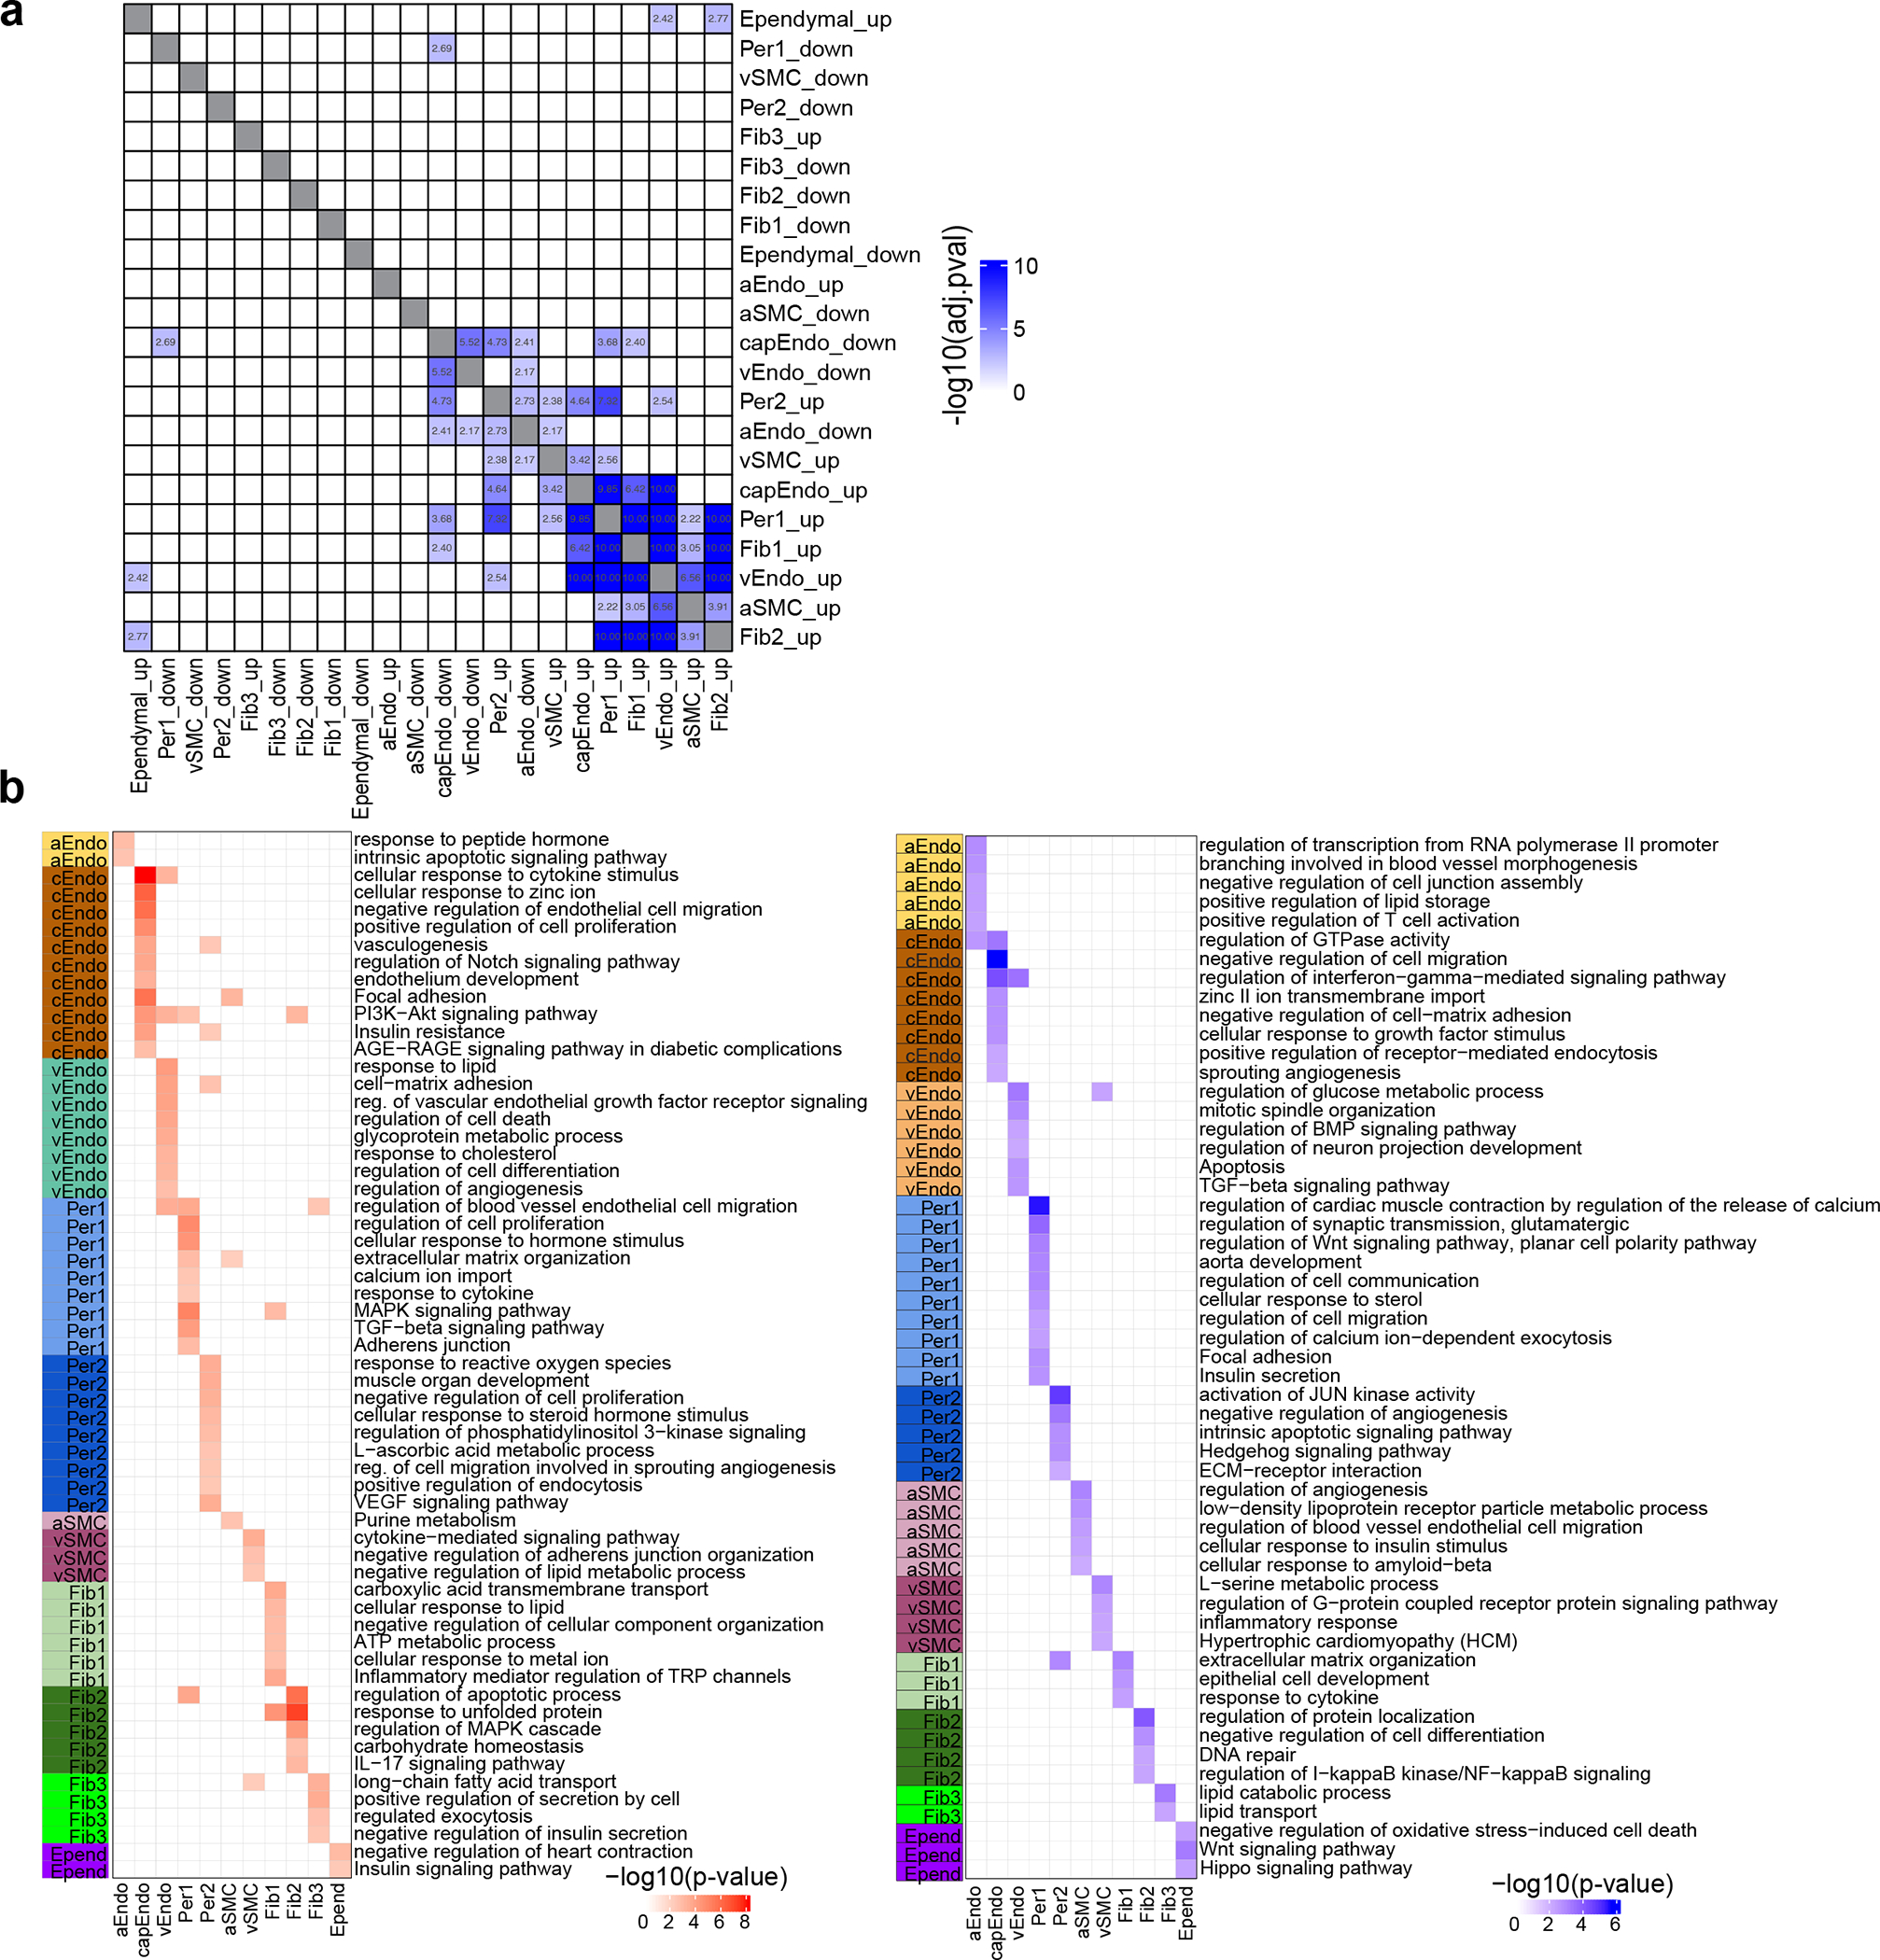
a. Heatmap showing the significance of GO term overlap between adDEG sets. The −log10(adj.p-value) by Fisher’s exact test represents the significance (adj.p-value < 0.05 as a cutoff). b. Top enriched Gene Ontology biological processes in up-regulated adDEGs (left) and down-regulated adDEGs (right). Enrichr in R was used to perform GO enrichment (proportion test, adjusted p-value < 0.05 as cutoff, one-sided). The full list of enriched GO terms is shown in Supplementary Table 7.
Extended Data Figure 6. Experimental validation of adDEGs.
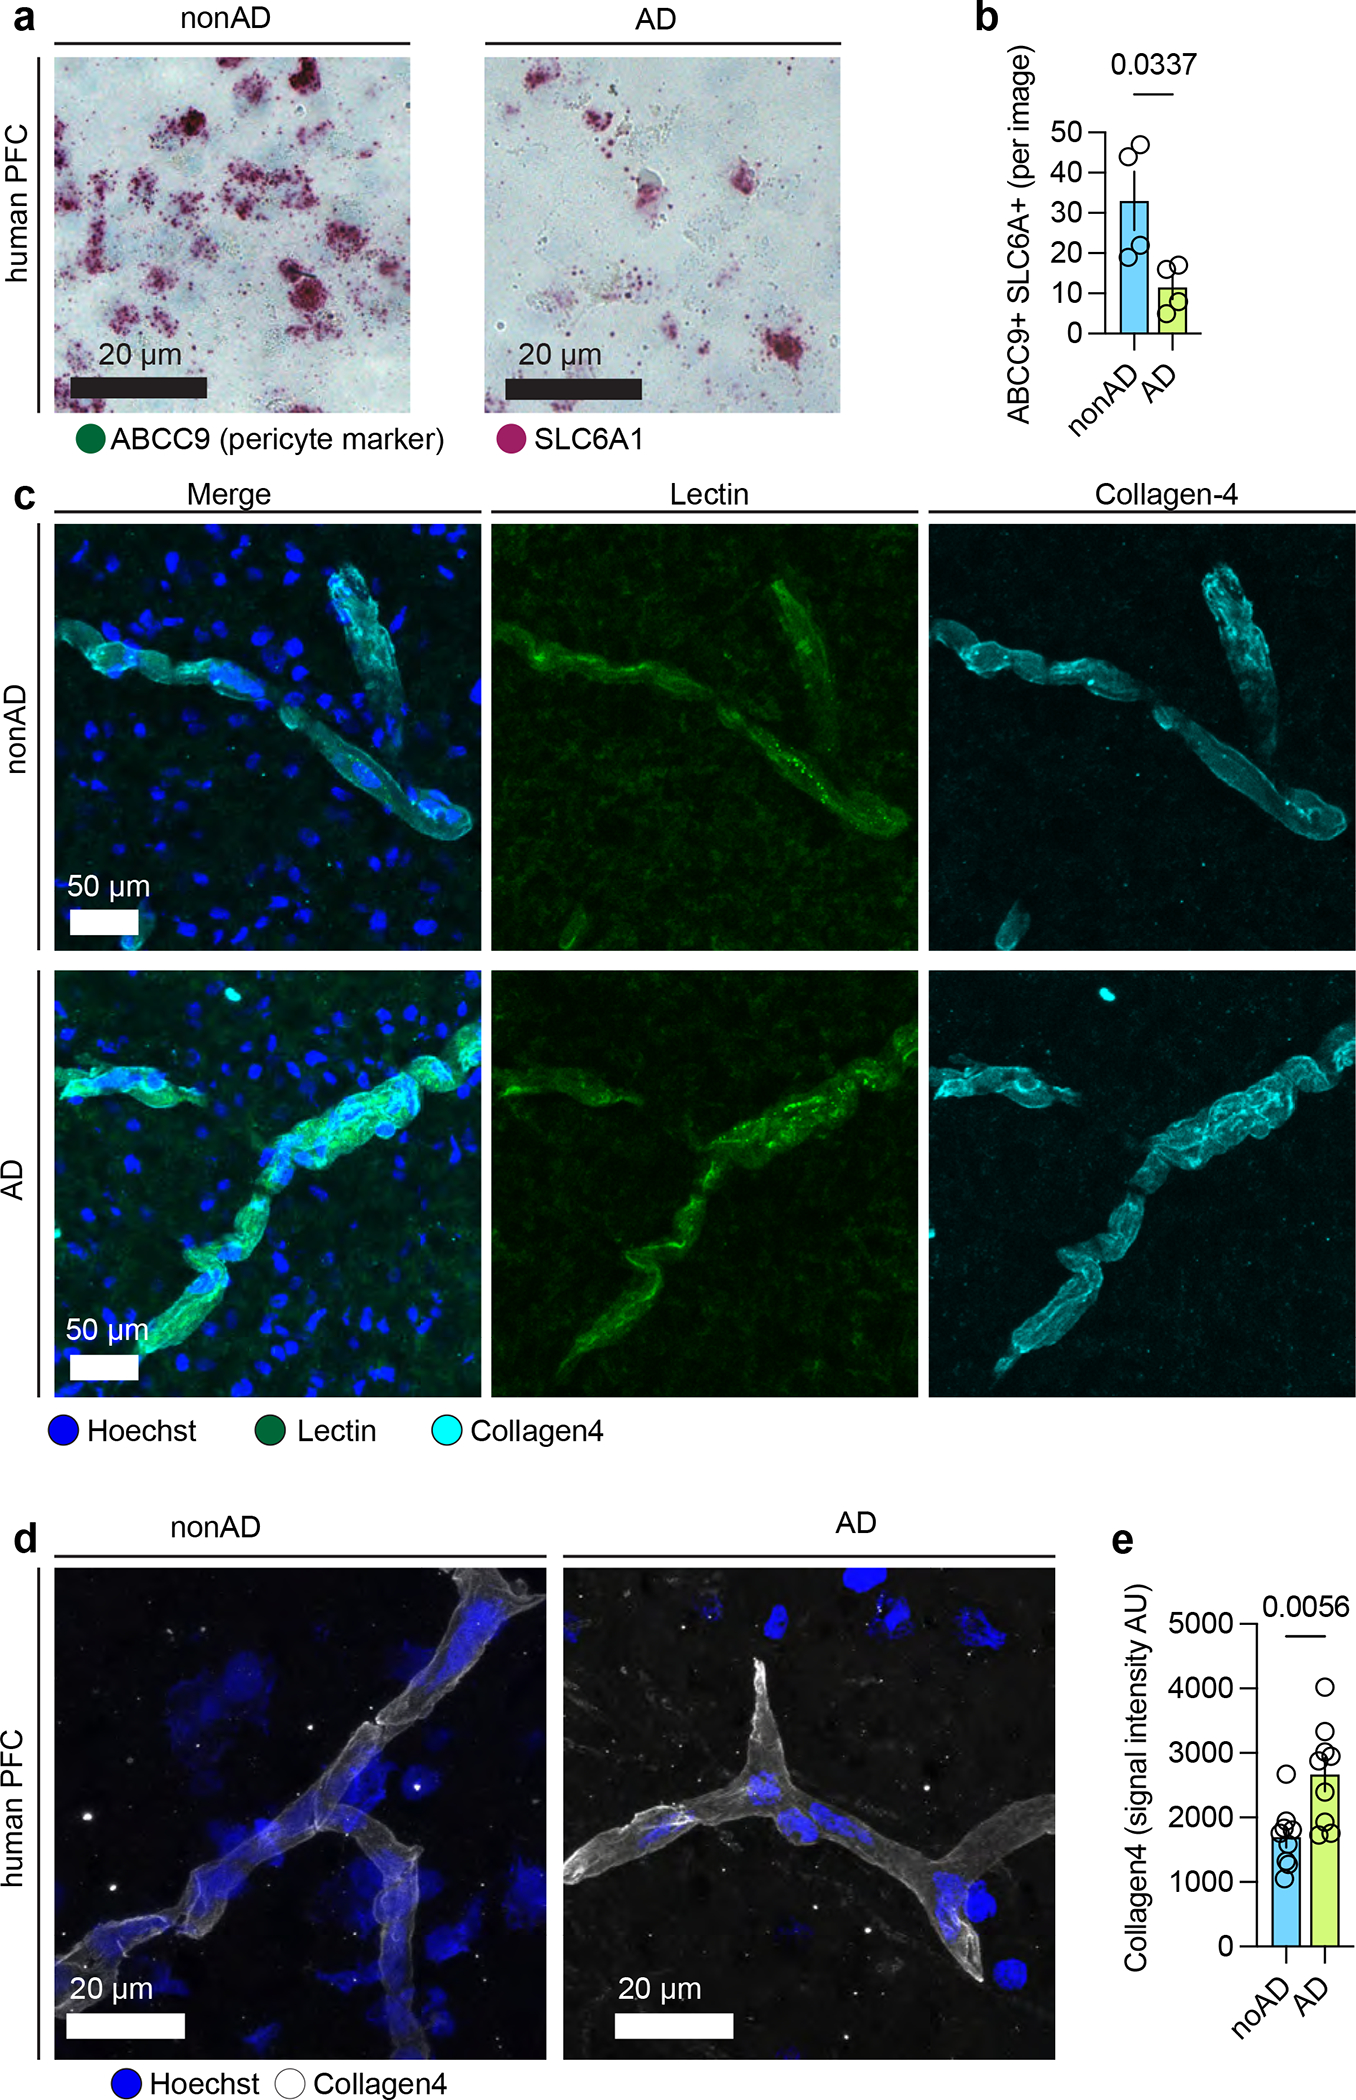
a. Chromogenic RNAscope for ABCC9 and SLC6A1. Prefrontal cortex brain sections (n=4 for AD and n=4 for nonAD) were sectioned at 20 μm (3 images per slide), then stored at −80°C. Sections were then prepared for RNAscope using the manufacturer’s instructions. Scale bar, 20 μm. b. Quantification of SLC6A and ABCC9 double-positive cells per image. P value was calculated by t-test. Data are presented as mean values +/− standard deviation. c. Collagen-4 and lectin-488 immunohistochemistry. Scale bar, 50 μm. d. Additional images of collagen-4 immunohistochemistry. Scale bar, 20 μm. e. Quantification of collagen-4 signal intensity. P value was calculated by t-test (n=4 for AD and n=4 for nonAD individuals). Data are presented as mean values +/− standard deviation.
Extended Data Figure 7. Upstream regulators of adDEGs.
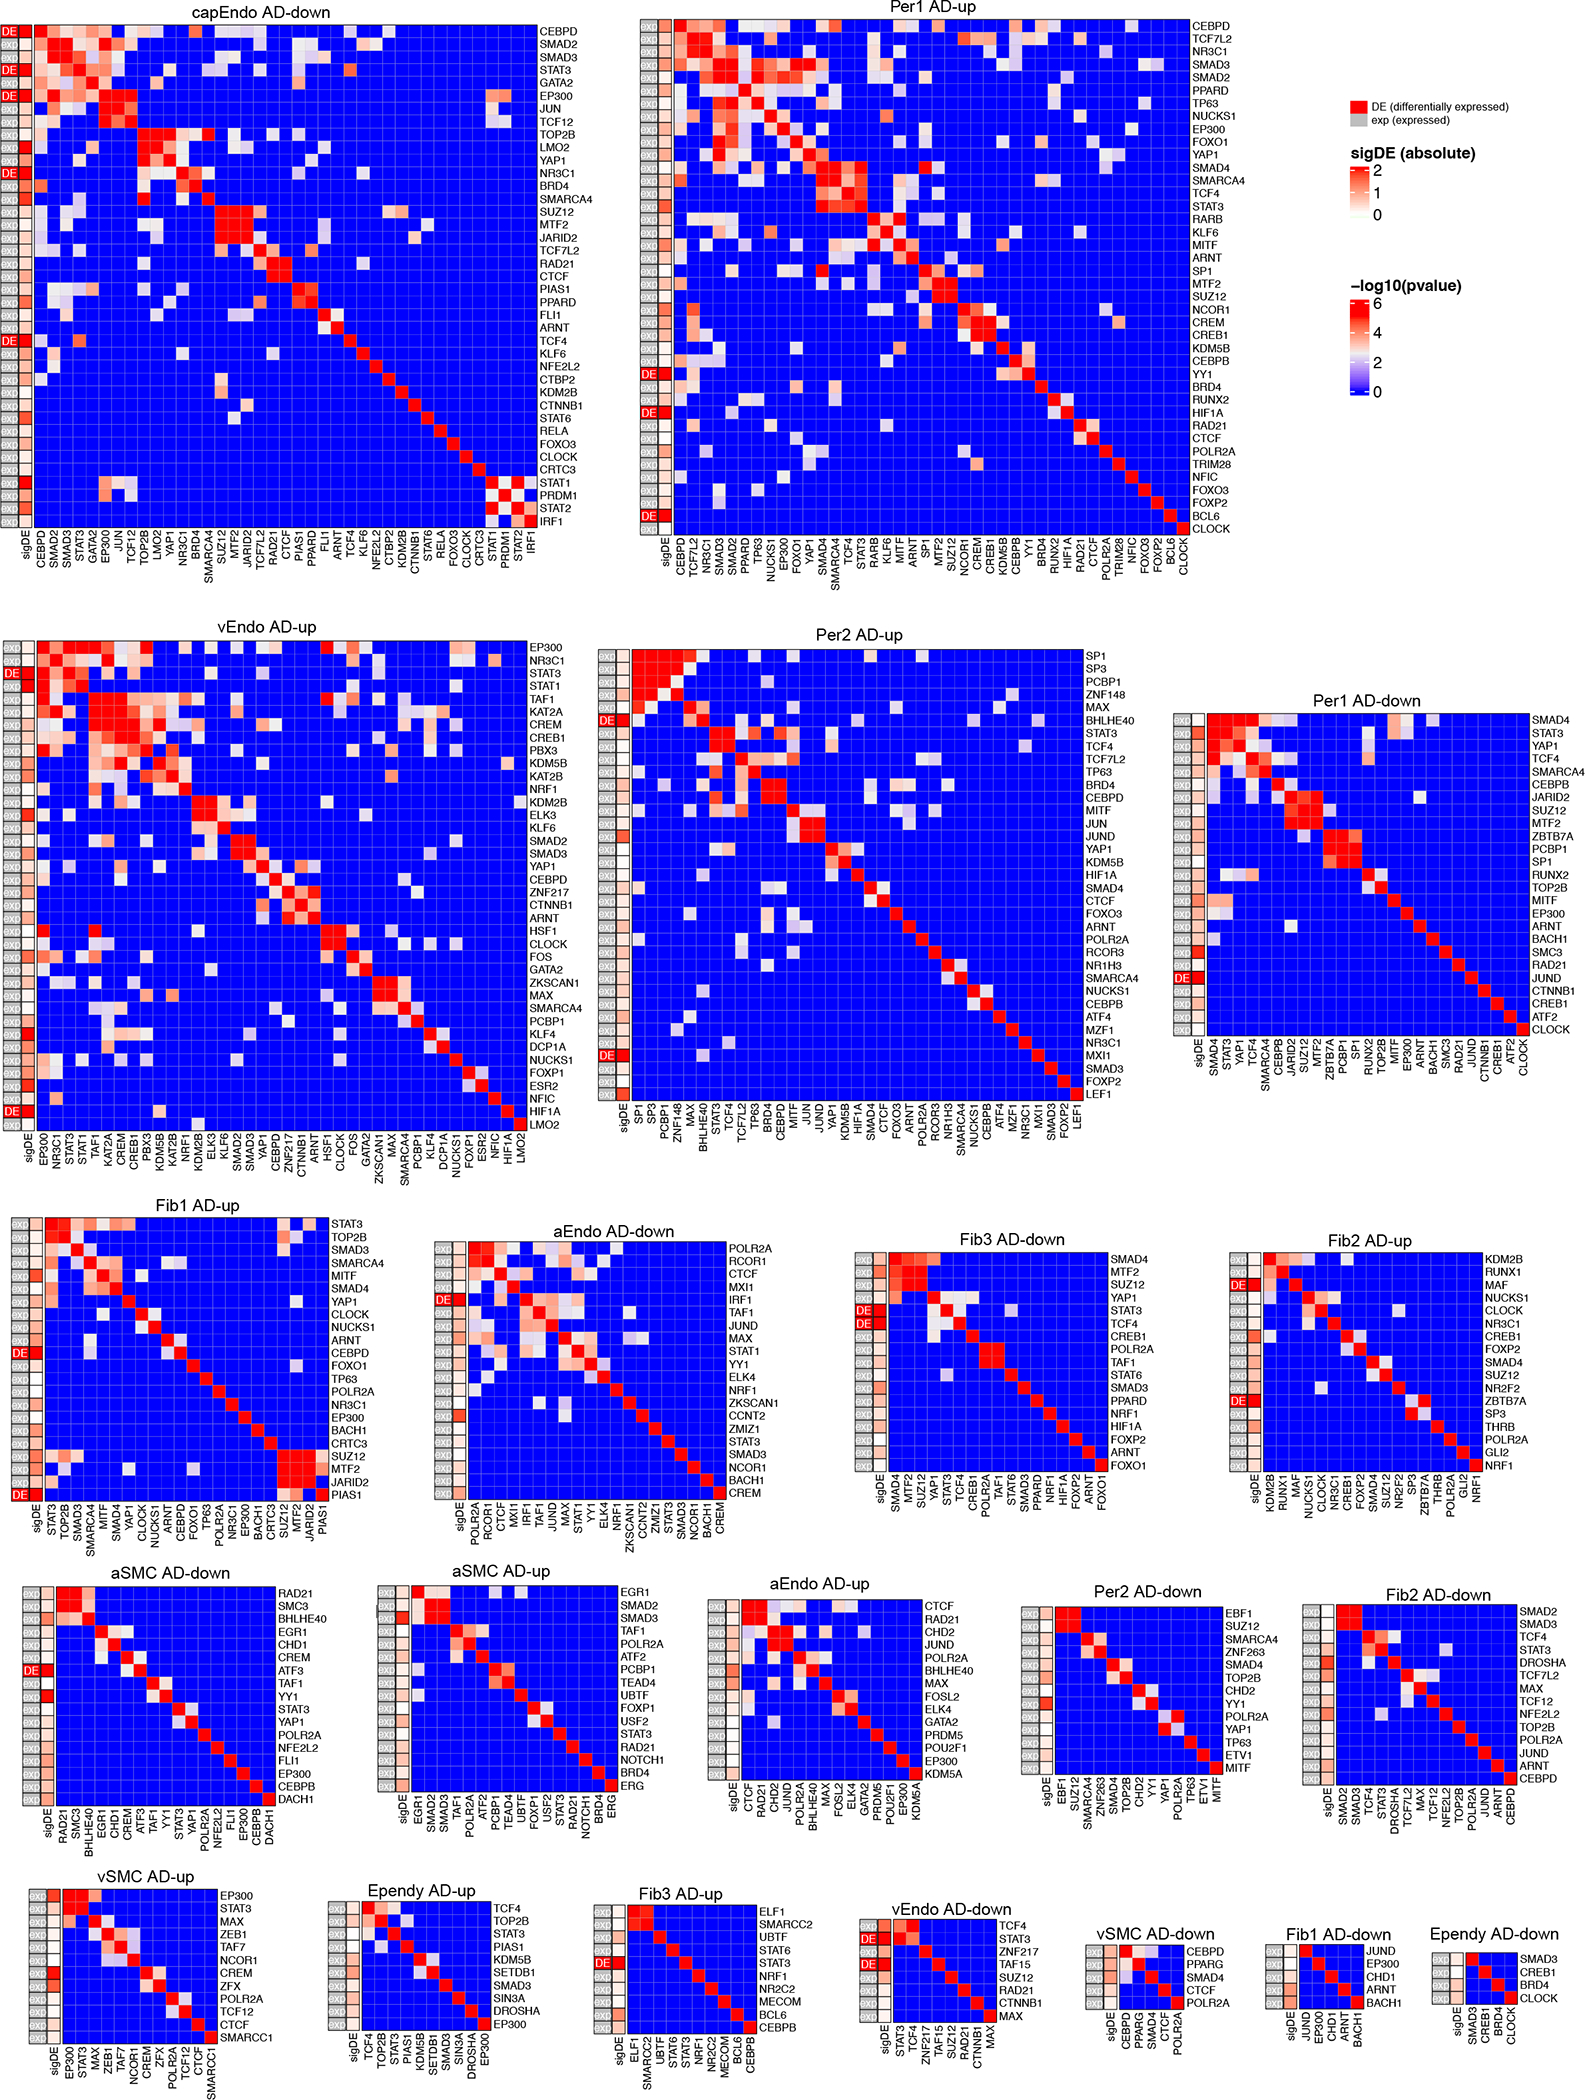
Regulator modules of adDEGs in 11 cell types. On the left of each heatmap, the first column shows if the regulator is significantly differentially expressed (adDEGs, labeled as DE) or just expressed (exp) in the corresponding 4 cell type. The second column shows the significance of differential expression as represented by the coefficient calculated in MAST analysis. The heatmap shows −log10(p-value) to represent the significance of overlapping targets between regulators by Fisher’s exact test (two-sided).
Extended Data Figure 8. Dynamics of cell-cell communications between vascular cell types and neuron/glial cells in AD.
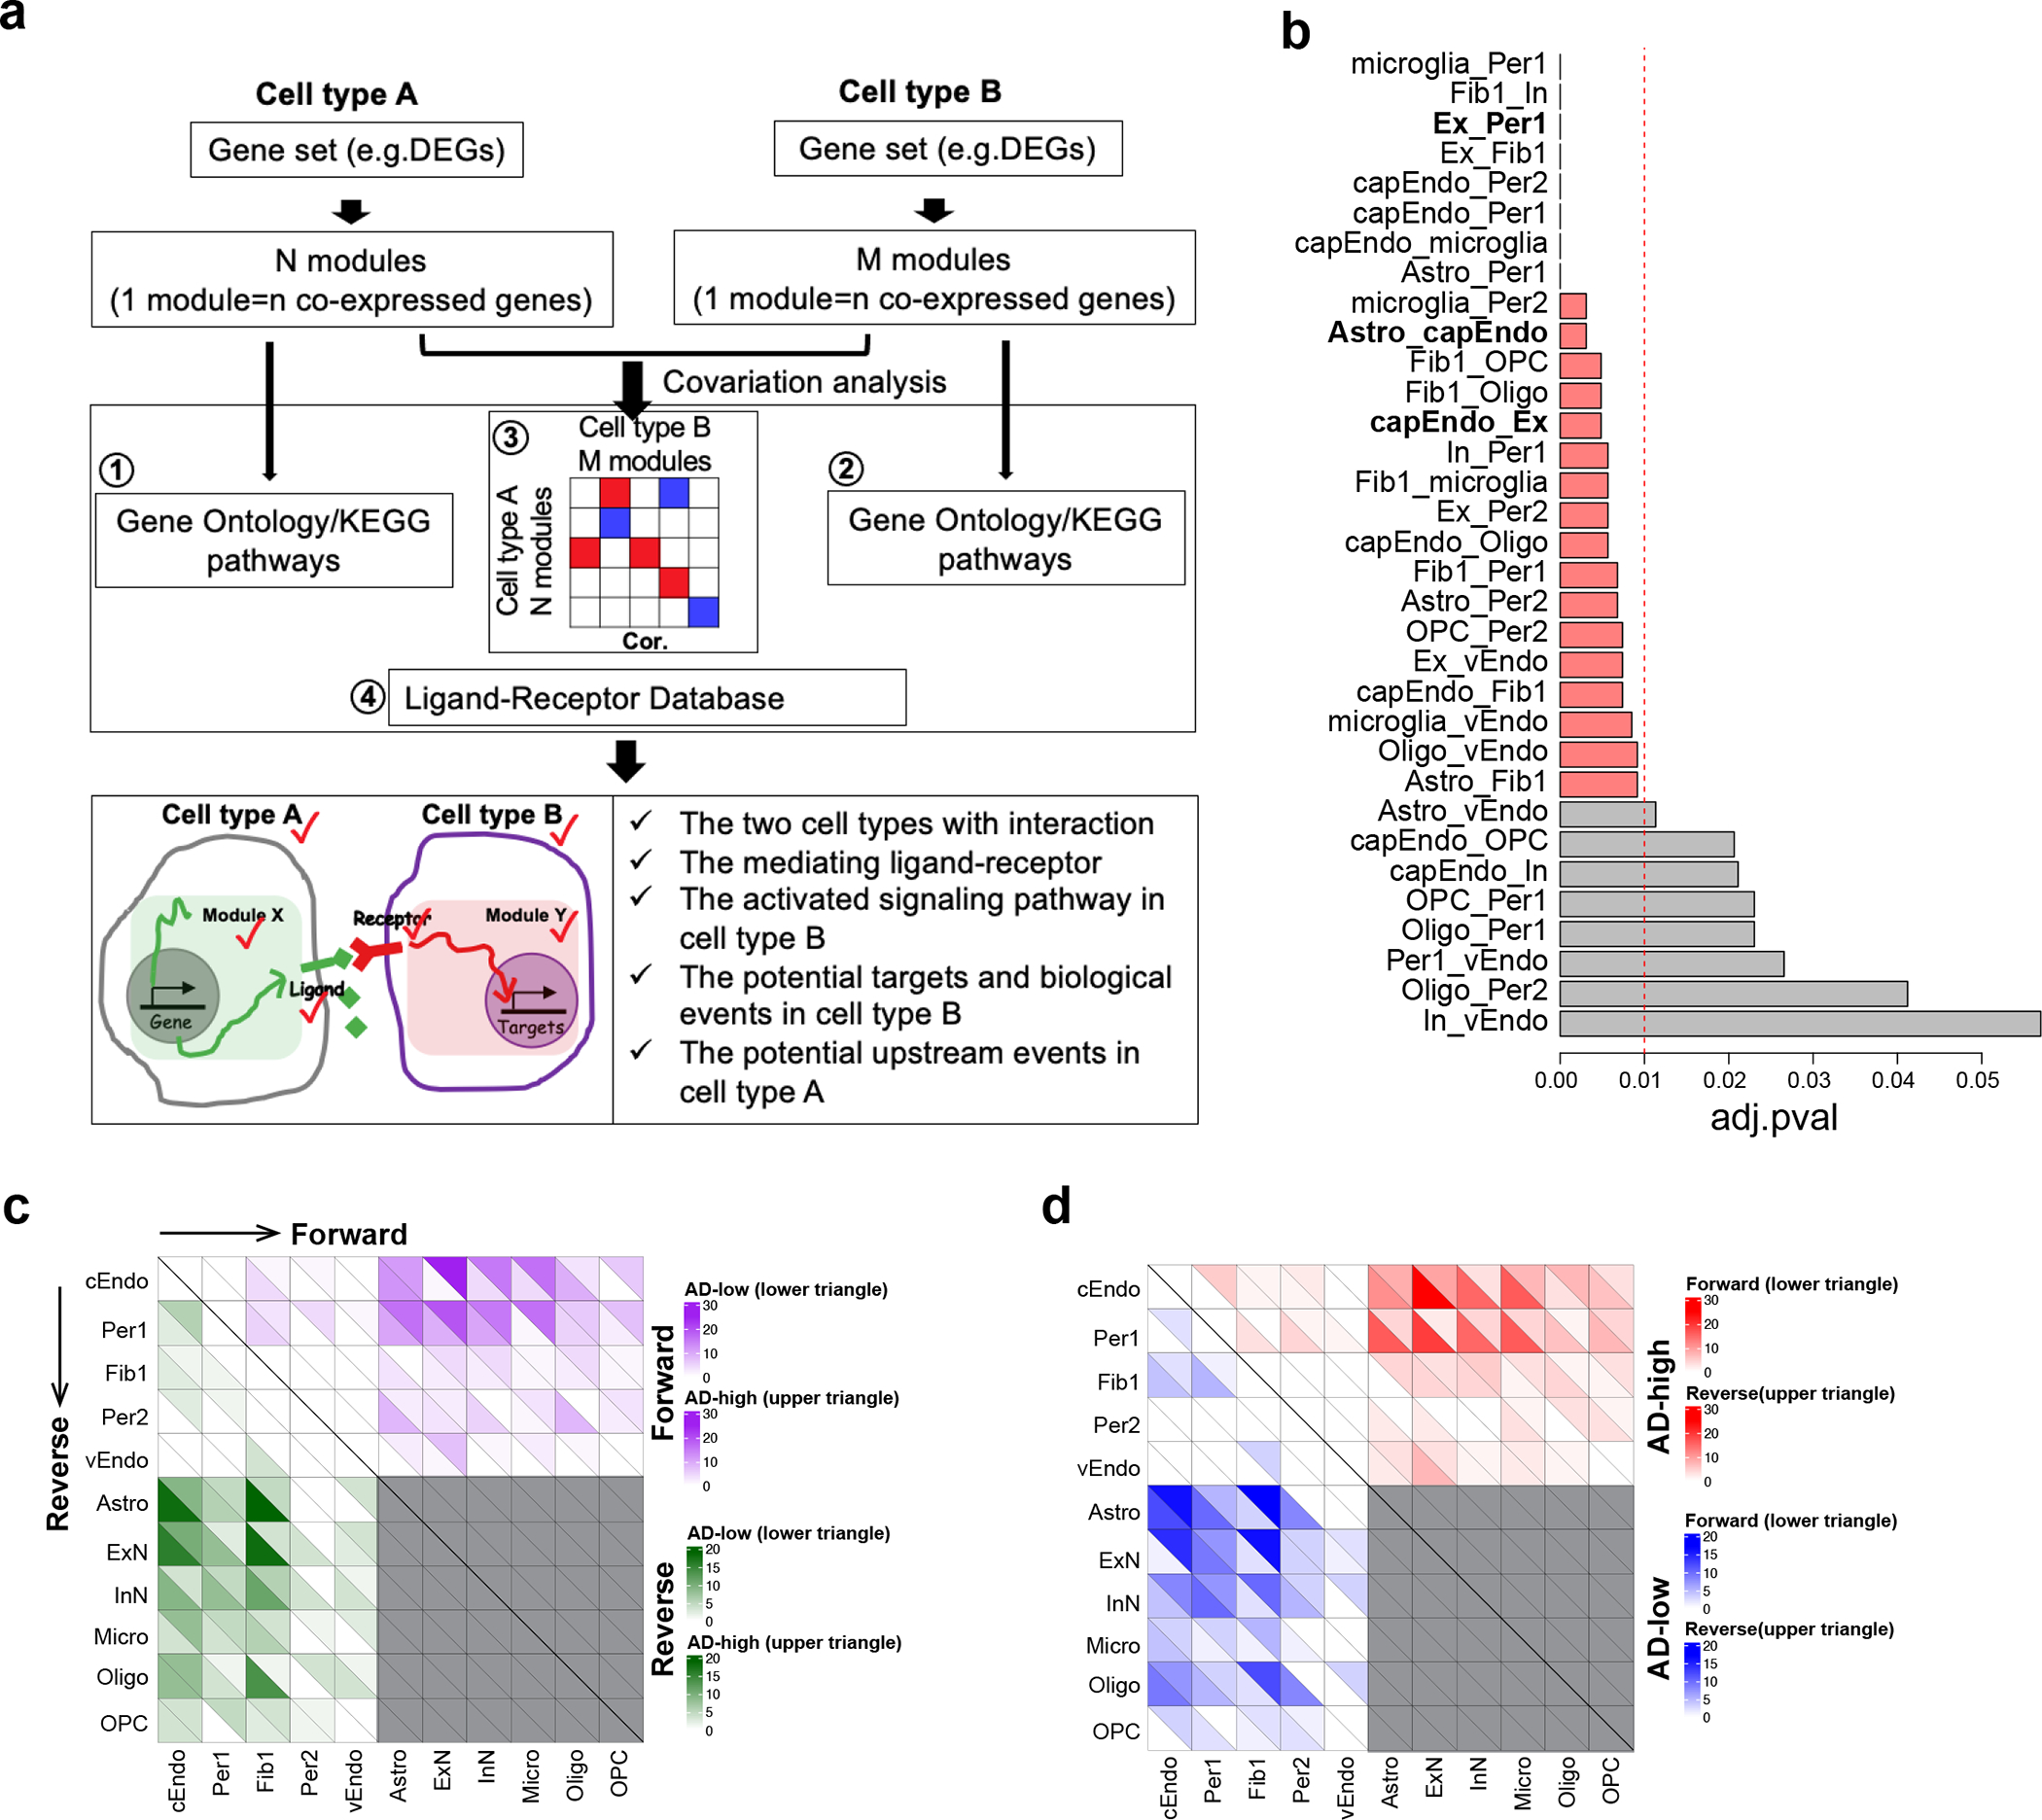
a. Computational framework to infer cell-cell communications. For each cell type, a set of genes was clustered into a number of co-expressed modules. The pairwise Pearson correlation coefficient was calculated between modules for each pair of cell types. The significantly correlated modules, functional enrichment, and ligand-receptor pairs were integrated into the prediction of cell-cell communication. The output includes the interacting cell types, ligand, ligand-involved functions, receptor, receptor-involved functions, potential targets in signal receiver cell type, and direction of cell-cell communication (as determined by the changes of ligand-receptor and their co-expressed genes in the same module) in AD. b. Barplot showing the statistical significance of the cell-cell communications, as represented by the adjusted p-value using a permutation test in each pair of interacting cell types. An adjusted p-value of 0.01 (dashed line) was used as a cutoff. The three cell pairs which had the most cell-cell communication (Ex_Per1, Astro_cEndo and cEndo_Ex) are highlighted in bold. c. Heatmap showing the up- and down-regulation of both forward and reverse cell-cell communications in AD. The purple indicates the number of forward interactions (from cell type on the left of the plot to cell type on the bottom of the plot) that were upregulated in AD (upper triangle in each square) and downregulated in AD (lower triangle in each square). The green indicates the number of reverse interactions (from the cell type on the bottom of the plot to the cell type on the left of the plot) that were upregulated in AD (upper triangle in each square) and downregulated in AD (lower triangle in each square). d. Heatmap showing the forward and reverse cell-cell communications that are both up- and down-regulated in AD. The red indicates the number of upregulated interactions in AD that are forward interactions (from cell type on the left of the plot to cell type on the bottom of the plot, lower triangle) and reverse interactions (from the cell type on the bottom of the plot to the cell type on the left of the plot, upper triangle). The blue indicates the number of downregulated interactions in AD that are forward interactions (from cell type on the left of the plot to cell type on the bottom of the plot, lower triangle) and reverse interactions (from the cell type on the bottom of the plot to the cell type on the left of the plot, upper triangle).
Extended Data Figure 9. AD GWAS loci linked to brain vascular adDEGs.
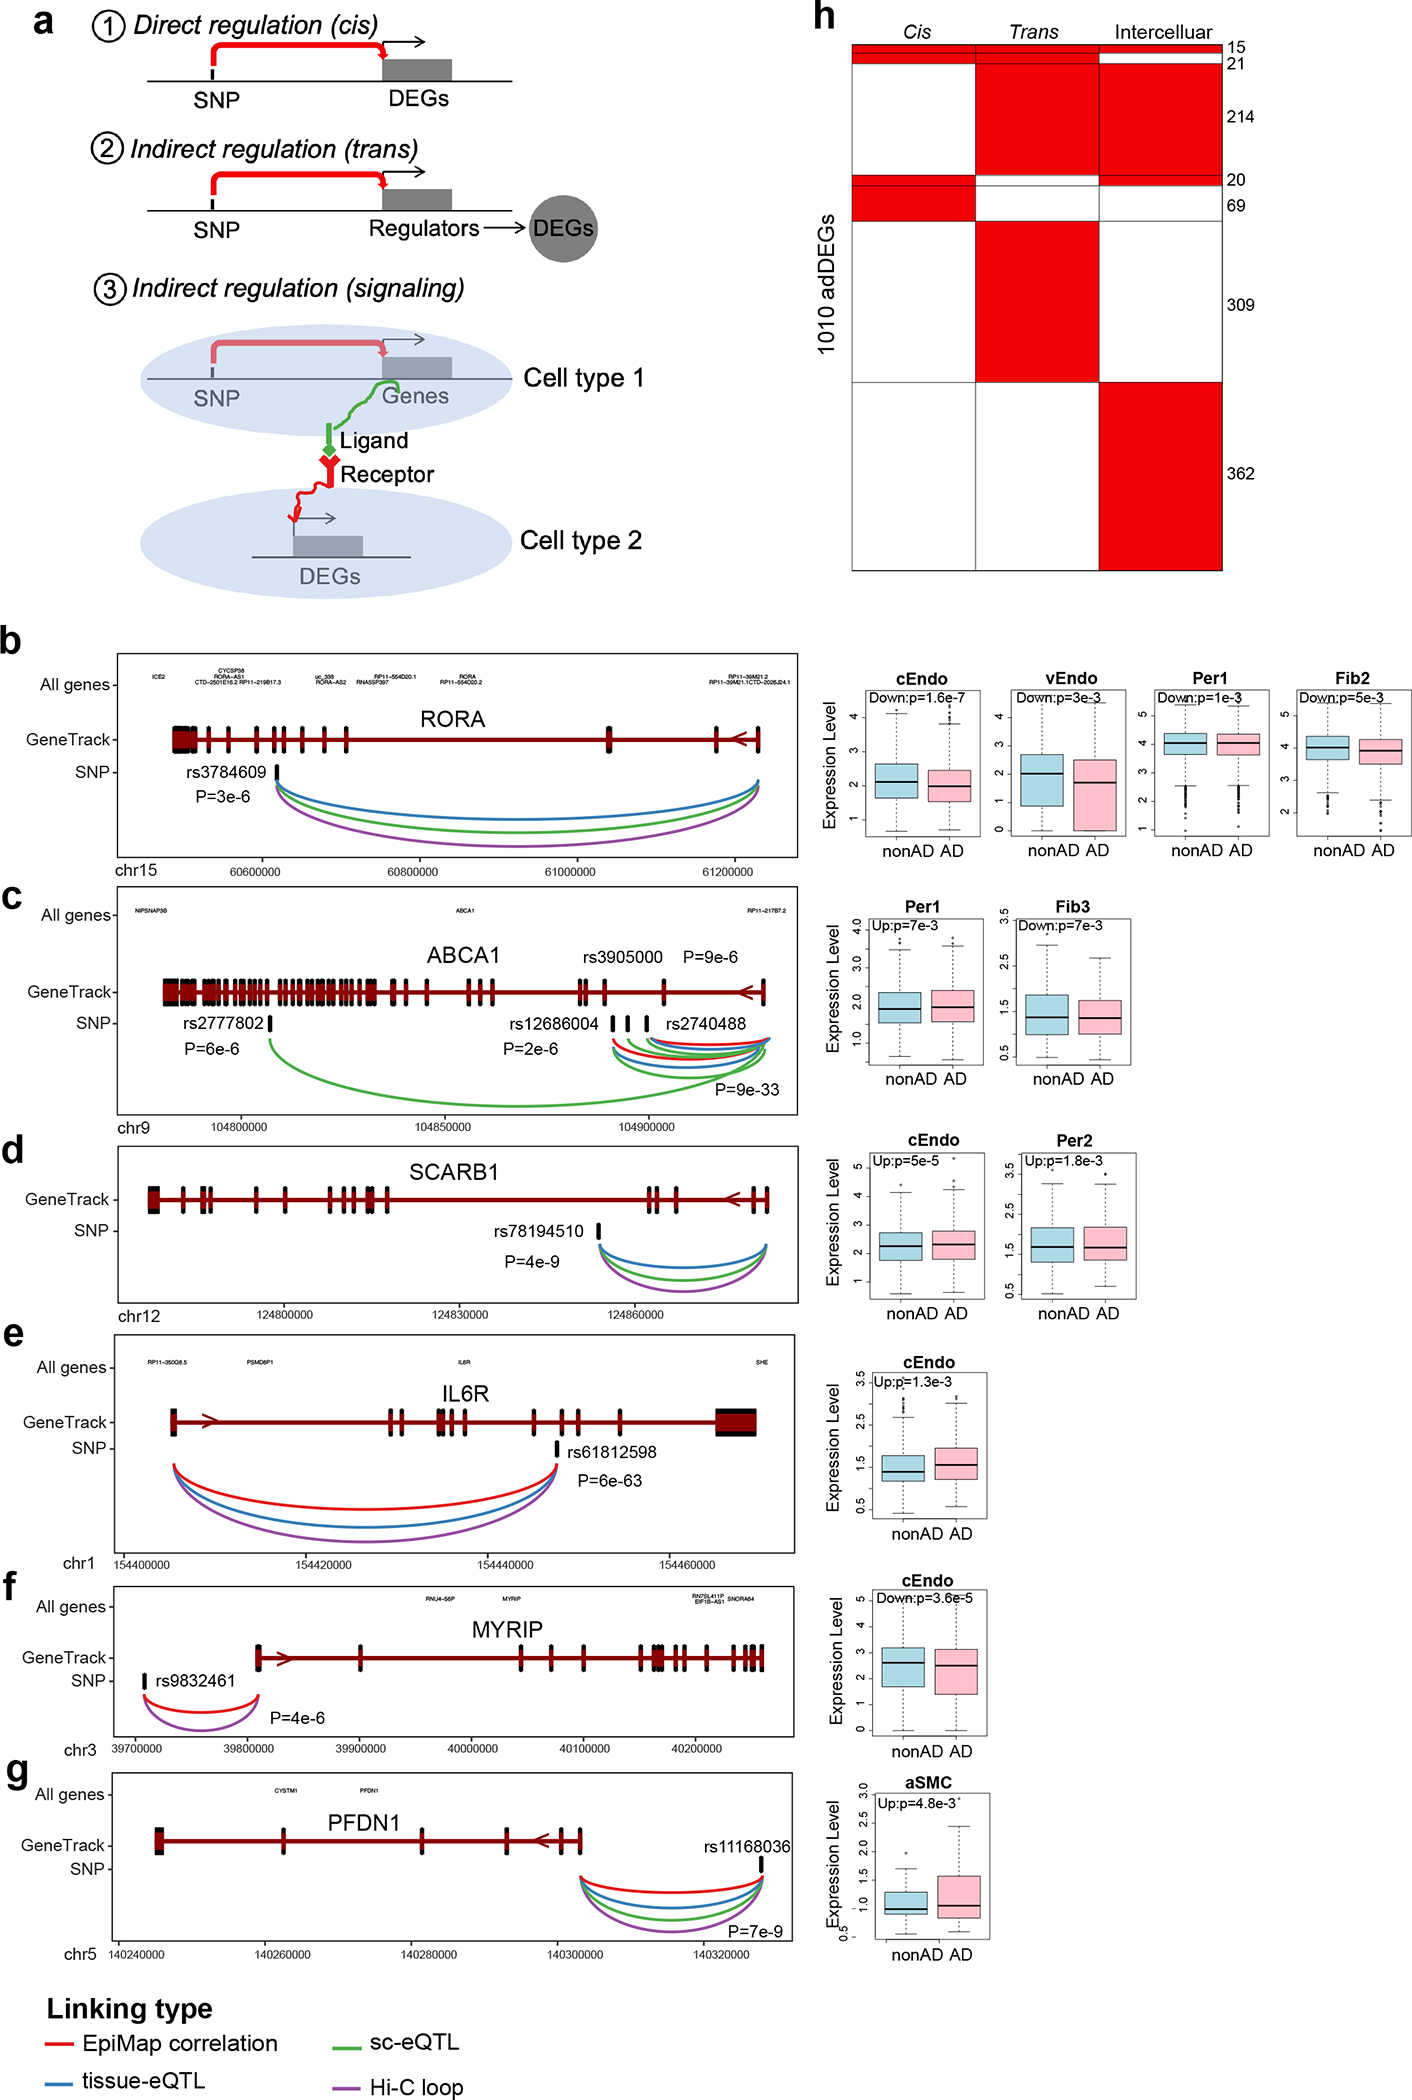
a. Three proposed types of regulatory mechanisms to interpret the association between adDEGs and AD genetic variants: (1) SNP directly (cis) regulates adDEG; (2) SNP indirectly (trans) regulate adDEG; (3) SNP indirectly (ligand-receptor signaling) regulates adDEG. b-g. Examples of adDEGs directly regulated by AD-associated variants through linking (eQTLs, Hi-C, promoter-enhancer correlation) along with the expression changes in vascular cell types in AD shown in the boxplots on the right (n=10,272 and 12,242 nuclei in AD and control individuals). The box starts in the first quantile (25%) and ends in the third (75%). The line inside represents the median. Two whiskers represent the maximum and minimum without outliers. Likelihood ratio test is used here (two-sided, adjusted p-value < 0.05 as cutoff. P-value is shown in the barplot.). h. The number of targets regulated by three, two, or only one of the regulatory mechanisms.
Extended Data Figure 10. APOE4-associated DEGs and cognitive decline.
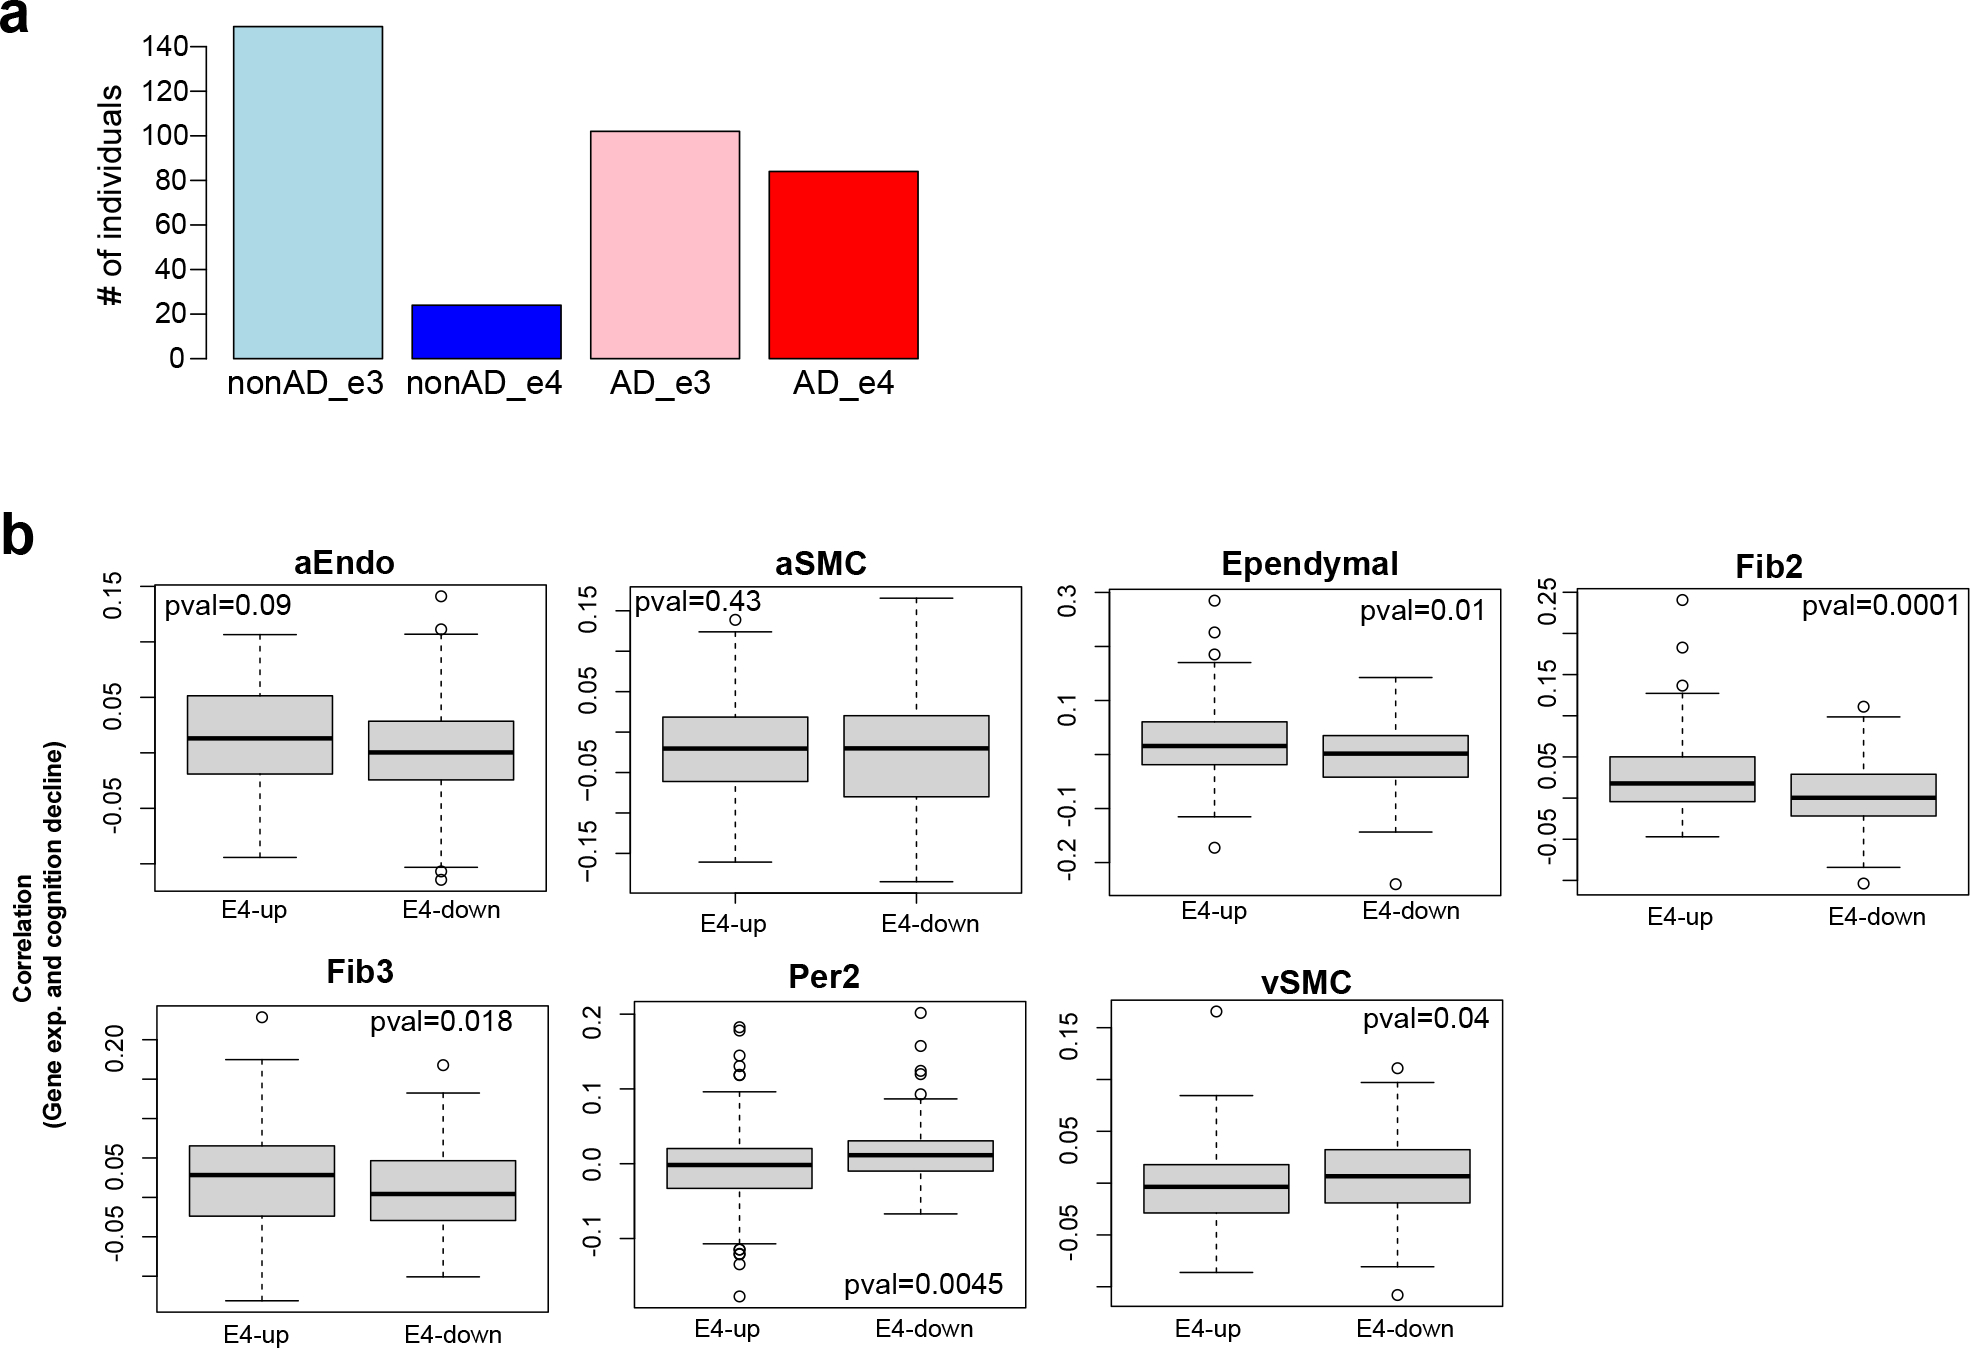
a. The number of individuals with each combination of AD classification and APOE genotype: nonAD with ε33 alleles, nonAD with ε4 allele, AD with ε33 alleles, and AD with ε4 allele. b. The comparison of apoeDEGs correlation with cognitive decline between up-regulated and down-regulated apoeDEGs in the APOE4 group in each cell type.
Supplementary Material
Acknowledgements
We thank the study participants and staff of the Rush Alzheimer’s Disease Center. This work was supported in part by NIH grants AG054012, AG058002, AG062377, NS110453, NS115064, AG062335, NS127187 (M.K., L.-H.T.); AG067151, MH109978, MH119509, HG008155, DA053631 (M.K.); P30AG10161, P30AG72975, R01AG15819, R01AG17917, U01AG46152, U01AG61356, and R01AG57473 (D.A.B.); and the Cure Alzheimer’s Foundation CIRCUITS consortium (M.K., L.-H.T); The JPB Foundation (L.-H.T.); Robert A. and Renee Belfer (L.-H.T.); N.S. was supported by Takeda Fellowship from Takeda Pharmaceutical Company. We thank Carles A. Boix, Lei Hou, Amy Grayson and Patricia Purcell for scientific suggestions.
Footnotes
Competing Interests
The authors declare no competing interests.
Code Availability
The codes used in this study are available at http://compbio.mit.edu/scADbbb/ and https://github.com/nasunmit/scadbbb.
Data Availability
Count matrices and metadata for all cells analyzed in this study are available at http://compbio.mit.edu/scADbbb/. Interactive website is linked from http://compbio2.mit.edu/scadbbb/. ROSMAP data can be requested at https://www.radc.rush.edu. The raw data will be available here upon request: https://www.synapse.org/#!Synapse:syn51015750.
References
- 1.Sweeney MD, Kisler K, Montagne A, Toga AW & Zlokovic BV The role of brain vasculature in neurodegenerative disorders. Nat. Neurosci. 21, 1318–1331 (2018). [DOI] [PMC free article] [PubMed] [Google Scholar]
- 2.Sweeney MD, Sagare AP & Zlokovic BV Blood-brain barrier breakdown in Alzheimer disease and other neurodegenerative disorders. Nat. Rev. Neurol. 14, 133–150 (2018). [DOI] [PMC free article] [PubMed] [Google Scholar]
- 3.Vanlandewijck M et al. A molecular atlas of cell types and zonation in the brain vasculature. Nature 554, 475–480 (2018). [DOI] [PubMed] [Google Scholar]
- 4.Garcia FJ et al. Single-cell dissection of the human brain vasculature. Nature 603, 893–899 (2022). [DOI] [PMC free article] [PubMed] [Google Scholar]
- 5.Yang AC et al. A human brain vascular atlas reveals diverse mediators of Alzheimer’s risk. Nature 603, 885–892 (2022). [DOI] [PMC free article] [PubMed] [Google Scholar]
- 6.Wilhelm I, Nyúl-Tóth Á, Suciu M, Hermenean A & Krizbai IA Heterogeneity of the blood-brain barrier. Tissue Barriers 4, e1143544 (2016). [DOI] [PMC free article] [PubMed] [Google Scholar]
- 7.Tran KA et al. Endothelial β-Catenin Signaling Is Required for Maintaining Adult Blood-Brain Barrier Integrity and Central Nervous System Homeostasis. Circulation 133, 177–186 (2016). [DOI] [PMC free article] [PubMed] [Google Scholar]
- 8.Slater SC et al. MicroRNA-532–5p Regulates Pericyte Function by Targeting the Transcription Regulator BACH1 and Angiopoietin-1. Mol. Ther. 26, 2823–2837 (2018). [DOI] [PMC free article] [PubMed] [Google Scholar]
- 9.Zhang X et al. High-resolution mapping of brain vasculature and its impairment in the hippocampus of Alzheimer’s disease mice. Natl Sci Rev 6, 1223–1238 (2019). [DOI] [PMC free article] [PubMed] [Google Scholar]
- 10.Lau S-F, Cao H, Fu AKY & Ip NY Single-nucleus transcriptome analysis reveals dysregulation of angiogenic endothelial cells and neuroprotective glia in Alzheimer’s disease. Proc. Natl. Acad. Sci. U. S. A. 117, 25800–25809 (2020). [DOI] [PMC free article] [PubMed] [Google Scholar]
- 11.Velmeshev D et al. Single-cell genomics identifies cell type–specific molecular changes in autism. Science vol. 364 685–689 Preprint at 10.1126/science.aav8130 (2019). [DOI] [PMC free article] [PubMed] [Google Scholar]
- 12.Ruzicka WB et al. Single-cell dissection of schizophrenia reveals neurodevelopmental-synaptic axis and transcriptional resilience. bioRxiv (2020) doi: 10.1101/2020.11.06.20225342. [DOI] [Google Scholar]
- 13.Montagne A et al. Blood-brain barrier breakdown in the aging human hippocampus. Neuron 85, 296–302 (2015). [DOI] [PMC free article] [PubMed] [Google Scholar]
- 14.Elali A & Rivest S The role of ABCB1 and ABCA1 in beta-amyloid clearance at the neurovascular unit in Alzheimer’s disease. Front. Physiol. 4, 45 (2013). [DOI] [PMC free article] [PubMed] [Google Scholar]
- 15.van Assema DME et al. Blood-brain barrier P-glycoprotein function in Alzheimer’s disease. Brain 135, 181–189 (2012). [DOI] [PubMed] [Google Scholar]
- 16.Hamilton NB, Attwell D & Hall CN Pericyte-mediated regulation of capillary diameter: a component of neurovascular coupling in health and disease. Front. Neuroenergetics 2, (2010). [DOI] [PMC free article] [PubMed] [Google Scholar]
- 17.Nortley R et al. Amyloid β oligomers constrict human capillaries in Alzheimer’s disease via signaling to pericytes. Science 365, (2019). [DOI] [PMC free article] [PubMed] [Google Scholar]
- 18.Wang F et al. RNAscope: a novel in situ RNA analysis platform for formalin-fixed, paraffin-embedded tissues. J. Mol. Diagn. 14, 22–29 (2012). [DOI] [PMC free article] [PubMed] [Google Scholar]
- 19.Bhatia S, Kim WS, Shepherd CE & Halliday GM Apolipoprotein D Upregulation in Alzheimer’s Disease but Not Frontotemporal Dementia. J. Mol. Neurosci. 67, 125–132 (2019). [DOI] [PMC free article] [PubMed] [Google Scholar]
- 20.Leng K et al. Molecular characterization of selectively vulnerable neurons in Alzheimer’s disease. Nat. Neurosci. 24, 276–287 (2021). [DOI] [PMC free article] [PubMed] [Google Scholar]
- 21.Szklarczyk D et al. The STRING database in 2021: customizable protein-protein networks, and functional characterization of user-uploaded gene/measurement sets. Nucleic Acids Res. 49, D605–D612 (2021). [DOI] [PMC free article] [PubMed] [Google Scholar]
- 22.Kim K-J et al. STAT3 activation in endothelial cells is important for tumor metastasis via increased cell adhesion molecule expression. Oncogene 36, 5445–5459 (2017). [DOI] [PubMed] [Google Scholar]
- 23.Wei D et al. Stat3 activation regulates the expression of vascular endothelial growth factor and human pancreatic cancer angiogenesis and metastasis. Oncogene 22, 319–329 (2003). [DOI] [PubMed] [Google Scholar]
- 24.Zhang B et al. A dynamic H3K27ac signature identifies VEGFA-stimulated endothelial enhancers and requires EP300 activity. Genome Res. 23, 917–927 (2013). [DOI] [PMC free article] [PubMed] [Google Scholar]
- 25.Marconcini L et al. c-fos-induced growth factor/vascular endothelial growth factor D induces angiogenesis in vivo and in vitro. Proc. Natl. Acad. Sci. U. S. A. 96, 9671–9676 (1999). [DOI] [PMC free article] [PubMed] [Google Scholar]
- 26.Battle TE, Lynch RA & Frank DA Signal transducer and activator of transcription 1 activation in endothelial cells is a negative regulator of angiogenesis. Cancer Res. 66, 3649–3657 (2006). [DOI] [PubMed] [Google Scholar]
- 27.Paneni F et al. Deletion of the activated protein-1 transcription factor JunD induces oxidative stress and accelerates age-related endothelial dysfunction. Circulation 127, 1229–40, e1–21 (2013). [DOI] [PubMed] [Google Scholar]
- 28.Wang N et al. c-Jun triggers apoptosis in human vascular endothelial cells. Circ. Res. 85, 387–393 (1999). [DOI] [PubMed] [Google Scholar]
- 29.Mahamud MR et al. GATA2 controls lymphatic endothelial cell junctional integrity and lymphovenous valve morphogenesis through. Development 146, (2019). [DOI] [PMC free article] [PubMed] [Google Scholar]
- 30.Chen MB et al. Brain Endothelial Cells Are Exquisite Sensors of Age-Related Circulatory Cues. Cell Rep. 30, 4418–4432.e4 (2020). [DOI] [PMC free article] [PubMed] [Google Scholar]
- 31.Zhao L et al. Pharmacologically reversible zonation-dependent endothelial cell transcriptomic changes with neurodegenerative disease associations in the aged brain. Nat. Commun. 11, 4413 (2020). [DOI] [PMC free article] [PubMed] [Google Scholar]
- 32.Ohnesorge N et al. Erk5 activation elicits a vasoprotective endothelial phenotype via induction of Kruppel-like factor 4 (KLF4). J. Biol. Chem. 285, 26199–26210 (2010). [DOI] [PMC free article] [PubMed] [Google Scholar]
- 33.Pugacheva EM et al. CTCF mediates chromatin looping via N-terminal domain-dependent cohesin retention. Proc. Natl. Acad. Sci. U. S. A. 117, 2020–2031 (2020). [DOI] [PMC free article] [PubMed] [Google Scholar]
- 34.Xu L, Nirwane A & Yao Y Basement membrane and blood-brain barrier. Stroke Vasc Neurol 4, 78–82 (2019). [DOI] [PMC free article] [PubMed] [Google Scholar]
- 35.McMillin MA et al. TGFβ1 exacerbates blood-brain barrier permeability in a mouse model of hepatic encephalopathy via upregulation of MMP9 and downregulation of claudin-5. Lab. Invest. 95, 903–913 (2015). [DOI] [PMC free article] [PubMed] [Google Scholar]
- 36.Rustenhoven J et al. TGF-beta1 regulates human brain pericyte inflammatory processes involved in neurovasculature function. J. Neuroinflammation 13, 37 (2016). [DOI] [PMC free article] [PubMed] [Google Scholar]
- 37.Kashima R & Hata A The role of TGF-β superfamily signaling in neurological disorders. Acta Biochim. Biophys. Sin. 50, 106–120 (2018). [DOI] [PMC free article] [PubMed] [Google Scholar]
- 38.van Cruijsen H, Giaccone G & Hoekman K Epidermal growth factor receptor and angiogenesis: Opportunities for combined anticancer strategies. Int. J. Cancer 117, 883–888 (2005). [DOI] [PubMed] [Google Scholar]
- 39.Jansen IE et al. Genome-wide meta-analysis identifies new loci and functional pathways influencing Alzheimer’s disease risk. Nat. Genet. 51, 404–413 (2019). [DOI] [PMC free article] [PubMed] [Google Scholar]
- 40.Kunkle BW et al. Genetic meta-analysis of diagnosed Alzheimer’s disease identifies new risk loci and implicates Aβ, tau, immunity and lipid processing. Nat. Genet. 51, 414–430 (2019). [DOI] [PMC free article] [PubMed] [Google Scholar]
- 41.Kang S et al. Potential Novel Genes for Late-Onset Alzheimer’s Disease in East-Asian Descent Identified by APOE-Stratified Genome-Wide Association Study. J. Alzheimers. Dis. 82, 1451–1460 (2021). [DOI] [PMC free article] [PubMed] [Google Scholar]
- 42.Pallejà A, Horn H, Eliasson S & Jensen LJ DistiLD Database: diseases and traits in linkage disequilibrium blocks. Nucleic Acids Res. 40, D1036–40 (2012). [DOI] [PMC free article] [PubMed] [Google Scholar]
- 43.Buniello A et al. The NHGRI-EBI GWAS Catalog of published genome-wide association studies, targeted arrays and summary statistics 2019. Nucleic Acids Res. 47, D1005–D1012 (2019). [DOI] [PMC free article] [PubMed] [Google Scholar]
- 44.Chang T-Y, Yamauchi Y, Hasan MT & Chang C Cellular cholesterol homeostasis and Alzheimer’s disease. J. Lipid Res. 58, 2239–2254 (2017). [DOI] [PMC free article] [PubMed] [Google Scholar]
- 45.Sun Y et al. Nuclear receptor RORα regulates pathologic retinal angiogenesis by modulating SOCS3-dependent inflammation. Proc. Natl. Acad. Sci. U. S. A. 112, 10401–10406 (2015). [DOI] [PMC free article] [PubMed] [Google Scholar]
- 46.Saint-Pol J et al. Brain pericytes ABCA1 expression mediates cholesterol efflux but not cellular amyloid-β peptide accumulation. J. Alzheimers. Dis. 30, 489–503 (2012). [DOI] [PubMed] [Google Scholar]
- 47.Robert J, Osto E & von Eckardstein A The Endothelium Is Both a Target and a Barrier of HDL’s Protective Functions. Cells 10, (2021). [DOI] [PMC free article] [PubMed] [Google Scholar]
- 48.Husemann J & Silverstein SC Expression of scavenger receptor class B, type I, by astrocytes and vascular smooth muscle cells in normal adult mouse and human brain and in Alzheimer’s disease brain. Am. J. Pathol. 158, 825–832 (2001). [DOI] [PMC free article] [PubMed] [Google Scholar]
- 49.Rothaug M, Becker-Pauly C & Rose-John S The role of interleukin-6 signaling in nervous tissue. Biochim. Biophys. Acta 1863, 1218–1227 (2016). [DOI] [PubMed] [Google Scholar]
- 50.Choi JM, Rotimi OO, O’Carroll SJ & Nicholson LFB IL-6 stimulates a concentration-dependent increase in MCP-1 in immortalised human brain endothelial cells. F1000Res. 5, 270 (2016). [DOI] [PMC free article] [PubMed] [Google Scholar]
- 51.Wei G et al. Ets1 and Ets2 are required for endothelial cell survival during embryonic angiogenesis. Blood 114, 1123–1130 (2009). [DOI] [PMC free article] [PubMed] [Google Scholar]
- 52.Park R et al. Yap is required for ependymal integrity and is suppressed in LPA-induced hydrocephalus. Nat. Commun. 7, 10329 (2016). [DOI] [PMC free article] [PubMed] [Google Scholar]
- 53.Xie C et al. Yap1 protein regulates vascular smooth muscle cell phenotypic switch by interaction with myocardin. J. Biol. Chem. 287, 14598–14605 (2012). [DOI] [PMC free article] [PubMed] [Google Scholar]
- 54.Shen T et al. YAP1 plays a key role of the conversion of normal fibroblasts into cancer-associated fibroblasts that contribute to prostate cancer progression. J. Exp. Clin. Cancer Res. 39, 1–16 (2020). [DOI] [PMC free article] [PubMed] [Google Scholar]
- 55.Go G-W & Mani A Low-density lipoprotein receptor (LDLR) family orchestrates cholesterol homeostasis. Yale J. Biol. Med. 85, 19–28 (2012). [PMC free article] [PubMed] [Google Scholar]
- 56.Thambisetty M, Beason-Held L, An Y, Kraut MA & Resnick SM APOE epsilon4 genotype and longitudinal changes in cerebral blood flow in normal aging. Arch. Neurol. 67, 93–98 (2010). [DOI] [PMC free article] [PubMed] [Google Scholar]
- 57.Leaston J et al. Neurovascular imaging with QUTE-CE MRI in APOE4 rats reveals early vascular abnormalities. PLoS One 16, e0256749 (2021). [DOI] [PMC free article] [PubMed] [Google Scholar]
- 58.Montagne A et al. APOE4 leads to blood-brain barrier dysfunction predicting cognitive decline. Nature 581, 71–76 (2020). [DOI] [PMC free article] [PubMed] [Google Scholar]
- 59.Bennett DA et al. Religious Orders Study and Rush Memory and Aging Project. J. Alzheimers. Dis. 64, S161–S189 (2018). [DOI] [PMC free article] [PubMed] [Google Scholar]
- 60.Bennett DA et al. Natural history of mild cognitive impairment in older persons. Neurology 59, 198–205 (2002). [DOI] [PubMed] [Google Scholar]
- 61.Bennett DA et al. Apolipoprotein E epsilon4 allele, AD pathology, and the clinical expression of Alzheimer’s disease. Neurology 60, 246–252 (2003). [DOI] [PubMed] [Google Scholar]
- 62.Bennett DA et al. Neuropathology of older persons without cognitive impairment from two community-based studies. Neurology 66, 1837–1844 (2006). [DOI] [PubMed] [Google Scholar]
- 63.Bennett DA, Schneider JA, Wilson RS, Bienias JL & Arnold SE Neurofibrillary tangles mediate the association of amyloid load with clinical Alzheimer disease and level of cognitive function. Arch. Neurol. 61, 378–384 (2004). [DOI] [PubMed] [Google Scholar]
- 64.Bennett DA et al. Decision rules guiding the clinical diagnosis of Alzheimer’s disease in two community-based cohort studies compared to standard practice in a clinic-based cohort study. Neuroepidemiology 27, 169–176 (2006). [DOI] [PubMed] [Google Scholar]
- 65.Mathys H et al. Single-cell transcriptomic analysis of Alzheimer’s disease. Nature 570, 332–337 (2019). [DOI] [PMC free article] [PubMed] [Google Scholar]
- 66.Zheng GXY et al. Massively parallel digital transcriptional profiling of single cells. Nat. Commun. 8, 14049 (2017). [DOI] [PMC free article] [PubMed] [Google Scholar]
- 67.Hao Y et al. Integrated analysis of multimodal single-cell data. Cell 184, 3573–3587.e29 (2021). [DOI] [PMC free article] [PubMed] [Google Scholar]
- 68.Korsunsky I et al. Fast, sensitive and accurate integration of single-cell data with Harmony. Nat. Methods 16, 1289–1296 (2019). [DOI] [PMC free article] [PubMed] [Google Scholar]
- 69.McGinnis CS, Murrow LM & Gartner ZJ DoubletFinder: Doublet Detection in Single-Cell RNA Sequencing Data Using Artificial Nearest Neighbors. Cell Syst 8, 329–337.e4 (2019). [DOI] [PMC free article] [PubMed] [Google Scholar]
- 70.Wang D et al. Comprehensive functional genomic resource and integrative model for the human brain. Science 362, (2018). [DOI] [PMC free article] [PubMed] [Google Scholar]
- 71.Finak G et al. MAST: a flexible statistical framework for assessing transcriptional changes and characterizing heterogeneity in single-cell RNA sequencing data. Genome Biol. 16, 278 (2015). [DOI] [PMC free article] [PubMed] [Google Scholar]
- 72.Robinson MD, McCarthy DJ & Smyth GK edgeR: a Bioconductor package for differential expression analysis of digital gene expression data. Bioinformatics 26, 139–140 (2010). [DOI] [PMC free article] [PubMed] [Google Scholar]
- 73.Bankhead P et al. QuPath: Open source software for digital pathology image analysis. Sci. Rep. 7, 16878 (2017). [DOI] [PMC free article] [PubMed] [Google Scholar]
- 74.Chen EY et al. Enrichr: interactive and collaborative HTML5 gene list enrichment analysis tool. BMC Bioinformatics 14, 128 (2013). [DOI] [PMC free article] [PubMed] [Google Scholar]
- 75.Xie Z et al. Gene Set Knowledge Discovery with Enrichr. Curr Protoc 1, e90 (2021). [DOI] [PMC free article] [PubMed] [Google Scholar]
- 76.Kuleshov MV et al. Enrichr: a comprehensive gene set enrichment analysis web server 2016 update. Nucleic Acids Res. 44, W90–7 (2016). [DOI] [PMC free article] [PubMed] [Google Scholar]
- 77.Ashburner M et al. Gene Ontology: tool for the unification of biology. Nat. Genet. 25, 25–29 (2000). [DOI] [PMC free article] [PubMed] [Google Scholar]
- 78.The Gene Ontology Consortium. The Gene Ontology Resource: 20 years and still GOing strong. Nucleic Acids Res. 47, D330–D338 (2019). [DOI] [PMC free article] [PubMed] [Google Scholar]
- 79.Jin S et al. Inference and analysis of cell-cell communication using CellChat. Nat. Commun. 12, 1–20 (2021). [DOI] [PMC free article] [PubMed] [Google Scholar]
- 80.Efremova M, Vento-Tormo M, Teichmann SA & Vento-Tormo R CellPhoneDB: inferring cell-cell communication from combined expression of multi-subunit ligand-receptor complexes. Nat. Protoc. 15, 1484–1506 (2020). [DOI] [PubMed] [Google Scholar]
- 81.Shao X et al. CellTalkDB: a manually curated database of ligand-receptor interactions in humans and mice. Brief. Bioinform. 22, (2021). [DOI] [PubMed] [Google Scholar]
- 82.Cabello-Aguilar S et al. SingleCellSignalR: inference of intercellular networks from single-cell transcriptomics. Nucleic Acids Res. 48, e55–e55 (2020). [DOI] [PMC free article] [PubMed] [Google Scholar]
- 83.Park YP & Kellis M CoCoA-diff: counterfactual inference for single-cell gene expression analysis. Genome Biol. 22, 228 (2021). [DOI] [PMC free article] [PubMed] [Google Scholar]
- 84.Barber RF & Candès EJ Controlling the false discovery rate via knockoffs. aos 43, 2055–2085 (2015). [Google Scholar]
- 85.Wang Y & Blei DM The Blessings of Multiple Causes. J. Am. Stat. Assoc. 114, 1574–1596 (2019). [Google Scholar]
- 86.Zhu Z, Fan Y, Kong Y, Lv J & Sun F DeepLINK: Deep learning inference using knockoffs with applications to genomics. Proc. Natl. Acad. Sci. U. S. A. 118, (2021). [DOI] [PMC free article] [PubMed] [Google Scholar]
- 87.Jiang T, Li Y & Motsinger-Reif AA Knockoff boosted tree for model-free variable selection. Bioinformatics 37, 976–983 (2021). [DOI] [PMC free article] [PubMed] [Google Scholar]
- 88.Candes E, Fan Y, Janson L & Lv J Panning for gold:’model-X’knockoffs for high dimensional controlled variable selection. Journal of the Royal (2018). [Google Scholar]
- 89.Kaul A, Bhattacharyya S & Ay F Identifying statistically significant chromatin contacts from Hi-C data with FitHiC2. Nat. Protoc. 15, 991–1012 (2020). [DOI] [PMC free article] [PubMed] [Google Scholar]
- 90.Lalonde S et al. Integrative analysis of vascular endothelial cell genomic features identifies AIDA as a coronary artery disease candidate gene. Genome Biol. 20, 133 (2019). [DOI] [PMC free article] [PubMed] [Google Scholar]
- 91.Niskanen H et al. Endothelial cell differentiation is encompassed by changes in long range interactions between inactive chromatin regions. Nucleic Acids Res. 46, 1724–1740 (2018). [DOI] [PMC free article] [PubMed] [Google Scholar]
- 92.Mumbach MR et al. Enhancer connectome in primary human cells identifies target genes of disease-associated DNA elements. Nat. Genet. 49, 1602–1612 (2017). [DOI] [PMC free article] [PubMed] [Google Scholar]
- 93.Boix CA, James BT, Park YP, Meuleman W & Kellis M Regulatory genomic circuitry of human disease loci by integrative epigenomics. Nature 590, 300–307 (2021). [DOI] [PMC free article] [PubMed] [Google Scholar]
- 94.Consortium GTEx. The GTEx Consortium atlas of genetic regulatory effects across human tissues. Science 369, 1318–1330 (2020). [DOI] [PMC free article] [PubMed] [Google Scholar]
Associated Data
This section collects any data citations, data availability statements, or supplementary materials included in this article.
Supplementary Materials
Data Availability Statement
Count matrices and metadata for all cells analyzed in this study are available at http://compbio.mit.edu/scADbbb/. Interactive website is linked from http://compbio2.mit.edu/scadbbb/. ROSMAP data can be requested at https://www.radc.rush.edu. The raw data will be available here upon request: https://www.synapse.org/#!Synapse:syn51015750.


