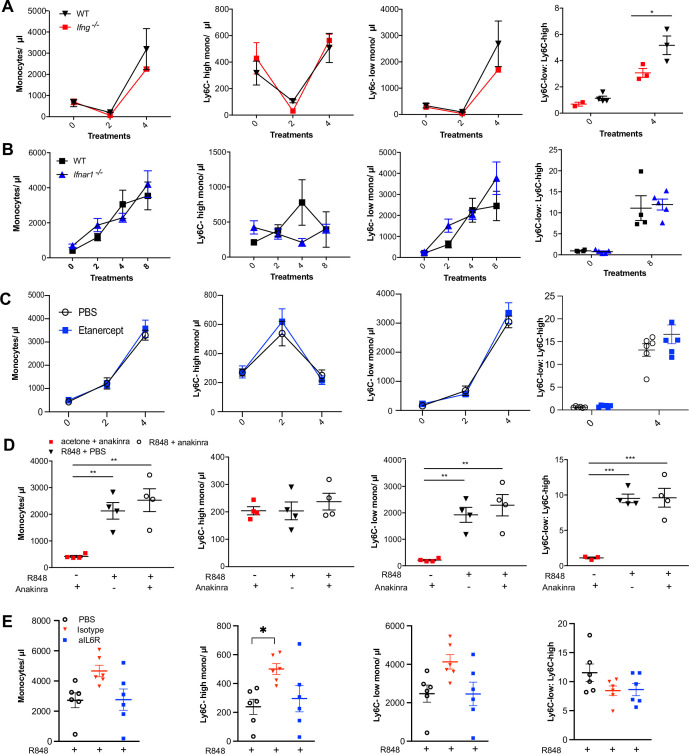
(A) C57BL/6 (black triangles) or Ifng-/- mice (red squares) were either left untreated (n = 4 WT, n = 2 Ifng-/-) or given 4× topical treatments with R848 (n = 3 per group). Blood counts for total monocytes, Ly6C-high monocytes, Ly6C-low monocytes, and the monocyte subpopulation ratio at baseline and at 24 hr after the indicated treatment. Data representative of two independent experiments. (B) C57BL/6 (n = 4, black squares) or Ifnar1-/- (n = 5, blue triangles) mice received eight topical treatments with R848. Blood counts for total monocytes, Ly6C-high monocytes, Ly6C-low monocytes, and the monocyte subpopulation ratio at baseline and 24 hr after the indicated treatments. (C) BALB/c mice were treated daily intraperitoneally (IP) with etanercept (anti-TNFα) (n = 6, blue squares) or PBS (n = 6, open circles) and then received 4× topical R848 treatments. Blood counts for total monocytes, Ly6C-high monocytes, Ly6C-low monocytes, and the monocyte subpopulation ratio at baseline and at 24 hr after the indicated treatment. (D) BALB/c mice received the following combinations: topical R848 and anakinra daily IP (n = 4, open circles), topical R848 and daily PBS IP (n = 4, black triangles), and topical acetone and anakinra daily IP (n = 4, red squares). Blood counts for total monocytes, Ly6C-high monocytes, Ly6C-low monocytes, and the monocyte subpopulation ratio at baseline and at 24 hr after the fourth treatment of R848. (E) BALB/c mice were treated IP with PBS (n = 6, open circles) or anti-IL6R (n = 6, blue squares) or the isotype control (n = 6, red triangle) every 3 d and received 4× topical R848 applications. Blood counts for total monocytes, Ly6C-high monocytes, Ly6C-low monocytes, and the monocyte subpopulation ratio at baseline and at 24 hr after the fourth treatment with R848. Time-course experiments analysed using two-way ANOVA with Tukey’s multiple-comparison test to compare between time points (A–C); one-way ANOVA with Bonferroni’s multiple-comparison test for comparing >2 groups at a single time point calculated (D, E). Data are the mean ± SEM; only significant p-values are indicated; *p<0.05, **p<0.01, ***p<0.001.


