

Abstract
A task-based analysis of personal airborne dust exposures was performed in two swine confinement facilities used to house sows and their litters. Airborne particulate levels were assessed during summer, winter, and spring. Personal aerosol measurements of workers were made with a photometer every 15 sec and corrected to compare with an integrated concentration measurement made with a co-located IOM inhalable dust sampler. Task type and time period were recorded by the workers over an 8-hr work shift. There was a significant difference in dust concentrations between seasons (p < 0.001), with winter months providing the highest levels (geometric mean = 3.76 mg/m3). The application of a general linear model of log-transformed task concentrations relative to site, season, and task demonstrated significant differences (P < 0.001) among all three covariates. Tasks performed near moving animals, especially the weaning process, resulted in the greatest concentrations. These results indicate the need to evaluate the concentration levels for separate tasks during multi-task work shifts, such as swine rearing, to optimize efforts to minimize exposures by focusing on high-concentration tasks.
Keywords: aerosol photometers, agricultural production, task-based analysis
INTRODUCTION
Swine production in the United States has changed dramatically over the past 30 years. This industry has shifted from small-scale, family-owned operations with typically less than 1000 hogs marketed annually to large, corporate-owned businesses where the hogs are raised in “confinement” buildings capable of holding more than 1000 hogs and marketing 5000 or more annually. During this transition, confinement buildings (referred to by the U.S. Environmental Protection Agency as confined animal feeding operations, CAFOs) have also evolved as structures that provide automated ventilation and feed to animals as well as providing an integrated waste management system. These operations have changed in response to ever-increasing knowledge of the engineering and animal husbandry aspects of meat production. There are approximately 250,000 owners/operators and workers in 73,600 swine rearing operations in the United States.(1) Workers in these buildings are exposed to irritant gases and dusts from a variety of sources.(2–8) Ammonia is produced as a breakdown product of excrement on the surface of flooring and from waste stored in pits below slatted flooring. Ammonia levels average 7 ppm with measurements as high as 30 ppm.(8) Hydrogen sulfide (H2S) is produced in anaerobic portions of the manure pits at concentrations that are typically less than 2 ppm. However, H2S concentrations may reach lethal levels (in excess of 500 ppm) when the manure slurry is agitated during the pump out process.(4,5)
Airborne dust in these building is produced from a variety of sources, including dried fecal material, feed particles, skin dander, and other sources.(3) Inhalable dusts levels vary between 0.1 to more than 20 mg/m3 and respirable concentrations range between 0.01 to more than 2 mg/m3.(6–9)
Workers in swine CAFOs have an elevated risk of acquiring a number of respiratory ailments compared with those in other industries.(10–14) Marked decrements in lung function over a work shift have been associated with dust concentrations in confinement buildings.(15–18) Although acute life-threatening hazards such as hydrogen sulfide poisoning can occur among workers in these facilities,(19) acute and chronic airway conditions are far more prevalent among swine workers. In addition to dust and gases, exposure to high levels of endotoxin has been implicated as a significant causative agent of lung function decline and associated lung ailments among swine workers.(20–24)
Large swine CAFOs typically are managed such that most workers are indoors for most of the workday; for example, in the buildings especially for piglet birthing (farrowing), many workers perform a number of specialized tasks throughout a workday. A typical industrial hygiene approach would be to implement engineering controls to minimize exposure levels. This approach is largely followed with the use of general dilution ventilation because the sources of airborne contaminants are pervasive.
However, ventilation design parameters in these facilities are based on removal of moisture and heat produced by the animals and not the mitigation of airborne dust or gas levels. Likewise, dilution of hazardous substances may not be accomplished adequately, particularly during the winter months when high energy costs inhibit the application of this approach and necessitate the use of respirators as part of the next tier of worker protection.
One approach to encourage health protection by means of respirator use (while acknowledging that they can be uncomfortable to wear) would be to recommend their use only for those tasks associated with the highest exposures. However, few studies have been conducted to relate specific work tasks performed in swine CAFOs with airborne contaminant exposures. A small-population study(25) found no significant difference in dust exposure between near-animal work tasks (e.g., insemination, castration, cutting teeth, and moving animals) and all other tasks. Preller et al.(26) compared work tasks with dust and endotoxin exposure measurements among 198 Dutch swine workers and found that frequently performed tasks (such as feeding and cleaning) and tasks performed with very active animals (such as teeth cutting and ear tagging) were associated with the highest dust and endotoxin levels.(26)
The purpose of this study was to identify tasks associated with the highest dust exposures in large U.S. swine CAFOs with the goal of promoting respirator use among swine workers during high-exposure tasks. Because many previous studies have found a high correlation between dust and associated endotoxin levels on respiratory symptoms among swine workers, we focused on dust concentrations as the primary measure of airborne contaminant exposure during this study.
METHODS
Study Site
This study was conducted in two gestation/farrowing facilities located in the midwestern United States that were built within the past 5 years and are operated by the same pork production company. These facilities are typical of those used in modern swine production in the United States, use the same work practices, and have the same physical layout (Figure 1). Each facility consists of five 23 m × 122 m buildings, plus an office; all are connected by enclosed walkways.
FIGURE 1.
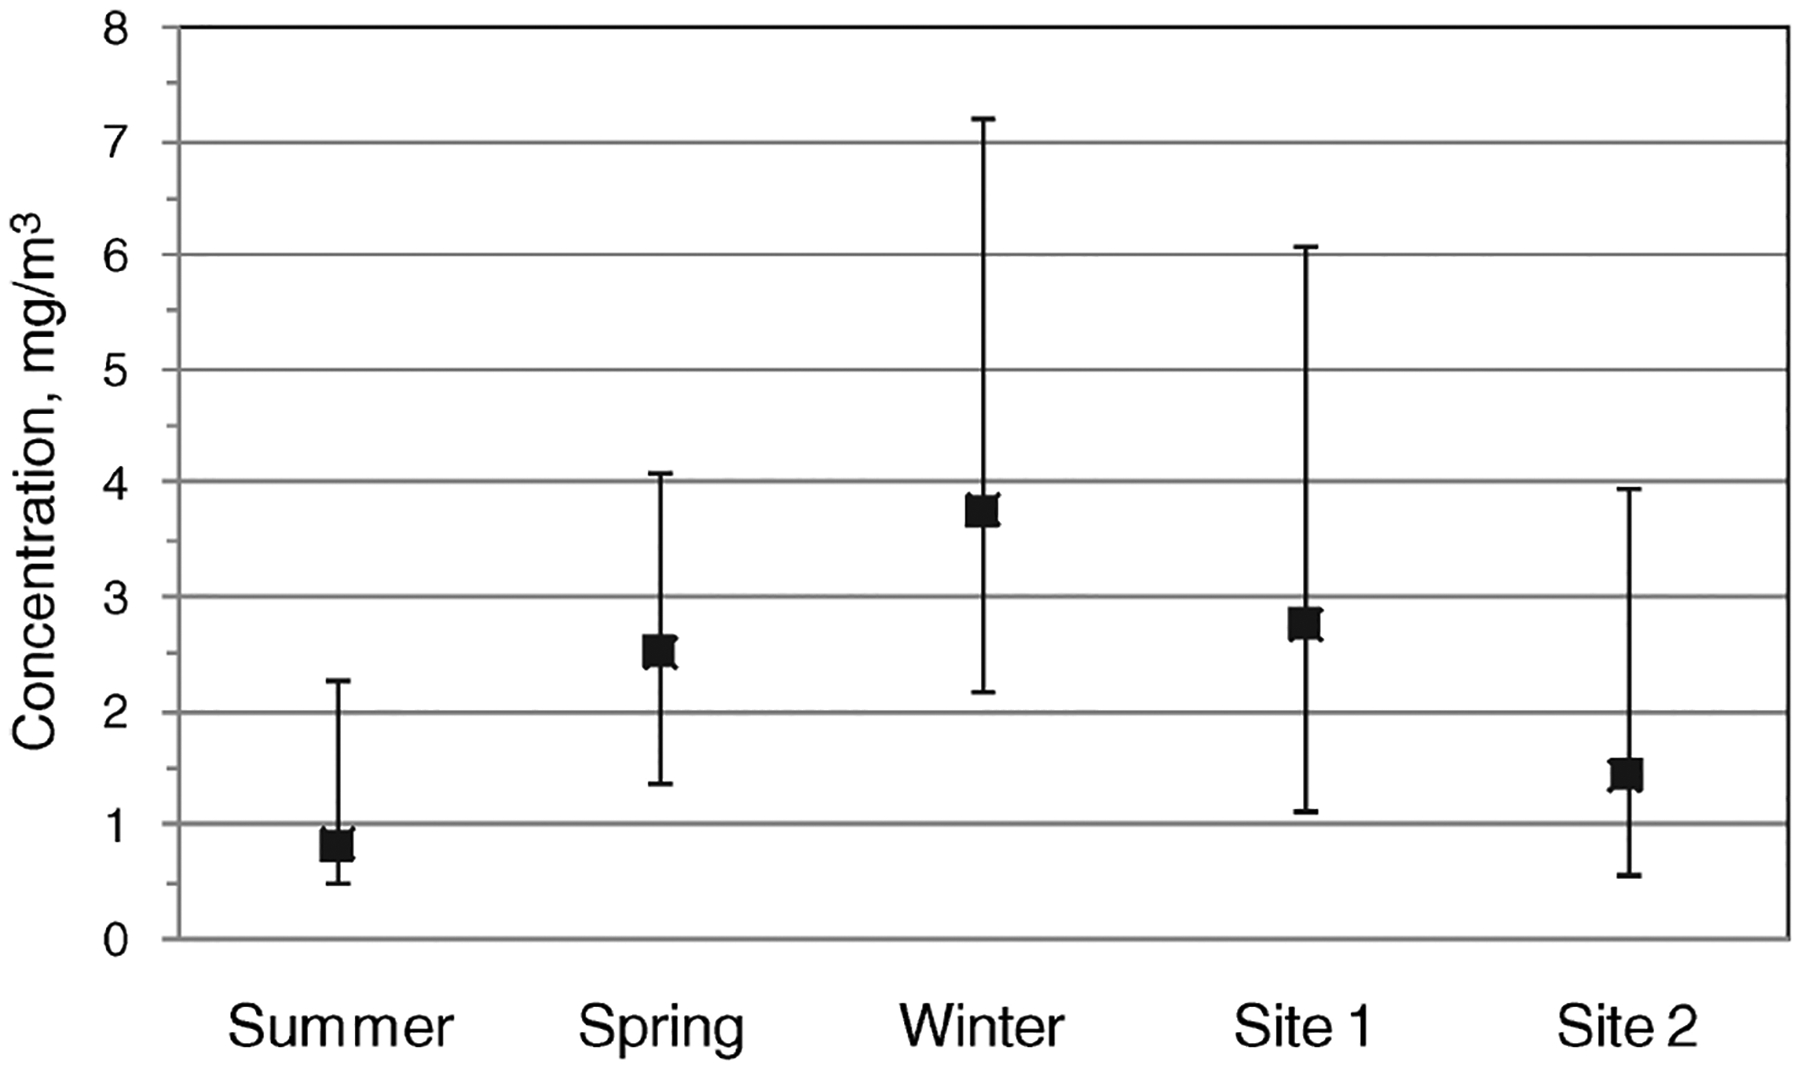
Inhalable concentrations measured for each subject separated by three seasons and two sites. Error bars indicate the 10% and 90% percentile values of the lognormally distributed concentration values for each sample set.
Approximately 450 gilts (young females) are held in one building. A breeding building to hold sows to be inseminated has 1080 pens, one for each sow, and two gestation buildings to hold impregnated sows have 1300 pens each. The remaining building is dedicated to farrowing piglets and contains six 15 m × 21 m rooms, each with 48 stalls (288 total). The typical number of sows and gilts in the entire facility is 3500.
The gilt, breeding, and gestation buildings utilize tunnel ventilation with end fans (eight) and side curtains. The inlet ends are covered with a fiberboard material that is wetted on warm days to provide evaporative cooling. The farrowing building is similar except there are no side curtains, and each room has five small fans. All of the buildings have concrete slatted floors with shallow pits 0.6 m (2 ft) beneath. Pits are drained into exterior lagoons at 20–25 day intervals.
Sampling Procedure
Dust exposures over a full work shift (typically 7 a.m. to 2 p.m.) were measured on six workers in each facility during summer (August), winter (December, January), and spring (April, May). Subjects were randomly selected without individual identifiers from a pool of nine workers at each site. Workers were asked to self report (in a small notepad) the tasks and their corresponding start/stop times that they performed over the measurement period. All tasks identified by the workers were grouped into nine general task categories:
Recording. Animal identification cards are hung in the stalls for each sow/gilt, with notes indicating the stage of production (for example, breeding and farrowing).
Breeding. Sows marked as “in heat” are artificially inseminated.
Feeding. Animals are fed. Feeding in the breeding and gestation units involves using a hand-operated drill to turn an auger that drops feed down tubes into bins containing water. Feeding in the farrowing units involves loading the feed by hand into carts, which are then rolled down the aisles, and feed is scooped into individual feeders for each sow.
Heat checking. Workers walk along the pens and mark sows/gilts in heat.
Setting-up/breakdown. The feeders, crates, and floor mats in the farrowing units are disassembled and removed from the room in preparation for power washing.
Sow/gilt handling. Sows/gilts are moved through aisles or between units.
Treating/processing pigs. Piglets are lifted out of farrowing crates to be given shots, have their needle teeth clipped, and their tails clipped. Sows are given 1 or 2 shots while in pens.
Walking aisles. Workers periodically check conditions in the various units. They may be walking any aisle in any of the units.
Weaning. Sows are moved out of the farrowing unit to the breeding unit, and male and female piglets are sorted into separate holding pens.
Additional time periods identified by the workers were grouped into categories of Lunch, Office, Smoking, and Miscellaneous. The concentrations associated with these time periods were excluded from the analysis of the tasks listed above. Lunch and Office referred to times associated with a lunch break (typically 30 min) and any time visiting an office to meet with the supervisor or retrieve forms needed for the breed cards task, respectively. Some workers smoked during break periods. Miscellaneous tasks included any that did not fit into the task categories listed above.
Sampling Devices
Each worker was equipped with a small backpack modified to accept the sampling equipment. The backpack contained a pressure-compensating sampling pump (Model 224-PCXR4, SKC Inc., Eighty Four, Pa.) and personal light-scattering aerosol photometer (Model pDR-1200, Thermo-Electron Corp., Waltham, Mass.). A flexible sample line attached the sample pump to an inhalable IOM sampler (SKC Inc.) with open end placed near the worker’s right lapel. The inhalable samplers were equipped with 25-mm polyvinyl chloride filters with a 5 μm pore size. Filters were weighed using a Mettler MT5 six-place balance (Mettler-Toledo, Inc., Columbus, Ohio) placed in a dedicated climate-controlled room.
Filter handling and analysis methods given in NIOSH method 0500 were followed. This included offsetting mass collected on a filter by any change measured in a field blank filter and maintaining room conditions near 20°C and 50% relative humidity.
A second flexible sample line was placed such that the open end was attached near the inhalable sampler with the other end attached directly to the photometer. We assumed that there would be some losses of particles within the tube but decided it was important to sample the air near the inhalable sampler rather than near the photometer. All photometer sample lines were cut to the same length to avoid differences in line losses. The sensing range of the photometer is from 0.01 mg m−3 to 100 mg m−3 and is preferential to particles in the 0.1- to 10-μm range. Each instrument was factory calibrated at the beginning of the project period and zeroed before each sampling session. An internal datalogger stored measurements every minute.
To minimize equipment weight worn by the workers, a single pump was used to pull air through both the inhalable sampler and the photometer. A T-fitting was added to divert flow from the pump, and two needle valves were adjusted in each line to achieve 1 L m−1 flow through the photometer and 2 L m−1 through the inhalable sampler. A Gilibrator (Sensidyne, Clearwater, Fla.) was used to pre- and post-calibrate flow rates through both instruments.
Endotoxin Analysis
Time-integrated concentrations were determined for comparison to recommended maximum exposures and for comparison between facilities and seasons. The concentration of endotoxin was determined using a kinetic Limulus amebocyte lysate (LAL) assay applied to dust samples collected with the inhalable samplers. Dust samples were extracted in sterile, pyrogen-free water and centrifuged. The supernatant was then analyzed using the kinetic chromogenic LAL assay as detailed by Thorne et al.(27) A 12-point calibration curve and 4-point endotoxin determination was performed. Quality assurance spiking assays were performed to assess matrix interference or enhancement.
Data Analysis
Gravimetric analysis of the inhalable sampler filters was used to compute a time-weighted average (TWA) inhalable dust exposure level for each day of each study subject. The set of photometer readings recorded over an individual’s work shift were adjusted by the ratio of the inhalable concentration taken over the same time period to the arithmetic average of the photometer readings. Subsets of adjusted photometer concentration readings within the entire set measured for an individual were associated with specific tasks using the worker’s task diary.
The arithmetic average for a subset was then computed to represent the specific concentration level associated with a task. These average values, analyzed in their entirety, were lognormally distributed. Therefore, the log-transformed task concentrations were used to determine whether concentrations differed by task.
A measure of the dose of particulates received relative to task was also determined by computing a time-weighted concentration (TWC) level for each task event given the concentration level for the task, C, the task duration, t, and the total work-shift time, T (Eq. 1).
| (1) |
This method has been used in other studies, for example, when determining the overall noise exposure associated with a task.(28)
To determine whether any task produced concentrations significantly higher than any other, a general linear model including season, site, and task as covariates was developed for log-task concentration as the outcome variable. A similar analysis was also performed with log-TWC as the outcome variable. All covariates were treated as fixed, nonrepeated variables. Post hoc analysis included the use of the Duncan’s Multiple Range test to determine statistical differences between tasks. The statistical software SAS (v. 9.1) was used for all analyses. The analysis outcomes were tested for statistical significance at the α = 0.05 level.
RESULTS
Inhalable Concentrations
The geometric mean (GM) of personal inhalable dust concentrations measured for each season and site is given in Figure 1. Table I provides overall summary statistics for the personal inhalable dust concentrations measured during each season. During each of the three seasons, one of the measurements was lost while sampling at Site 2 either because the pump stopped or the inhalable sampler was accidentally detached from the pump hose.
Table I.
Summary Statistics for Personal Inhalable Concentrations by Season
| GM (mg/m3) | GSD | 10–90 Percentile (mg/m3) | Sample Size | |
|---|---|---|---|---|
| Summer | 0.83 a | 2.34 | 0.50–2.28 | 11 |
| Spring | 2.53 b | 1.56 | 1.37–4.11 | 11 |
| Winter | 3.76 c | 1.91 | 2.19–7.20 | 12 |
Note: Geometric means with the same letter are not significantly different at the α = 0.05 level.
As seen in Figure 1, Site 2 had less airborne dust than Site 1, and there was a noticeable difference between seasons, with winter levels being the highest. The highest individual measurement of 10.52 mg/m3 was taken in the winter, compared with highs of 5.09 mg/m3 and 2.61 mg/m3 in spring and summer, respectively.
Task Concentrations
A total of 179 task dust concentrations were identified as belonging to one of the nine task categories. A breakdown of sample sizes by task is given in Table II. Two examples of adjusted photometer readings taken over the course of an entire work shift are given in Figure 2 for the individuals with the highest overall average in summer and winter. Dust concentrations varied greatly over the entire work shift and, in some cases, within a time period associated with a specific task.
Table II.
Summary Statistics for Task Concentrations and Sample Size for Nine Generalized Task Categories
| Tasks | GM (mg/m3) | GSD | Sample Size |
|---|---|---|---|
| Weaning | 4.14 a | 2.84 | 25 |
| Treating/processing pigs | 2.01 b | 2.67 | 12 |
| Recording | 1.95 b | 1.73 | 28 |
| Feeding | 1.93 b | 3.73 | 34 |
| Heat checking | 1.89 b | 4.17 | 10 |
| Setting-up/breakdown | 1.67 b | 2.17 | 19 |
| Breeding | 1.41 b | 3.48 | 13 |
| Sow/gilt handling | 1.34 b | 2.72 | 30 |
| Walking aisles | 1.26 b | 2.72 | 8 |
Note: Geometric means with the same letter are not significantly different at the α = 0.05 level.
FIGURE 2.
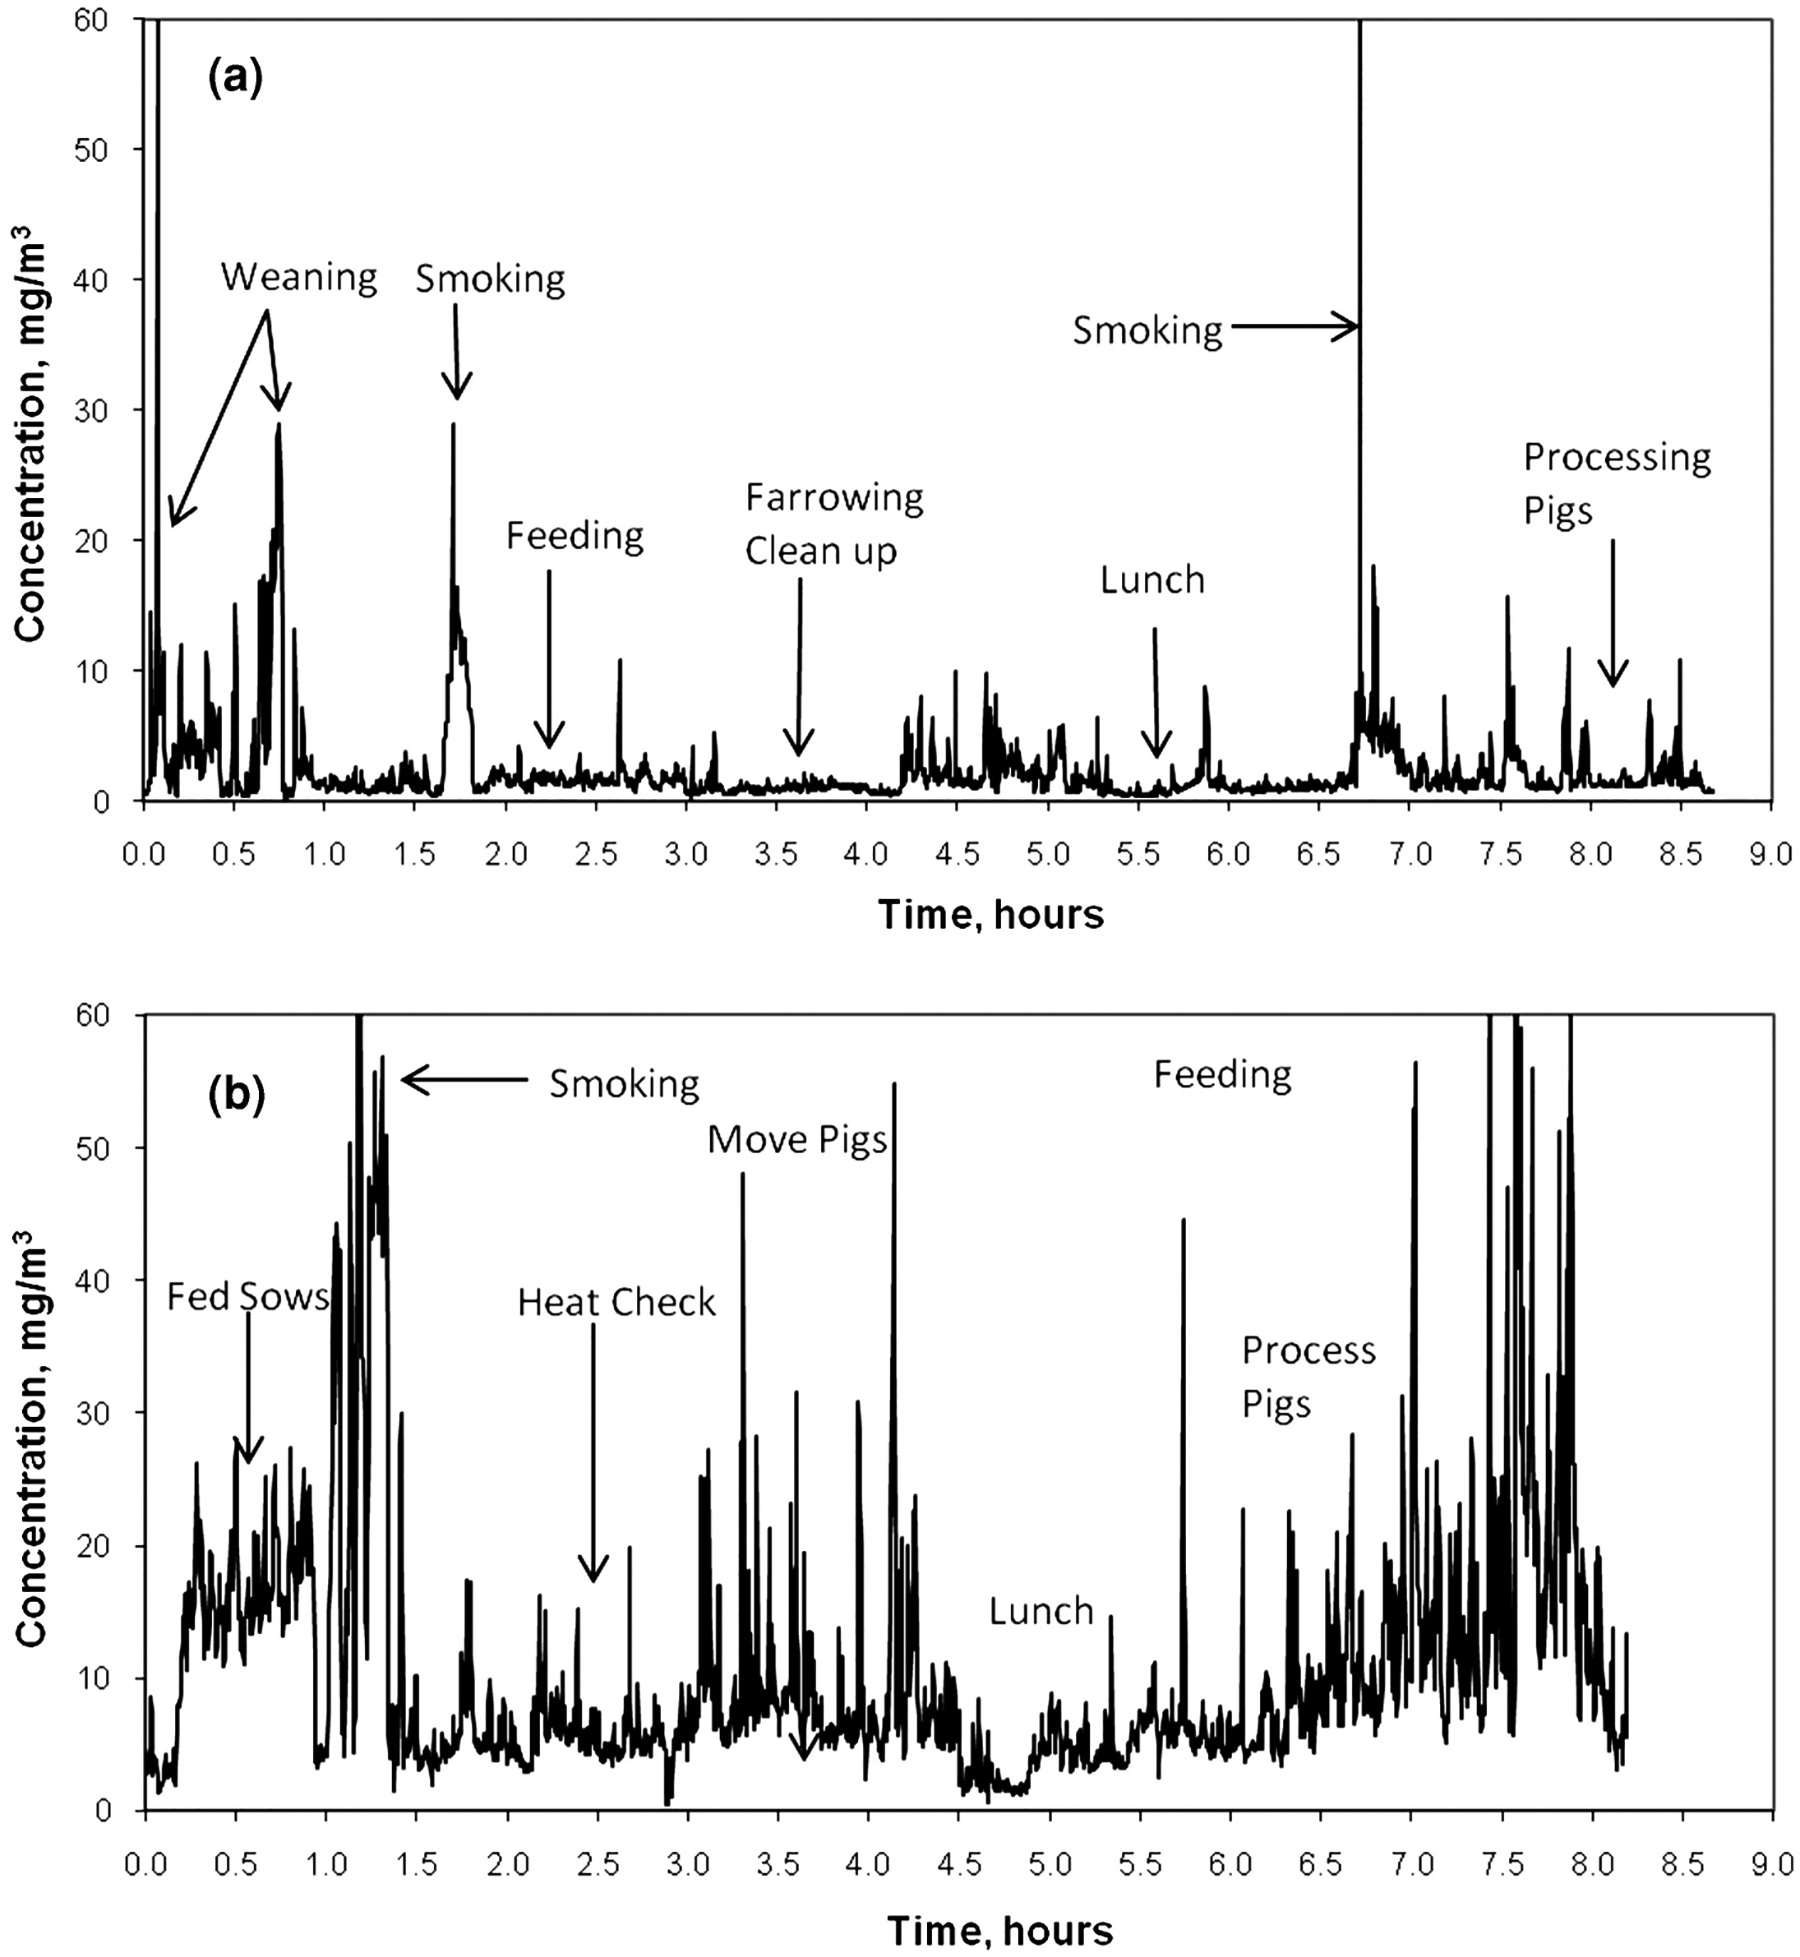
Time sequence of concentration readings for the highest case in the summer (a), and the highest case in the winter (b), showing tasks related to readings.
Results from the development of the general linear model demonstrated that all covariates, season (p < 0.001), site (p < 0.001), and task (p < 0.001) were significantly different. Table II lists the nine task types ranked in order by the GM of all concentrations for each task. Duncan’s test indicated that each season was significantly different from every other season and that the task with the highest GM concentration value (weaning) was statistically different from all other task types.
Results from the development of the general linear model of TWC values are presented in Table III. As with the task concentrations, weaning was also the highest task relative to TWC obtained; however, as indicated in Table III, it was not significantly different from breeding and heat checking that made up the other two of the top three task TWCs.
Table III.
Summary Statistics for Time-Weighted Task Concentrations and Mean Task Duration (t) for Nine Generalized Task Categories
| Tasks | GM (mg/m3) | GSD | t (hr) |
|---|---|---|---|
| Weaning | 0.35 a | 4.50 | 0.87 |
| Breeding | 0.22 ab | 3.58 | 1.42 |
| Heat checking | 0.19 abc | 5.28 | 0.91 |
| Feeding | 0.15 bcd | 4.58 | 0.78 |
| Setting-up/breakdown | 0.14 bcd | 2.83 | 0.81 |
| Treating/processing pigs | 0.13 bcd | 4.00 | 0.66 |
| Sow/gilt handling | 0.12 bcd | 3.60 | 0.81 |
| Recording | 0.09 cd | 2.04 | 0.44 |
| Walking aisles | 0.07 d | 2.18 | 0.56 |
Note: Geometric means with the same letter are not significantly different at the α = 0.05 level.
The most notable difference between the two methods of comparing tasks was for the breeding task, which resulted in one of the lowest concentration levels but was the second highest task relative to TWCs. As shown in Table III, this result was obtained because of the long average task duration for breeding (1.42 hr) relative to that of the other tasks.
Endotoxin Concentrations
Endotoxin concentrations (EU/m3) followed particle concentrations with respect to seasonal differences (Figure 3) but not site differences. The general linear model procedure performed on log-transformed endotoxin concentrations demonstrated a significant difference between seasons (p < 0.001) but not site (p = 0.572), and post hoc analysis indicated that winter values were greater than spring and summer values. When endotoxin per unit mass (EU/mg) was analyzed, there was a downward but not significant (p = 0.593) trend from winter (713 EU/mg average) to summer (550EU/mg average).
FIGURE 3.
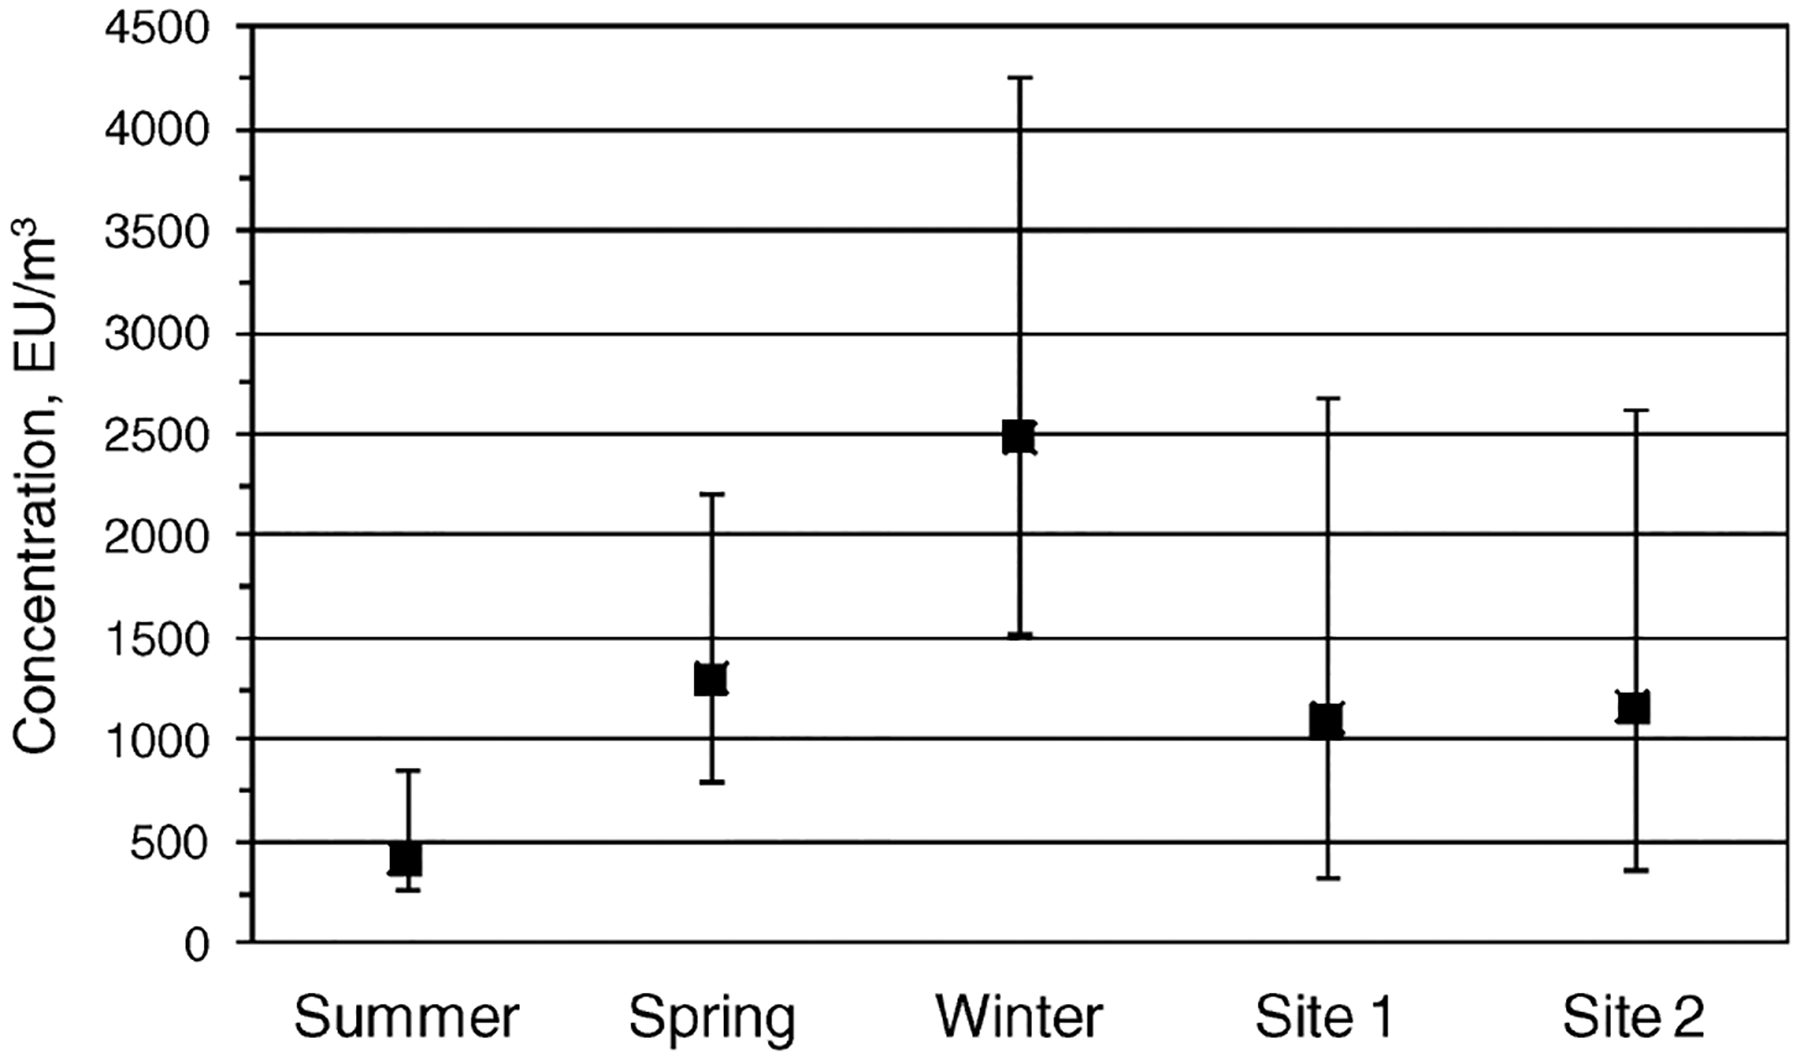
Endotoxin concentrations (EU/m3) from personal samples by season and site. Error bars indicate the 10% and 90% percentile values of the lognormally distributed concentration values for each sample set.
DISCUSSION
The study results demonstrate that there are statistically significant differences between tasks associated with swine farrowing/gestation processes. Furthermore, these task differences are amplified by significant increases in dust concentrations from the warm to the cooler months. Identifying specific tasks that tend to produce the highest personal exposures can be useful information for concentrating efforts to minimize those exposures.
Previous work has demonstrated an adverse synergistic relationship of swine confinement dust and ammonia exposure relative to a cross-shift lung function decline.(29,30) These studies resulted in a recommended TWA dust exposure level of 2.5 mg/m3 in swine and poultry houses as measured by a 37-mm closed-face cassette (CFC). Predicala and Maghirang(9) performed a side-by-side comparison of the CFC and IOM sampler in swine buildings and found the CFC to provide significantly lower concentration values by a factor of 0.86. Therefore, a recommended exposure level based on an IOM sampler reading would be 3 mg/m3. This value was exceeded by 11 of the 34 IOM sampler measurements taken during this study, with 8 of the 11 measured in the winter months.
Although the recommended TWA dust exposure level of 2.5 mg/m3 was determined without considering the contribution of endotoxin concentrations, other studies have demonstrated that the presence of endotoxin on dust particles has an adverse effect on swine worker health.(20–24) For example, Schwartz et al.(24) found endotoxin concentrations of 588 ± 1196 EU/m3 produced a significantly greater decline in lung function in swine workers as measured by the forced expiratory volume at one second (FEV1) than that of neighboring farmers.
By comparison, endotoxin concentrations measured during this study ranged from a geometric mean of 400 EU/m3 in the summer to 2500 EU/m3 in the winter. The high endotoxin concentrations reported here and elsewhere in the literature, along with the potential for inhalable dust concentrations above 3 mg/m3, indicate the need for either engineering controls or respirator use to minimize these exposures especially during the winter months. Our results also suggest that there may not necessarily be a correlation between dust concentrations and endotoxin concentrations in these facilities. Site 1 had significantly higher dust concentrations, but there was no difference in endotoxin concentrations between the two sites.
One of our primary concerns with this assessment was that no task concentration level would be significantly greater than any other because of the large amount of variation in the response from the direct-reading instruments used to record concentration over time. However, the weaning process produced average dust concentrations significantly greater than any of the other task groups identified during this study when controlling for site and season. In the case of weaning, as well as treating/processing pigs (the second-highest ranking task), there was a lot pig movement that caused settled dust to be resuspended. Pig activity, as well as the number and weight of pigs, has been identified as a significant factor affecting the generation of airborne dust in swine confinements.(31) The results found during this study substantiate this intuitive result but also demonstrate that a task-based analysis of dust levels can be used to correctly identify the dustiest tasks.
Perhaps because noise dosimeters are portable and capture continuous readings, task-based assessments of noise exposures in swine buildings have been performed,(32,33) but we are not aware of a similar study focusing on airborne dust concentrations. A sequence of noise readings are often converted into a measure of overall dose using a relationship that factors in the time period over which the readings exist at certain levels.
In the same manner, we computed a TWC level as a surrogate method for determining which tasks may provide a high overall dose to the lungs resulting from the combination of the concentration level of the task as well as the length of time the task is typically performed. The results of that analysis reveal that the weaning task imparts both a high exposure level as well as a high aerosol concentration primarily because the aerosol concentration is very high relative to the other tasks.
However, the breeding task produced a low aerosol concentration, but, because of its long average work duration, the exposure level of the breeding task was the second highest of all tasks analyzed. This analysis suggests that it is important to consider both aspects of worker exposure during work shifts that involve many different tasks. Task-based contaminant concentration levels can indicate peak exposure values, whereas task-based time-weighted concentrations (TWCs) can be evaluated as an indication of the overall dose received from one task relative to all others, where efforts should be applied to avoid both scenarios.
CONCLUSION
Aerosol photometers were successfully used to establish significant differences in aerosol concentrations by task in swine confinement buildings. Tasks that involved standing near moving pigs produced the highest concentrations. These results demonstrated a significant difference between seasons with highest concentrations in the winter months. Furthermore, tasks analyzed on the basis of aerosol concentration did not necessarily rank in a way similar to tasks analyzed by TWC used as an indication of overall dose received. We suggest that the methods employed here can be used for workplace operations, such as swine-rearing, that involve multiple tasks throughout a workshift to identify tasks that produce both the highest concentrations and highest TWC levels to maximize efforts to minimize exposures given available control options or personal protective equipment.
ACKNOWLEDGMENTS
This study was supported by NIOSH through funds supplied to the Great Plains Center for Agricultural Health (U50 OH007548-06).
REFERENCES
- 1.“Swine 2000, Part IV: Changes in the U.S. Pork Industry, 1990–2000.” [Online] Available at http://www.aphis.usda.gov/vs/ceah/ncahs/nahms/ swine/swine2000/swine2kPt4.pdf (Accessed March 13, 2009).
- 2.Von Essen S, and Donham K: Illness and injury in animal confinement workers. Occup. Med 14(2):337–350 (1999). [PubMed] [Google Scholar]
- 3.Donham KJ, Popendorf W, Palmgren U, and Larsson L: Characterization of dusts collected from swine confinement buildings. Am. J. Ind. Med 10:294–297 (1986). [DOI] [PubMed] [Google Scholar]
- 4.Donham KJ, Yeggy J, and Dague R: Production rates of toxic gases from liquid swine manure: Health implication for workers and animals in swine confinement buildings. Biological Wastes 24:161–173 (1988). [Google Scholar]
- 5.Donham KJ, and Popendorf WJ: Ambient levels of selected gases inside swine confinement buildings. Am. Ind. Hyg. Assoc. J 46:658–661 (1985). [DOI] [PubMed] [Google Scholar]
- 6.Maghirang RG, Puma MC, Liu Y, and Clark P: Dust concentrations and particle size distribution in an enclosed swine nursery. Trans. ASAE 40:749–754 (1997). [Google Scholar]
- 7.Pedersen S, Nonnenmann M, Rautiainen R, Demmers TG, Banhazi T, and Lyngbye M: Dust in pig buildings. J. Agric. Saf. Health 6:261–274 (2000). [DOI] [PubMed] [Google Scholar]
- 8.Pickrell JA, Heber AJ, Murphy JP, and Henry SC: Characterization of particles, ammonia and endotoxin in swine confinement operations. Vet. Human. Toxicol 35:421–428 (1993). [PubMed] [Google Scholar]
- 9.Predicala BZ, and Maghirang RG: Field comparison of inhalable and total dust samplers for assessing airborne dust in swine confinement barns. Appl. Occup. Environ. Hyg 18:694–701 (2003). [DOI] [PubMed] [Google Scholar]
- 10.Choudat D, Goehen M, Korobaeff M, Boulet A, Dewitte JD, and Martin MH: Respiratory symptoms and bronchial reactivity among pig and dairy farmers. Scand. J. Work Environ. Health 20(1):48–54 (1994). [DOI] [PubMed] [Google Scholar]
- 11.Monso E, Riu E, Radon K, et al. : Chronic obstructive pulmonary disease in never-smoking animal farmers working inside confinement buildings. Am. J. Ind. Med 46(4):357–62 (2004). [DOI] [PubMed] [Google Scholar]
- 12.Pedersen B, Iversen M, Larsen B, and Dahl R: Pig farmers have signs of bronchial inflammation and increased numbers of lymphocytes and neutrophils in BAL fluid. Eur. Respir. J 9:524–530 (1996). [PubMed] [Google Scholar]
- 13.Schwartz DA, Landas SK, Lassise DL, Burmeister LF, Hunninghake GW, and Merchant JA: Airway injury in swine confinement workers. Ann. Intern. Med 116:630–635 (1992). [DOI] [PubMed] [Google Scholar]
- 14.Larsson KA, Eklund AG, Hansson LO, Isaksson BM, and Malmberg PO: Swine dust causes intense airways inflammation in healthy subjects. Am. J. Respir. Crit. Care Med 150:973–977 (1994). [DOI] [PubMed] [Google Scholar]
- 15.Dosman JA, Graham BL, Hall D, et al. : Respiratory symptoms and alterations in pulmonary function tests in swine producers in Saskatchewan: Results of a survey of farmers. J. Occup. Med 30(9):715–720 (1988). [PubMed] [Google Scholar]
- 16.Iversen M, and Dahl R: Working in swine-confinement buildings causes an accelerated decline in FEV1: A 7-yr follow-up of Danish farmers. Eur. Respir. J 16(3):404–408 (2000). [DOI] [PubMed] [Google Scholar]
- 17.Senthilselvan A, Dosman JA, Kirychuk SP, et al. : Accelerated lung function decline in swine confinement workers. Chest. 111(6):1733–1741 (1997). [DOI] [PubMed] [Google Scholar]
- 18.Vogelzang PF, van der Gulden JW, Folgering H, Heederik D, Tielen MJ, and van Schayck CP: Longitudinal changes in bronchial responsiveness associated with swine confinement dust exposure. Chest. 117(5):1488–1495 (2000). [DOI] [PubMed] [Google Scholar]
- 19.Patni NK, and Clarke SP: Transient hazardous conditions in animal buildings due to manure gas released during slurry mixing. Appl. Eng. Agric 7:478–484 (1991). [Google Scholar]
- 20.Vogelzang PF, van der Gulden JW, Folgering H, et al. : Endotoxin exposure as a major determinant of lung function decline in pig farmers. Am. J. Respir. Crit. Care Med 157(1):15–18 (1998). [DOI] [PubMed] [Google Scholar]
- 21.Zejda JE, Barber E, Dosman J, et al. : Respiratory health status in swine producers relates to endotoxin exposure in the presence of low dust levels. J. Occup. Med 36:49–56 (1994). [PubMed] [Google Scholar]
- 22.Heederik D, Brouwer R, Biersteker K, and Boleij JS: Relationship of airborne endotoxin and bacteria levels in pig farms with the lung function and respiratory symptoms of farmers. Int. Arch. Occup. Environ. Health 62:595–601 (1991). [DOI] [PubMed] [Google Scholar]
- 23.Preller L, Heederik D, Boleij JS, Vogelzang PF, and Tielen MJ: Lung function and chronic respiratory symptoms of pig farmers: Focus on exposure to endotoxins and ammonia and use of disinfectants. Occup. Environ. Med 52:654–660 (1995). [DOI] [PMC free article] [PubMed] [Google Scholar]
- 24.Schwartz DA, Donham KJ, Olenchock SA, et al. : Determinants of longitudinal changes in spirometric function among swine confinement operators and farmers. Am. J. Respir. Crit. Care Med 151(1):47–53 (1995). [DOI] [PubMed] [Google Scholar]
- 25.Vinzents P, and Nielsen BH: Variations in exposures to dust and endotoxin in Danish piggeries. Am. Ind. Hyg. Assoc. J 53:237–241 (1992). [DOI] [PubMed] [Google Scholar]
- 26.Preller L, Heederik D, Kromhout H, Boleij JS, and Tielen MJ: Determinants of dust and endotoxin exposure of pig farmers: Development of a control strategy using empirical modelling. Ann. Occup. Hyg 39(5):545–557 (1995). [PubMed] [Google Scholar]
- 27.Thorne PS, Bartlett KH, Phipps J, and Kulhankova K: Evaluation of five extraction protocols for quantification of endotoxin in metalworking fluid aerosol. Ann. Occup. Hyg 47(1):31–36 (2003). [DOI] [PubMed] [Google Scholar]
- 28.Seixas NS, Sheppard L, and Neitzel R: Comparison of task-based estimates with full-shift measurements of noise exposure. Am. Ind. Hyg. Assoc. J 64:823–829 (2003). [DOI] [PubMed] [Google Scholar]
- 29.Reynolds SJ, Donham KJ, Whitten P, Merchant JA, Burmeister LF, and Popendorf WJ: Longitudinal evaluation of dose-response relationships for environmental exposures and pulmonary function in swine production workers. Am. J. Ind. Med 29(1):33–40 (1996). [DOI] [PubMed] [Google Scholar]
- 30.Donham KJ, Reynolds SJ, Whitten P, Merchant JA, Burmeister L, and Popendorf WJ: Respiratory dysfunction in swine production facility workers: Dose-response relationships of environmental exposures and pulmonary function. Am. J. Ind. Med 27:405–18 (1995). [DOI] [PubMed] [Google Scholar]
- 31.Gustafsson G: Factors affecting the release and concentration of dust in pig houses. J. Agric. Engin. Res 74:379–390 (1999). [Google Scholar]
- 32.Humann MJ, Donham KJ, Jones ML, Achutan C, and Smith BJ: Occupational noise exposure assessment in intensive swine farrowing systems: Dosimetry, octave band, and specific task analysis. J. Agromedicine 10(1):23–37 (2005). [DOI] [PubMed] [Google Scholar]
- 33.Achutan C, and Tubbs RL: A task-based assessment of noise levels at a swine confinement. J. Agromedicine 12(2):55–65 (2007). [DOI] [PubMed] [Google Scholar]