

ABSTRACT
Subcutaneous fat tissue is an accessible and abundant source of multipotent stem cells for cell therapy in regenerative medicine. Successful trilineage differentiation is required to define the stemness features of the obtained mesenchymal cells, and adipogenesis is a part of it. Since indomethacin is bound to serum albumin, replacing foetal bovine serum (FBS) with horse serum (HS) in adipogenic induction protocols would suppress its cytotoxic effect and reveal a better adipogenic potential in equine MSCs. The equine subcutaneous adipose-derived stem cells (ASCs) were separately induced in adipogenesis by three different concentrations of 3-isobutyl-1-methylxanthine, IBMX (0.5 mM; 0.25 mM and 0.1 mM) and indomethacin (0.1 mM; 0.05 mM and 0.02 mM) for 48 h. In contrast to the IBMX, indomethacin in all concentrations caused dramatic cellular detachment. Further, the same induction concentrations were used in FBS and HS conditions for adipogenic induction. The MTT assay revealed that the culture media supplemented with HS raised cellular vitality by about 35% compared to those cultured in FBS. Based on those results, an adipogenic cocktail containing indomethacin (0.05 mM) and IBMX (0.5 mM), supplemented with HS and FBS, respectively, was applied for 18 days. The adiponectin gene expression was significantly up-regulated in HS-supplemented media since established changes in PPAR-gamma were insignificant. The tri-lineage differentiation was successful, and a cross-sectional area of adipocytes was performed. The albumin concentration was higher in HS than in FBS. In conclusion, our study revealed that HS is an appropriate supplement in induced adipogenesis since it probably suppresses the indomethacin-related cytotoxic effect and increases adipogenic ability in equine subcutaneous ASCs.
KEYWORDS: equine ASCs, multipotency, indomethacin-induced adipogenesis, serum effects, cellular vitality, adiponectin
1. Introduction
Athletic horses are often exposed to tendon injuries [1], which causes a significant loss for the equine industry [2]. Scars replace the damaged tendon tissue, and traditional treatments cannot complete its proper recovery. Cell therapy in veterinary medicine is a relatively new approach in that direction which is based on the usage of mesenchymal stem cells (MSCs) derived from bone marrow (BM-MSC) and adipose tissue (ASCs or AdMSC) [1,2].
As a part of fat tissue, adipose tissue is a relatively newly accepted, abundant, easily accessible, and preferable source of multipotent mesenchymal stromal cells for autologous cell therapy in regenerative medicine. By collagenase digestion of adipose tissue, a cell fraction is separated and defined as a stromal vascular fraction (SVF), composed of heterogeneous cell populations including blood-derived cells, adipose-derived adherent stromal cells, endothelial (progenitor) cells, pericytes, and other cells [3]. Further expansion of cells in culture leads to diminishing haematopoietic cells from SVF, and a less heterogeneous population of adherent cells are purified, termed adipose-derived stem cells (ASCs) [4,5].
To define the cell fraction called “multipotent mesenchymal stromal cells”, the International Society for Cellular Therapy proposed the following minimal criteria: adherence to plastic, specific surface antigen (Ag) expression, and multipotent differentiation potential [6]. Recently, a name change from MSCs to Medicinal Signalling Cells was proposed. Since those cells inhabit the sites of injury and are due to secreted bioactive factors, they provoke immunomodulation and regeneration processes of damaged tissues leading to therapeutic effects [7].
The multipotent differentiation potential is the most valuable criterion for MSC identification because it reveals the functional plasticity of isolated cells. Such a statement is supported by researchers who conclude that although the suspected cells express specific surface antigen markers for potential stem cells, they may not be sufficient to distinguish types or subpopulations of stem cells, and also an examination of their ability to produce daughter cells and differentiation to multiple phenotypes is a better approach [8].
Many factors could influence the expression of MSCs’ “specific” cluster of differentiation (CD) markers and enable cells for multilineage differentiation. The MSC phenotype could be affected by cultural conditions [9]. Otherwise, even the cells expressing specific CD markers for MSCs may lack their phenotypic plasticity and the ability for multilineage differentiation. Various chemical cocktails are proposed as inducers for tri-lineage cellular differentiation for MSCs. Most of them are adopted from human MSCs differentiation protocols. However, there are species-specific responses in mammals, and a careful approach is necessary to find precisely the best combination of inducers to reveal the potential of isolated cells. The most used adipogenic protocols for ASCs consist of insulin, dexamethasone, indomethacin, and IBMX. Some comparative reports revealed that insulin concentration is approximately equal between mouse ASCs (mASCs) and human ASCs. However, dexamethasone concentration is ten-fold increased in mASCs, demonstrating the species-specific differences in adipogenic ability between mouse and human MSCs [10]. In horses, the variations of dexamethasone concentration are similar to that in mASCs [11–13] since the insulin varies between 0.1 µM and 10 µM [12,14]. The most reported indomethacin concentrations are between 0.2 and 0.1 mM, while IBMX stays constant at 0.5 mM [11,12,15].
Even though some researchers have successfully implemented adipogenesis using commercial human adipogenic differentiation medium [16–18], achieving sufficiently obese mature adipocytes in equine ASCs is still challenging. The most commonly used supplement in routine protocols is bovine serum, but horse serum seemed to be an alternative source of growth factors and hormones [19]. The sera could also be defined as an influencer affecting their differentiation ability. According to our observations, those effects are weak, especially in the context of species-specific conditional requirements of equine ASCs.
Based on those mentioned earlier, the current study aimed to establish the least toxic and the most potent combination and relative concentrations of adipogenic inductors such as indomethacin and IBMX for equine ASCs to enable and reveal the complete multipotent properties of those cells.
2. Materials and methods
2.1. Collection of adipose tissue and experimental design
Tissue samples from subcutaneous adipose tissue were taken from four (three females and one male) horses of an average age 14–18 years, mixed breed. The animals were restrained in stock and operated in a standing position under neuroleptanalgesia. For this purpose, a mixture of detomidine hydrochloride (Domosedan®, Orion Pharma, Finland) 0.01 mg/kg and butorphanol tartarate (Butomidor®, Richter Pharma, Austria) 0.025 mg/kg were applied intravenously. Local infiltration with 5 ml lidocaine 2% solution (Sopharma, Bulgaria) was also performed. Before sampling, the operating field was surgically prepared and followed by a longitudinal skin incision (about 5–6 cm in length) in the middle of the left gluteal region (Regio glutea sinistra). The subcutaneous fat depot was discovered in this area just under the skin and superficial gluteal fascia [13]. Adipose pieces 2 × 2× 2 cm were collected, minced in a laminar flow hood and digested with collagenase for 2 h. The isolated SVF was seeded in basal medium (DMEM-Dulbecco’s Modified Eagle’s Medium; 10% FBS-Foetal Bovine Serum and 10 ml/L antibiotic/antimycotic solution, all from Sigma -St. Louis, MO, USA) and incubated under humidified 5% CO2 conditions at 37°C. The experimental design was according to national animal welfare regulations and approved by the National Ethics Commission (Permission № 322/09.12.2021 issued by the Bulgarian Food Safety Agency within the Bulgarian Ministry of Agriculture).
At passage three, the cells were re-seeded at density 2.5 × 10⁴/ml in 12-well plates and, after reaching confluence, left for an additional 24 h (growth arrest). After that, the cells were cultured in an adipogenic medium (DMEM-high glucose; 10% FBS; 1 μM dexamethasone; 10 μg/ml insulin; and 10 ml/L antibiotic/antimycotic solution) and supplemented with three different concentrations of indomethacin (0.1 mM-the reported; 0.05 mM – 50% of the reported and 0.02 mM – 20% of the reported) and IBMX (0.5 mM- the reported; 0.25 mM-50% of the reported and 0.1 mM-20% of the reported). In contrast to the IBMX, indomethacin caused various degrees of cellular detachment observed 48 h later (Figure 1). The wells were washed in PBS, survived cells trypsinized and counted by Thoma’s counting chamber. All experiments were duplicated, and the control groups were cultured in a high-glucose-basal medium.
Figure 1.

Native micrographs of equine ASCs after 48 hours in AIM containing three different indomethacin and IBMX concentrations. Increased indomethacin concentrations gradually provoke the corresponding cytotoxic effect (first row), while IBMX did not provoke any visible negative impact (second row) (Bar = 500 µm).
2.2. Methylthiazolyldiphenyl-tetrazolium bromide (MTT) assay
After seeding in 5 × 10⁴/ml density on 24-well plates for 24 h in basal medium for attachment, the fourth passage cells were cultured for an additional 48 h in adipogenic medium supplemented with three different concentrations of indomethacin (0.1 mM – the reported; 0.05 mM – 50% of the reported and 0.02 mM – 20% of the reported) and IBMX (0.5 mM- the reported; 0.25 mM-50% of the reported and 0.1 mM-20% of the reported). The experimental groups were also subdivided depending on the induction medium’s supplementation with FBS and HS (both from Sigma). The control groups were treated with adipogenic medium without indomethacin and IBMX and supplemented with FBS and HS, respectively, to evaluate, more precisely, the net effect of the primary inductors. MTT-assay solution (Sigma) was prepared extempore according to the manufacturer’s recommendations. Further, 10% vol/vol of MTT solution was added, and plates were incubated in dark conditions. Two hours later, when the purple formazan crystals formed, the MTT solution was discarded, and acidified 100% Isopropanol was used to elute the reduced yellow tetrazolium salt. The plates were shacked for 10 min, and the absorbance was measured at 570 nm using Synergy™ LX Multi-Mode Microplate Reader (BioTeck®, USA). The final values were expressed as a percentage of cell survival, calculated as follows: (absorbance of treated cells/absorbance of control cells) × 100.
2.3. Tri-lineage differentiation
2.3.1. Adipogenic differentiation
At the forth passage, approximately 5 × 10⁵ cells were seeded on a 24-well plate in basal medium with FBS until confluence. Further, based on the MTT assay results, the cells were induced in adipogenic medium (DMEM-HG; 10% HS – heat-inactivated Horse Serum/or FBS, respectively; 1 μM dexamethasone; 10 μg/ml insulin; indomethacin 0.05 mM; IBMX 0.5 mM; and 10 ml/L antibiotic/antimycotic solution) for 18 days. The cells were stained with Oil-Red-O to visualize intracellular lipid droplets (LDs) as described by Yang et al., 2011 [20]. The images were taken, and the intracellular lipid accumulation amount was quantified.
2.3.1.1. Spectrophotometric quantification of Oil-Red-O eluates
In brief, as described by Vachkova et al., 2016 [21], the already differentiated and Oil-Red-O stained cells were triple washed with distilled water and to each plate well 1 ml of 100% isopropanol was added. In 10 min at room temperature the OD (optical density) of Oil-Red-O eluates was measured by Synergy™ LX Multi-Mode Microplate Reader (BioTeck®, USA) at 490 nm. The intracellular lipid accumulation (ILA) was calculated as a per cent of the controls using the following equation: ILA%=[(Induced−Contr)×100]/Control.
The functional multipotency of the isolated cells was proven by additional osteogenic and chondrogenic differentiations applied as follows:
2.3.2. Osteogenic differentiation
The cells at 3–4 passages were seeded on 12-well plates at density 2.5 × 10⁴/ml in basal medium. After reaching confluence, the cells were treated with osteogenic medium (2% FBS; 1% ITS; 0,1 μM dexamethasone; 10 mM β-glycerolphosphate; 50 µM L-Ascorbic Acid; 20 ml/L L-Glutamine; 10 ml/L antibiotic/antimycotic solution; and DMEM all from Sigma). On day 21, the cells were stained with Alizarin Red S to visualize extracellular calcium deposits.
2.3.3. Chondrogenic differentiation
Briefly, after trypsinization and washing, approximately 1.5 × 10⁶ cells at the 3rd-4th passage were centrifuged at 1770 × g for 5 min and the achieved pellet was cultured as a micromass pellet system in polypropylene 15 ml nonadherent conical tubes, at 37°C, 5% CO2 [22]. The pellet was treated with chondrogenic medium (1% ITS; 2% FBS; 0.1 μM dexamethasone; 10 ng/ml human TGFβ1; 50 µM L-ascorbic Acid; 20 ml/L L-Glutamine; 10 ml/L antibiotic/antimycotic solution; and DMEM all from Sigma) for 21 days. After that period, the micromass structures were stained with Alcian Blue to visualize extracellular cartilage-specific proteoglycans and embedded in Entellan® mounting medium (Merck KGaA, Darmstadt, Germany).
2.3.4. Negative controls
The negative controls of adipogenic, osteogenic, and chondrogenic differentiation were cultured in parallel only in basal medium for the entire experimental period and stained with Oil-Red-O and Alizarin Red S, respectively.
All micrographs were taken by an inverted microscope Leica DMi1 (Germany), equipped with a 5.0 megapixels resolution camera version MC170 HD and Software platform Leica Application Suite, Version 4.12.0 (Build: 86).
2.4. Gene expression analysis (RT-qPCR)
Total cellular RNA was extracted using the RNeasy Lipid Tissue Mini Kit (Qiagen, Germany) according to the manufacturer’s protocol. RNA purity and quantity were measured by UV/Vis spectrophotometer Agilent Cary 60 at 260 and 280 nm absorbance. All RNA samples were purified from genomic DNA using RNAse-Free DNase Set (Qiagen, Germany) and reverse transcribed by RevertAid First-Strand cDNA Synthesis Kit (Thermo Scientific, Waltham, USA) according to the manufacturer’s instructions. The expression levels of the target genes, adipogenic markers such as Adiponectin and Peroxisome proliferator-activated receptor gamma (PPARγ) and CD markers (positive CD44, CD73, CD90, and CD105, and negative CD14 and CD45) were evaluated by real-time qPCR thermocycler Gentier 96E (Xi’an Tianlong Science and Technology, China) using KAPA SYBR FAST Master Mix (2X) (Roche) in duplicates by two-step qPCR. A 40-cycle PCR amplification was performed according to the following cycling conditions: 95°C for 3 min and 40 cycles at 95°C for 3 s, annealing/extension for 30 s, at temperature as shown in Table 1. Two housekeeping genes, HPRT and B2M, whose stability value was determined by NormFinder software [27], were used for normalizing PPARγ and Adiponectin gene expression since for the CD markers gene expression HPRT was used. The relative expression level of the target genes was calculated to the mean value of nondifferentiated control groups. Leukocytes isolated from the same horses were used as a positive control of negative for ASCs CD markers. The primer sequences for the housekeeping and target genes are shown in Table 1.
Table 1.
Full names, forward and reverse primer sequences, product lengths, target and housekeeping gene amplification temperatures.
| Abbreviation | Full name | Forward | Reverse | Product length, bp | T °C |
|---|---|---|---|---|---|
| PPARγ XM_001492411 [23] |
Peroxisome-proliferator -activated receptor-γ | GTCTCATAACGCCATCAGGTTTG | GCCCTCGCCTTCGCTTTG | 180 | 65 |
| Adipoq XM_001499514 [24] |
Adiponectin | GGAGATCCAGGTCTTGTTGG | TCGGGTCTCCAATCCTACAC | 162 | 60 |
| CD105 XM_003364144.4 [25] |
Endoglin | CCGCCGCACTGTGGTACATCTAC | TGTGGTTGGTGCTACTGCTCTCTG | 108 | 63 |
| CD44 NM_001085435.2 [26] |
CD44 molecule | ATCCTCACGTCCAACACCTC | CTCGCCTTTCTTGGTGTAGC | 165 | 60 |
| CD90 XM_001503225.4 |
CD90 Thy-1 cell surface antigen (THY1) | ACTGAGCTCTCGGCACCAT | GTGTGGCGGTGGTATTCTCA | 156 | 60 |
| CD45 AY114350.1 [26] |
Leukocyte common antigen | TGATTCCCAGAAATGACCATGTA | ACATTTTGGGCTTGTCCTGTAAC | 101 | 60 |
| CD14 AF200416.2 |
lipopolysaccharide receptor (CD14) | CTGTGAGGTGGACGATGAGA | TAGGTCCTCCAGCGTCAGTT | 301 | 60 |
| HPRT AY372182.1 |
Hypoxanthine phosphoribosyltransferase | CCAGTCAACAGGGGACATAA | GCTTGCGACCTTGACCATCT | 163 | 60 |
| B2M X69083.1 |
beta 2-microglobulin | TTTACTCACGTCACCCAGCA | TCCACACCATTGGGAGTAAAG | 199 | 60 |
2.5. Albumin content in sera
The albumin content in both commercial FBS and HS was measured by clinical chemistry analyser BS-12 Mindray, China.
2.6. Microscopic observation of adipose tissue samples
The rest of the adipose tissue samples were fixed in 10% neutral buffered formalin for 72 h. After washing and dehydrating in the ascending alcohol series, the tissue samples were cleared in xylene and embedded in paraffin. Serial histological sections of 4 to 5 µm thickness were obtained with a Leica RM 2235 rotary microtome (Germany). The sections were deparaffinized twice in xylene, passed successively through the descending alcohol series and Masson’s trichrome Goldner kit reagents (Masson’s trichrome Goldner kit, Merck Millipore, Germany), dehydrated in the ascending alcohol series, and cleared in xylene. Histological sections were included in Entellan (Entellan®, Merck KGaA, Darmstadt, Germany). Microscopic observations were performed with a Leica DM1000 (Switzerland) LED light microscope equipped with the Leica Application Suite software platform (LAS, version 4.8.0., Leica Microsystems CMS GmBH) measuring the cross-sectional area of adipocytes. From each horse’s prepared slices of adipose tissue, 100 well-preserved adipocytes were selected (Figure 7).
Figure 7.

Micrographs of equine trichrome Masson-Goldner stained adipose tissue (a) and the measurement of adipocytes cross-sectional area(B), (Bar=200 µm). The arrows indicate collagen bundles in perilobular septa; “V” indicates intralobular vessel, and “a” indicates adipocytes.
2.7. Statistical analysis
The statistical analysis was performed by Statistica v. 7 (StatSoft Inc., 2004). The mean values, standard error of the mean (mean ±SEM) and the significant differences between groups in cell number after indomethacin treatments, MTT assay and % of ILA were estimated, where after the prerequisites for an ANOVA were met, the FISHER LSD was then performed. Since for adipogenic markers (adiponectin and PPAR gamma) qPCR data, a normal distribution could not be achieved by transformation, the Mann–Whitney U-test was performed. Three levels of significance were considered: p < 0.05; p < 0.01 and p < 0.001.
3. Results
The IBMX alone does not cause cellular detachment, and the monolayer was intact, homogenous, and 100% confluent. Conversely, indomethacin caused a gradient cytotoxic effect manifested by partial cellular detachment proportional to the increasing concentrations. Compared to the controls, the total number of the cells significantly decreased between 2.43 and 4.36 folds after FBS-indomethacin treatments (Figure 2).
Figure 2.

Dose-dependent cytotoxic effect of indomethacin treatment in 0.1 mM, 0.05 mM, and 0.02 mM concentrations in equine subcutaneous ASCs. Each group presents the number of cells attached after 48 hours of treatment as a mean number (nx104). The significant differences between the control (untreated) and treated groups are presented with an asterisk (***=p<0.001). (n=4, error Bars= ± SEM).
3.1. MTT-assay
In general, exposing equine ASCs for 48 h on decreasing concentrations of the main adipogenic inductors elevates cellular vitality to varying degrees. Supplementing the adipogenic medium with HS in the indomethacin group significantly (p < 0.05) raised cellular vitality by approximately 35% in all concentrations over those cultured in FBS. Lowering concentrations of IBMX in all groups did not significantly affect cellular vitality in FBS and HS treatments (Figure 3).
Figure 3.

MTT assay of equine subcutaneous ASCs cell viability, exposed for 48 hours in indomethacin (in concentrations of 0.1 mM, 0.05 mM, and 0.02 mM) and IBMX (in concentrations of 0.5 mM, 0.25 mM, and 0.1 mM). The data presented cellular vitality as % of treated to the control groups. The significant differences between FBS and HS groups are presented with asterisks (*=p<0.05; n=4, error Bars=SEM).
3.2. Tri-lineage differentiation
The differential protocols proved the functional plasticity and multipotent properties (Figure 4A), isolated cells stained positively for intracellular LDs, extracellular calcium deposits, and extracellular cartilage-specific proteoglycans in adipogenesis, osteogenesis, and chondrogenic, respectively, proving that those cells possess. Concerning adipogenesis, the formation of intracellular LDs was better developed after culturing cells in HS than in FBS- an adipogenic medium (Figure 4B). The percentage of ILAs after Oil-Red-O extraction was significantly higher in the HS group than in FBS (Figure 4C). The LDs increased in number and size till the end of the treatment. The cellular monolayer was intact, without any signs of cellular detachment during the experimental period, in contrast to those in FBS. The negative controls cultured in the basal medium did not show any specific colorization after staining with Oil-Red-O and Alizarin Red S, and the pellet could not form a micromass in the pellet culture system. The lower concentration of inductors was unable to induce sufficient adipogenesis.
Figure 4.

Tri-lineage differentiation of equine subcutaneous ASCs(a): 1st column – the samples stained with Oil Red O for adipogenesis (Bar=50 µm) and their negative controls (Bar=500 µm); 2nd column - the samples stained with Alcian blue for chondrogenesis, (Bar=50 µm); 3rd column - the samples stained with Alizarin Red for osteogenesis (Bar=50 µm) and their negative controls (Bar=100 µm). The micrographs (b) of ASCs differentiated in HS (left) and in FBS (right), Oil Red O staining, (Bar=100 µm). The intracellular lipid droplet accumulation (c) of Oil-Red-O presented as a percent to the non-treated control after 0.05 mM indomethacin adipogenic induction in HS and FBS. The significant difference between both groups is presented with an asterisk (*=p<0.05, n=4, mean±SEM).
3.3. Adiponectin and PPAR gamma mRNA expression
Compared to the FBS-differentiated cells, the significant (p < 0.05) up-regulation of adiponectin mRNA expression was established in HS-differentiated ASCs. The fold changes in PPAR gamma between groups were insignificant (Figure 5).
Figure 5.
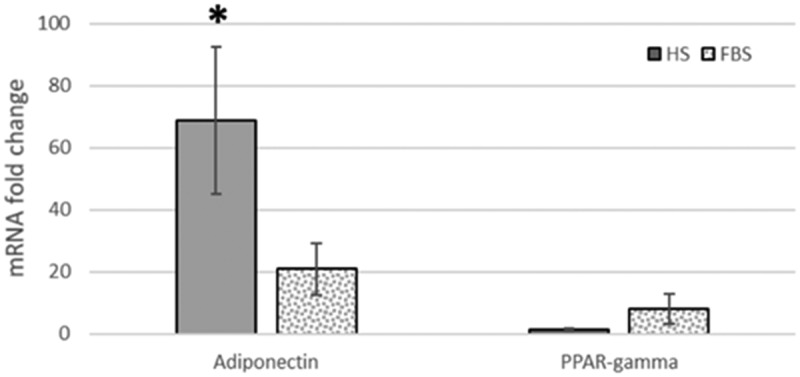
Adiponectin and PPAR gamma mRNA fold-change expression compared to the non-differentiated control group of horse ASCs after adipogenic differentiation in HS (in solid grey) and FBS (in grey dots). The significant differences between HS and FBS groups are marked with an asterisk (p<0.05; mean±SEM, n=4).
3.4. Positive and negative CD markers mRNA expression
In contrast to the leucocytes, the positive CD markers such as CD44, CD90, and CD105 were upregulated, while negative ones such as CD45 and CD14 were downregulated or not expressed in ASCs (Figure 6).
Figure 6.

Positive and negative CD markers for ASCs (in light grey) and leucocytes (in dark grey) mRNA expression relative to the housekeeping gene. (mean±SEM, n=4).
3.5. Microscopic observation of adipose tissue samples
Type white adipocytes (adipocytes uniloculares) represented the subcutaneous adipose tissue of investigated horses. The nucleus cytoplasm of each cell was compressed in the periphery by a single fat drop. Single blood vessels were seen in and between the adipose lobules. The interlobular connective tissue septa were composed mainly of collagen fibres, stained in light green after Masson trichrome staining. The average cross-sectional area of the measured adipocytes from the samples was 4460,00 ± 144,09 µm2 (Figure 7).
3.6. Albumin content in sera
Albumin concentration in both commercial serums was found in FBS at 27.1 g/L and in HS at 30.7 g/L, respectively.
4. Discussion
Indomethacin is a nonsteroidal anti-inflammatory drug (NSAID) and, more specifically, a non-selective cyclooxygenase COX-1/COX-2 inhibitor. For decades, it has been recognized as a key inductor that commonly supplements a variety of chemical cocktails for in vitro studies on adipogenesis. Nowadays, it is well established that its pro-adipogenic properties are realized due to a prostaglandin-independent mechanism that increases both C/EBPβ and PPARγ2, including in MSCs [28,29]. As mentioned previously, the concentrations of insulin and indomethacin vary among the primary adipogenic inductors. Indomethacin is reported to possess the highest cellular toxicity compared to the rest of the adipogenic inductors, which is supported by our results. Moreover, the main finding in the current study clearly showed significant dependency on promoted cellular viability by HS during indomethacin-induced adipogenesis in equine ASCs.
In normal conditions, in the bloodstream, NSAIDs, including indomethacin, are carried by serum albumin (SA) [30]. This protein is the most copious fraction of all blood proteins and is responsible for various physiological features such as carrying metabolites, drugs, nutrients, metals, and other molecules [31].
Concerning the current study, some predispositions are based on species-specific origin and could directly affect indomethacin-SA interaction, meaning the used serum could further change the cellular response to culture media.
One possible reason for achieving the results is that in horses SA in blood plasma is slightly higher (25–42 g/L) [32] than in cattle (21–36 g/L) [33]. Additionally, we established a higher albumin content of 3.6 g/L in HS than in the FBS. Those values suggest that raised SA would bind higher amounts of applied indomethacin and might relatively decrease its free fraction in growth media, lowering the cytotoxic effects and increasing cellular viability. Further consequences are directed to ligand – bonding interaction, particularly between the free fractions of indomethacin and PPARγ receptors, to fulfil the adipogenic programme. Since the cytotoxic effect was lessened by neutralization with SA, the cells are more capable of differentiating successfully in mature adipocytes. In humans, the application of high doses of ibuprofen in patients suffering from rheumatoid arthritis aims to prevent potential suppression by serum albumin, and the same approach is used in 3T3-L1 cells, where NSAIDs display adipogenic activities by influencing PPARγ-dependent target genes [34].
Another point is that, for example, regarding the gastrointestinal tract some species such as cats, dogs, and horses, are more sensitive to NSAID than humans, and the side effects are more significant [35]. Such a relation could probably be linked to specific responses on a cellular level as well, particularly to the MSC cytokine reactivity.
Another aspect is that the same molecule NSAIDs, including indomethacin, might have different affinities to the SA among species. Bovine and human SA exhibits 75.8% identity; for example, slight differences in their amino acid sequences are related to the evolutionary stage of animals [36]. When comparing the crystal structure of serum albumin in bovine, equine, and leporine, those molecules differ by the number of binding sites to naproxen, and the area of the binding pockets could change the affinity and the binding mode [37].
Therefore, in our study, at the same indomethacin concentration, the involved in SA amount most probably differed between HS and FBS, and free fractions, which have to bind and activate PPARγ receptors to perform adipogenic programmes, were not equal as well. Those differences would reflect on the magnitude of the side effects, including cytotoxicity and cellular vitality and further saturation of PPARγ receptors for successful induction of adipogenesis.
Concerning the IBMX treatments, the achieved data did not reveal any dependency on the used serum. IBMX is a non-selective phosphodiesterase inhibitor, resulting in the transcriptional activation of PPARγ and adipogenic gene expression by elevating intracellular cAMP and protein kinase A (PKA) [38]. It probably escapes SA neutralization and is less toxic for the equine ASCs than indomethacin, which our results confirmed.
The central role of the adipogenic inducers is targeting the direct or indirect activation of the PPARγ transcriptional factor [39]. PPARγ may vary, although it is considered a late adipogenic gene, and its highest expression is established towards the end of differentiation [15]. There is a report of its increased expression 6–7 days after the induction of ASCs in adipogenic differentiation [14]. In our study, we established an insignificant up-regulation of PPARγ, which, together with the down-regulation of adiponectin, revealed adipocyte immaturity in the FBS group.
Adiponectin is an adipokine secreted by mature adipocytes. It is accepted as an adipogenic marker whose mRNA expression significantly increases after the adipogenic differentiation of ASCs. Reports show that inhibition of the protein tyrosine phosphatase enhances the adipogenic differentiation potential in metabolically impaired progenitor stem cells [40]. The same authors found that adiponectin expression was significantly higher than other adipogenic markers in the research. Since indomethacin serves as a potential inhibitor of protein phosphatases [41] and with higher albumin content in HS, the significant up-regulation of adiponectin in HS-treated cells is logical and evidence of more advanced adipogenic differentiation than in FBS-treated ones.
In addition, some space-specific aspects should be concerned related to the ability of horse adipocytes to accumulate lipid droplets. Reynolds et al., 2019 [42] reported that in healthy horses, the adipocyte area approximates from 4751 ± 1406 µm2 for retroperitoneal to 5818 ± 1494 µm2 for peri‐renal depots. The authors also found that the cross-sectional area of adipocytes from those regions in horses with equine metabolic syndrome could expand up to three to four folds. We found that the mean cross-sectional area of subcutaneous adipocytes from the gluteal region in horses was 4460,00 ± 144,09 µm2 which did not differ from the data above in healthy animals, confirming the lack of hypertrophic events in investigated tissues. In comparison, the adipocytes’ cross-sectional area from inguinogluteal subcutaneous fat depot in rabbits at the age of 1, 2 and 3 months was 3324.92 ± 79.21 µm2, 5098.19 ± 105.18 µm2, and 8854.78 ± 163.42 µm2, respectively [43], indicating that in adult horses, the ability to deposit lipids in adipocytes is lower than in adult rabbits. It suggests a lower physiological predisposition to adiposity in vivo in horses, which further affects the in vitro adipogenic differentiation ability of equine ASCs.
Finally, the differences in bioactive components (growth factors, hormones, cytokines, etc.) in both serums could also be responsible to some extent for the observed effects in our study. When comparing the foetal calf serum (FCS), commercial horse serum, and allogenic horse serum, diverse effects on proliferation, morphology, viability, immunophenotype, and plasticity of equine adipose-derived mesenchymal stem cells were established [44]. Some authors reported that the serum could even act as an antioxidant for cells [45].
More profound future studies would clarify whether the components such as SA, growth factors, and cytokines in HS are related to the cellular viability and supported the improvement of equine ASC adipogenicity as part of the tri-lineage differentiation protocol. These components could also be investigated in FBS and applied in a comparable manner.
4.1. Conclusion
The proper performance of tri-lineage differentiation protocols is critical to confirm and reveal the multipotential properties of primary adipose-derived MSCs. The achieved results confirmed that the amount of SA should be considered in protocols based on indomethacin-induced adipogenesis as a part of this programme. Based on our results, we would suggest the HS as an appropriate supplement of choice in indomethacin-induced adipogenesis in equine subcutaneous ASCs because it is a physiological source of nutrients, closer by physio-chemical characteristics to the equine blood and potentiates cellular viability.
Acknowledgments Laboratory of Experimental cellular physiology and therapeutic drug monitoring, Faculty of Veterinary Medicine, Trakia University, Stara Zagora, Bulgaria
Declarations of interest: none.
4.2. Availability of data and material
The data that support the findings of this study are available from the corresponding author.
Acknowledgments
We acknowledge funding support equally by Project N 14/20 and by the Ph.D. Fellowship of Dr Valeria Petrova within the Faculty of Veterinary Medicine, Trakia University, Stara Zagora, Bulgaria and Laboratory of Experimental cellular physiology and therapeutic drug monitoring, Faculty of Veterinary Medicine, Trakia University, Stara Zagora, Bulgaria. The funding sources had no involvement in the study design, data collection, analysis, writing of the report, or decision to publish.
Funding Statement
This work was supported by the Faculty of Veterinary Medicine, Trakia University, Stara Zagora, Bulgaria [Project N 14/20 and by the Ph.D. Fellowship of Dr. Valeria Petrova].
Compliance with ethical standards
The experimental design was according to national animal welfare regulations and approved by the National Ethics Commission (Permission № 322/09.12.2021 issued by the Bulgarian Food Safety Agency within the Bulgarian Ministry of Agriculture).
Conflicts of interest
The authors declare no conflict of interest.
Consent for publication
All authors give consent for publication.
Disclosure statement
No potential conflict of interest was reported by the author(s).
References
- [1].Shojaee A, Parham A.. Strategies of tenogenic differentiation of equine stem cells for tendon repair: current status and challenges. Stem Cell Res Ther. 2019;10(1):181. doi: 10.1186/s13287-019-1291-0 [DOI] [PMC free article] [PubMed] [Google Scholar]
- [2].Reed SA, Leahy ER. Stem cell therapy in equine tendon injury. J Anim Sci. 2013;91(1):59–65. doi: 10.2527/jas.2012-5736 [DOI] [PubMed] [Google Scholar]
- [3].Yoshimura K, Shigeura T, Matsumoto D, et al. Characterization of freshly isolated and cultured cells derived from the fatty and fluid portions of liposuction aspirates. J Cell Physiol. 2006;208(1):64–76. doi: 10.1002/jcp.20636 [DOI] [PubMed] [Google Scholar]
- [4].Rodeheffer MS, Birsoy K, Friedman JM. Identification of white adipocyte progenitor cells in vivo. Cell. 2008;135:240–249. doi: 10.1016/j.cell.2008.09.036 [DOI] [PubMed] [Google Scholar]
- [5].Bourin P, Bunnell BA, Casteilla L, et al. Stromal cells from the adipose tissue-derived stromal vascular fraction and culture expanded adipose tissue-derived stromal/stem cells: a joint statement of the International Federation for adipose Therapeutics and Science (IFATS) and the International Society for cellular therapy (ISCT). Cytotherapy. 2013;15(6):641–648. doi: 10.1016/j.jcyt.2013.02.006 [DOI] [PMC free article] [PubMed] [Google Scholar]
- [6].Dominici M, Le Blank K, Mueller I, et al. Minimal criteria for defining multipotent mesenchymal stromal cells. The International Society for Cellular Therapy position statement. Cytotherapy. 2006;8(4):315–317. doi: 10.1080/14653240600855905 [DOI] [PubMed] [Google Scholar]
- [7].Caplan AI. Mesenchymal stem cells: Time to change the name! Stem Cells Transl Med. 2017;6(6):1445–1451. doi: 10.1002/sctm.17-0051 [DOI] [PMC free article] [PubMed] [Google Scholar]
- [8].Pittenger MF, Martin BJ. Mesenchymal stem cells and their potential as cardiac therapeutics. Circ Res. 2004;95(1):9–20. doi: 10.1161/01.RES.0000135902.99383.6f [DOI] [PubMed] [Google Scholar]
- [9].Lv F, Tuan RS, Cheung KM, et al. Concise review: The surface markers and Identity of human mesenchymal stem cells. Stem Cells. 2014;32(6):1408–1419. doi: 10.1002/stem.1681 [DOI] [PubMed] [Google Scholar]
- [10].Scott MA, Nguyen VT, Levi B, et al. Current methods of adipogenic differentiation of mesenchymal stem cells. Stem Cells Dev. 2011;20(10):1793–1804. doi: 10.1089/scd.2011.0040 [DOI] [PMC free article] [PubMed] [Google Scholar]
- [11].Mambelli LI, Santos EJ, Frazao PJ, et al. Characterization of equine adipose tissue–derived progenitor cells before and after cryopreservation. Tissue Eng Part C Methods. 2009;15(1):87–94. doi: 10.1089/ten.tec.2008.0186 [DOI] [PubMed] [Google Scholar]
- [12].Pascucci L, Curina G, Mercati F, et al. Flow cytometric characterization of culture expanded multipotent mesenchymal stromal cells (MSCs) from horse adipose tissue: towards the definition of minimal stemness criteria. Vet Immunol Immunopathol. 2011;144(3–4):499–506. doi: 10.1016/j.vetimm.2011.07.017 [DOI] [PubMed] [Google Scholar]
- [13].Raabe O, Shell K, Würtz A, et al. Further insights into the characterization of equine adipose tissue-derived mesenchymal stem cells. Vet Res Commun. 2011;35(6):355–365. doi: 10.1007/s11259-011-9480-z [DOI] [PubMed] [Google Scholar]
- [14].Braun J, Hack A, Weis-Klemm M, et al. Evaluation of the osteogenic and chondrogenic differentiation capacities of equine adipose tissue–derived mesenchymal stem cells. Am J Vet Res. 2010;71(10):1228–1236. doi: 10.2460/ajvr.71.10.1228 [DOI] [PubMed] [Google Scholar]
- [15].Ranera B, Ordovás L, Lyahyai J, et al. Comparative study of equine bone marrow and adipose tissue-derived mesenchymal stromal cells. Equine Vet J. 2012;44(1):33–42. doi: 10.1111/j.2042-3306.2010.00353.x [DOI] [PubMed] [Google Scholar]
- [16].Carvalho ADM, Yamada ALM, Golim MA, et al. Characterization of mesenchymal stem cells derived from equine adipose tissue. Arq Bras Med Vet Zootec. 2013;65(4):939–945. doi: 10.1590/S0102-09352013000400001 [DOI] [Google Scholar]
- [17].Barberini DJ, Freitas NP, Magnoni MS, et al. Equine mesenchymal stem cells from bone marrow, adipose tissue and umbilical cord: immunophenotypic characterization and differentiation potential. Stem Cell Res Ther. 2014;5(1):25. doi: 10.1186/scrt414 [DOI] [PMC free article] [PubMed] [Google Scholar]
- [18].Kim KH, Park TS, Cho BW, et al. Nanoparticles from equine fetal bone marrow-derived cells enhance the survival of injured chondrocytes. Animals. 2020;10(10):1723. doi: 10.3390/ani10101723 [DOI] [PMC free article] [PubMed] [Google Scholar]
- [19].Franke J, Abs V, Zizzadoro C, et al. Comparative study of the effects of fetal bovine serum versus horse serum on growth and differentiation of primary equine bronchial fibroblasts. BMC Vet Res. 2014;10(1):119. doi: 10.1186/1746-6148-10-119 [DOI] [PMC free article] [PubMed] [Google Scholar]
- [20].Yang XF, He X, He J, et al. High efficient isolation and systematic identification of human adipose-derived mesenchymal stem cells. J Biomed Sci. 2011;18(1):59. doi: 10.1186/1423-0127-18-59 [DOI] [PMC free article] [PubMed] [Google Scholar]
- [21].Vachkova E, Bosnakovski D, Yonkova P, et al. Adipogenic potential of stem cells derived from rabbit subcutaneous and visceral adipose tissue in vitro. Vitro Cell Dev Biol Anim. 2016;52(8):829–837. doi: 10.1007/s11626-016-0048-7 [DOI] [PubMed] [Google Scholar]
- [22].Bosnakovski D, Mizuno M, Kim G, et al. Chondrogenic differentiation of bovine bone marrow mesenchymal stem cells in pellet cultural system. Exp Hematol. 2004;32(5):502–509. doi: 10.1016/j.exphem.2004.02.009 [DOI] [PubMed] [Google Scholar]
- [23].Shell K, Raabe O, Freitag C, et al. Comparison of equine adipose tissue-derived stem cell behavior and differentiation potential under the influence of 3% and 21% oxygen tension. JEVS. 2013;33(2):74–82. doi: 10.1016/j.jevs.2012.05.002 [DOI] [Google Scholar]
- [24].Selim S, Elo K, Jaakkola S, et al. Relationships among body condition, insulin resistance and subcutaneous adipose tissue gene expression during the grazing season in mares. PLoS One. 2015;10(5):e0125968. doi: 10.1371/journal.pone.0125968 [DOI] [PMC free article] [PubMed] [Google Scholar]
- [25].Arnhold S, Elashry MI, Klymiuk MC, et al. Investigation of stemness and multipotency of equine adipose-derived mesenchymal stem cells (ASCs) from different fat sources in comparison with lipoma. Stem Cell Res Ther. 2019;10(1):309. doi: 10.1186/s13287-019-1429-0 [DOI] [PMC free article] [PubMed] [Google Scholar]
- [26].Mohanty N, Gulati BR, Kumar R, et al. Phenotypical and functional characteristics of mesenchymal stem cells derived from equine umbilical cord blood. Cytotechnology. 2016;68(4):795–807. doi: 10.1007/s10616-014-9831-z [DOI] [PMC free article] [PubMed] [Google Scholar]
- [27].Andersen CL, Jensen JL, Orntoft TF. Normalization of real-time quantitative reverse transcription-PCR data: a model-based variance estimation approach to identify genes suited for normalization, applied to bladder and colon cancer data sets. Cancer Res. 2004;64(15):5245–5250. doi: 10.1158/0008-5472.CAN-04-0496 [DOI] [PubMed] [Google Scholar]
- [28].Lehmann JM, Lenhard JM, Oliver BB, et al. Peroxisome proliferator-activated receptors alpha and gamma are activated by indomethacin and other nonsteroidal anti-inflammatory drugs. J Biol Chem. 1997;272(6):3406–3410. doi: 10.1074/jbc.272.6.3406 [DOI] [PubMed] [Google Scholar]
- [29].Styner M, Sen B, Xie Z, et al. Indomethacin promotes adipogenesis of mesenchymal stem cells through a cyclooxygenase independent mechanism. J Cell Biochem. 2010;111(4):1042–1050. doi: 10.1002/jcb.22793 [DOI] [PMC free article] [PubMed] [Google Scholar]
- [30].Czub MP, Handing KB, Venkataramany BS, et al. Albumin-based transport of nonsteroidal anti-inflammatory drugs in mammalian blood plasma. J Med Chem. 2020;63(13):6847–6862. doi: 10.1021/acs.jmedchem.0c00225 [DOI] [PMC free article] [PubMed] [Google Scholar]
- [31].Majorek KA, Porebski PJ, Dayal A, et al. Structural and immunologic characterization of bovine, horse, and rabbit serum albumins. Mol Immunol. 2012;52(3–4):174–182. doi: 10.1016/j.molimm.2012.05.011 [DOI] [PMC free article] [PubMed] [Google Scholar]
- [32].Appendix C. Normal ranges for hematology and plasma chemistry and conversion table for units practical guide to equine colic. In: Southwood © Louise L., editor. 1st ed. John Wiley & Sons, Inc.; 2013. p. 339–342. 10.1002/9781118704783.app3 [DOI] [Google Scholar]
- [33].Appendix 3: Laboratory Reference Values: Biochemistry. In Clinical Examination of Farm Animals. 2002. (eds PG Jackson and PD Cockcroft). 10.1002/9780470752425.app3 [DOI] [Google Scholar]
- [34].Puhl AC, Milton FA, Cvoro A, et al. Mechanisms of peroxisome proliferator activated receptor γ regulation by nonsteroidal anti-inflammatory drugs. Nucl. Recept. Signal. 2015;13:e004 doi: 10.1621/nrs.13004 [DOI] [PMC free article] [PubMed] [Google Scholar]
- [35].Mahmud T, Rafi SS, Scott DL, et al. Nonsteroidal anti-inflammatory drugs and uncoupling of mitochondrial oxidative phosphorylation. Arthritis Rheum 1996;39,1998–2003. doi: 10.1002/art.1780391208 [DOI] [PubMed] [Google Scholar]
- [36].Bujacz A. Structures of bovine, equine and leporine serum albumin. Acta Crystallogr. Section D: Biological Crystallography 2012;68(10),1278–1289. doi: 10.1107/S0907444912027047 [DOI] [PubMed] [Google Scholar]
- [37].Bujacz A, Zielinski K, Sekula B. Structural studies of bovine, equine, and leporine serum albumin complexes with naproxen. Proteins: Struct. Funct. Genet. 2014;82(9), 2199–2208. doi: 10.1002/prot.24583 [DOI] [PubMed] [Google Scholar]
- [38].Kim, SP, Ha JM, Yun SJ, et al. Transcriptional activation of peroxisome proliferator-activated receptor-gamma requires activation of both protein kinase A and Akt during adipocyte differentiation. Biochem. Biophys. Res. Commun. 2010;399:55–59. doi: 10.1016/j.bbrc.2010.07.038 [DOI] [PubMed] [Google Scholar]
- [39].Rosen ED, Spiegelman BM. Molecular regulation of adipogenesis. Annual review of cell and developmental biology. 2000;16(1), 145–171. doi: 10.1146/annurev.cellbio.16.1.145 [DOI] [PubMed] [Google Scholar]
- [40].Kornicka-Garbowska K, Bourebaba L, Röcken M, et al. Inhibition of protein tyrosine phosphatase improves mitochondrial bioenergetics and dynamics, reduces oxidative stress, and enhances adipogenic differentiation potential in metabolically impaired progenitor stem cells. Cell Commun Signal. 2021;3;19(1):106. doi: 10.1186/s12964-021-00772-5 [DOI] [PMC free article] [PubMed] [Google Scholar]
- [41].Kanno T, Tsuchiya A, Shimizu T, et al. Indomethacin serves as a potential inhibitor of protein phosphatases. Cell Physiol Biochem. 2012;30(4):1014-22. doi: 10.1159/000341478 [DOI] [PubMed] [Google Scholar]
- [42].Reynolds A, Keen JA, Fordham T, et al. Adipose tissue dysfunction in obese horses with equine metabolic syndrome. Equine Vet J. 2019;51(6):760–766. doi: 10.1111/evj.13097 [DOI] [PMC free article] [PubMed] [Google Scholar]
- [43].Yonkova P. Dynamics of the development of subcutaneous fat depots in rabbits – a gross anatomical and microscopic study. Bulg. J. Vet. Med. 2022;25(3), 359-371. doi: 10.15547/bjvm.2373 [DOI] [Google Scholar]
- [44].Maiti SK, Wouters G, Spitkovsky D, et al. Effect of different serums on culture and growth pattern on equine adipose derived mesenchymal stem cells (hrs-AT MSC). J Stem Cell Res Ther. 2021;7(1):12–16. doi: 10.15406/jsrt.2021.07.00150 [DOI] [Google Scholar]
- [45].Meuleman N, Tondreau T, Delforge A, et al. Human marrow mesenchymal stem cell culture: serum-free medium allows better expansion than classical alpha-MEM medium. Eur J Haematol. 2006;76(4):309–16. doi: 10.1111/j.1600-0609.2005.00611.x [DOI] [PubMed] [Google Scholar]
Associated Data
This section collects any data citations, data availability statements, or supplementary materials included in this article.
Data Availability Statement
The data that support the findings of this study are available from the corresponding author.