

SUMMARY
The hypodermis is the predominant site of Staphylococcus aureus infections that cause cellulitis. Given the importance of macrophages in tissue remodeling, we examined the hypodermal macrophages (HDMs) and their impact on host susceptibility to infection. Bulk and single-cell transcriptomics uncovered HDM subsets with CCR2-dichotomy. HDM homeostasis required the fibroblast-derived growth factor CSF 1, ablation of which abrogated HDMs from the hypodermal adventitia. Loss of CCR2− HDMs resulted in accumulation of the extracellular matrix component, hyaluronic acid (HA). HDM-mediated HA clearance required sensing by the HA receptor, LYVE-1. Cell-autonomous IGF1 was required for accessibility of AP-1 transcription factor motifs that controlled LYVE-1 expression. Remarkably, loss of HDMs or IGF1 limited Staphylococcus aureus expansion via HA and conferred protection against cellulitis. Our findings reveal a function for macrophages in the regulation of HA with impact on infection outcome, which may be harnessed to limit the establishment of infection in the hypodermal niche.
Keywords: Skin, hypodermis, macrophages, extracellular matrix, Staphylococcus aureus, insulin-like growth factor 1, hyaluronic acid
eTOC
The hypodermis is the predominant site of Staphylococcus aureus infection. Voisin, Nadella, Doebel et al. find that hypodermal macrophages mediate hyaluronic acid clearance through cell autonomous IGF1-driven LYVE-1 expression, the activity of which dictates tissue susceptibility to bacterial infection.
Graphical Abstract

INTRODUCTION
The skin is the outermost barrier of the body that is exposed to various environmental stressors including trauma, ultraviolet light, thermal changes, and microbial agents, both commensal and pathogenic. To overcome these challenges, the skin is compartmentalized into three layers with distinct structures and physiological functions. The stratified epidermis ensures the first line of defense while the dermis comprises a dense network of collagen that alleviates pressures and tensions. Immediately below the dermis is a layer of adipose tissue referred to as the dermal white adipose tissue. The deepest layer of the skin, the hypodermis (also known as the subcutaneous tissue), is compartmentalized into two anatomically distinct sublayers: (1) the panniculus carnosus, a skeletal muscle layer and (2) the hypodermal adventitia, which is comparable to the superficial fascia in humans. Through these sublayers, the hypodermis facilitates thermoregulation and anchors the skin to the underlying skeletal muscles to enhance mobility of the organism 1. Thus, homeostatic maintenance of these skin layers is essential for organism survival.
Tissue-resident macrophages (RTMs) are crucial not only for host-protective immunity but also for tissue development and homeostasis 2. Strategically localized throughout the body, macrophages are seeded in the tissues during embryogenesis. There, they either self-maintain post-developmentally or are gradually replaced by bone marrow-derived monocytes, depending on the tissue that they reside in 3,4. Colony-stimulating factor 1 receptor (CSF1R) signaling and tissue-specific microenvironmental cues support macrophage maintenance and shape macrophage characteristics that enable them to fulfill their roles in organ homeostasis 2,5,6. Macrophages at barrier surfaces may be tuned toward immunological roles as exemplified by the sentinel and clearance roles of alveolar macrophages in the lung, lamina propria macrophages in the intestine or subcapsular sinus macrophages in the lymph nodes 7. Preservation of structural integrity may be central roles for macrophages in deeper organs, such as maintenance of aortic elasticity, remodeling of the bones by osteoclasts and synapse pruning by microglia in the central nervous system 8–10.
Over the past decades, skin macrophage research has primarily focused on epidermis and dermis. Most extensively studied are epidermal Langerhans cells (LCs). LCs self-renew in steady-state epidermis and their survival relies on keratinocyte-derived IL-34, a CSF1R agonist 11,12. LCs can also arise from monocyte precursors upon inflammatory cues 13,14. As first line of immunological sentinels of the body surface, they can trigger humoral and cellular responses, both pro-inflammatory and regulatory, in a context-dependent manner 15. Our current understanding of dermal macrophages (DMs) primarily comes from studies conducted on mouse ear skin. Here, DM populations are comprised of Major Histocompatibility Complex class II (MHCII)+ and MHCII− cells with distinct transcriptomic signature, localization, and antigen-presentation capacity. In the ear, DMs rely on bone marrow-derived precursors for populational maintenance 16,17. Whether or not these findings apply to body skin remains unclear. Of note, in part due to the absence of hypodermis in ear skin, our knowledge on hypodermal macrophage (HDM) characteristics, mechanisms of maintenance and functions remains limited.
Soft-tissue infections caused by the gram-positive bacterium Staphylococcus aureus (S. aureus) are frequently encountered in general medical practice. S. aureus can exist as commensal bacteria on the surfaces of skin, upper respiratory tract, and the gut in 20–30% of the population 18. Breaches in the skin barrier may lead to invasion of S. aureus and cause infection in the form of cellulitis, in which the hypodermis is primarily affected 19. Untreated cellulitis or those caused by antibiotics-resistant strains can cause local tissue necrosis that may require amputation and may further lead to sepsis, a highly life-threatening condition. While incidents of skin infections caused by methicillin-resistant S. aureus (MRSA) strains, such as USA300, have decreased over the past decade with the controlled use of antibiotics, soft-tissue infection by S. aureus remains a significant cause for morbidities and mortalities 20.
We hypothesized that HDMs might communicate bilaterally with their microenvironment to remodel the tissue and further, that disruption of such homeostatic function might modulate the susceptibility of the hypodermis against bacterial infection. Herein, we identified HDMs, which consisted of CCR2+ monocyte-derived macrophages and CCR2− RTMs. CCR2+ and CCR2− HDMs displayed distinct transcriptomic profiles, tissue-residency dynamics, and exhibited differential dependencies on the chemokine receptor, CCR2, whereas both critically depended on CSF1R. Single-cell RNA-sequencing (scRNA-seq) identified fibroblasts to be major sources of CSF1, which upon constitutive or induced ablation in TekCre×Csf1f/f (Csf1ΔTek) and Col1a2-CreERT2×Csf1f/f mice, respectively, led to abrogation of HDMs. These HDM-deficient mice were resistant against cellulitis caused by S. aureus. Protection against S. aureus infection was conferred by increased accumulation of hyaluronic acid in the hypodermis, which restricted the expansion of S. aureus both in vitro and in vivo. Homeostatic clearance of hyaluronic acid was mediated by its receptor, lymphatic vessel endothelial hyaluronan receptor 1 (LYVE-1), expression of which was regulated by insulin-like growth factor 1 (IGF1) in a cell-autonomous manner.
RESULTS
Distinct transcriptomic profiles of hypodermal and dermal CCR2+ and CCR2− macrophage subsets
We first characterized the immune cell constituents of hypodermis in comparison with those of dermis obtained from the back skin of C57BL/6 mice. Upon mechanical dissociation, dermal white adipose tissue separated with hypodermis and therefore was analyzed as a part of it (Figure S1A, S1B). Flow cytometry analysis revealed that in contrast to those in the dermis, hypodermal CD45+ immune cells mostly consisted of CD11b+ myeloid cells (Figure 1A).
Figure 1. CCR2+ and CCR2− macrophage subsets with distinct transcriptomic profiles in the dermis and hypodermis.

(A) Flow cytometry analysis of live CD45+ cells isolated from indicated skin layers of C57BL/6 mice. Graph indicates the percentage of CD45+ CD11b+ in both skin layers. Each dot represents an individual mouse. Data representative of two independent experiments (n=5–6 per group). (B) Flow cytometry analysis of live CD45+CD11b+EpCAM−Ly6Clo cells from indicated skin layers. Data representative of more than 2 independent experiments (n=2–3 per experiment). (C) Giemsa stain on sorted dermal and hypodermal CCR2+ and CCR2− macrophages from C57BL/6 mice. Scale=10μm (D) Principal component analysis of RNA-seq transcriptome analysis of indicated sorted cells from C57BL/6 mouse skin. (E and F) Volcano plots presenting the differentially expressed genes (p-value <0.05) between dermal (n=4467) and hypodermal (n=2493) CCR2+ and CCR2− macrophages (blue). Genes with p-value <0.05 and an absolute value of Log2 fold change >2 are presented in red, with genes of interest showed in yellow. (G-H) UMAP of unsupervised clustering analysis from scRNA-seq performed on dermal and hypodermal immune cells. Feature plots show the expression of characteristic genes for indicated cell lineage. (I) Schematic representation of the strategy used to obtain gene sets specific for macrophages in both dermis and hypodermis (top). Enrichment score for bulk RNA-seq macrophage gene set projected onto UMAP plots of dermal and hypodermal myeloid cells (bottom left). Cell identity annotation based on enrichment scores (bottom right). (J and L) Unsupervised heatmap of top 20 DEG between macrophage clusters of dermis and hypodermis. Selected genes are depicted. (K and M) Violin plot depicting enrichment score in scRNA-seq macrophages clusters of gene sets for CCR2+ and CCR2− macrophages that were generated from macrophage bulk RNA-seq. (B-M) Macs: macrophages, DCs: dendritic cells.
Phenotypic characterization of dermal and hypodermal CD11b+ myeloid cells showed that macrophages (CD11b+EpCAM−Ly6CloCD11clo-midCD64+) in both layers consisted of CCR2+ and CCR2− subsets with distinct expression of MHC-II in the hypodermis (Figure 1B, S1C). Cytospin preparations of CCR2+ and CCR2− DMs and HDMs revealed that CCR2+ macrophages were smaller in size whereas CCR2− cells were larger with vacuolated cytoplasm (Figure 1C).
To further characterize these macrophages, bulk RNA sequencing (RNA-seq) analysis was performed on sorted CCR2+ and CCR2− DMs and HDMs, along with CD11c+ MHCII+ CD64− dendritic cells (DCs). Principal component analysis revealed that each subset formed segregated clusters in both layers, suggesting distinct transcriptome profiles (Figure 1D). CCR2+ macrophages from both layers were characterized by monocyte-associated genes (e.g. Cxcr3, Ly6c2), whereas CCR2− macrophages were enriched in genes related to complement (e.g. C6, C2), chemokines (e.g. Ccl8, Ccl26) and phagocytic receptors (e.g. Clec10a, Cd209f) (Figure 1E, 1F, table S1). Pathway enrichment analysis demonstrated that CCR2+ DMs and HDMs were enriched in Gene Ontology terms related to inflammation and immune regulation, whereas CCR2− macrophages were enriched in terms related to the complement cascade and phagocytosis, the latter consistent with their vacuolated morphology (Figure S1D, S1E).
To further characterize the macrophages, single-cell RNA-seq (scRNA-seq) analysis was performed on sorted CD45+ immune cells from each layer (Figure S1F). Principal component and clustering analyses identified 12 dermal and 13 hypodermal immune cell clusters with distinct transcriptomic signatures that were subsequently visualized by Uniform Manifold Approximation and Projection (UMAP) plot (Figure 1G, 1H, table S1). In the dermis, lymphoid (Thy1, Cd3e, Il2rb) and myeloid (Spi1, Cd68, Fcgr2b) markers genes delineated four lymphoid and eight myeloid clusters (Figure 1G), each representing 41 and 59% of dermal immune cells, respectively, comparable to our flow cytometry observations (Figure S1G, 1A). In contrast to the dermis, and consistent with our flow cytometry analysis, majority of the hypodermal immune cells exhibited myeloid gene signatures with only one minor cluster expressing lymphoid markers, likely representing a mixture of T cells and innate lymphoid cells (Figure 1H, S1G).
Inferences on scRNA-seq cluster identities may be facilitated by leveraging reference transcriptomic datasets of bulk RNA-seq or microarrays from defined, sorted immune cell populations 21. We utilized the Immunological Genome (ImmGen) Project database 22 and found that genes for CD11c−CD11b+ macrophages were enriched in two dermal and five hypodermal clusters, as represented by expression of Cd63 and C1qa (Figure S1H, S1I). To further validate this, we utilized our flow-sorted myeloid cell bulk RNA-seq data (Figure 1B) to generate gene sets that broadly characterized DMs and HDMs, as compared with respective DC subsets (Figure 1I). When projected onto UMAP plots as enrichment scores, bulk RNA-seq macrophage gene sets highlighted two dermal and five hypodermal clusters, consistent with the ImmGen dataset enrichment scores (Figure 1I). Finally, flow cytometry revealed that marker genes that were unique to DMs (C5ar1, Cd63) and HDMs (Folr2, Lyve1) were expressed at the protein level (Figure S1J–M).
We further conducted differential gene expression analyses to define individual cluster characteristics. In the dermis, cluster 3 exhibited a transcriptomic signature comparable to sorted CCR2+ macrophages (e.g. Ccr2, Cd52, Lyz1, Ear2 and Il1b) while cluster 6 minimally expressed Ccr2 and was enriched in genes related to phagocytosis (e.g. Clec10a, Cd209f) and the complement system (e.g. C4b, Cfh), features that were comparable to sorted CCR2− macrophages (Figure 1J, 1E, table S1). Furthermore, bulk RNA-seq gene sets from sorted CCR2+ and CCR2− DMs were differentially enriched in DM cluster 3 and cluster 6, respectively (Figure 1K). Thus, the two DM clusters identified via scRNA-seq each correlated to CCR2+ and CCR2− DMs as defined by flow cytometry.
Interestingly, compared with the two HDM subsets that were distinguished via flow cytometry (Figure 1B), scRNA-seq analysis further segregated HDMs into five distinct clusters. Unsupervised heatmap of differentially expressed genes (DEG) revealed shared transcriptomic patterns between clusters 4, 5 and 7 including C1qb, Cd209f and C4b, which correlated with the sorted CCR2− HDM bulk RNA-seq transcriptome (Figure 1F, 1L, table S1). Clusters 2 and 9 were enriched in Ccr2, MHCII genes (H2-Ab1, H2-Eb1) and Cd52, thereby recapitulating features of sorted CCR2+ HDMs. Consistently, the gene set of sorted CCR2+ HDMs was enriched in hypodermal cluster 2 and 9, while the gene set of sorted CCR2− HDMs was enriched in cluster 4, 5 and 7 (Figure 1M). Thus, while the CCR2-based heterogeneity of macrophages was also conserved in the hypodermis, CCR2+ and CCR2− HDM populations were further segregated based on transcriptomic heterogeneity that may represent different activation states.
Collectively, combined flow-cytometry and sequencing approaches identified CCR2+ and CCR2− HDM subsets with transcriptomic heterogeneity under steady-state conditions.
Tissue residency and cytokine dependency of DMs and HDMs
To gain insight into potential biological differences between CCR2+ and CCR2− DMs and HDMs, tissue residency was investigated using a set of complementary techniques. First, bone marrow chimeric mice were generated by reconstituting lethally irradiated CD45.2 mice with bone marrow from CD45.1 mice. In contrast to the minimal replacement of epidermal LCs 23 more than 90% of the CCR2+ DMs and HDMs were replaced by donor-derived cells 8 weeks post-transplant (Figure 2A, S2A). Approximately 40 and 60% of CCR2− DMs and HDMs remained of host origin, respectively, demonstrating that CCR2− macrophages were more radioresistant than CCR2+ macrophages (Figure 2A, S2A).
Figure 2. CCR2+ and CCR2− macrophages have distinct tissue longevity and cytokine dependency.

(A) Percentage of donor derived (CD45.1+) or host derived (CD45.2+) cells within each skin layer of bone marrow chimeric mice 8 weeks after bone marrow transplantation. (B) Percentage of partner-derived cells in indicated cell populations of parabiotic mice analyzed by flow cytometry 8–10 weeks post-surgery. (C) GFP expression was triggered in somatic cells of R26-M2rtTAxCol1a1-tetO-H2B-GFP and its retention in indicated dermal and hypodermal cells was assessed by flow cytometry analysis at indicated times (top). Graphs represent GFP expression normalized to day 0, mean ± SD (bottom). (D to F) Numbers of CCR2+ and CCR2− DMs and HDMs assessed by flow cytometry analysis in indicated mouse genotype and from C57BL/6 mice injected or not with CSF1R blocking antibody (AFS98). (A to F) Data representative of 2 independent experiments (n=5–10 per group). (B, D-F) Each dot represents one mouse.
We further performed parabiosis experiments wherein CD45.1 and CD45.2 C57BL/6 mice were surgically conjoined to share blood circulation. Two months post-surgery, 30–50% of blood chimerism was achieved. Consistent with the kinetics observed in bone marrow chimeric mice, CCR2− DMs and HDMs were less dependent on circulating precursors as compared with CCR2+ DMs and HDMs (Figure 2B).
To further examine the longevity of macrophage subsets, we took advantage of R26-M2rtTAxCol1a1-tetO-H2B-GFP mice in which GFP expression can be switched on in all somatic cells by doxycycline and be monitored for GFP retention 24. After 6 days of oral doxycycline administration, GFP retention was monitored for 8 weeks (Figure 2C). CD11b+EpCAM−Ly6C+CD11c− monocytes lost GFP at 2 weeks and most CCR2+ DMs and HDMs lost GFP expression 8 weeks post-induction (Figure 2C, S2B). In contrast, the majority of CCR2− DMs and HDMs retained GFP expression at 8-weeks post-induction (Figure 2C, S2B). While it is possible that subtle differences in GFP stability may exist between myeloid cell subsets, these data demonstrated that CCR2+ DMs and HDMs were relatively short-lived, whereas CCR2− DMs and HDMs were long-lived. Collectively, these data supported that CCR2+ DMs and HDMs were of monocytic origin, whereas CCR2− DMs and HDMs represented RTMs of embryonic precursor origin 25. Indeed, CCR2+ DMs and HDMs, as identified by surrogate markers CLEC7A (Figure S2C) and MHC-II (Figure 1B), respectively in Ccr2−/− mice, displayed reliance on CCR2 in contrast to their CCR2− counterparts (Figure 2D).
Macrophages across various tissues crucially depend on CSF1R signaling 26. We first examined mice with heterozygous mutation for Csf1 (Csf1wt/op) because severe developmental defects are observed in homozygous Csf1op/op mice 27. Whereas CCR2+ and CCR2− DMs were decreased in number, respective HDM subsets remained unaffected (Figure 2E), possibly due to the relative abundance of Csf1 expression in the hypodermis (Figure S2D). Both CCR2+ and CCR2− HDMs expressed Csf1r and the administration of a CSF1R blocking antibody effectively depleted both DMs and HDMs (Figure S2E, 2F). These results demonstrated that whereas DM and HDM subsets differentially depended on CCR2, all skin macrophages critically relied on CSF1R signaling.
Maintenance of hypodermal macrophages relies on fibroblast-derived CSF1.
To further characterize the HDM niche, we sought to identify the cellular sources of CSF1. Lack of Csf1 expression by CD45+ immune cells suggested non-hematopoietic sources for this cytokine (Figure S2F). We therefore sorted CD45− stromal cells each from the dermis and hypodermis and performed scRNA-seq. Dermal and hypodermal cells each segregated into 14 clusters, which were annotated based on conventional markers (Figure 3A, 3B, S3A, table S2). Fibroblasts constituted the largest stromal population in both dermis and hypodermis, followed by endothelial cells (Figure 3A, 3B). Gene expression analysis revealed that Csf1 transcripts were enriched in fibroblasts and vascular endothelial cells in both layers, where fibroblasts represented the predominant Csf1-expressing subset in the hypodermis (Figure 3C, S3B).
Figure 3. Hypodermis-specific depletion of Csf1 abrogates hypodermal macrophages.

(A and B) UMAP plot of CD45− cells sorted from C57BL/6 mouse dermis and hypodermis. (C and D) Feature plots showing the expression of indicated genes in dermal and hypodermal non-immune cells. Endo: endothelial cells. (E) Flow cytometry analysis of YFP expression by endothelial and fibroblasts cells in indicated layers of Tek-Cre×ROSA-YFP (Cre+) or control (Cre−) mice. 2 independent experiments (n=4–6 per group). (F) Representative immunofluorescence staining for FOLR2 (red) and DAPI (white) in 8-week-old Csf1f/f and Csf1ΔTek mouse skins. Dashed lines delineate borders between panniculus carnosus and adventitia. Scale bar=50μm. (G) Quantification of macrophages per field of view in the adventitia of indicated mice. (H) CCR2+ and CCR2− macrophage numbers in hypodermis of indicated 8-week-old mice assessed by flow cytometry. (I) Flow cytometry analysis of macrophages in the hypodermis of indicated aged mice (left). Quantification of CD64+ macrophages (right). 2 independent experiments (n=7–14 per group). (J and K) Flow cytometry analysis of macrophages in the hypodermis of indicated mice at 8–10 weeks of age. Graphs depict hypodermal macrophage quantification. (L) Representative immunofluorescence microscopy as in (F) in indicated mice and adventitia macrophage quantification. (I, J, K) Gating strategy: CD45+CD11b+Ly-6C− CD11clow-hi. (G, H, J, K, L) Each dot represents one mouse. Data representative of 2 independent experiments (n=4–10 per group).
We then sought to generate mice in which Csf1 was ablated from the hypodermis, but not dermis. To identify a candidate Cre-driver gene, dermal and hypodermal CD45− single-cell datasets were merged and analyzed for DEGs (Figure S3C, S3D). This identified Tek, encoding the vascular marker Tie2 28,29 (Figure S3E, table S2). Tek expression was restricted to vascular endothelial cells in the dermis, but it was expressed by both fibroblasts and vascular endothelial cells in the hypodermis (Figure 3D, S3F). We generated Tek-Cre×ROSA-YFP mice, flow cytometry analysis of which revealed restriction of YFP expression to vascular endothelial cells (CD45−CD31+GP38−) in the dermis, while it was expressed by both vascular endothelial cells and fibroblasts (CD45− CD31−CD34+PDGFRα+) in the hypodermis (Figure 3E, S3G).
Thus, Tek-Cre×Csf1-floxed mice (Csf1ΔTek) were generated to ablate Csf1 from hypodermal stromal cells. Strikingly, immunofluorescence microscopy revealed eradication of HDMs in the hypodermal adventitia of Csf1ΔTek mice, as visualized by FOLR2 staining (Figure 3F and 3G). Flow cytometry analysis revealed that both CCR2+ and CCR2− HDMs were significantly reduced in Csf1ΔTek mice (Figure 3H), while DM and hypodermal DC numbers remained statistically insignificant (Figure S3H).
To assess the impact of CSF1 ablation during HDM ontogeny, flow cytometry analysis was conducted on the hypodermis during post-natal development. Tek-Cre promoter was confirmed to be active in both endothelial cells and fibroblasts four days after birth (P4) (Figure S3I). Interestingly, MHCII−CD64+ immature macrophages were detected in comparable numbers in Csf1ΔTek and littermate controls from P4 to 4 weeks after birth (Figure 3I), suggesting that CSF1 was not yet required during the seeding and maturation stages of HDMs. HDM numbers underwent robust increases in littermate controls post-4 weeks after birth, but those in Csf1ΔTek mice failed to expand (Figure 3I, S3J). These findings indicate that critical dependence of HDMs on CSF1 was established at later stages of mouse development.
Comparable HDM numbers in WT and Csf1ΔTek mice at 4-weeks after birth and the differential impact on DMs and HDMs in adult Csf1ΔTek mice pointed to the loss of local CSF1 (Figure 3H, 3I, S3H, S3J). Nevertheless, because Tek is expressed broadly in blood vessels 30 and in early hematopoietic progenitors 31 we utilized Cdh5-CreERT2 and Col1a2-CreERT2 mice to inducibly target endothelial cells and fibroblasts post-developmentally (Figure S3K, S3L). We generated Cdh5-CreERT2×Csf1-floxed (Csf1ΔCdh5-CreERT2) and Col1a2-CreERT2×Csf1-floxed (Csf1ΔCol1a2-CreERT2) mice and treated them tamoxifen during the 4th week of birth. Analysis 4 weeks later revealed that induced ablation of CSF1 from endothelial cells in Csf1ΔCdh5-CreERT2 mice did not affect HDM numbers (Figure 3J). Conversely, induced ablation of CSF1 from fibroblasts in Csf1ΔCol1a2-CreERT2 mice resulted in a significant decrease of HDMs (Figure 3K, 3L).
Collectively, these data demonstrated hypodermal fibroblasts to be the predominant source of CSF1, which was required for the post-developmental maintenance of HDMs.
Loss of macrophages in the hypodermis renders mice resistant to Staphylococcus aureus skin infection
Given that the hypodermis represents the primary site of infection in cellulitis, we examined the impact of HDM depletion in an experimental model of cellulitis induced by hypodermal injection of the MRSA strain USA300 in WT or Csf1ΔTek mice. Unexpectedly, despite the role of macrophages in host-protective immunity, Csf1ΔTek mice were highly protected from developing gross cellulitis phenotypes in contrast to WT mice, which developed erythema, abscesses with central ischemia at 24 hours post infection that progressed into eschars at 48 hours post-infection (Figure 4A). Assessment of cellulitis severity with a disease score (Table S3) validated that Csf1ΔTek mice developed smaller abscesses, less erythema intensities, less eschar formation, and harbored less S. aureus colony forming units in the skin (Figure 4B, S4A). Interestingly, S. aureus disseminated to the spleen in 30% of WT mice indicative of sepsis, whereas it was not detected from any of the Csf1ΔTek mice (Figure 4C). Overall, disease score was markedly decreased in Csf1ΔTek mice as compared to WT mice (Figure 4D).
Figure 4. Loss of macrophages in hypodermal adventitia confers resistance against S. aureus infection.

(A) Representative image of skin phenotype observed in Csf1f/f and Csf1ΔTek at indicated times post inoculation. Asterisks indicate the injection sites. Scale bar=0.5cm. (B-C) Disease parameters assessed in skin or spleen of indicated mice. (D) Disease score measured from Csf1f/f and Csf1ΔTek mice injected with S. aureus (E) Representative immunofluorescence staining for S. aureus (cyan) and collagen I (red) in adventitial sections from Csf1f/f and Csf1ΔTek mice at indicated time points after S. aureus injection. Scale bar=50μm. (F) Representative image of cutaneous phenotype in indicated mice injected with S. aureus and associated disease score. (G) Quantification of immune cell subsets as assessed by flow cytometry at indicated time points post S. aureus injection. ILCs: innate lymphoid cells. (H-I) Representative image of skin phenotype 24H post-S. aureus injection in indicated mice (top). Disease parameters assessed in skin (bottom). (B, D, F, H, I) Each dot represents one mouse. Data representative of 2 independent experiments (n=5–20 per group).
Evaluation of S. aureus dynamics at earlier time points via immunofluorescence microscopy revealed robust expansion of S. aureus in WT hypodermis at 1- to 3-hour time points leading to abscess formation at the 6-hour timepoint. However, S. aureus failed to expand in the hypodermis of Csf1ΔTek mice with smaller abscesses (Figure 4E), demonstrating that the attenuated cellulitis phenotype was due to the incapability of S. aureus to expand in HDM-deficient hypodermis. Consistent with their decreased numbers of HDMs (Figure 3L), Csf1ΔCol1a2-CreERT2 mice also exhibited attenuated cellulitis phenotype (Figure 4F).
To determine if the protective phenotype in Csf1ΔTek mice was due to enhanced immune responses against S. aureus, we immunophenotyped the hypodermis via flow cytometry. Most of the immune cell subset numbers were comparable between WT and Csf1ΔTek mice except for the slight increase in the numbers of infiltrating monocytes (Figure 4G, Figure S4B). Ccr2−/− mice infected with S. aureus neither showed exacerbated nor attenuated phenotype (Figure 4H), the former demonstrating that monocytes did not play host-protective roles against S. aureus infection, and that latter showing that the lack of monocyte-derived cells including CCR2+ HDMs did not confer protection against S. aureus infection.
Macrophages can facilitate infection of certain microbes by serving as reservoirs, including S. aureus 32. To exclude this possibility, we acutely depleted macrophages with a blocking antibody against CSF1R in C57BL/6 WT mice and subjected them to S. aureus infection. Whereas DMs and HDMs were effectively depleted (Figure S4C), it did not ameliorate cellulitis phenotype, indicating that short-term macrophage ablation does not facilitate S. aureus infection (Figure 4I).
Collectively, these results demonstrated that Csf1ΔTek and Csf1ΔCol1a2-CreERT2 mice were highly protected against hypodermal S. aureus infection in the long-term absence of HDMs. The lack of protection in Ccr2−/− mice suggested that depletion of “CCR2−”, but not “CCR2+” HDMs were responsible for the attenuated cellulitis phenotype.
Alteration of the extracellular matrix composition in the absence of hypodermal macrophages
The above findings led us to hypothesize that long-term HDM depletion might affect non-hematopoietic compartments of the hypodermal microenvironment that conferred protection against S. aureus infection. Because macrophages play important roles during tissue maintenance and repair throughout the body 33, we analyzed if the hypodermal extracellular matrix (ECM) was structurally affected by the absence of HDMs.
Morphological analysis in H&E sections revealed faint eosin staining in the hypodermal adventitia of Csf1ΔTek mice as compared with WT and Ccr2−/− mice, suggestive of structural changes in this layer (Figure S5A). Masson’s trichrome staining, which highlights collagens, revealed decreased staining in Csf1ΔTek mice, and visualization of the type I collagen network via immunofluorescence and ultrastructural analysis via transmission electron microscopy validated that the collagen network in the hypodermal adventitia consisted of thin collagen bundles (Figure 5A, 5B, S5B). In contrast, the collagen network in Ccr2−/− mice hypodermis was well-developed, with enhanced Masson’s trichrome staining and thickened collagen bundles, as observed by electron microscopy. These distinct results in Ccr2−/− and Csf1ΔTek mice suggested that CCR2+ and CCR2− HDMs played opposing roles, where they negatively or positively regulated the collagen network, respectively.
Figure 5. Loss of hypodermal macrophages leads to altered formation of the extracellular matrix.
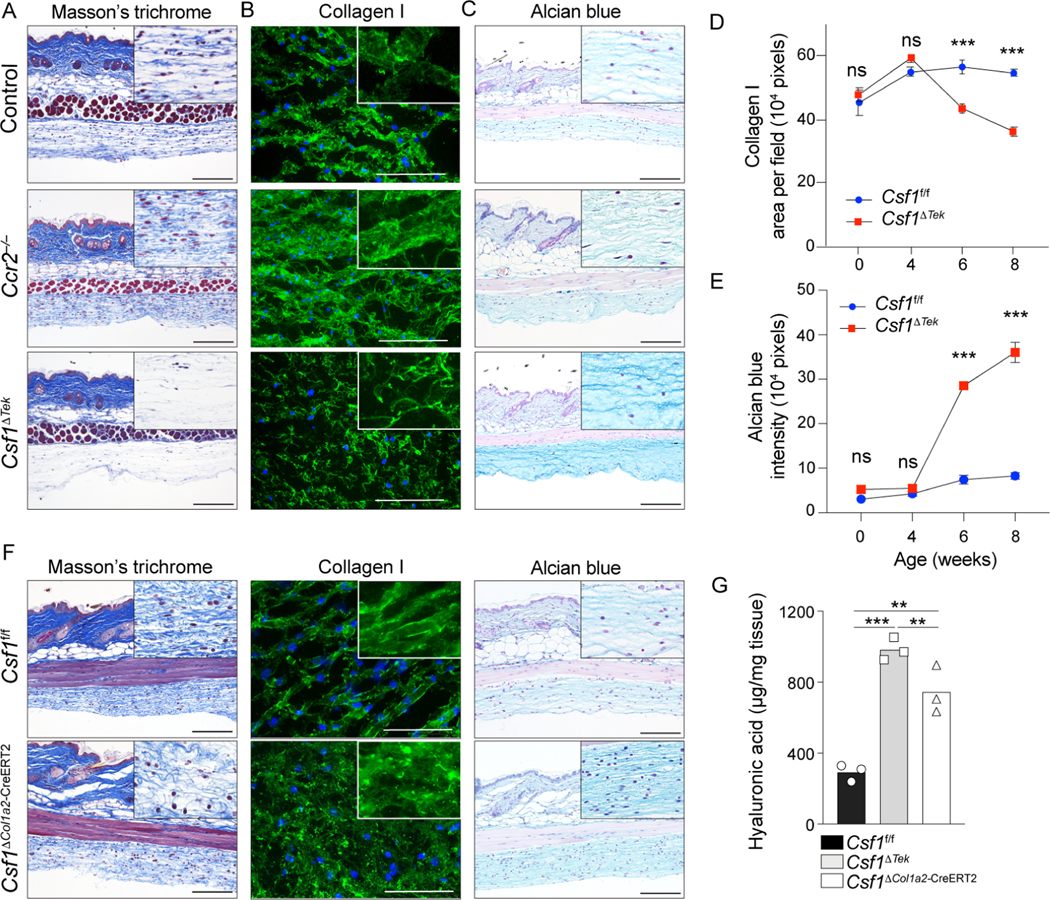
(A-C, F) Representative Masson’s Trichrome stain, alcian blue stain and immunofluorescence staining of collagen I on skin sections from indicated mice at 8-weeks of age. High magnifications of hypodermal adventitia are presented in upper corner. Scale bar=50μm. (D, E) Quantification of collagen I and alcian blue in the adventitia of indicated mice and time points. 2 independent experiments (n=5–6 per group). (G) Quantification of hyaluronic acid in the hypodermis of 8-week-old indicated mice assessed by ELISA on tissue lysates. Data representative of 2 independent experiment (n=3 per group).
We then performed alcian blue staining, which highlights hyaluronic acid when stained at pH2.5 34. This revealed accentuated staining in Csf1ΔTek mice, but not in Ccr2−/− mice, suggesting that hyaluronic acid accumulated in the absence of CCR2−, but not CCR2+ HDMs (Figure 5C).
Type I collagen and alcian blue staining during mouse development demonstrated that these ECM alterations in the hypodermis emerged in Csf1ΔTek mice between 4 and 6 weeks after birth (Figure 5D, 5E, S5C, S5D), correlating with the loss of HDMs (Figure 3I). Csf1ΔCol1a2-CreERT2 mice also displayed impaired collagen network and enhanced alcian blue staining, and enzyme-linked immunoassay on homogenized hypodermal tissue validated accumulation of hyaluronic acid in both Csf1ΔTek and Csf1ΔCol1a2-CreERT2 mice (Figure 5F, 5G). Furthermore, hyaluronic acid did not accumulate upon acute depletion of macrophage in anti-CSF1R antibody-treated mice (Figure S5E). Hypodermal fibroblasts sorted from Csf1f/f or Csf1ΔTek mice did not differentially express genes related to collagen or hyaluronic acid homeostasis, including genes encoding hyaluronidase and hyaluronic acid synthases (Figure S5F, S5G, S5H, S5I), excluding a secondary effect of HDM depletion on fibroblasts.
Thus, the long-term loss of HDMs in Csf1ΔTek and Csf1ΔCol1a2-CreERT2 mice resulted in altered ECM composition with impaired collagen network formation and accumulation of hyaluronic acid. The lack of hyaluronic acid accumulation in Ccr2−/− mice indicated that the CCR2− HDMs mediated homeostatic clearance of this ECM component.
Hyaluronic acid-mediated protection against S. aureus depends on macrophage-derived insulin-like growth factor I
To identify macrophage-derived molecule(s) that contributed to ECM homeostasis, we generated a ligand-receptor interaction map between hypodermal immune cells and stromal cells, with focus on ligands produced by macrophages and corresponding receptors (Figure 6A, Table S4). This identified 54 macrophage-derived ligands, 36 of which were genes involved in disulfide bond formation based on pathway analysis (Figure 6B, Table S4). We generated mice with conditional deletion of TGFβ1, a disintegrin and metalloproteinase (ADAM) 10, ADAM17, and IGF1 from Csf1r-expressing cells (Tgfb1ΔCsf1r, Adam10ΔCsf1r, Adam17ΔCsf1r, and Igf1ΔCsf1r mice), thereby targeting the myeloid cell lineage as confirmed in Csf1r-Cre×ROSA-YFP mice (Figure S6A). The mutant mice, as well as Mmp9−/− mice, were examined by immunofluorescence and alcian blue staining.
Figure 6. Hyaluronic acid deposition renders mice resistant to S. aureus skin infection.

(A) Ligand-receptor interaction map generated from single-cell analysis of hypodermal immune and stromal cells. The thickness of the lines is proportional to the number of ligand-receptor couple detected between two cell-types. Ligands expressed by macrophages interacting with fibroblast or macrophage receptors are represented by the red arrows. (B) Database for Annotation, Visualization and integrated Discovery pathway analysis performed on ligand genes expressed by hypodermal macrophages that have receptors expressed by hypodermal macrophages and fibroblasts. (C) Quantification of collagen I immunofluorescence staining in hypodermal adventitia of 8-week-old mice. Each dot represents one mouse. n=12 for control WT mice and n=2–4 for other indicated mice. (D) Quantification of alcian blue staining as in (C). n=3–5. (E) Quantification of hyaluronic acid in the hypodermis of 8-week-old indicated mice assessed by ELISA on tissue lysates. Data representative of 2 independent experiments (n=3 per group). (F) pathway analysis performed on ligand genes expressed by hypodermal macrophages that have receptors expressed by hypodermal macrophages and fibroblasts. (G) Disease score measured from indicated mice injected with S. aureus. (H) Optical density measurement of S. aureus growth in vitro in the absence (control) or presence of vancomycin or indicated concentrations of hyaluronic acid (HA, 500–750kDa). Each dot represents an independent S. aureus culture. Data representative of 2 independent experiments. (I) Representative images of cellulitis phenotype observed at 24H post-injection of S. aureus in C57BL/6 mice pre-treated with indicated agents. (G, I) Each dot represents one mouse. Data representative of 2 independent experiments (n=5 per group). (F, I) Scale bar=0.5cm.
Whereas both Adam10ΔCsf1r and Igf1ΔCsf1r mice displayed impaired collagen network, only Igf1ΔCsf1r mice exhibited increased alcian blue staining and hyaluronic acid deposition (Figure 6C–E), which mirrored ECM patterns observed in Csf1ΔTek and Csf1ΔCol1a2-CreERT2 mice. Although Csf1r-Cre driver line targeted both macrophages and DCs, Igf1 expression was restricted to HDMs (Figure S6B). Furthermore, the disparate accumulation of hyaluronic acid in Adam10ΔCsf1r and Igf1ΔCsf1r mice provided the opportunity to determine the relative importance of collagen network disruption and hyaluronic acid accumulation in playing protective roles against S. aureus infection.
Challenging mice with S. aureus, revealed attenuated cellulitis phenotype in Igf1ΔCsf1r mice that was comparable to that of Csf1ΔCol1a2-CreERT2 mice (Figure 6F, 6G, S6C, S6D). Adam10ΔCsf1r mice showed a slightly attenuated phenotype as compared to WT mice, but their disease score was higher than those of Csf1ΔTek, Csf1ΔCol1a2-CreERT2, and Igf1 ΔCsf1r mice.
These data, taken together with those from acute depletion of macrophages, which had no impact on cellulitis or ECM composition (Figure 4I, Figure S5G), pointed to the accumulation of hyaluronic acid to be the main protective factor against S. aureus infection. We therefore examined if hyaluronic acid possessed anti-bacterial capacity. Hyaluronic acid did not display bactericidal activity in a diffusion disk-based assay (Figure S6E). However, co-culturing S. aureus with hyaluronic acid revealed that it possessed bacteriostatic activity in a concentration-dependent manner (Figure 6H). Furthermore, pre-treatment of mice with two clinical grade hyaluronic acid of different molecular weights mitigated cellulitis phenotype (Figure 6I, S6F, S6G), without triggering any immune cell infiltration (Figure S6H), demonstrating that HA suppressed S. aureus proliferation in vitro and infection in vivo, respectively.
Taken together, CCR2− HDMs were responsible for the homeostatic clearance of hyaluronic acid from the hypodermal adventitia in an IGF1-dependent manner, the ablation of which led to hyaluronic acid accumulation that mitigated S. aureus infection.
Cell-autonomous IGF1 tunes macrophage functions
Clearance of hyaluronic acid relies on receptor-mediated endocytosis via LYVE-1 and CD44, which has been established in lymphatic endothelial cells 35,36. While macrophages express both LYVE-1 and CD44 8,37,38, it is unknown if they utilize these hyaluronic acid receptors to modulate the ECM.
Flow cytometry and immunofluorescence microscopy revealed that Igf1-deficient HDMs from Igf1ΔCsf1r mice expressed lower protein levels of LYVE-1, but not CD44, as compared to WT HDMs (Figure 7A, 7B). Incubation of sorted HDMs with recombinant IGF1 (rIGF1) normalized LYVE-1 expression in Igf1-deficient HDMs, indicating that LYVE-1 expression was positively regulated by IGF1 (Figure 7C, Figure S7A). In line with these observations, Igf1-deficient HDMs displayed impaired ability to take up fluorescein-conjugated hyaluronic acid (HA-FITC), which was rescued by rIGF1 in a concentration dependent manner (Figure 7D, Figure S7B). Impairment of HA-FITC uptake by Igf1-deficient HDMs was observed irrespective of hyaluronic acid molecular weight (Figure S7C). HA-FITC uptake by HDMs was effectively inhibited ex vivo with LYVE-1 blocking antibody validating that HA was taken up by HDMs via LYVE-1 (Figures 7E and S7D). LYVE-1 blockage did not trigger any signaling cascades in macrophages (Figure S7E), excluding a secondary effect on macrophage function. These data demonstrated that HDMs relied on cell-autonomous IGF1 to promote LYVE-1 expression, thereby sensing HA for uptake.
Figure 7. Cell-autonomous production of IGF1 by hypodermal macrophage regulates hyaluronic acid deposition.

(A) Representative flow cytometry analysis of LYVE-1 expression on hypodermal macrophages in indicated mouse genotype (top). Graph shows quantification of LYVE-1 expression (bottom). n=3 per group. (B) Representative immunofluorescence staining for LYVE-1 (green), FOLR2 (red) and DAPI (blue) in adventitia of indicated mice. Graph shows quantification of LYVE-1 fluorescence in macrophages. n=12 per group. Scale bar=150μm. (C) Quantification of LYVE-1 immunofluorescence staining on macrophages isolated from hypodermis of indicated mice after 24 hours of culture with indicated concentrations of recombinant IGF1. (D, E) Quantification of FITC-coupled hyaluronic acid uptake by macrophages isolated from hypodermis of indicated mice after 24 hours of culture with indicated concentrations of recombinant IGF1 or anti-LYVE-1 blocking antibody. (F) Representative western-blot images of indicated proteins in isolated hypodermal macrophages from indicated mice upon stimulation with recombinant IGF1. (G) HDMs isolated from the adventitia of indicated mice and their expression of LYVE-1 as assessed by immunofluorescence staining after treating with indicated inhibitors. (H) UMAP of unsupervised clustering analysis from scATAC-seq performed on adventitia macrophages from Igf1ΔCsf1r or control mice. (I) Coverage plot depicting Lyve1 chromatin accessibility in macrophage cluster 1 of indicated mouse genotypes. Peak with differential expression is highlighted by dashed lines. (J) Heatmap displaying relative enrichment of transcription factor motifs in Igf1f/f and Igf1ΔCsf1r HDMs with selected transcription factors depicted on the right. Transcription factor motifs were classified into 3 groups (I-III) based on the enrichment pattern between Igf1f/f and Igf1ΔCsf1r HDMs. (K) Metascape pathway analysis on Group I to III transcription factors from (J). (L) LYVE-1 expression in C57BL/6 HDMs as measured by immunofluorescence staining after incubation with indicated AP-1 inhibitors. (A, B) Each dot represents one mouse. (C, D, E, L) Each dot represents one well. HA: hyaluronic acid, rIGF1: recombinant IGF1. Scale bar=50μm. (C, D, E, G, L) Data representative of 2 independent experiments (n=3–5 per group).
IGF1 receptor (IGF1R) signaling is mediated by AKT and MAP kinase pathways, the latter further mediated by MEK-ERK1/2 axis or p38 39. Incubation with rIGF1 led to the phosphorylation of AKT and ERK1/2 in both WT and Igf1-deficient HDMs, indicating that IGF1R signaling indeed takes place in HDMs. p38 was active at baseline, the phosphorylation of which was minimally enhanced by rIGF1 (Figure 7F).
To determine which pathway was responsible for enhancing LYVE-1 expression, sorted WT and Igf1-deficient HDMs were treated with inhibitors for AKT, MEK or both. This revealed MEK-inhibition to be more efficacious in suppressing LYVE-1 expression than AKT inhibition, the combination which did not further repress LYVE-1 expression in the presence or absence of rIGF1 (Figure 7G). These results demonstrated that MAPK signaling mediated the expression of LYVE-1 downstream of IGF1R signaling.
We then performed single-cell assay for transposase-accessible chromatin sequencing (scATAC-seq) on sorted WT and IGF1-deficient HDMs to explore the impact of cell autonomous IGF1 on HDM epigenetic and transcription factor regulatory circuits. Differential chromatin accessibility grouped HDMs into 6 distinct clusters (Figure 7H, S7F, Table S5). Clusters 0, 1 and 5 displayed less chromatin accessibility in Ccr2, relative to clusters 2 to 4 (Figure S7G). All, but cluster 5 showed clear peaks for Igf1 (Figure S7H). These patterns suggested clusters 0 and 1 to represent CCR2− HDMs, and clusters 2 to 4 to represent CCR2+ HDMs, with cluster 5 showing a distinct profile. All clusters displayed chromatin accessibility in Lyve1 with some differential peaks within the promoter and exon regions (Figure S7I). No major differences in Lyve1 accessibility were observed between WT and Igf1-deficient HDMs except for cluster 1, which showed slightly decreased accessibility in Lyve1 proximal enhancer region (Figure 7I, table S5). More strikingly, 46 transcription factor (TF) motifs in Igf1ΔCsf1r HDMs showed decreased accessibility indicating alteration of TF activities in the absence of cell autonomous IGF1 (Figure 7J, Table S5). These TF motifs were segregated into three distinct groups. Group I motifs dysregulated across all clusters, were associated with decreased TF activities including JUN, FOS and ATF3, which function downstream of MAPK pathways (Figure 7J and 7K). Group II motifs were underrepresented in Igf1ΔCsf1r HDM clusters 2 to 4 and reflected decreased activity of TFs involved in TGFβ signaling (SMAD2 and SMAD3) and MAPK signaling (BATF, JUNB, JUND) pathways (Figure 7J, 7K, S7J). Finally, decreased enrichment of group III TF motifs in Igf1ΔCsf1r HDMs from cluster 5 suggested altered biological processes such as circadian rhythm (e.g. ARNTL, MYC), pointing to the unique characteristics of this cluster. Interestingly, TFs associated with group I and II motifs overlapped with TFs that have predicted control over Lyve1 (Figure S7K). These TFs included the components of the AP-1 TF complex, Jun, Fos and Atf3 40. Accordingly, ex vivo inhibition of AP-1 resulted in reduced LYVE1 expression on HDMs (Figure 7L).
Collectively, these results demonstrated that HDMs tune their functions through cell autonomous IGF1. IGF triggers MAPK signaling cascades and recruits TFs including AP-1 that promotes LYVE-1 expression, thereby enabling the clearance of hyaluronic acid from the hypodermal adventitia. While this homeostatic clearance of hyaluronic acid by HDMs maintains ECM integrity, it promotes host-susceptibility to S. aureus infection in the context of cellulitis.
DISCUSSION
Beyond their conventional immunological functions, research in the recent years have established macrophages as crucial players in tissue homeostasis and repair 41. Tissue-derived cues support the residency and shape the functions of macrophages to fulfill the specific needs of the tissue that they reside in 42. While such tissue-specific cues remain to be determined during homeostasis or inflammation, a common feature for macrophage homeostasis across different tissues is their dependencies on CSF family cytokines or CSF1R ligands produced by surrounding micro-environment. Epidermal LCs and microglia in the brain critically depend on keratinocyte- or neuronal cells-derived IL-34, respectively, whereas alveolar macrophages depend on IL-34 and CSF2 42,43. CSF1R-deficiency eradicates macrophages, and the injection of CSF1 into Csf1op/op mice rescues macrophages across multiple organs 44–46. In these tissues, the homeostasis of macrophage subsets relies on CSF1 derived from various stromal cells including osteoblasts, hepatic stellate cells and endothelial cells. In the skin, we found fibroblasts and endothelial cells to express Csf1, and the induced ablation of CSF1 from Tek or Col1a2-expressing cells abrogated HDMs, demonstrating the hypodermal fibroblasts to be major sources of CSF1 thereby providing niches for both CCR2+ and CCR2− HDMs.
The non-redundant roles of RTMs and monocyte-derived macrophages are only beginning to be understood. In general, RTMs are non-inflammatory, phagocytic cells that clear debris and pathogens from tissues, whereas monocyte-derived macrophages are biased towards promoting inflammation 47. Our studies on DM and HDM kinetics during the steady state suggested that CCR2− and CCR2+ each represented RTMs and monocyte-derived macrophages, respectively. However, distinction by CCR2 expression is sometimes not clear as monocytes may also give rise to RTMs under certain circumstances 48–50. Our data further revealed differential roles of CCR2+ and CCR2− HDMs in the regulation of ECM. Long-term loss of CCR2+ and CCR2− HDMs in Csf1ΔTek and Csf1ΔCol1a2-CreERT mice resulted in the accumulation of the key ECM components, hyaluronic acid, which was not observed in Ccr2−/− mice that lack CCR2+ HDMs, indicating that hyaluronic acid deposition was due to the loss of CCR2− HDMs. Interestingly, we also observed differential formation of the collagen network. In contrast to Csf1ΔTek and Csf1ΔCol1a2-CreERT mice that displayed decreased network of large-bundle collagens, Ccr2−/− mice collagen network was well-developed, even more so than WT mice. These data suggested that CCR2+ and CCR2− HDMs have opposing roles in collagen network homeostasis, where CCR2+ HDMs may be required for degradation of the collagen network and CCR2− HDMs may contribute to the formation of collagen network.
IGF1R signaling has been reported to shape macrophage functions. Deletion of IGF1R in LysM-Cre×Igf1r-floxed (Igf1rΔLyzm) mice exacerbates atherosclerosis in the Apoe−/− background 51. Similarly, Sparado et al reported that high-fat diet in Igf1rΔLyzm mice lead to insulin-resistance and that macrophages fail to undergo M2-like states upon helminth infection. They also reported that macrophages expressed Igf1, suggesting that cell-autonomous IGF1R signaling could shape macrophages functions 52. By determining HDM expression of Igf1 and Igf1r via scRNAseq, we extended these findings by deleting Igf1 from myeloid cells in Igf1ΔCsf1r mice, thereby enabling us to directly study the impact of cell-autonomous IGF1. scATAC-seq revealed that HDMs displayed decreased chromatin accessibility of various TF motifs that are involved in multiple cellular processes. These data indicated that HDMs tune their functions via cell-autonomous IGF1R signaling, including the clearance of hyaluronic acid via LYVE-1, which was mediated by the TF complex AP-1, downstream of IGF1R-MAPK signaling cascade. Future studies might address what upstream signals regulate the expression of IGF1 in macrophages.
Streptococcus and Staphylococcus species are major pathogens in cellulitis with S. aureus being the commonest isolated pathogen 53,54. S. aureus invades the skin through minor barrier breaches and may cause life-threatening conditions such as sepsis, depending on various risk factors such as the immune status of the host, age, and obesity 54. Despite the established host-protective roles of dermal macrophages in S. aureus infection 55, we unexpectedly found that the loss of HDMs and macrophage cell-autonomous IGF1 led to the protection of mice from hypodermal S. aureus infection. This effect was due to the accumulation of hyaluronic acid in the absence of HDMs and their altered function as orchestrators of the ECM maintenance in the absence of cell-autonomous IGF1. Hyaluronic acid is a large glycosaminoglycan that is abundant in mammalian tissues including the skin and whose antibacterial properties have been demonstrated in vitro on multiple bacterial strains under their planktonic form 56,57. Our data highlighted the bacteriostatic activity of hyaluronic acid against S. aureus in vitro and further demonstrated its capacity to suppress S. aureus expansion in vivo. The effect of IGF1 loss was unclear in the dermis of Igf1ΔCsf1r, which may reflect differential ECM-modulating activities of DMs and HDMs in the dermis and hypodermis. Our findings highlight that tissue-specialized functions of macrophages, particularly in deep soft tissues, might be detrimental to the host upon infection.
In conclusion, we have provided a comprehensive landscape of the immune cells in the hypodermis, with particular focus on the biology, transcriptomic and functional characters of the HDMs. Our study highlighted that resident HDMs mediate homeostatic clearance of hyaluronic acid, which provided an opportunity for S. aureus to hijack the tissue to establish infection. The remarkable resistance of mice that lacked HDMs or IGF1 in these cells provides foundation for establishing novel therapeutic strategies against soft-tissue infections, and the IGF1R signaling in macrophages may be targeted to tune macrophage functions not only infectious diseases but also in other conditions including cancer.
LIMITATION OF THE STUDY
This study uses a single strain of MRSA, USA300, as a model for S. aureus skin infection. Globalization of our findings in the context of cellulitis may require the use of Streptococcus and other Staphylococcus strains. Although myeloid cells were the major cell type that are targeted in the hypodermis in Csf1r-Cre mice, its specificity is not limited to macrophages and may impact dendritic cells as well as some lymphoid lineages in other tissues. At present, there are no mouse models that specifically targets RTMs in a given tissue, which awaits development. The detrimental function of HDM-mediated hyaluronic clearance in S. aureus infection will need further investigation to determine whether this phenomenon is hypodermis-specific or if it can be generalized to soft-tissue infections in other organs. Finally, the molecular weight of hyaluronic acid in vivo is present in a broader range than those that were used experimentally. It is possible that hyaluronic acid in higher or lower molecular weights are differentially taken up by HDMs, or have distinct bacteriostatic activities.
STAR METHODS
RESSOURCE AVAILABILITY
Lead contact
Further information and requests for resources and reagents should be directed to and will be fulfilled by the lead contact, Keisuke Nagao (keisuke.nagao@nih.gov).
Materials availability
This study did not generate new unique reagents.
Data and code availability
The accession number for the RNA-seq, scRNA-seq and scATAC-seq data will be provided before publication.
EXPERIMENTAL MODEL AND STUDY PARTICIPANT DETAILS
Mouse strains
The mice were purchased from the Jackson Laboratory or provided by other sources as detailed in the Key Resources Table. The Csf1-floxed mice were generated as previously described 58. The following crossbreeds were generated: Csf1r-Cre×Tgfb1fl/fl (Tgfb1ΔCsf1r), Tek-Cre×Csf1fl/fl (Csf1ΔTek), Tek-Cre×ROSA-YFP, Csf1r-Cre×Adam17fl/fl (Adam17ΔCsf1r), Csf1r-Cre×Adam10fl/fl (Adam10ΔCsf1r), Cdh5-CreERT2×ROSA-YFP, Col1a2-CreERT2×ROSA-YFP, Cdh5-CreERT2×Csf1fl/fl (Csf1ΔCdh5-CreERT2), Col1a2-CreERT2×Csf1fl/fl (Csf1ΔCol1a2-CreERT2), Csf1r-Cre×ROSA-YFP, Csf1r-Cre×Igf1fl/fl (Igf1ΔCsf1r), R26-M2rtTA x tetO-H2B-GFP. All mice were bred and maintained according to the Guide for the Care and Use of Laboratory Animals in specific pathogen-free and ABSL-2 facilities of the National Cancer Institute (NCI) and the National Institute of Arthritis and Musculoskeletal and Skin Diseases (NIAMS). All experiments were performed under animal study protocols that were approved by the Animal Care and Use Committees of NCI and NIAMS. Unless otherwise indicated, mice between 8 and 12 weeks of age were used for experiments.
Key resources table
| REAGENT or RESOURCE | SOURCE | IDENTIFIER |
|---|---|---|
| Antibodies | ||
| LEAF Purified anti-mouse CD16/32 | BioLegend | Cat# 101310; RRID:AB_2103871 |
| BUV395 Rat Anti-Mouse CD45 | BD Biosciences | Cat# 564279; RRID:AB_2651134 |
| FITC anti-mouse CD90.2 (Thy-1.2) | BioLegend | Cat# 140309; RRID:AB_10645336 |
| BV421 anti-mouse CD45 | BioLegend | Cat# 103134; RRID:AB_2562559 |
| BV650 anti-mouse CD45.1 | BioLegend | Cat# 110736; RRID:AB_2562564 |
| BUV395 anti-Mouse CD45.2 | BD Biosciences | Cat# 564616; RRID:AB_2738867 |
| FITC anti-mouse Ly6C | BioLegend | Cat# 128006; RRID:AB_1186135 |
| BV711 anti-mouse Ly6C | BioLegend | Cat# 128037; RRID:AB_2562630 |
| APC-Cy7 anti-mouse Ly6G | BioLegend | Cat# 127623; RRID:AB_10645331 |
| BV421 anti-mouse CD11b | BioLegend | Cat# 101251; RRID:AB_2562904 |
| APC anti-mouse CD11b | BioLegend | Cat# 101212; RRID:AB_312795 |
| BV650 anti-mouse CD11c | BioLegend | Cat# 117339; RRID:AB_2562414 |
| PE-Cy7 anti-mouse CD11c | BioLegend | Cat# 117318; RRID:AB_493568 |
| BV711 anti-mouse I-A/I-E | BD Biosciences | Cat# 563414; RRID:AB_2738191 |
| PE-Cy7 anti-mouse I-A/I-E | BioLegend | Cat# 107630; RRID:AB_2069376 |
| APC-Cy7 anti-mouse EpCAM | BioLegend | Cat# 118218; RRID:AB_2098648 |
| PE anti-mouse CD64 | BioLegend | Cat# 139304; RRID:AB_10612740 |
| PE/Dazzle 594 anti-mouse CD64 | BioLegend | Cat# 139320; RRID:AB_2566559 |
| PE anti-mouse CCR2 | R&D System | Cat# FAB5538P; RRID:AB_10718414 |
| Purified anti-mouse FOLR2 | BioLegend | Cat# 153302; RRID:AB_2687271 |
| PE/Dazzle 594 anti-mouse CD369 (CLEC7A) | Thermo Fisher Scientific | Cat# 25-5859-80; RRID:AB_2573479 |
| PerCP/Cy5.5 anti-mouse Ly-6A/E (Sca-1) | BioLegend | Cat# 108126; RRID:AB_10645327 |
| BV421 anti-mouse CD34 | BD Biosciences | Cat# 562608; RRID:AB_11154576 |
| APC anti-mouse CD31 | BioLegend | Cat# 102509; RRID:AB_312916 |
| PE anti-mouse Podoplanin (GP38) | Thermo Fisher Scientific | Cat# 12-5381-82; RRID:AB_1907439 |
| PE-Cy7 anti-mouse PDGFRa | Thermo Fisher Scientific | Cat# 25-1401-82; RRID:AB_2573400 |
| APC anti-mouse CD88 (C5aR) | BioLegend | Cat# 135808; RRID:AB_10899415 |
| APC anti-mouse CD63 | BioLegend | Cat# 143905; RRID:AB_2565495 |
| Purified anti-mouse Collagen I | Abcam | Cat# ab21286; RRID:AB_446161 |
| Purified anti-Staphylococcus aureus | Abcam | Cat# ab37644; RRID:AB_778082 |
| Alexa-568 Goat anti-Rabbit IgG | Abcam | Cat# ab175471; RRID:AB_2576207 |
| Alexa-488 Goat anti-Mouse IgG3 | Thermo Fisher Scientific | Cat# A21151; RRID:AB_2535784 |
| anti-mouse Lyve-1 AF488 | Thermo Fisher Scientific | Cat# 53-0443-82; RRID:AB_1633415 |
| PE/Cy7 anti-mouse CD44 | Biolegend | Cat# 103030; RRID:AB_830787 |
| Purified anti-mouse Lyve-1 | R&D System | Cat# MAB2125; RRID:AB_2138528 |
| Rat IgG2a isotype Control | R&D System | Cat #MAB006; RRID:AB_357349 |
| Invivo Mab anti-mouse CSF1R | BioXCell | Cat# BE0213; RRID:AB_2687699 |
| Invivo Mab rat IgG2a isotype Control | BioXCell | Cat#BE0089; RRID:AB_1107769 |
| Mouse anti-p44.42 MAPK (ERK1/2) | Cell Signaling | Cat# 4696; RRID:AB_390780 |
| Rabbit anti-phospho-p44/42 MAPK (ERK1/2) | Cell Signaling | Cat# 9101; RRID:AB_331646 |
| Rabbit anti-AKT | Cell Signaling | Cat# 4691; RRID:AB_915783 |
| Rabbit anti-phospho-AKT | Cell Signaling | Cat# 4060; RRID:AB_2315049 |
| Rabbit anti-p38 | Cell Signaling | Cat# 8690; RRID:AB_10999090 |
| Rabbit anti-phospho-p38 | Cell Signaling | Cat# 9211; RRID:AB_331641 |
| Rabbit anti-p65 | Cell Signaling | Cat#8242; RRID:AB_10859369 |
| Rabbit anti-phospho-p65 | Cell Signaling | Cat#3033; RRID:AB_331284 |
| HRP goat anti-rabbit | Jackson ImmunoResearch | Cat# 111-035-144; RRID:AB_2307391 |
| HRP goat anti-mouse | Jackson ImmunoResearch | Cat# 115-035-003; RRID:AB_10015289 |
| HRP mouse anti-vinculin | Santa Cruz | Cat# sc-73614; RRID:AB_1131294 |
| Bacterial and virus strains | ||
| USA300-LAC | Gift from Heidi Kong | N/A |
| Chemicals, peptides, and recombinant proteins | ||
| Trypsin-EDTA (0.05%) | GIBCO | Cat# 25300054 |
| Trypsin-EDTA (0.25%) | GIBCO | Cat# 25200056 |
| RPMI 1640 Medium | GIBCO | Cat# 11875-093 |
| RPMI 1640 Medium (without phenol red) | GIBCO | Cat# 11835-030 |
| Fetal Bovine Serum | BenchMark™ | Cat# 100-106 |
| Penicillin-Streptomycin | Thermo Fisher Scientific | Cat# 15070063 |
| Liberase T-Flex Research Grade | ROCHE | Cat# 05989132001 |
| Deoxyribonuclease I from bovine pancreas | Sigma-Aldrich | Cat# DN25-1G |
| 0.5M EDTA pH 8 | KD Medical | Cat# RGF-3130 |
| Zombie Aqua Fixable Viability Kit | Biolegend | Cat# 423101 |
| Tamoxifen | Sigma-Aldrich | Cat# T5648 |
| SYTOX Red Dead Cell Stain, for 633 or 635 nm excitation | Thermo Fisher Scientific | Cat# S34859 |
| Hyaluronic acid Mol. wt. 500-750KDa | Sigma | Cat# 75574-10mg |
| Fluorescein Hyaluronic acid (800kDa) | Sigma | Cat# F1177 |
| Hyalurate Fluorescein (MW 250kDa) | HAWORKS | Cat# HA-FITC-250kDa |
| Hyalurate Fluorescein (MW 1500kDa) | HAWORKS | Cat# HA-FITC-1500kDa |
| Hyaluronic acid (Hyalgan®) | Fidia Pharma | Cat# 89122-0724-20 |
| Hyaluronic acid (Orthovisc®) | DePuy Synthes | Cat#277500 |
| Akt Inhibitor (MK-22062HCL) | Shelleckchem | Cat# S1078 |
| MEK inhibitor (U0126) | Promega | Cat# V1121 |
| Recombinant mouse IGF1 | R&D Systems | Cat# 791-MG-050 |
| AP-1 inhibitor (SR11302) | R&D Systems | Cat# 2476/10 |
| AP-1 inhibitor (T-5224) | Shelleckchem | Cat# S8966 |
| Fluorofix buffer | BioLegend | Cat# 422101 |
| TRIzol LS | Thermofisher scientific | Cat# 10296028 |
| Beta-mercaptoethanol | GIBCO | Cat# 21985023 |
| SuperScript IV VILO Master Mix with ezDNase Enzyme | Thermo Fisher Scientific | Cat# 11766050 |
| Fast SYBR Green Master Mix | Thermo Fisher Scientific | Cat# 4385612 |
| Bacto™ Agar | BD Biosciences | Cat# 214010 |
| Tryptic Soy Broth | Sigma | Cat# 22092-500G |
| Hardy Blank Disk 0.25 inch | Hardy Diagnostics | Cat# Z7121 |
| FluroBrite DMEM | GIBCO | Cat# A18967-01 |
| Dimethyl sulfoxide | Sigma | Cat# D2650 |
| Formalin | Sigma | Cat# F5554-4L |
| ProLong Gold Antifade Mountant with DAPI | Thermo Fisher Scientific | Cat# P36931 |
| Anti-Phycoerythrin Beads | Milteny Biotec | Cat# 130-048-801 |
| RIPA Buffer (10X) | Cell Signaling Technology | Cat# 9806 |
| Protease/Phosphatase Inhibitor Cocktail (100X) | Cell Signaling Technology | Cat# 5872S |
| NuPAGE Sample Reducing Agent (10X) | Invitrogen | Cat# NP0009 |
| NuPAGE LDS Sample Buffer (4X) | Invitrogen | Cat# NP0007 |
| Precision Plus Protein Dual Color Standard | Bio-Rad | Cat# 1610374 |
| Trans-Blot Turbo RTA Midi PVDF Transfer Kit | Bio-Rad | Cat# 1704275 |
| 4-20% Criterion™ TGX™ Precast Midi Protein Gel | Bio-Rad | Cat# 5671094 |
| 10X Tris/Glycine/SDS Buffer | Bio-Rad | Cat# 1610772 |
| Pierce ECL Western Blotting Substrate | Thermo Fisher Scientific | Cat# 32106 |
| Nonfat dry Milk | Cell Signaling Technology | Cat# 9999S |
| Pierce 20X TBS Tween™ 20 Buffer | Thermo Fisher Scientific | Cat# 28360 |
| Restore™ PLUS Western Blot Stripping Buffer | Thermo Fisher Scientific | Cat# 46430 |
| Vancomycin | Merck | Cat# 1709007 |
| Critical commercial assays | ||
| Hyaluronan Quantikine Solid Phase sanwich ELISA Kit | R&D Systems | Cat# DHYAL0 |
| Chromium Single Cell 3' Reagent Kit (v2 Chemistry) | 10X Genomics | Cat# 120237 |
| RNeasy Plus Mini Kit | QIAGEN | Cat# 74134 |
| Single Cell Multiome ATAC | 10X Genomics | Cat# 1000283 |
| Deposited data | ||
| RNA-seq data | This paper | GSE228445 (GSE227758 & GSE228443) |
| scRNA-seq datasets | This paper | GSE228445 (GSE228018) |
| scATAC-seq datasets | This paper | GSE228445 (GSE227859) |
| Experimental models: Organisms/strains | ||
| Mouse: C57BL/6J | Jackson Laboratory | Cat# 000664; RRID:IMSR_JAX:000664 |
| Mouse: C57BL/6-Tg(Csf1r-cre)1Mnz/J (Csf1r-Cre) | Jackson Laboratory | Cat# 029206; RRID:IMSR_JAX:029206 |
| Mouse: B6.129X1-Gt(ROSA)26Sortm1(EYFP)Cos/J (Rosa-YFP) | Jackson Laboratory | Cat# 006148; RRID:IMSR_JAX:006148 |
| Mouse: Csf1-floxed | Gift from Sherry Abboud Werner | N/A |
| Mouse: B6.SJL-Ptprca Pepcb/BoyJ (CD45.1) | Jackson Laboratory | Cat# 002014; RRID:IMSR_JAX:002014 |
| Mouse: B6.129S4-Ccr2tm1Ifc/J (Ccr2-/-) | Jackson Laboratory | Cat# 004999; RRID:IMSR_JAX:004999 |
| Mouse: B6;C3Fe a/a-Csf1op/J (Csf1-op) | Jackson Laboratory | Cat# 000231; RRID:IMSR_JAX:000231 |
| Mouse: Tg(tetO-HIST1H2BJ/GFP)47Efu/J
(tetO-H2B-GFP) |
Jackson Laboratory | Cat# 005104 RRID:IMSR_JAX:005104 |
| Mouse: B6.Cg-Gt(ROSA)26Sortm1(rtTA*M2)Jae/J (R26-M2rtTA) | Jackson Laboratory | Cat# 006965 RRID:IMSR_JAX:006965 |
| Mouse: Tgfb1tm2.1Doe/J (Tgfb1-floxed) | Jackson Laboratory | Cat# 010721; RRID:IMSR_JAX:010721 |
| Mouse: B6.Cg-Tg(Tek-cre)1Ywa/J (Tek-Cre) | Jackson Laboratory | Cat# 008863; RRID:IMSR_JAX:008863 |
| Mouse: Cdh5(PAC)-CreERT2 (Cdh5-CreERT2) | Gift from Yoshiaki Kubota, Keio university | N/A |
| Mouse: B6.Cg-Tg(Col1a2-cre/ERT,-ALPP)7Cpd/2J
(Col1a2-CreERT2) |
Jackson Laboratory | Cat# 029567; RRID:IMSR_JAX:029567 |
| Mouse: B6.129(FVB)-Igf1tm1Dlr/J (Igf1-floxed) | Jackson Laboratory | Cat# 016831; RRID:IMSR_JAX:016831 |
| Mouse: Adam10-floxed | Keio University, Japan | N/A |
| Mouse: Adam17-floxed | Jackson Laboratory | Cat # 009597; RRID:IMSR_JAX:009597 |
| Mouse: B6.FVB(Cg)-Mmp9tm1Tvu/J (Mmp9-/-) | Jackson Laboratory | Cat# 007084; RRID:IMSR_JAX:007084 |
| Oligonucleotides | ||
| Csf1 forward - catccaggcagagactgaca | IDT | N/A |
| Csf1 reverse - cttgctgatcctccttccag | IDT | N/A |
| Actb forward - tcgtgcgtgacattaaggag | IDT | N/A |
| Actb reverse - ttgccaatggtgatgacctg | IDT | N/A |
| Recombinant DNA | ||
| Software and algorithms | ||
| Seurat | Satija Lab | https://satihalab.org/seurat/ |
| GraphPad Prism | GraphPad Software | https://www.graphpad.com |
| FlowJo | FlowJo,LLC | https://www.flowjo.com/solutions/flowjo |
| ImageJ | National Institutes of Health |
https://Imagej.nih.gov/ij
|
| RStudio | RStudio | https://rstudio.com |
| CellRanger | 10XGenomics | https://10xgenomics.com |
| Signac | Stuart Lab | https://stuartlab.org/signac/ |
| Other | ||
| Falcon® 40 mm Cell Strainer | Corning | Cat# 352340 |
| Falcon® 100 mm Cell Strainer | Corning | Cat# 352360 |
| Corning BioCoat Collagen I 48-well Clear Flat Bottom TC-treated Multiwell Plate, with Lid | Corning | Cat# 354505 |
| Tungsten Carbide beads, 3mm | Qiagen | Cat# 69997 |
| Paper disks | Hardy diagnostics | Cat# Z7121 |
Bone-marrow transfer
Donor bone marrow was isolated under aseptic conditions from femurs and tibias of CD45.1 (C57BL/6) mice. Red blood cells were lysed using ACK lysis buffer (0.15 M NH4Cl, 10 mM KHCO3, and 0.1 mM EDTA). For injection, bone-marrow cells were resuspended in sterile PBS. Host CD45.2 (C57BL/6) mice were prepared for bone-marrow transfer by lethal irradiation with 950 rad. Hosts were reconstituted within 24 h with 2×10⁶ donor bone-marrow cells. Analysis was performed 8 weeks after reconstitution.
Parabiosis
Congenic, age-matched, female CD45.1 and CD45.2 mice were co-housed for two weeks prior to surgery to ensure harmonious cohabitation. For the surgical procedures, the mice were anesthetized by intraperitoneal injection of Ketamine (Putney) and Xylazine (Lloyd). The surgical area was then shaved with an electric clipper and disinfected. For local anesthesia, 0.25% Marcaine (Hospira) was injected into several locations along the surgical area. Matching skin incisions on each mouse were made from the olecranon to the knee joint. Elbow and knee joints of the mice were tightly connected to promote coordinated locomotion using non-absorbable sutures while skin was connected using absorbable sutures. Both dorsal and ventral sides were connected with continuous suture while the skin at the joints was connected using cruciate suture. Immediately after surgery, both parabiotic partners received 0.5–1 ml of pharmaceutical-grade physiological saline to prevent dehydration. Analgesia was performed by administration of Buprenorphine (ZooPharm) and was repeated every 24 hours as needed. Drinking water was supplemented with antibiotics for at least two weeks after surgery. Chimerism of tissue immune cells was analyzed after 8 weeks.
Cellulitis model with S. aureus
S. aureus (USA300-LAC) was plated on Trypticase Soy Agar (TSA) and grown for 24 hours at 37°C. Single colonies were isolated and cultured in Trypticase Soy Broth (TSB) medium at 37°C until the optical density at 600nm reached 0.6, corresponding to mid-exponential growth and equivalent to 5×10⁸ CFU/ml. Bacteria were washed 2 times in sterile DPBS, before being resuspended to a final concentration of 1×10⁸ CFU/ml in DPBS and kept on ice until injection. Concentration of the inoculum was further validated by enumerating the colonies upon plating and culturing on TSA plates for 24 hours at 37°C. The day prior to S. aureus injection, mice were shaved with an electric clipper and hair shafts were further removed by application of Nair® hair removal lotion (Church & Dwight Co. Inc., Princeton, NJ). Each mouse received 8×10⁶ CFU into the hypodermal adventitia. The site of injection was marked with a permanent marker and renewed every day if necessary. To assess the role of hyaluronic acid on S. aureus induced cellulitis, mice were injected with clinical grade hyaluronic acid of 500–730kDa (Hyalgan®) and 1000–2900kDa (Orthovisc®) 6 hours prior to S. aureus injection at the same skin site. Acetaminophen (Tylenol) was provided in drinking water (1.5mg/ml) for the duration of the experiment. Pictures of the skin at the injection site were taken every day. Mice were weighed before and 24 hours post-S. aureus injection.
CSF1R antibody mediated macrophage depletion in vivo
8–9 weeks old female C56BL/6 mice were injected intraperitoneally with either an anti-mouse CSF1R monocolonal antibody (clone AFS98, BioXCell) or its isotype control (rat IgG2a, BioXCell) initially at 2mg/mouse and subsequently at 1mg/mouse on every alternate day for a week. Depletion of hypodermal macrophages was assessed by flow cytometry analysis.
METHOD DETAILS
Tissue preparation
Skin single-cell suspensions were prepared form mouse dorsal skin as previously described 59. Hairs were shaved with an electric clipper and the whole skin samples were harvested and floated on ice-cold PBS. Subcutaneous fat was then removed from the hypodermis using forceps and discarded. For adventitia isolation, the tissue was gently pulled with forceps from the hypodermal side and the adventitia excised with scissors before being kept in ice-cold PBS until further processing. Otherwise, hypodermal layers were manually isolated using forceps and then stored in ice-cold PBS until further processing. The rest of skin samples were floated on 10 ml of a 1:1 mix of 0.25% trypsin/0.75 mM EDTA (Gibco) and 0.05% trypsin/0.75 mM EDTA for 45 minutes at 37°C. After incubation, the tissues were transferred into ice-cold PBS supplemented with 5% FBS followed by mechanically scraping off the epidermis. The dermis was stored in ice-cold PBS until further processing. To facilitate separation of epidermal cells, the cell suspensions were mechanically dissociated using a 50-ml syringe (Covidien). To obtain single-cell suspensions, the cells were then filtered through a 100 μm cell strainer (BD), washed with PBS/5% FBS, and then filtered again through a 40 μm cell strainer (BD). Dermis, hypodermis or isolated adventitia were then transferred into 5 ml of RPMI containing 0.25 mg/ml of Liberase T-Flex (Roche) and 1μg/ml DNase I (Sigma). Both tissues were finely minced using scissors followed by incubation for 2 hours at 37°C. After incubation, cells were dissociated using 12 ml syringes (Covidien). To obtain single-cell suspensions the cells were then filtered through a 100 μm cell strainer (BD), washed with PBS/5% FBS, and filtered again through a 40 μm cell strainer (BD). Cell suspensions were stored in ice-cold PBS/5% FBS until further processing.
Flow cytometry
Freshly prepared cell suspensions were washed with PBS and stained with Zombie Aqua Fixable Viability Kit (BioLegend) for 20 minutes at room temperature (RT). Cells were then incubated 10 minutes at 4°C with Fc-receptor blocking CD16/32 antibodies (Biolegend) diluted (1:200) in PBS/5% fetal calf serum/1 mM EDTA (SE Buffer). The cell suspensions were then spun down, resuspended with fluorochrome conjugated primary antibodies or isotype controls in SE Buffer and incubated for 15 minutes at 4°C.
Uncoupled anti-FOLR2 antibody (10/FR2) (BioLegend) was conjugated with Alexa-488 fluorochrome using an antibody labeling kit (Thermofisher Scientific) prior utilization for flow cytometry staining. After staining, cells were washed once with SE Buffer. Depending on the experiment the stained cells were either directly acquired on an LSR II (BD), sorted on a FACS Aria II, or fixed for 30 minutes with Fluorofix Buffer (Biolegend) and stored overnight in SE Buffer before analysis at the flow cytometer. Data were analyzed using FlowJo (version 10.6.1) (FlowJo, LLC).
Doxycycline treatment
R26-M2rtTA x tetO-H2B-GFP mice were induced by administering 2 mg/ml doxycycline (Sigma) and 7.5% sucrose (Sigma) dissolved in drinking water. After 6 days of induction, doxycycline-containing drinking water was replaced by regular drinking water. Label retention was analyzed by flow cytometry at the time points indicated in the figures.
RNA-Seq
Form macrophages and dendritic cells RNA-seq, freshly prepared skin cell suspensions from C57BL/6 mice were stained with specific antibodies and were sorted as follows on a FACS Aria II (BD): DC-Gate cells as live, singlet, CD45+, CD11b+, Ly6clo, MHCIIhi, CD64−; CCR2− macrophages as live, singlet, CD45+, CD11b+, Ly6clo, CD64+, CCR2−; CCR2+ macrophages as live, singlet, CD45+, CD11b+, Ly6clo, CD64+, CCR2+. Cells were directly sorted into TRIzol™ LS (ThermoFisher Scientific). Cell lysates in Trizol LS (Thermofisher scientific) were stored until further processing at −80°C. For RNA purification 0.2 ml chloroform (Sigma) per 1 ml Trizol LS were added to the lysate. After vigorous shaking for 20 seconds, phases were allowed to separate for 3 minutes. The lysate was then centrifuged at 10,000g for 18 minutes at 4°C. The clear phase was carefully transferred into a fresh 1.5 ml tube and an equal volume of 100% ethanol was added. RNA was then isolated using the RNeasy Plus Mini Kit (Qiagen) according to the manufacturer’s instructions. Isolated RNA was stored until further processing at −80°C. Libraries were prepared using the SMART-Seq Ultra Low Input RNA kit with Nextera XT library prep protocol according to the manufacturer’s instructions (Illumina, San Diego, CA, USA). Non-strand specific RNA libraries were sequenced on HiSeq2500 with Illumina TruSeq V4 chemistry.
For fibroblast RNA-seq, hypodermal adventitia from Csf1f/f and Csf1ΔTek was isolated and fibroblasts cells sorted with a FACS Aria II as Sytox Red−CD45−CD31−CD34+Sca1+ cells. Cells were collected in TRIzol™ LS and RNA was extracted using Direct-zol RNA MicroPrep (Zymo Research). RNA libraries were prepared using a NEBNext Poly(A) mRNA Magnetic Isolation Module (New England BioLabs), NEBNext Ultra RNA Library Prep Kit for Illumina (New England BioLabs) and NEBNext Multiplex Oligos for Illumina (Index Primers Set) (New England BioLabs) according to manufacturer protocol. The libraries were sequenced for 50 cycles (single read) using the Hiseq3000 (Illumina).
Single-cell RNA-sequencing
Freshly prepared cell suspension from the dermis and hypodermis of C57BL/6 back skins were stained with anti-CD45 and anti-EpCAM antibodies as well as propidium Iodide (PI). PI−EpCAM−CD45+ and PI−EpCAM−CD45− were FACS sorted (FACSAria Fusion, BD Biosciences). Droplet-based scRNA-seq captures and library preparations were performed with 10X Chromium 3’ V2 kit (10X Genomics) in accordance with the manufacturer protocol. Libraries were sequenced using the Hiseq3000 sequencer (Illumina).
Single-cell ATAC-sequencing
Freshly prepared single cell suspensions from the hypodermal adventitia of Igf1ff and Igf1ΔCsfr1 mice back skins were stained with anti-CD45 and anti-CD64 antibodies and were FACS sorted (FACSAria Fusion, BD Biosciences) for viable cells based on SYTOXTM Red dead cell stain. Sorted viable cells were lysed in cold lysis buffer (10 mM Tris–HCl (PH 7.4), 10 mM NaCl, 3 mM MgCl2, 0.1% Tween-20, 0.1% Nonidet P40, 0.01% Digitonin, 1mM DTT and 1U/μl RNase inhibitor) for 5 min on ice for nuclei isolation. Upon washing the nuclei extracts, targeted nuclei recovery was processed and ATAC libraries were generated using 10X Genomics Chromium Next GEM Single Cell Multiome ATAC + Gene expression (GEX) protocol (CGOOO338). ATAC libraries were sequenced using the Novaseq6000 sequencer (Illumina).
Immunofluorescence
Tissues were carefully harvested, embedded in freezing medium, and stored at −20°C. 8-μm sections were cut on a Leica CM3050S Cryostat (Leica) and stored until staining at −20°C. For staining, slides were fixed for 20 minutes at −20°C in acetone followed by 3x washing in PBS. Blocking was performed in 3% dry milk, 5 μg/ml Fc receptor blocking antibody and 5% serum of the host of the secondary antibody (blocking buffer) in PBS for 1 hour at RT. Sections were then incubated for 1 hour at RT with 5–20 μg/ml primary antibodies in blocking buffer, followed by 3x washing with PBS and incubated, where applicable, with the secondary antibody in blocking buffer for 30 minutes at RT. After three washing with PBS, every section received one drop of Prolong Gold antifade mounting medium with DAPI (Invitrogen) before placing a coverslip. Primary antibodies were anti Collagen I, Staphylococcus aureus (all Abcam), FOLR2 (10/FR2) (Biolegend). Uncoupled FOLR2 antibody was conjugated with Alexa-568 or Alexa-488 fluorochromes using antibody labeling kits (Thermofisher Scientifics) prior utilization for immunofluorescence staining. Secondary antibodies were AF568 Goat anti-rabbit IgG (Abcam) and AF488 Goat anti-Mouse IgG3 (Invitrogen). Normal goat serum was from Jackson Immunoresearch. Images were acquired using the Axio Imager.A1 microscope (Zeiss), the AxioCam MRm (Zeiss), and the AxioVison Software (Zeiss). Exposure times and linear adjustments were consistent between samples and their respective controls.
Histology
Freshly excised skin samples or isolated skin layers from mouse back were fixed in 10% formalin (Sigma-Aldrich) and sent to Histoserv, Inc. (Germantown, MD). Samples were paraffin-embedded, sectioned, and stained with H&E, Masson’s trichrome, or Alcian blue (pH 2.5). Images were acquired using either the Leica DM 2000 microscope combined with the Leica DFC 295 camera or the BZ-X800 microscope (Keyence).
Cytospins
Dermal and hypodermal CCR2+ and CCR2− macrophages were FACS sorted and cytospins prepared using EZ Cytofunnels (Thermofisher) according to the manufacturer’s instructions. Staining was performed using the Rapid Chrome Kwik Diff Staining Kit (Thermo Fisher) according to the manufacturer’s instructions.
Transmission Electron Microscopy (TEM)
Dissected mouse back skin samples were fixed for 2 hours at room temperature in 0.1 M sodium cacodylate buffer containing 4% formaldehyde and 2% glutaraldehyde (v/v, pH 7.4). Samples were kept at 4°C in the same buffer for short-term storage. For further processing samples were washed three times in sodium cacodylate buffer (0.1M, pH 7.4), and post-fixed in osmium tetroxide (1% v/v in cacodylate buffer) for 1 h. Samples were washed again in cacodylate buffer and stained for 1 hour in acetate buffer (0.1M, pH 4.2) containing uranyl acetate (0.5% w/v). Dehydration was performed in an ethanol series (35%, 50%, 75%, 95% and 100%, v/v), followed by propylene oxide. Infiltration was performed in a mixture of propylene oxide and epoxy resin (1:1) overnight on a tissue rotator. Samples were then embedded in epoxy resin and cured at 55°C for 48 hours. Cured samples were trimmed and sectioned to 80 to 90nm with an UC7 ultramicrotome (Leica). Thin sections were mounted on 200 mesh copper grids and stained in uranyl acetate and lead citrate. Stabilization of the sections was performed by carbon evaporation using a vacuum evaporator. Images were acquired using the H7600 microscope (Hitachi) equipped with an AMT camera (Advanced Microscopy Techniques Co.). Osmium tetroxide, sodium cacodylate, uranyl acetate, and acetate buffer were from Electron Microscope Sciences (Fort Washington, PA). Formaldehyde and glutaraldehyde were from Tousimis (Rockville, MD). Lead citrate was from Leica (Bannockburn, IL).
Quantitative real-time PCR
Dermal and hypodermal layers were isolated and 8-mm punch biopsies from each layer were transferred into an Eppendorf tube containing RLT buffer (Qiagen) supplemented with 10% β-mercaptoethanol. Tissues were grinded using a pestle until complete dissolution. RNA was then isolated using the RNeasy Plus Mini Kit (Qiagen) according to the manufacturer’s instructions. cDNA was synthesized using the Superscript IV VILO (Invitrogen) and real-time PCR performed in triplicate using SYBR green PCR Master Mix (ThermoFisher Scientifics) and ran with the StepOnePlus Real-Time PCR system (Applied Biosystems). Data were normalized with β-actin gene expression.
Disc diffusion assay to evaluate bactericidal activity
Sterile swab dipped in S. aureus culture in log phase was streaked on Trypticase Soy Agar (TSA) plate in a back-and-forth motion ensuring an even distribution of the inoculum that will result in a confluent lawn of growth. Plates were allowed to dry for 1–2 minutes before placing paper disks of 63mm (Hardy diagnostics) saturated with 10μL of vancomycin (1μg/ml, Sigma) or varying concentrations of hyaluronic acid (500–700kDa, Sigma) on the plate using forceps. Disk saturated with vancomycin was used as a positive control. Plates were placed in incubators at 37°C for 24 hours before measuring the zone of inhibition using a caliper while viewing the back of petri dish.
Turbidity based assay to analyze HA bacteriostatic activity
Colonies of S. aureus isolated from the overnight grown cultures were suspended into Trypticase Soy Broth (TSB) medium and transferred into 96-well plate (100μL of bacteria solution per well). These wells were then completed with 50 μL of TSB supplemented or not with vancomycin (1μg/ml, Sigma) or varying amounts of hyaluronic acid (500–750kDa, Sigma) as follow: 250μg (5mg/ml stock solution), 50μg (1mg/ml stock solution) and 10μg (0.2mg/ml stock solution). Bacteria were grown at 37°C under agitation (180rpm) until the optical density at 600nm reached 0.6, corresponding to mid-exponential growth, in untreated control group. Optical density of each sample was then read and plotted as a mean to express the bacteriostatic activity.
Isolation and culture of hypodermal adventitia macrophages
Single-cell suspensions from the hypodermal adventitia were immunostained with PE conjugated anti-mouse CD64 antibody and then enriched for HDMs with anti-PE microbeads using autoMACS Pro cell separator. Cells were washed and resuspended in RPMI medium containing 2mM L-glutamine and supplemented with 10% fecal calf serum and 1% Penicillin and Streptomycin (RPMIc) before being seeded at 1 × 10⁵ cells per well in 48-well flat clear bottom tissue culture treated microplates or at 1 × 10⁴ cells per well in 8-well chambered slide for 2h at 37°C in a 5% CO2 incubator. Debris and non-adherent cells were then washed off and cells were used for subsequent experiments.
Rescue and inhibition of LYVE-1 expression by adventitia macrophages
Adventitia macrophages from Igf1f/f or Igf1ΔCsf1r were cultured in 8-well chambered for 2 hours and treated or not with varying concentrations (25ng/ml, 50ng/ml, 100ng/ml) of rIGF1 (R&D) for 24 hours while maintained at 37°C in a 5% CO2 incubator. Alternatively, for inhibition experiments, cells were treated with varying concentration of MEK1/2, AKT, the combination thereof or AP-1 inhibitors in RPMIc for 24 hours in presence or not of rIGF1 (100ng/ml, R&D). Cells were washed and stained with anti-LYVE-1 antibody (5μg/ml) for 30 minutes. Cells were gently washed with PBS and then fixed with 2% paraformaldehyde for 15 min at RT. Following washing the cells twice with PBS, the slides were mounted using Prolong Gold antifade mounting medium with DAPI. Images were acquired using the Keyence microscope (BZ-X800) and images were analyzed using ImageJ software.
In vitro hyaluronic acid-FITC uptake assay by adventitia macrophages
Adventitia macrophages were maintained in 48-well culture plate in fresh culture media for 24 hours in presence or not of 100ng/ml recombinant IGF1 (rIGF1, R&D) at 37°C in a 5% CO2 incubator. Cells were subsequently incubated with or without 100μg/ml of Hyaluronic acid (HA-FITC) of varying molecular weights in the above culture media without phenol red for 1h. Alternatively, rIGF1 untreated cells were incubated for 15min with or without different concentrations of LYVE-1 blocking antibody (0, 0.02, 0.2, 2 and 20μg/ml, R&D) prior to be exposed to HA-FITC (800kDa, Sigma). Cells were then washed to remove excess HA-FITC and the plates were transferred into the IncuCyte live cell imager platform (Leica) housed inside a cell incubator at 37oC/5%CO2, and were imaged for both CD64-PE and HA-FITC signal. FITC fluorescence intensity from four different images per well taken at 20X magnification from two technical replicates were analyzed using the IncuCyte™ basic analysis software for quantifying FITC intensities.
Enzyme-linked immunosorbent assay for hyaluronic acid
Mice skin hypodermal tissue homogenates were prepared by homogenizing 0.1mg of hypodermis (equivalent to 1cm2 area of hypodermis) in 200μl RIPA lysis buffer (Cell Signaling Technology) supplemented with protein inhibitor cocktail (Cell Signaling Technology) with tungsten carbide beads (QIAGEN) using TissueLyser LT (QIAGEN) on ice. Tissue homogenates were centrifuged at 13,000 rpm for 10 minutes at 4°C to spin down the debris and the clear homogenates (50000-fold diluted) were used for analyzing hyaluronan using Quantine ELISA Kit (R&D).
Immunoblot analysis
Adventitia macrophages isolated from WT and Igf1ΔCsfr1 mice were exposed to LPS (100ng/ml), S. aureus (USA300, 108 CFU/ml), rIGF1 (100ng/ml), anti-LYVE1 antibody (2μg/ml) or its isotype control (2μg/ml) for 15min or otherwise stated in vitro. Whole cell lysate was prepared in RIPA buffer (Cell Signaling Technology) supplemented with protein inhibitor cocktail (Cell Signaling Technology). Cell lysates were centrifuged and the protein concentrations in the cell lysates was analyzed by BCA method (BioRad). 20μg of protein in cell lysates were dissolved in 4X sample buffer (Invitrogen) containing NuPAGE sample reducing agent (Invitrogen) and boiled at 95°C for 5min. Proteins were separated on PAGE gels (4%–20% SDS-PAGE, Bio-Rad) and transferred onto PVDF membranes (Bio-Rad) using Trans-Blot Turbo transfer system (Bio-Rad). Membranes were blocked with 5% w/v non-fat milk (Cell Signalling) in TBS–Tween (Thermo Fisher Scientific) before probing with mouse anti-ERK, rabbit anti-phosphoERK, rabbit anti-AKT, rabbit anti-phosphoAKT, rabbit anti-p38 and rabbit anti-Phospho-p38 (cell Signaling) rabbit anti-p65, rabbit anti-Phospho-p65, and HRP-conjugated Vinculin (Santa Cruz) antibodies. Primary antibodies were detected using either goat anti-rabbit, or -mouse secondary antibodies conjugated with horseradish peroxidase (HRP). Membranes were washed with TBS-Tween and were developed using Pierce ECL western blotting substrate (Thermo Fisher Scientific). Images were acquired using a ChemiDoc Touch Image System (Bio-Rad).
Bulk RNA-seq analyses
For macrophages and dendritic cell RNA-seq, the FASTQ files with 125bp paired-end reads were processed using Trimmomatic (v0.30) to remove adaptors and low-quality bases. The trimmed FASTQ data were aligned to mouse genome (GRCm38) with STAR (v2.4.2a) using GENCODE mouse gtf file version 4 (Ensembl 78). About 90% of ~42 million reads per sample were mapped to mouse genome uniquely for a total of 97% mapping rate. The STAR software was also used to generate the gene read counts. Statistical analysis was performed in R computing environment (https://www.r-project.org). The gene read count data from STAR for all samples were normalized with the R Package limma (v3.34.9). Differential expression p-values were determined with a t-test function and false discovery rate (FDR). Pathway analyses were realized using Metascape online tool (www.metascape.org).
For fibroblasts RNA-seq, the FASTQ files data were aligned to mouse genome (mm10) with STAR software (2.6.1c). Gene count of mapped reads was performed via GenomicFeatures and GenomicAlignments tools on R platform and then used as an input for downstream analysis using DESeq2 package. Genes with low read counts (<10) were filtered out from the analysis. Differentially expressed gene criteria included FDR<0.1, pval<0.05 and absolute value of Log2 Fold change >1.
Single-cell RNA-sequencing analyses
Cell Ranger software (version 2.1.1, 10X Genomics) was used to generate Fastq files, to count and align the reads to the mouse reference genome (mm10). Downstream analyses were performed using Seurat package (version 3.0). Quality control metrics included exclusion of cells with mitochondrial gene load > 5%, and with UMI/cell <200 and UMI/cell>10,000 or 15,000 depending on the datasets. Each dataset was generated by merging two distinct batches (using “merge” command) before being normalized (“NormalizeData” command) and scaled (“ScaleData” command). For unsupervised clustering, PCA analyses were performed on each dataset (“RunPCA” command) with PC number and resolution adjusted as follow: Dermal and hypodermal leukocytes (10 PC, resolution 1), dermal and hypodermal stromal cell (20 PC, resolution 0.5). To merge dermal and hypodermal stromal cell datasets together, 2000 genes were used as anchors for integration (“IntegrateData” command). Dimensionality reduction was performed on each dataset (“RunUMAP” command) and visualization of cell clustering by Uniform Manifold Approximation and Projection (UMAP). Doublet clusters and stromal or leukocyte contaminant clusters were subsequently removed from each dataset when detected. DEG were generated with the following criteria: min.pct1>0.1 and |avg_LogFC|>0.25. Enrichment score using ImmGen reference database were performed with SingleR package. Enrichment score for DEG (p-value <0.05, absolute fold change >1) from indicated bulk-RNAseq datasets generated in house were performed using “AddModuleScore” command from Seurat.
Ligand-receptor interaction map
To reduce the complexity of the map, clusters from hypodermal immune cells and stromal cells were grouped based on their cell-type identity. The ligand and receptor pairs were obtained from a published human dataset 60 and were converted to mouse homologue pairs using biomaRt package. A filtration was applied based on detected UMI per cell (>0.1) and percentage of expressing cells within each cell-type (>10%). Ligand-receptor interaction map was then generated using Cytoscape software (Cytoscape.org).
Single-cell ATAC-sequencing analyses
Cell Ranger ATAC software (10X Genomics) was used to generate Fastq files, to detect and count accessible chromatin peaks and to align them to the mouse reference genome (mm10). Downstream analyses were performed using Signac package (version 1.8.0). Briefly, a global peak set recapitulating and unifying the different peaks detected across the different datasets was generated and used to quantify each peak within the datasets before merging them (“merge” command). Quality control metrics comprised the exclusion of cells with less than 2000 reads/cell and more than 20,000 reads/cell, a TSS enrichment score <4, a ratio in genomic blacklist regions >0.025, a nucleosome binding pattern >1 and a fraction of fragment in peaks <40%. Non-linear dimension reduction and clustering were performed using dimension component 2 to 15 and a resolution of 0.5. Clusters with low number of cells (<100 cells) and presenting non-macrophage core gene signature were subsequently removed from the analysis. Differential peak accessibility between clusters as well as between Igf1ΔCsf1r and control cells within each cluster were generated using the following criteria: min.pct>0.05, |avg_LogFC|>0.25 and p-value<0.05. Motif activity between Igf1ΔCsf1r and control cells within each cluster was performed using chromvar 61 with selection criteria as min.pct>0.1, |avg_LogFC|>0.25 and p-value<0.05. Transcription factors with putative binding site on Lyve1 gene were assessed based on available online database (www.michalopoulos.net/tfbspred).
Cellulitis evaluation
1 cm2 of skin at injection sites and spleens were harvested and further processed for CFU count, immunofluorescence, flow cytometry and H&E at 48 hours post-S. aureus injection or otherwise stated. Areas of abscess were quantified in H&E sections using ImageJ software (NIH, Bethesda) by manually delineating the abscess formation and calculating the area in pixels. For CFU count, skins and spleens were transferred into sterile PBS, skins were minced with scissors, and both tissues were further disrupted with a homogenizer (PowerGen 125, Fisher Scientific). After a filtration with 40μm filter (BD) to eliminate tissue debris, fractions of each sample were plated on TSA for 24 hours at 37°C and colonies enumerated. Erythema intensity and area, including the ischemic centers, were assessed from the pictures taken 24 hours post-S. aureus injection using ImageJ software (NIH, Bethesda). To quantify the intensity of erythema, photographic images of the gross phenotypes were imported into Image J and the intensity of redness was calculated by comparing it to the white ruler that was included in the photographic image. To evaluate skin abscess formation 24 hours post-S. aureus injection, a 4-grade score was used as follow: grade 0 for non-palpable abscess, grade 1 for palpable but non-visible abscess, grade 2 for palpable and visible abscess with no dermonecrotic formation, grade 3 for dermonecrotic formation. The disease score was calculated as the sum of the 4-grade scores applied to each of the following parameters: erythema intensity, erythema area, skin abscess formation and CFU count in the skin and spleen.
QUANTIFICATION AND STATISTICAL ANALYSES
Image quantification
All quantifications based on immunofluorescence staining, Masson’s trichrome stain and alcian blue stain were made from 3 sections per mouse collected at different levels within the tissue of a minimum of 3 different mice per group. Analyses were performed using ImageJ software (NIH, Bethesda). For cell enumeration, macrophages in the hypodermal adventitia were counted manually from each field of view. For collagen quantification, a color threshold was used to select the collagen staining and the area covered by the staining was measured in pixel from each field of view.
Statistical analysis
Quantitative data were visualized and analyzed using GraphPad Prism software. Student’s t test was used to measure significance between two groups and ANOVA with Tukey’s multiple comparison test was used to measure significance when comparing multiple groups. Significance is indicated as follows in all figures: ns = not significant, p < 0.05, p < 0.01, p < 0.001. Number of mice in each group is indicated in figure legends for main figures, and in the figure for Supplemental figures. Replicate number for each in vitro experiment is in the figure legend. All error bars represent mean ± standard error mean or otherwise stated.
Supplementary Material
Table S1. Related to Figure 1. Bulk and single-cell RNA-sequencing analysis of dermal and hypodermal leukocytes.
Table S2. Related to Figure 3. Single-cell RNA-sequencing analysis of dermal and hypodermal stromal cells.
Table S3. Related to Figure 4. Criteria and scoring for S. aureus induced cellulitis in mouse skin.
Table S4. Related to Figure 6. In silico ligand-receptor interactions between hypodermal cells.
Table S5. Related to Figure 7. Differentially accessible chromatin regions between hypodermal macrophages clusters.
Highlights.
Hypodermal macrophage homeostasis relied on fibroblast-derived CSF1
CCR2− hypodermal macrophages cleared hyaluronic acid via LYVE-1
Cell-autonomous IGF1 regulated LYVE-1 expression via MAPK pathway
Hyaluronic acid accumulation conferred protection against S. aureus infection
ACKNOWLEDGMENTS
This work was supported by the Intramural Research Program of NIAMS and NCI. T. D was in part supported by a postdoctoral fellowship of the German Research Foundation (DFG). J.X.J was funded by RO1AG045040 and Welch Foundation Grant AQ-1507.The authors thank the NIAMS Office of Scientific Technology and NCI core facilities for their assistance with flow cytometry, sequencing and microscopy.
Footnotes
DECLARATION OF INTERESTS
The authors declare no competing interests.
Publisher's Disclaimer: This is a PDF file of an unedited manuscript that has been accepted for publication. As a service to our customers we are providing this early version of the manuscript. The manuscript will undergo copyediting, typesetting, and review of the resulting proof before it is published in its final form. Please note that during the production process errors may be discovered which could affect the content, and all legal disclaimers that apply to the journal pertain.
REFERENCES
- 1.Sundberg JP, Booth CJ, Nanney LB, Fleckman P, and King LE (2017). Comparative Anatomy and Histology (Second Edition) A Mouse, Rat, and Human Atlas (Academic Press; ). 10.1016/C2014-0-03145-0. [DOI] [Google Scholar]
- 2.Amit I, Winter DR, and Jung S. (2016). The role of the local environment and epigenetics in shaping macrophage identity and their effect on tissue homeostasis. Nat Immunol 17, 18–25. 10.1038/ni.3325. [DOI] [PubMed] [Google Scholar]
- 3.Ginhoux F, and Guilliams M. (2016). Tissue-Resident Macrophage Ontogeny and Homeostasis. Immunity 44, 439–449. 10.1016/j.immuni.2016.02.024. [DOI] [PubMed] [Google Scholar]
- 4.Perdiguero EG, and Geissmann F. (2016). The development and maintenance of resident macrophages. Nat Immunol 17, 2–8. 10.1038/ni.3341. [DOI] [PMC free article] [PubMed] [Google Scholar]
- 5.Guilliams M, and Scott CL (2017). Does niche competition determine the origin of tissue-resident macrophages? Nat Rev Immunol 17, 451–460. 10.1038/nri.2017.42. [DOI] [PubMed] [Google Scholar]
- 6.Davies LC, Jenkins SJ, Allen JE, and Taylor PR (2013). Tissue-resident macrophages. Nat Immunol 14, 986–995. 10.1038/ni.2705. [DOI] [PMC free article] [PubMed] [Google Scholar]
- 7.Murray PJ, and Wynn TA (2011). Protective and pathogenic functions of macrophage subsets. Nat Rev Immunol 11, 723–737. 10.1038/nri3073. [DOI] [PMC free article] [PubMed] [Google Scholar]
- 8.Lim HY, Lim SY, Tan CK, Thiam CH, Goh CC, Carbajo D, Chew SHS, See P, Chakarov S, Wang XN, et al. (2018). Hyaluronan Receptor LYVE-1-Expressing Macrophages Maintain Arterial Tone through Hyaluronan-Mediated Regulation of Smooth Muscle Cell Collagen. Immunity 49, 326–341 e327. 10.1016/j.immuni.2018.06.008. [DOI] [PubMed] [Google Scholar]
- 9.Teitelbaum SL (2000). Bone resorption by osteoclasts. Science 289, 1504–1508. 10.1126/science.289.5484.1504. [DOI] [PubMed] [Google Scholar]
- 10.Paolicelli RC, Bolasco G, Pagani F, Maggi L, Scianni M, Panzanelli P, Giustetto M, Ferreira TA, Guiducci E, Dumas L, et al. (2011). Synaptic pruning by microglia is necessary for normal brain development. Science 333, 1456–1458. 10.1126/science.1202529. [DOI] [PubMed] [Google Scholar]
- 11.Greter M, Lelios I, Pelczar P, Hoeffel G, Price J, Leboeuf M, Kundig TM, Frei K, Ginhoux F, Merad M, and Becher B. (2012). Stroma-derived interleukin-34 controls the development and maintenance of langerhans cells and the maintenance of microglia. Immunity 37, 1050–1060. 10.1016/j.immuni.2012.11.001. [DOI] [PMC free article] [PubMed] [Google Scholar]
- 12.Wang Y, Szretter KJ, Vermi W, Gilfillan S, Rossini C, Cella M, Barrow AD, Diamond MS, and Colonna M. (2012). IL-34 is a tissue-restricted ligand of CSF1R required for the development of Langerhans cells and microglia. Nat Immunol 13, 753–760. 10.1038/ni.2360. [DOI] [PMC free article] [PubMed] [Google Scholar]
- 13.Ginhoux F, Tacke F, Angeli V, Bogunovic M, Loubeau M, Dai XM, Stanley ER, Randolph GJ, and Merad M. (2006). Langerhans cells arise from monocytes in vivo. Nat Immunol 7, 265–273. 10.1038/ni1307. [DOI] [PMC free article] [PubMed] [Google Scholar]
- 14.Nagao K, Kobayashi T, Moro K, Ohyama M, Adachi T, Kitashima DY, Ueha S, Horiuchi K, Tanizaki H, Kabashima K, et al. (2012). Stress-induced production of chemokines by hair follicles regulates the trafficking of dendritic cells in skin. Nat Immunol 13, 744–752. 10.1038/ni.2353. [DOI] [PMC free article] [PubMed] [Google Scholar]
- 15.Doebel T, Voisin B, and Nagao K. (2017). Langerhans Cells - The Macrophage in Dendritic Cell Clothing. Trends Immunol 38, 817–828. 10.1016/j.it.2017.06.008. [DOI] [PubMed] [Google Scholar]
- 16.Tamoutounour S, Guilliams M, Montanana Sanchis F, Liu H, Terhorst D, Malosse C, Pollet E, Ardouin L, Luche H, Sanchez C, et al. (2013). Origins and functional specialization of macrophages and of conventional and monocyte-derived dendritic cells in mouse skin. Immunity 39, 925–938. 10.1016/j.immuni.2013.10.004. [DOI] [PubMed] [Google Scholar]
- 17.Chakarov S, Lim HY, Tan L, Lim SY, See P, Lum J, Zhang XM, Foo S, Nakamizo S, Duan K, et al. (2019). Two distinct interstitial macrophage populations coexist across tissues in specific subtissular niches. Science 363. 10.1126/science.aau0964. [DOI] [PubMed] [Google Scholar]
- 18.Tong SY, Davis JS, Eichenberger E, Holland TL, and Fowler VG Jr. (2015). Staphylococcus aureus infections: epidemiology, pathophysiology, clinical manifestations, and management. Clin Microbiol Rev 28, 603–661. 10.1128/CMR.00134-14. [DOI] [PMC free article] [PubMed] [Google Scholar]
- 19.Esposito S, Bassetti M, Concia E, De Simone G, De Rosa FG, Grossi P, Novelli A, Menichetti F, Petrosillo N, Tinelli M, et al. (2017). Diagnosis and management of skin and soft-tissue infections (SSTI). A literature review and consensus statement: an update. J Chemother 29, 197–214. 10.1080/1120009X.2017.1311398. [DOI] [PubMed] [Google Scholar]
- 20.Turner NA, Sharma-Kuinkel BK, Maskarinec SA, Eichenberger EM, Shah PP, Carugati M, Holland TL, and Fowler VG Jr. (2019). Methicillin-resistant Staphylococcus aureus: an overview of basic and clinical research. Nat Rev Microbiol 17, 203–218. 10.1038/s41579-018-0147-4. [DOI] [PMC free article] [PubMed] [Google Scholar]
- 21.Aran D, Looney AP, Liu L, Wu E, Fong V, Hsu A, Chak S, Naikawadi RP, Wolters PJ, Abate AR, et al. (2019). Reference-based analysis of lung single-cell sequencing reveals a transitional profibrotic macrophage. Nat Immunol 20, 163–172. 10.1038/s41590-018-0276-y. [DOI] [PMC free article] [PubMed] [Google Scholar]
- 22.Heng TS, Painter MW, and Immunological Genome Project, C. (2008). The Immunological Genome Project: networks of gene expression in immune cells. Nat Immunol 9, 1091–1094. 10.1038/ni1008-1091. [DOI] [PubMed] [Google Scholar]
- 23.Price JG, Idoyaga J, Salmon H, Hogstad B, Bigarella CL, Ghaffari S, Leboeuf M, and Merad M. (2015). CDKN1A regulates Langerhans cell survival and promotes Treg cell generation upon exposure to ionizing irradiation. Nat Immunol 16, 1060–1068. 10.1038/ni.3270. [DOI] [PMC free article] [PubMed] [Google Scholar]
- 24.Foudi A, Hochedlinger K, Van Buren D, Schindler JW, Jaenisch R, Carey V, and Hock H. (2009). Analysis of histone 2B-GFP retention reveals slowly cycling hematopoietic stem cells. Nat Biotechnol 27, 84–90. 10.1038/nbt.1517. [DOI] [PMC free article] [PubMed] [Google Scholar]
- 25.Bajpai G, Schneider C, Wong N, Bredemeyer A, Hulsmans M, Nahrendorf M, Epelman S, Kreisel D, Liu Y, Itoh A, et al. (2018). The human heart contains distinct macrophage subsets with divergent origins and functions. Nat Med 24, 1234–1245. 10.1038/s41591-018-0059-x. [DOI] [PMC free article] [PubMed] [Google Scholar]
- 26.Guilliams M, Thierry GR, Bonnardel J, and Bajenoff M. (2020). Establishment and Maintenance of the Macrophage Niche. Immunity 52, 434–451. 10.1016/j.immuni.2020.02.015. [DOI] [PubMed] [Google Scholar]
- 27.W.Pollard J, and Stanley ER (1996). Pleiotropic roles for CSF-1 in development defined by the mouse mutation osteopetrotic. [Google Scholar]
- 28.Dumont DJ, Gradwohl G, Fong GH, Puri MC, Gertsenstein M, Auerbach A, and Breitman ML (1994). Dominant-negative and targeted null mutations in the endothelial receptor tyrosine kinase, tek, reveal a critical role in vasculogenesis of the embryo. Genes Dev 8, 1897–1909. 10.1101/gad.8.16.1897. [DOI] [PubMed] [Google Scholar]
- 29.Schlaeger TM, Bartunkova S, Lawitts JA, Teichmann G, Risau W, Deutsch U, and Sato TN (1997). Uniform vascular-endothelial-cell-specific gene expression in both embryonic and adult transgenic mice. Proc Natl Acad Sci U S A 94, 3058–3063. 10.1073/pnas.94.7.3058. [DOI] [PMC free article] [PubMed] [Google Scholar]
- 30.Sato TN, Qin Y, Kozak CA, and Audus KL (1993). Tie-1 and tie-2 define another class of putative receptor tyrosine kinase genes expressed in early embryonic vascular system. Proc Natl Acad Sci U S A 90, 9355–9358. 10.1073/pnas.90.20.9355. [DOI] [PMC free article] [PubMed] [Google Scholar]
- 31.Takakura N, Huang XL, Naruse T, Hamaguchi I, Dumont DJ, Yancopoulos GD, and Suda T. (1998). Critical role of the TIE2 endothelial cell receptor in the development of definitive hematopoiesis. Immunity 9, 677–686. 10.1016/s1074-7613(00)80665-2. [DOI] [PubMed] [Google Scholar]
- 32.Price JV, and Vance RE (2014). The macrophage paradox. Immunity 41, 685–693. 10.1016/j.immuni.2014.10.015. [DOI] [PubMed] [Google Scholar]
- 33.Wynn TA, and Vannella KM (2016). Macrophages in Tissue Repair, Regeneration, and Fibrosis. Immunity 44, 450–462. 10.1016/j.immuni.2016.02.015. [DOI] [PMC free article] [PubMed] [Google Scholar]
- 34.Saraswathi S, Tesoriero JV, and Vasan NS (1987). Histochemical-Localization of Protein-Polysaccharides in Renal Tissue. J Bioscience 11, 245–256. Doi 10.1007/Bf02704675. [DOI] [Google Scholar]
- 35.Banerji S, Ni J, Wang SX, Clasper S, Su J, Tammi R, Jones M, and Jackson DG (1999). LYVE-1, a new homologue of the CD44 glycoprotein, is a lymph-specific receptor for hyaluronan. J Cell Biol 144, 789–801. 10.1083/jcb.144.4.789. [DOI] [PMC free article] [PubMed] [Google Scholar]
- 36.Prevo R, Banerji S, Ferguson DJ, Clasper S, and Jackson DG (2001). Mouse LYVE-1 is an endocytic receptor for hyaluronan in lymphatic endothelium. J Biol Chem 276, 19420–19430. 10.1074/jbc.M011004200. [DOI] [PubMed] [Google Scholar]
- 37.Xu H, Chen M, Reid DM, and Forrester JV (2007). LYVE-1-positive macrophages are present in normal murine eyes. Invest Ophthalmol Vis Sci 48, 2162–2171. 10.1167/iovs.06-0783. [DOI] [PubMed] [Google Scholar]
- 38.Vachon E, Martin R, Kwok V, Cherepanov V, Chow CW, Doerschuk CM, Plumb J, Grinstein S, and Downey GP (2007). CD44-mediated phagocytosis induces inside out activation of complement receptor-3 in murine macrophages. Blood 110, 4492–4502. 10.1182/blood-2007-02-076539. [DOI] [PMC free article] [PubMed] [Google Scholar]
- 39.Tao Y, Pinzi V, Bourhis J, and Deutsch E. (2007). Mechanisms of disease: signaling of the insulin-like growth factor 1 receptor pathway--therapeutic perspectives in cancer. Nat Clin Pract Oncol 4, 591–602. 10.1038/ncponc0934. [DOI] [PubMed] [Google Scholar]
- 40.Garces de Los Fayos Alonso I, Liang HC, Turner SD, Lagger S, Merkel O, and Kenner L. (2018). The Role of Activator Protein-1 (AP-1) Family Members in CD30 Positive Lymphomas. Cancers (Basel) 10. 10.3390/cancers10040093. [DOI] [PMC free article] [PubMed] [Google Scholar]
- 41.Ginhoux F, and Jung S. (2014). Monocytes and macrophages: developmental pathways and tissue homeostasis. Nat Rev Immunol 14, 392–404. 10.1038/nri3671. [DOI] [PubMed] [Google Scholar]
- 42.Guilliams M, De Kleer I, Henri S, Post S, Vanhoutte L, De Prijck S, Deswarte K, Malissen B, Hammad H, and Lambrecht BN (2013). Alveolar macrophages develop from fetal monocytes that differentiate into long-lived cells in the first week of life via GMCSF. J Exp Med 210, 1977–1992. 10.1084/jem.20131199. [DOI] [PMC free article] [PubMed] [Google Scholar]
- 43.Park MD, Silvin A, Ginhoux F, and Merad M. (2022). Macrophages in health and disease. Cell 185, 4259–4279. 10.1016/j.cell.2022.10.007. [DOI] [PMC free article] [PubMed] [Google Scholar]
- 44.Dai XM, Ryan GR, Hapel AJ, Dominguez MG, Russell RG, Kapp S, Sylvestre V, and Stanley ER (2002). Targeted disruption of the mouse colony-stimulating factor 1 receptor gene results in osteopetrosis, mononuclear phagocyte deficiency, increased primitive progenitor cell frequencies, and reproductive defects. Blood 99, 111–120. 10.1182/blood.v99.1.111. [DOI] [PubMed] [Google Scholar]
- 45.Pridans C, Raper A, Davis GM, Alves J, Sauter KA, Lefevre L, Regan T, Meek S, Sutherland L, Thomson AJ, et al. (2018). Pleiotropic Impacts of Macrophage and Microglial Deficiency on Development in Rats with Targeted Mutation of the Csf1r Locus. J Immunol 201, 2683–2699. 10.4049/jimmunol.1701783. [DOI] [PMC free article] [PubMed] [Google Scholar]
- 46.Chitu V, and Stanley ER (2006). Colony-stimulating factor-1 in immunity and inflammation. Curr Opin Immunol 18, 39–48. 10.1016/j.coi.2005.11.006. [DOI] [PubMed] [Google Scholar]
- 47.Viola A, Munari F, Sanchez-Rodriguez R, Scolaro T, and Castegna A. (2019). The Metabolic Signature of Macrophage Responses. Front Immunol 10, 1462. 10.3389/fimmu.2019.01462. [DOI] [PMC free article] [PubMed] [Google Scholar]
- 48.Bain CC, Bravo-Blas A, Scott CL, Perdiguero EG, Geissmann F, Henri S, Malissen B, Osborne LC, Artis D, and Mowat AM (2014). Constant replenishment from circulating monocytes maintains the macrophage pool in the intestine of adult mice. Nat Immunol 15, 929–937. 10.1038/ni.2967. [DOI] [PMC free article] [PubMed] [Google Scholar]
- 49.Bain CC, Scott CL, Uronen-Hansson H, Gudjonsson S, Jansson O, Grip O, Guilliams M, Malissen B, Agace WW, and Mowat AM. (2013). Resident and pro inflammatory macrophages in the colon represent alternative context-dependent fates of the same Ly6Chi monocyte precursors. Mucosal Immunol 6, 498–510. 10.1038/mi.2012.89. [DOI] [PMC free article] [PubMed] [Google Scholar]
- 50.Cummings RJ, Barbet G, Bongers G, Hartmann BM, Gettler K, Muniz L, Furtado GC, Cho J, Lira SA, and Blander JM (2016). Different tissue phagocytes sample apoptotic cells to direct distinct homeostasis programs. Nature 539, 565–569. 10.1038/nature20138. [DOI] [PMC free article] [PubMed] [Google Scholar]
- 51.Higashi Y, Sukhanov S, Shai SY, Danchuk S, Tang R, Snarski P, Li Z, Lobelle Rich P, Wang M, Wang D, et al. (2016). Insulin-Like Growth Factor-1 Receptor Deficiency in Macrophages Accelerates Atherosclerosis and Induces an Unstable Plaque Phenotype in Apolipoprotein E-Deficient Mice. Circulation 133, 2263–2278. 10.1161/CIRCULATIONAHA.116.021805. [DOI] [PMC free article] [PubMed] [Google Scholar]
- 52.Spadaro O, Camell CD, Bosurgi L, Nguyen KY, Youm YH, Rothlin CV, and Dixit VD (2017). IGF1 Shapes Macrophage Activation in Response to Immunometabolic Challenge. Cell Rep 19, 225–234. 10.1016/j.celrep.2017.03.046. [DOI] [PMC free article] [PubMed] [Google Scholar]
- 53.Chira S, and Miller LG (2010). Staphylococcus aureus is the most common identified cause of cellulitis: a systematic review. Epidemiol Infect 138, 313–317. 10.1017/S0950268809990483. [DOI] [PubMed] [Google Scholar]
- 54.Raff AB, and Kroshinsky D. (2016). Cellulitis: A Review. JAMA 316, 325–337. 10.1001/jama.2016.8825. [DOI] [PubMed] [Google Scholar]
- 55.Feuerstein R, Kolter J, and Henneke P. (2017). Dynamic interactions between dermal macrophages and Staphylococcus aureus. J Leukoc Biol 101, 99–106. 10.1189/jlb.3MR0316-097RR. [DOI] [PubMed] [Google Scholar]
- 56.Zamboni F, Okoroafor C, Ryan MP, Pembroke JT, Strozyk M, Culebras M, and Collins MN (2021). On the bacteriostatic activity of hyaluronic acid composite films. Carbohydr Polym 260, 117803. 10.1016/j.carbpol.2021.117803. [DOI] [PubMed] [Google Scholar]
- 57.Pirnazar P, Wolinsky L, Nachnani S, Haake S, Pilloni A, and Bernard GW (1999). Bacteriostatic effects of hyaluronic acid. J Periodontol 70, 370–374. 10.1902/jop.1999.70.4.370. [DOI] [PubMed] [Google Scholar]
- 58.Wittrant Y, Gorin Y, Mohan S, Wagner B, and Abboud-Werner SL (2009). Colony-stimulating factor-1 (CSF-1) directly inhibits receptor activator of nuclear factor-kappaB ligand (RANKL) expression by osteoblasts. Endocrinology 150, 4977–4988. 10.1210/en.2009-0248. [DOI] [PMC free article] [PubMed] [Google Scholar]
- 59.Kobayashi T, Voisin B, Kim DY, Kennedy EA, Jo JH, Shih HY, Truong A, Doebel T, Sakamoto K, Cui CY, et al. (2019). Homeostatic Control of Sebaceous Glands by Innate Lymphoid Cells Regulates Commensal Bacteria Equilibrium. Cell 176, 982–997 e916. 10.1016/j.cell.2018.12.031. [DOI] [PMC free article] [PubMed] [Google Scholar]
- 60.Ramilowski JA, Goldberg T, Harshbarger J, Kloppmann E, Lizio M, Satagopam VP, Itoh M, Kawaji H, Carninci P, Rost B, and Forrest AR. (2015). A draft network of ligand-receptor-mediated multicellular signalling in human. Nat Commun 6, 7866. 10.1038/ncomms8866. [DOI] [PMC free article] [PubMed] [Google Scholar]
- 61.Schep AN, Wu B, Buenrostro JD, and Greenleaf WJ (2017). chromVAR: inferring transcription-factor-associated accessibility from single-cell epigenomic data. Nat Methods 14, 975–978. 10.1038/nmeth.4401. [DOI] [PMC free article] [PubMed] [Google Scholar]
Associated Data
This section collects any data citations, data availability statements, or supplementary materials included in this article.
Supplementary Materials
Table S1. Related to Figure 1. Bulk and single-cell RNA-sequencing analysis of dermal and hypodermal leukocytes.
Table S2. Related to Figure 3. Single-cell RNA-sequencing analysis of dermal and hypodermal stromal cells.
Table S3. Related to Figure 4. Criteria and scoring for S. aureus induced cellulitis in mouse skin.
Table S4. Related to Figure 6. In silico ligand-receptor interactions between hypodermal cells.
Table S5. Related to Figure 7. Differentially accessible chromatin regions between hypodermal macrophages clusters.
Data Availability Statement
The accession number for the RNA-seq, scRNA-seq and scATAC-seq data will be provided before publication.