Abstract
Major retinopathies can differentially impact the arteries and veins. Traditional fundus photography provides limited resolution for visualizing retinal vascular details. Optical coherence tomography (OCT) can provide improved resolution for retinal imaging. However, it cannot discern capillary-level structures due to the limited image contrast. As a functional extension of OCT modality, optical coherence tomography angiography (OCTA) is a non-invasive, label-free method for enhanced contrast visualization of retinal vasculatures at the capillary level. Recently differential artery–vein (AV) analysis in OCTA has been demonstrated to improve the sensitivity for staging of retinopathies. Therefore, AV classification is an essential step for disease detection and diagnosis. However, current methods for AV classification in OCTA have employed multiple imagers, that is, fundus photography and OCT, and complex algorithms, thereby making it difficult for clinical deployment. On the contrary, deep learning (DL) algorithms may be able to reduce computational complexity and automate AV classification. In this article, we summarize traditional AV classification methods, recent DL methods for AV classification in OCTA, and discuss methods for interpretability in DL models.
Keywords: Retina, retinopathy, optical coherence tomography angiography, artificial intelligence, machine learning, deep learning, convolutional neural network
Impact Statement
Systemic disease and various retinopathies can differentially impact the arteries and veins. Traditional fundus photographs cannot provide sufficient image resolution and contrast to visualize retinal vascular details. On the contrary, optical coherence tomography angiography (OCTA) can provide high-resolution imaging to reveal subtle microvascular changes. This article summarizes the technical rationale of deep learning for artery–vein (AV) classification in OCTA. The development of automated artificial intelligence for clinical use will foster improved screening of eye disorders.
Introduction
The retina is a neurovascular network that can be a target of eye diseases. Systemic conditions such as diabetes mellitus (DM), hypertension, and inflammatory diseases can also cause retinal neurovascular abnormalities. 1 Many eye diseases in the early stages, such as diabetic retinopathy (DR) and retinal vasculitis, are asymptomatic with regard to visual function. 2 If the retinopathy progresses unchecked, the impairment may be irrecoverable. Therefore, development of quantitative imaging biomarkers is essential for early diagnosis and treatment evaluation. Clinical observations have demonstrated different retinopathies affect arteries and veins differently. For example, arterial narrowing can be observed in DR eyes, 3 whereas vein narrowing at the site of arteriovenous nicking can be observed in patients with atherosclerosis. 4
There are various imaging modalities used to visualize vascular alterations. Traditional fundus photography is used as it requires less time and light for imaging. 5 However, fundus photography lacks the resolution to capture capillary changes. Fluorescein angiography (FA) can be used to enhance vascular alterations, in particular leakage and hyperfluorescence of microaneurysms. 6 However, FA requires the use of exogenous dyes; therefore, it is an invasive procedure. Optical coherence tomography (OCT), on the contrary, is a non-invasive imaging modality that can provide cross-sectional imaging to visualize individual retinal layers. As a functional extension of OCT modality, optical coherence tomography angiography (OCTA) can visualize the retinal vasculatures with high resolution.
Recently, quantitative OCTA feature analysis has been explored for the detection of eye diseases. Chu et al. 7 developed several OCTA features and demonstrated differentiation of various eye diseases, such as non-proliferative diabetic retinopathy (NPDR) and retinal vein occlusion (RVO). By performing OCTA processing, they can derive parameters such as vessel diameter index (VDI) that estimates the vessel width and vessel area density (VAD). Alam et al. 8 further differentiated the vessels into arteries and veins and explored that differential artery–vein (AV) analysis can enhance the staging of NPDR. These observations suggest that there is arterial narrowing and venous dilation in NPDR. Ishibazawa et al. 9 observed greater arterial adjacent non-perfusion compared to venous adjacent non-perfusion in all stages of NPDR. Another study by Alam et al. 10 observed increased venous tortuosity with sickle cell retinopathy (SCR) stage progression. Muraoka et al. 11 observed increased retinal non-perfusion area size in eyes with branch retinal vein occlusion (BRVO) caused by venous narrowing as compared to BRVO caused by arterial narrowing.
Therefore, AV classification in OCTA is a crucial step for quantitative analysis of AV alterations. Current methods for AV classification are primarily based on color fundus photography, as the arteries and veins can be accurately differentiated, whereas in OCTA, the vessels are grayscale. Therefore, these methods require the use of either manual vessel tracking or the employment of complex algorithms for AV classification from color fundus to OCTA. Recent advances in artificial intelligence, specifically the development of deep learning (DL) algorithms, can enable automated AV classification using OCTA images.
In this article, we provide a brief review of DL for AV classification in OCTA of the retina. Following section “Basics of DL,” we describe the basic principles of DL and discuss the differences between classical machine learning (ML) and DL approaches. Section “Traditional methods for AV classification” describes traditional methods for AV classification, where we discuss fundus and OCT-based approaches. In section “DL AV classification,” we review recent studies that involve multimodal and unimodal DL methods for AV classification. Section “Discussion” discusses current limitations and prospective developments for DL AV classification in OCTA.
Basics of DL
Artificial intelligence (AI) is a rapidly developing research area and one branch of AI is ML. The main principle of ML is the development of algorithms that can learn from a data set without being explicitly programed. 12 A recent subset of ML, known as DL, has grown in popularity in recent years and has garnered immense interests in numerous research areas. Commonly, DL refers to the use of a specific algorithm, the convolutional neural network (CNN). The processes of a CNN simulate the human visual pathway. The CNN gets its name from the use of the convolutional layers, which consist of sets of trainable filters that are adept to process spatial patterns. 13 For ML implementation, the user would partition the data set into two categories, the training data set and the testing data set. The training data set is to optimize the algorithm and the testing data set is to evaluate the performance of the algorithm. There are different tasks or applications in which the model can perform, such as classification, the goal of categorizing the data, and regression, the goal of predicting continuous values.
For the implementation of ML algorithms, the pipeline can be broadly divided into two segments. First, data set preparation segment where the image is acquired and digital image processing is performed, such as image filtering to reduce image noise or image binarization for feature extraction. Then, feature extraction and quantification are performed. Features such as VDI or VAD are measured and compiled into a data set. Second, an ML algorithm or model was trained using the compiled training data set. In contrast to traditional ML algorithms, such as the k-nearest neighbors (kNNs) or support vector machine, the input into a CNN is the image itself. The CNN is trained on the image data set and learns how to perform both the feature extraction and classification. Therefore, the user does not have to perform manual feature development and extraction. A comparative illustration of the pipelines for ML and DL is shown in Figure 1. Once the model has been trained, its performance must be evaluated.
Figure 1.
The basic pipelines for (A) traditional machine learning and (B) deep learning models.
Performance metrics
One task that is commonly explored and is the focus of this minireview is pixel-wise classification, also referred to as segmentation. Formally, segmentation is defined as the process of partitioning an image into component regions or objects, thereby the change of representation enables easier analysis of the region of interest in an image. 14 An example is AV classification in retinal photographs. Different retinopathies affect the arteries and veins in separate ways. Therefore, it would be valuable to develop robust and automated AV classification tools to discern AV alterations. In order to evaluate the performance of segmentation models, there are several evaluation metrics that are employed, namely, accuracy, intersection-over-union (IOU) and F1-score, which can be defined as the following
| (1) |
| (2) |
| (3) |
where TP is the true positive, TN is the true negative, FP is the false positive, and FN is the false negative of the vessel segmentation.
In the accuracy metric, there are technically two different classes that are evaluated, that is, the segmented and non-segmented regions. Therefore, the whole image is involved, which can be visualized by Figure 2(A). To determine accuracy, we measure the TP which is the region of overlap between the two circles, and the TN which reflects the white pixels of the image. The disadvantage of accuracy is when there is a class imbalance, that is, the non-segmented region is larger than the segmented region. Therefore, in image segmentation task metrics such as IOU and F1 are commonly used, as each only involves a specific class. Comparative illustration representing IOU and F1 is shown in Figure 2(B) and (C). The value range for accuracy, IOU, and F1 is from 0 to 1. The IOU and F1 metrics can be thought of as the “accuracy” for each individual class, thereby minimizing the effect of class imbalances in performance evaluations.
Figure 2.
Illustration of evaluation metrics, (A) an example image showing the overlap between the two segmentation areas, and of the (B) IOU and (C) F1 metrics.
Interpretability methods
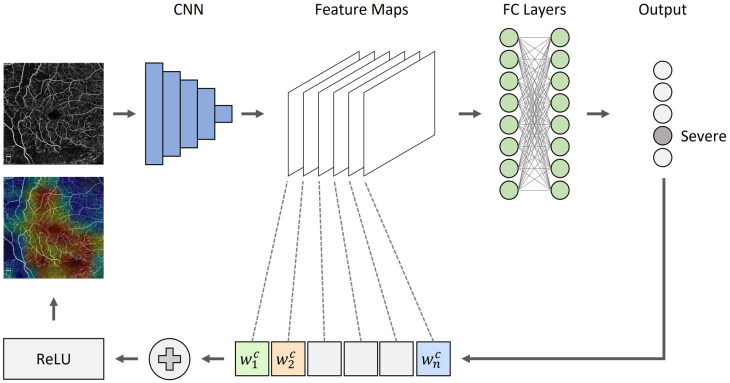
As DL has made significant breakthroughs in multiple tasks such as image classification, object detection, and semantic segmentation, the lack of interpretability can pose a challenge to the adoption of AI tools. For example, if the model fails to predict correctly, without a mechanism to understand the results, technical improvement and usability can diminish. Several studies have explored methods to improve the interpretability of CNNs. Zeiler et al. 15 employed occlusion tests to input images to identify areas of high importance in image classification. This method, however, relies on iterative masking of image regions to produce a heat map, thus requiring high computational power and time. Recently, class activation maps (CAMs) have been favored to identify areas of high importance. 16 CAMs have become popular due to its quick and simple approach of using the convolutional weights and single back propagation. Illustrations of CAM maps are shown in Figure 3. The use of heat maps can help the user to better understand the network predictions and the type of features that are developed.
Figure 3.
An overview of CAMs. Given an image, for example, OCTA image and a class of interest (e.g. “severe”) as input, we forward propagate the image through the CNN part of the model and then task-specific computations are utilized to obtain a raw score for the category. The gradients are set to zero for all classes except the target class (severe), which is set to one. The signal is then backpropagated to the rectified convolutional feature maps of interest, which we then combine together to compute a heatmap.
Traditional methods for AV classification
Fundus methods
Traditionally, fundus photography is the gold standard for AV classification. A fundus photograph contains color information from the oxyhemoglobin and deoxyhemoglobin level, which can be utilized for the AV classification. Therefore, initial studies that endeavor to perform AV classification in OCTA utilized fundus photographs, that is, two imaging modalities. These methods typically first identify the arteries and veins in fundus photographs, and then overlay that information onto the OCTA image.
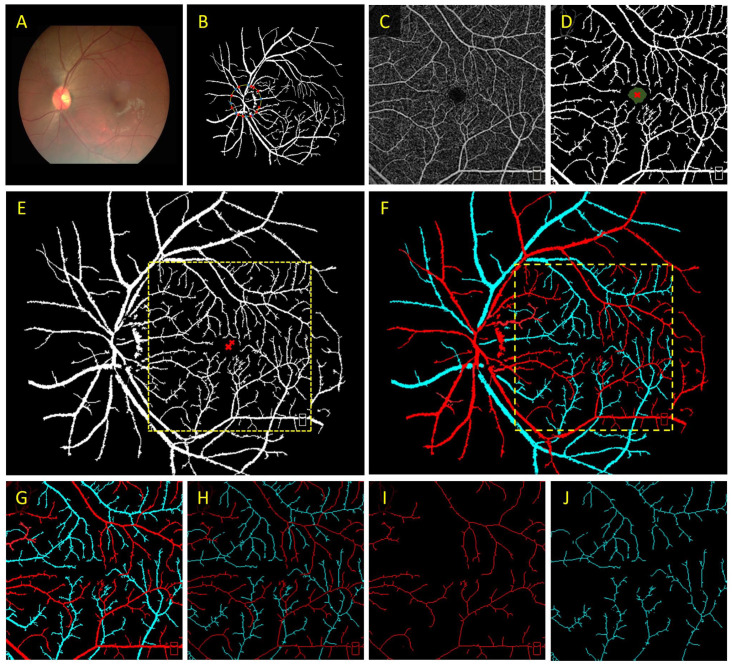
To determine arteries and veins, Alam et al. 17 employed optical density ratio (ODR) to classify artery and veins in color fundus images. In this work, they measured the optical density (OD) of the vessels by taking a ratio of the intensity of the vessel compared to the surrounding background. Then, the ODR between the red and green channels is determined. The rationale behind this is that the red channel is oxygen sensitive, and the green channel is oxygen insensitive. Thus, when comparing the ODR for all of the vessels, the vein ODR is lower than the artery ODR. Based on this methodology, Alam et al. 8 explored the use of color fundus image–guided AV classification in OCTA. In principle, the color fundus contains the information to differentiate arteries and veins. Their proposed method first classified AV nodes around the optic nerve head (ONH). Next, they generated an AV vessel map based on the fundus and a binary vessel map based on the OCTA images. Then, they performed image registration to overlay the two vessel maps. Finally, a vessel tracking algorithm is employed to trace the AV information from the fundus AV map into the OCTA vessel map. The proposed methodology is shown in Figure 4.
Figure 4.
(A) Color fundus image, (B) artery–vein source node classification on a vessel map based on fundus image, (C) OCTA enface image, (D) corresponding binary vessel map, (E) image registration between the fundus and OCTA vessel maps, and (F) AV tracking from fundus into OCTA. (G) Representative AV vessel map, (H) AV skeleton map, (I) artery, and (J) vein skeleton maps.
Source: Modified from Alam et al. 8
OCT methods
While fundus photography can provide information for AV classification, the use of two imaging modalities may be a burden for clinical deployment. In principle, OCTA is derived from OCT and OCT can be used to differentiate arteries and veins. Son et al. 18 leveraged near-infrared oximetry–guided AV classification using OCT. Since OCT contains spectral information, sub-band OCTs corresponding to different spectrums can be generated. In their analysis, they measured the ODs at two different wavelengths, namely, 765 and 855 nm as those two wavelengths have discernible differences in extinction coefficients between oxyhemoglobin and deoxyhemoglobin. They also measured the OD at the isosbestic wavelength of 805 nm. The ODRs of 765 nm/805 nm and 855 nm/805 nm were compared and the result of this study suggests that the ODR determined between wavelengths of 765 nm/805 nm could provide better performance for AV classification.
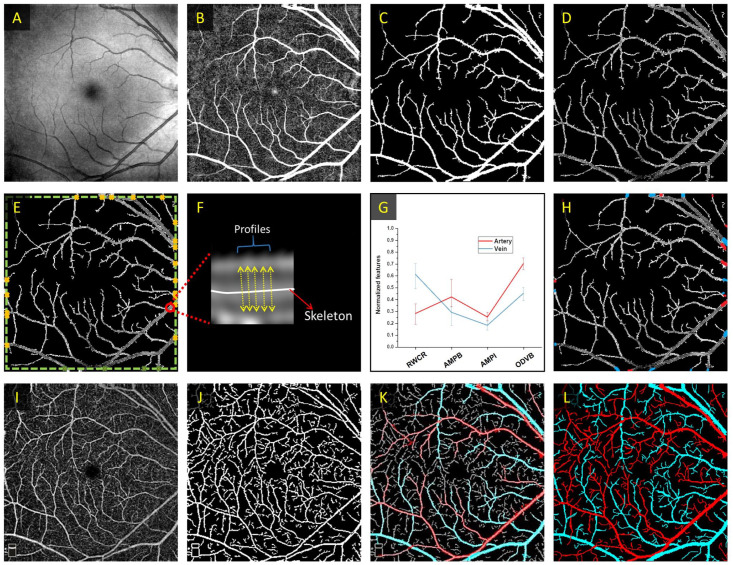
Alam et al. 19 explored the use of OCT-guided AV classification in OCTA. In their methodology, they first identified vessel source nodes at the boundaries of the image, where the vessel width is the largest. In their work, they derived four unique features for AV source node classification, namely, ratio-of-width-to-central-reflex (RWCR), average maximum profile brightness (AMPB), average median profile intensity (AMPI), and optical density of vessel boundary (ODVB). Using these four features, they used a k-means clustering algorithm to classify each source node as artery or vein. An illustration of this method is shown in Figure 5. In both studies, after AV classification in OCT, an OCT-AV vessel map is generated. The OCT-AV vessel map can be overlayed onto the OCTA vessel map, and a vessel tracking algorithm is employed to guide the information from OCT into OCTA.
Figure 5.
Illustration of the OCT-guided AV classification in OCTA. First OCT image processing is performed on (A) a representative OCT enface, resulting in (B) a filtered OCT image, which can be utilized to extract the (C) binarized OCT and (D) segmented OCT vessel maps. Next, the (E) source nodes in the segmented OCT vessel maps are identified, and (F) feature quantification is determined. (G) k-means clustering algorithm is employed on the quantitative features for AV classification. (H) The source nodes are classified as arteries or veins based on the quantitative features. (I) Representative OCTA enface image and (J) corresponding binary OCTA vessel map. (K) The AV map derived from OCT image is overlayed onto (J) and (L) vessel tracking is used to generate an AV map in OCTA.
Source: Modified from Alam et al. 19
The previous methods primarily derived AV features using the enface or lateral projections. Recent studies have demonstrated depth-resolved features can be derived for AV classification. Kim et al. 20 explored the use of vascular morphology and blood flow signatures for differential AV classification in OCT. In their study, they showed that in OCT, the arteries have discernible vessel boundaries, whereas in veins, the boundaries were less apparent. Another set of characteristics is that arterial lumens have homogeneous intensity brightness, and venous lumens have distinct hypo- and hyper-reflective flow signatures. These lumen characteristics were also confirmed in OCTA, suggesting distinct laminar flow patterns in arteries and veins. Their work primarily highlighted the depth-resolved vascular profile features in animal models.
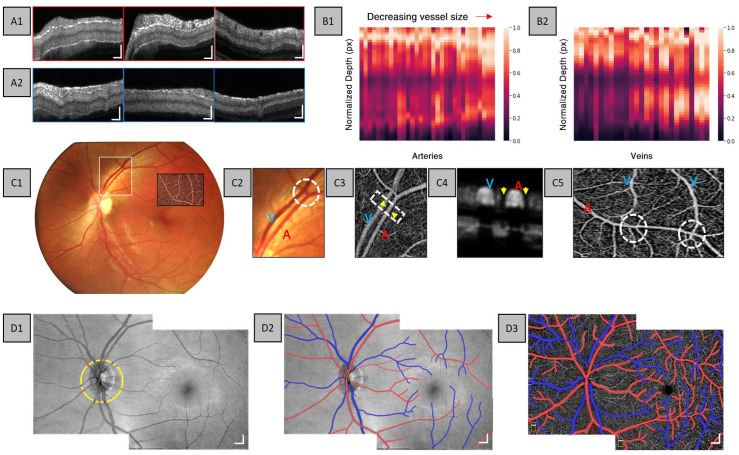
Adejumo et al. 21 explored depth-resolved vascular features in human retina using a commercial OCTA system. The observations in this study showed both hyper-reflective wall boundaries and layered intensity distribution in arteries, whereas there is only a layered intensity distribution in veins (Figure 6(A)). Further analysis into the relationship between vessel boundary and vessel size reveals that as the vessel size decreases, there is a distinct lower hyper-reflective boundary in veins as compared to the hypo-reflective zone in larger veins (Figure 6(B)). This may be due to the merging of small venous to form a large venous branch; therefore, the increase in blood volume may result in OCT signal attenuation. In addition to flow information, Adejumo et al. observed the morphological differences in OCTA between arteries and veins, in particular, they observed distinct capillary-free zones surrounding arteries (Figure 6(C4) and (C5)). Using flow and morphological features in OCT and OCTA, AV classification can be accomplished (Figure 6(D)). These studies highlight that both OCT and OCTA contain important characteristics for AV classification. Therefore, both OCT and OCTA can be used in DL for automated AV classification.
Figure 6.
Representative cross-sectional B-scans for (A1) arteries and (A2) veins at the first, second, and third vessel branches. Normalized intensity maps constructed from (B1) arteries and (B2) veins for various vessel sizes. Representative (C1) fundus image, (C2) enlarged area of the fundus, and (C3) corresponding enlarged area in OCTA. Representative OCTA (C4) cross-sectional view and (C5) enface of capillary-free zone. (D1) Representative montaged OCT enface showing AV source node classification, (D2) AV map in OCT, and (D3) AV map in OCTA.
Source: Modified from Adejumo et al. 21
DL AV classification
In this section, we discuss two different approaches to DL-based AV classification, namely, the multimodal and unimodal AV classification. In the multimodal studies, both OCT and OCTA are combined together to generate an AV map, whereas in the unimodal studies, only OCTA is used as input into the DL model.
Multimodal AV classification
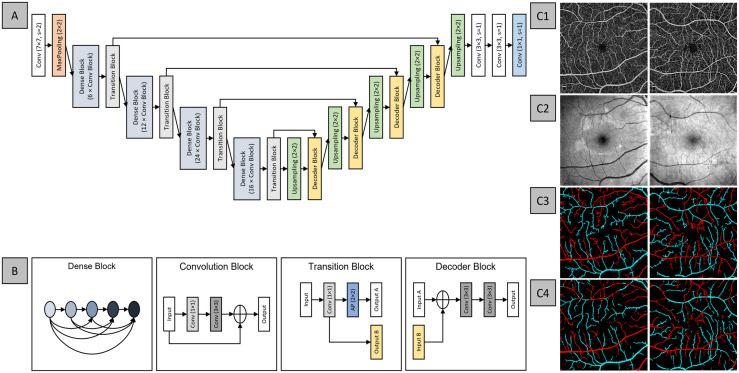
The first DL-based AV classification study proposed AV-Net, a fully CNN for the automated AV classification (Figure 7(A)). 22 This study employed a multimodal training process that involved both OCT and OCTA. The approach inferred that the enface OCT can provide important intensity information for AV classification, and the enface OCTA contains the blood flow information and detailed vascular network, hence the dual modality. AV-Net is comprised of two parts – an encoder and a decoder. The encoder is equivalent to the classification CNNs, such as VGG16, in that it takes in an image input and performs feature extraction. The decoder identifies and maps the image features to produce an output image. Furthermore, this study explored the use of different loss functions and the effects of transfer learning on AV-Net performance. The best performing model reports an average IOU of 70.72% and F1-score of 82.81%, suggesting satisfactory performance. Qualitative observations as shown in Figure 7(C) suggested that since this method relied on pixel-wise classification, there were misclassified pixels in the predicted AV map, and the vessels were more dilated compared to the ground truth.
Figure 7.
Network architecture for AV-Net, (A) overview of the blocks in AV-Net architecture. AV-Net takes in an input of size 320 × 320 with two channels, corresponding to OCTA and OCT and outputs an RGB map of the same size. (B) The representative blocks. Representative examples of (C1) OCTA, (C2) OCT enface images, and (C3) ground truth and (C4) AV-Net-predicted AV map, from healthy and mild DR eye, left and right column, respectively.
Source: Modified from Alam et al. 22
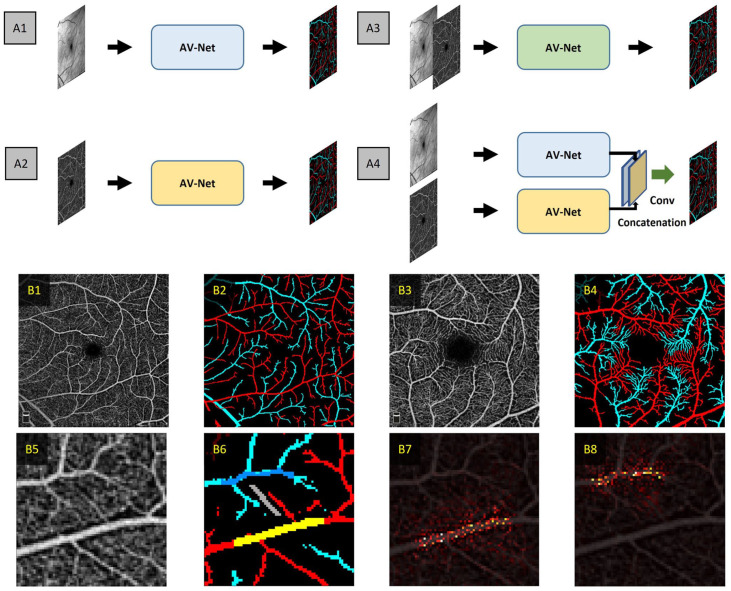
In a subsequent study by Abtahi et al., 23 they further explored fusion operations using AV-Net. In their study, they evaluated individual modality inputs, that is, OCT and OCTA only architectures, and the effects on distinct stages of modality fusion, that is, early and late-stage fusion. Their collective network architectures were termed MF-AV-Net and are illustrated in Figure 8(A). Their study also included the use of both 6 mm × 6 mm and 3 mm × 3 mm field-of-view (FOV) OCTA images. In this study, they revealed that OCTA-only architecture and OCT-OCTA early and late-stage fusion yielded competitive performances. However, the best performing network architecture was the late-stage fusion architecture, yielding an accuracy of 96.02% and 94.00% for the 6 mm × 6 mm and 3 mm × 3 mm OCTA data sets, respectively. The MF-AV-Net on the 3 mm × 3 mm data set was able to reveal AV at capillary level detail (Figure 8(B4)).
Figure 8.
(A) Representative architectures for AV classification using (A1) OCT-only architecture, (A2) OCTA-only architecture, (A3) early fusion OCT-OCTA, and (A4) late fusion OCT-OCTA architectures. Representative (B1) 6 mm × 6 mm OCTA image and (B2) corresponding AV map. Representative (B3) 3 mm × 3 mm OCTA and (B4) corresponding AV map. Representative (B5) zoomed OCTA image showing capillary-free zone, (B6) corresponding AV map and zoomed in area of (B5) and the saliency maps for (B7) arteries and (B8) veins corresponding to the yellow area and the dark blue areas, respectively.
Source: Modified from Abtahi et al. 23
Unimodal AV classification
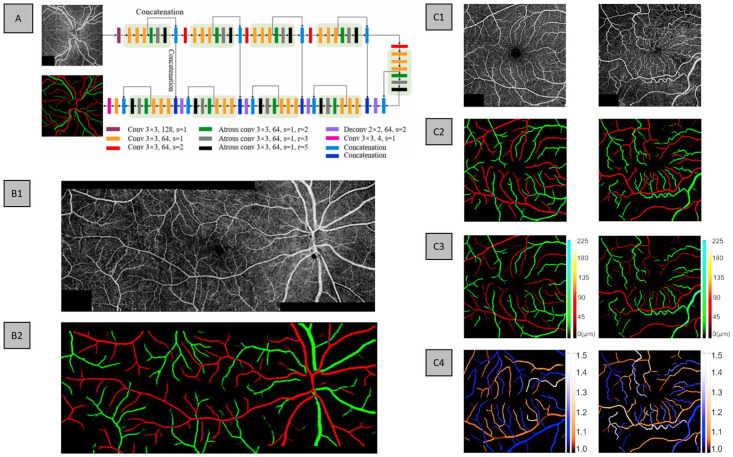
In the study by Gao et al., 24 they proposed a DL-based method to differentiate arteries from veins in montaged wide-field OCTA. Where they proposed a CNN entitled classification of artery and vein network (CAVnet) that can classify AV using 6 mm × 17 mm wide-field OCTA images. In their data set, for each eye, three scans were taken, namely, the macular and the adjacent nasal and temporal areas. As a unimodal method, their input receives single channel, grayscale OCTA images and outputs a multichannel AV map. For training purposes, individual 6 mm × 6 mm OCTA images were used as input, as it allowed easier use of data augmentation in the form of random flips, horizontal and vertical, and transpositions. For testing individual (6 mm × 6 mm) or wide-field images (6 mm × 17 mm) can be used. To validate CAVnet, the authors used a data set composed of healthy, diabetic patients with no retinopathy, DR, and BRVO. In addition, they validated CAVnet on a different imaging device with a different FOV, that is, 9 mm × 9 mm. To generate the ground truth for their data set, they used fundus photography for AV classification. The CAVnet architecture is based on a U-shaped architecture, with the addition of atrous convolutions to improve the receptive field of their network. The design of CAVnet is illustrated in Figure 9(A). The authors also explored the use of DL-predicted AV maps to generate vessel caliber and tortuosity maps in healthy and diseased eyes, demonstrating the clinical application of automated DL AV methods (Figure 9(C)).
Figure 9.
(A) CAVnet architecture with example input OCTA image and corresponding ground truth. An example of (B1) montage OCTA and (B2) CAVnet-predicted AV map for a severe/PDR eye. (C) Examples of healthy and BRVO eyes, (C1) OCTA input, (C2) ground truth, (C3) vessel caliber map, and (C4) vessel tortuosity map.
Source: Modified from Gao et al. 24
For quantitative evaluation, on the 6 mm × 6 mm test data set, CAVnet achieved an average F1-score and IOU of 94.2% and of 89.3% for arteries, respectively, and 94.1% and 89.2% for veins, respectively. On the 9 mm × 9 mm test data set, CAVnet achieved an average F1-score and IOU of 92.6% and 86.4% for arteries, respectively, and 92.1% and 85.5% for veins, respectively. While the performance on the 9 mm × 9 mm is slightly worse than the 6 mm × 6 mm, as the FOV is different from the trained data set, it suggests good generalizability. Overall, CAVnet demonstrates robust performance on eyes with different disease states, different imaging devices, and different FOVs. Qualitatively, the network reported reliable performance to predict both large and small vessels (Figure 9(B2)). However, similar to AV-Net, CAVnet follows a pixel-wise classification network; therefore, CAVnet can mislabel various pixels/areas (Figure 9(B2)). Furthermore, there are areas in the prediction with discontinuity between vessels.
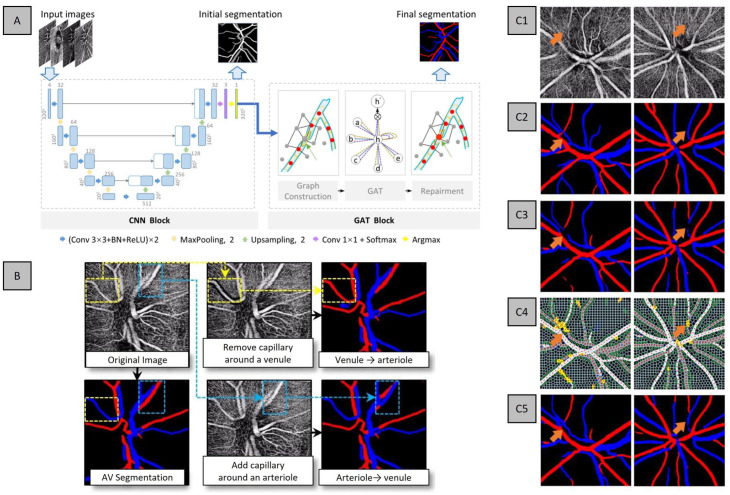
In the study by Xu et al., 25 they proposed a cascaded neural network to automatically segment and differentiate AV solely based on OCTA. In their design, they involved two different blocks – a CNN block to generate an initial segmentation and a graph neural network (GNN) block that corrects the discontinuities of the initial segmentation. The authors collectively termed their method as AV-casNet (Figure 10(A)). The CNN block is based on a U-Net architecture that takes in the initial input of OCTA, which performs early fusion of different enface projections, namely, from the vitreous, optic nerve head (ONH), peripapillary capillary and choroid, and outputs a preliminary AV segmentation. The output of the CNN block is the input into the GNN block. The GNN block is further divided into two steps: (1) the superpixel and graph construction and (2) the graph attention network (GAT), a neural network that operates on graph-structured data. 26 The superpixel construction step takes the initial segmentation and generates a superpixel image. Next, the graph construction determines the candidate superpixels for vessel repairment. Then, a GAT performs the vessel repairment. Examples of the images are shown in Figure 10(C).
Figure 10.
(A) Network architecture of AV-casNet and (B) qualitative analysis of capillary-free zone for AV classification and representative examples of inputs and output of AV-casNet. Representative (C1) OCTA ONH, (C2) ground truth, (C3) initial output of CNN block, (C4) vessel repairment with the GNN block, where the yellow pixels represent repaired blood vessels from the GNN block, and (C5) the final vessel segmentation.
Source: Modified from Xu et al. 25
The data set used to train and validate the proposed AV-casNet is comprised of healthy control subjects with OCTA scans centered at the ONH, with images taken with 3 mm × 3 mm and 6 mm × 6 mm FOVs. Ground truths were established using fundus photography. Several ablation studies were conducted, namely, the comparison of different CNN architectures, for example, U-Net, DeepLabV3, TransU-Net, and different GNN architectures, that is, GAT and GATv2. All CNN architectures yielded competitive performances; however, U-Net was chosen by the authors due to its high specificity and lower network complexity. For their GNN architectures, GATv2 had superior performance over GAT. Therefore, the final AV-casNet utilized U-Net and GATv2 for their CNN and GNN blocks, respectively.
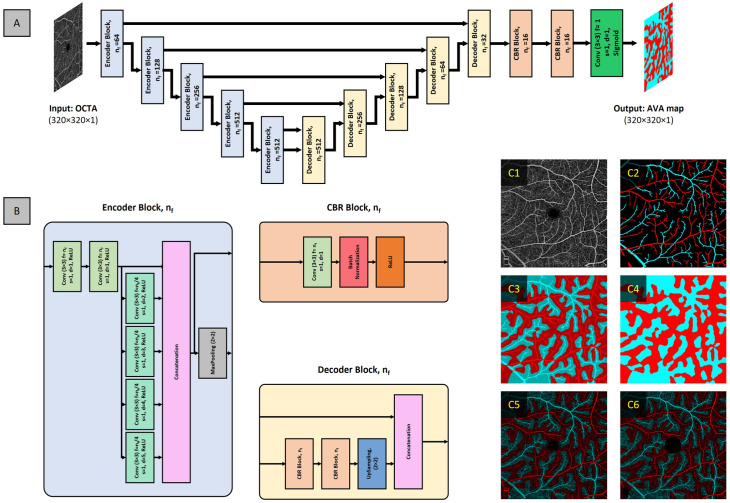
Current available methods for differential AV analysis are limited to the binarization of the retinal vasculature in OCTA. Recent studies demonstrate the use of vessel signal intensity, such as flux, has improved sensitivity to detect vascular perfusion abnormalities.27,28 Therefore, Abtahi et al., 29 proposed AVA-Net, a unimodal CNN model to segment artery–vein area (AVA) in OCTA. The AVA-Net design follows the encoder–decoder architecture; the encoder network utilizes atrous convolutions to increase the receptive field of each layer. The input into AVA-Net is OCTA enface and the output is grayscale AVA map, since AVA-Net is a binary classifier, that is, two categories (Figure 11(A)).
Figure 11.
(A) Network architecture of AVA-Net, (B) block components of AVA-Net, and representative images of (C1) input OCTA image, (C2) initial AV map, (C3) kNN classification overlayed on AV map, (C4) AVA map, (C5) AVA map overlayed on OCTA, and (C6) AVA OCTA map with removal of foveal avascular zone and layer indicator.
Source: Modified from Abtahi et al. 29
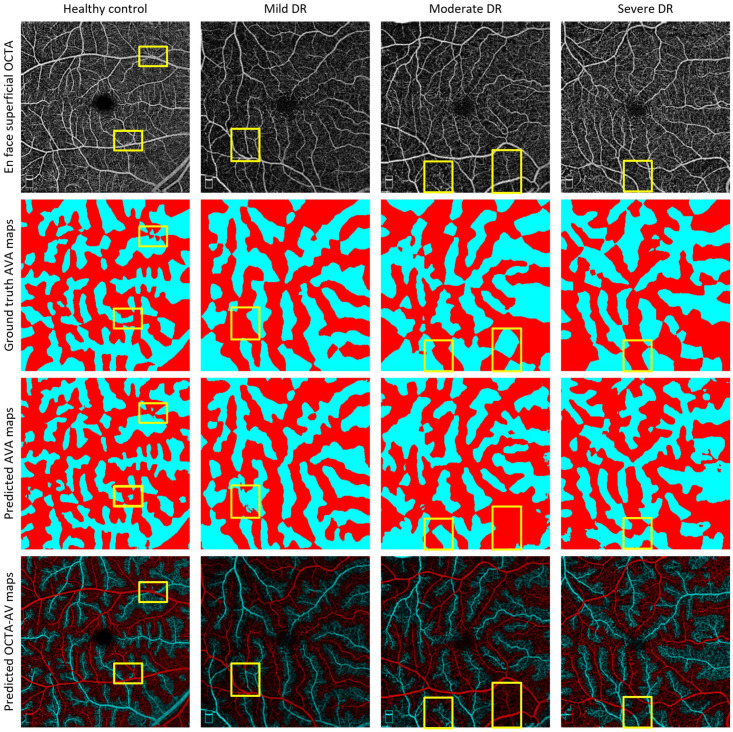
The data set was comprised of healthy subjects and diabetic patients without retinopathy (NoDR) and with NPDR (mild, moderate, and severe). Examples of AVA-Net performance on the different NPDR stages can be visualized in Figure 12. To generate their ground truths, they used manually generated AV maps and performed kNN classification on background pixels (Figure 11(C)). Based on their cross-validation results, they reported an average IOU, F1, and accuracy of 78.02%, 87.65%, and 86.33%, respectively. In addition to their novel AVA-Net design, they performed quantitative analysis of a variety of unique features, such as perfusion intensity density ratio (PIDR) and artery–vein area ratio (AVAR), on the early stages of DR, that is, control, NoDR, and mild NPDR. Their study reported that the AV-PIDR quantitative feature is the best feature to differentiate all stages in early DR.
Figure 12.
Representative images of AVA-Net segmentation for healthy controls, mild, moderate, and severe DR eyes. Row 1: OCTA images, row 2: ground truth AVA maps, row 3: predicted AVA maps from AVA-Net, and row 4: overlayed predicted AVA maps onto OCTA. Yellow rectangles indicate some areas that are segmented incorrectly.
Source: Modified from Abtahi et al. 29
Discussion
Classification of arteries and veins has been established in traditional imaging modalities, such as fundus photography and OCTA due to the color and morphological information that can be used for AV differentiation. However, fundus photography and OCT cannot provide high detailed visualization of the vasculature. OCTA, on the contrary, is a strategy for non-invasive, high-resolution examination of retinal vasculature at the microcapillary level. Differential AV analysis in OCTA has been explored and shows tremendous potential for screening and diagnosis purposes. Methods for AV classification in OCTA have been established using fundus photography and OCT-based methods. However, the use of multiple imagers and the complexity of these algorithms make clinical deployment challenging. DL can be an alternative for automated AV classification in OCTA.
Multimodal and unimodal approaches
In this research field, two types of DL-based AV classification have been explored, namely, multimodal and unimodal approaches. Multimodal approaches utilized fusion strategies for AV classification using OCT and OCTA. These approaches are based on previous established works that suggest that OCT is needed as it provides the intensity information to differentiate arteries and veins. Alam et al. 22 first demonstrated AV classification in OCTA by employing early fusion of OCT and OCTA with 6 mm × 6 mm FOV. 22 The approach by Abtahi et al. further explored the differences in fusion strategies, namely, early and late fusion. In the early fusion approach, the raw input data are combined into a single representative before the feature extraction process. 30 Whereas, in the late fusion, feature extraction was performed on each modality separately before combining the information together. They demonstrated that the late fusion of OCT and OCTA had the best performance in AV classification and further demonstrated the ability for capillary-level AV classification in 3 mm × 3 mm FOV.
Some studies have recently demonstrated unimodal AV classification using OCTA images. Gao et al. demonstrated the use of OCTA only on wide-field OCTA scans for the classification of arteries, veins, and the AV intersection. The study yielded competitive performance. However, in AV segmentation using CNNs, the algorithms primarily utilized pixel-wise segmentation and thus were prone to misclassification and discontinuity in vessel structure. An interesting approach by Xu et al. adapted a multistep, multilayer approach for AV classification, namely, the CNN and GNN blocks of their method. The CNN block utilized an early fusion of four OCTA enface projections at different depths. The output of the CNN block was the input into the GNN block to correct regions of vessel discontinuity. Recent studies by Kim et al. 20 and Adejumo et al. 21 have corroborated that there are unique flow patterns to distinguish arteries and veins in OCTA, and further morphological differences, that is, the appearance of capillary-free zones in arteries. Therefore, reasons that for unimodal AV classification in OCTA, the DL model can use these features for accurate classification.
Interpretability of DL models
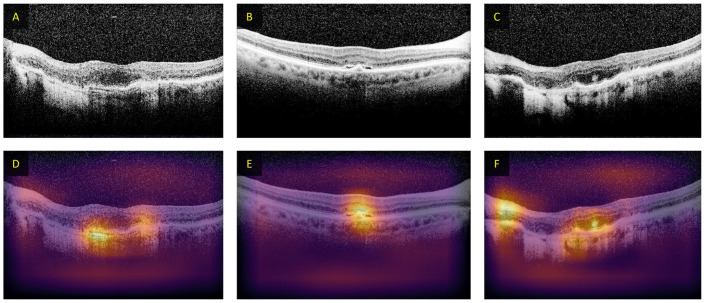
While DL offers benefit to decrease burden in manual feature development and ease of usability, DL models have low interpretability. Since the user does not know what types of features are being learned and used to make the prediction. For AV classification using unimodal methods, it would be beneficial to understand the features that the CNN uses for its prediction. In particular, since it was believed that OCTA does not contain the necessary color information for AV classification, as compared to fundus photography or OCT. Different methods have been explored to increase the DL interpretability, such as occlusion test. 31 In occlusion tests, the areas of the input image are iteratively removed and then processed by the CNN, resulting in a heatmap showing areas that result in misprediction. An example of occlusion-based heatmaps in CNN-based classification of OCT images is shown in Figure 13.
Figure 13.
Examples of heatmaps from occlusion testing on OCT B-scans for patients with AMD. (A–C) The input images and (D–F) the occlusion maps from the DL algorithm. The intensity of the color indicates decreased probability of being labeled AMD when occluded.
Source: Modified from Lee et al. 39
In the context of AV classification, to better understand the features, Xu et al. 25 explored the inclusion and exclusion of capillary-free zone for AV classification. They observed that if they removed the capillary-free zones surrounding arteries, that is, artificial addition of capillaries, the CNN would predict the vessel as veins, and likewise, if the capillary-free zone surrounding the veins were added, that is, artificial removal of capillaries, the CNN would predict the vessel as arteries. The results of this experiment are illustrated in Figure 10(B). These methods helped to interpret the DL model. However, they can be computationally intensive since heavy image modification is required. Another method commonly used to interpret CNNs is CAMs,32,33 which accentuate areas of the input image that contributes most to the prediction using the weights of the CNN to highlight important pixels that are associated with the classification. Abtahi et al. utilized CAMs to identify features in OCTA images that were responsible for AV segmentation. The heat map analysis revealed that the pixels that were most strongly associated with the classification are located both within the vessel and adjacent. They therefore speculated that capillary-free zones and OCTA blood flow pattern in OCTA may be features for AV segmentation. These observations suggest that OCTA only may contain the necessary information for DL AV classification. The implementation of these algorithms to increase the interpretability of DL models can help foster better confidence for clinical deployment.
Current limitations and challenges
Although DL has shown great promise for AV classification in OCTA, there are still some limitations and challenges that need to be addressed. One major limitation is that most studies have used data sets from a single OCTA device, which may introduce biases due to differences in OCTA construction methods. In addition, DL-based AV classification has been demonstrated on a limited number of disease conditions, mainly for DR22–24,29 and BRVO. 24 This highlights the need for further research to investigate the generalizability of DL models to different eye conditions and OCTA devices.
Challenges in AV classification using DL include ground truth generation and misclassification in the final prediction. Since all the DL implementations discussed rely on supervised learning, the performance of the model is heavily dependent on the quality of the ground truth used to optimize it. Most ground truth methods depend on fundus photography, which provides color information to identify arteries and veins. However, due to the limited resolution of fundus photographs, the vascular detail of the ground truths may be significantly less than that present in OCTA images. In addition, vessel segmentation is needed for ground truth preparation, which typically involves subjective thresholding, 34 resulting in variable vessel size and detail. The use of biomarkers such as the capillary-free zone to manually delineate the arteries and veins may be altered in the disease state, decreasing its reliability. 35 Therefore, future research should explore reliable quantitative methods for manual AV classification, such as using vessel tracking in fundus-guided or OCT-guided AV classification.8,36
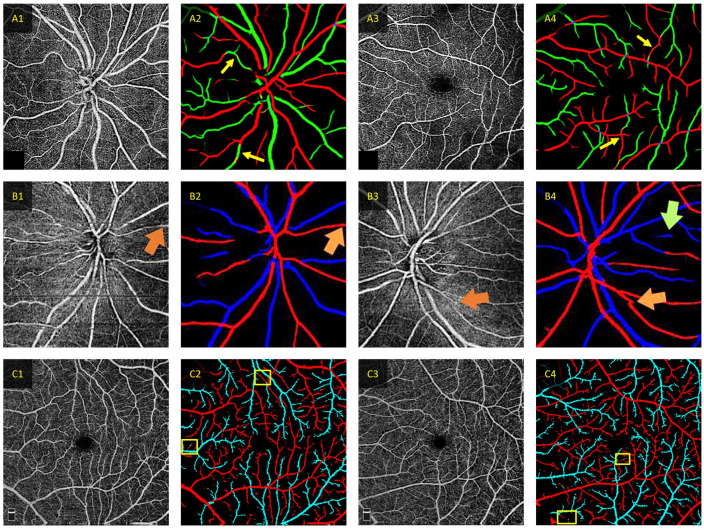
Most recent studies utilized DL models that perform pixel-wise classification of AV, which can result in misclassification of various pixels within a correctly classified vessel.22,24 Recent studies have employed additional steps to correct vessel discontinuity, such as employing a GNN to repair discontinuous vessels.37,38 However, these methods do not fully address the pixel-wise misclassification (Figure 14). Future research should explore error correction techniques to DL-predicted AV maps, such as training a secondary DL model to specialize in correcting misclassified pixels.
Figure 14.
Examples of correct and incorrect classification for different deep learning AV classification models. (A) Representative predictions from CAVnet. The yellow arrows denote areas of segmentation error in the predicted AV maps. Mis-segmentation from CAVnet may be due to the overfitting of artery–vein alternation or when the capillary-free zone is not discernible. The red and green pixels in (A2) and (A4) signify arteries and veins, respectively (Source: Modified from Gaoet al. 24 ). (B) Representative misclassification in AV-casNet. The orange arrow indicates area of discontinuity that the GAT repairment was able to correct, and the green arrow indicates a misprediction. The red and blue pixels in (B2) and (B4) signify arteries and veins, respectively (Source: Modified from Xu et al. 25 ). (C) Representative predictions from MF-AV-Net using OCTA-only inputs. Where the yellow boxes area of mispredictions. The red and cyan pixels in (C2) and (C4) signify arteries and veins, respectively (Source: Modified from Abtahi et al. 23 ).
Future direction
Future research in DL-based AV classification should focus on addressing the limitations and challenges discussed above. For example, researchers should validate DL AV classification with a variety of different eye conditions acquired from different OCTA devices to demonstrate robustness for clinical implementation. In addition, the use of AV areas can circumvent the need for variable thresholding methods to generate AV maps. Moreover, exploring error correction techniques to DL-predicted AV maps can improve the accuracy of the classification. Overall, there are many different directions for future research in DL-based AV classification.
Conclusions
OCTA provides a non-invasive label-free solution for high-resolution imaging of the retinal vasculature. Various diseases affect the arteries and veins differently. Therefore, differential AV feature analysis in OCTA has been developed for visualizing vascular alterations of various eye conditions. The key step for differential AV analysis is AV classification. DL is perfectly suited to perform automated AV classification in OCTA. AI-based technologies can alleviate the burden for experienced physicians and foster mass screening programs.
Footnotes
Authors’ Contributions: DL and XY contributed to the conceptualization. DL and MA contributed to writing – original draft preparation. DL, MA, TS, TA, BE, AD, and XY contributed to writing – review and editing. XY contributed to the supervision. All authors have read and agree to the published version of the manuscript.
The author(s) declared no potential conflicts of interest with respect to the research, authorship, and/or publication of this article.
Funding: The author(s) disclosed receipt of the following financial support for the research, authorship, and/or publication of this article: This study was supported by the National Eye Institute (R01 EY030842, R01 EY030101, R01 EY023522, R01 EY029673, P30 EY001792), the Research to Prevent Blindness, and the Richard and Loan Hill Endowment.
ORCID iDs: David Le  https://orcid.org/0000-0003-3772-1875
Behrouz Ebrahimi  https://orcid.org/0000-0003-3390-7330
Taeyoon Son  https://orcid.org/0000-0001-7273-5880
Xincheng Yao  https://orcid.org/0000-0002-0356-3242
References
- 1. Xu H, Chen M. Targeting the complement system for the management of retinal inflammatory and degenerative diseases. Eur J Pharmacol. 2016;787:94–104 [DOI] [PMC free article] [PubMed] [Google Scholar]
- 2. Rosenbaum JT, Sibley CH, Lin P. Retinal vasculitis. Curr Opin Rheumatol 2016;28:228–35 [DOI] [PMC free article] [PubMed] [Google Scholar]
- 3. Wong TY, Klein R, Sharrett AR, Schmidt MI, Pankow JS, Couper DJ, Klein BE, Hubbard LD, Duncan BB. ARIC Investigators. Retinal arteriolar narrowing and risk of diabetes mellitus in middle-aged persons. JAMA 2002;287:2528–33 [DOI] [PubMed] [Google Scholar]
- 4. Fraenkl SA, Mozaffarieh M, Flammer J. Retinal vein occlusions: the potential impact of a dysregulation of the retinal veins. EPMA J 2010;1:253–61 [DOI] [PMC free article] [PubMed] [Google Scholar]
- 5. Williams GA, Scott IU, Haller JA, Maguire AM, Marcus D, McDonald HR. Single-field fundus photography for diabetic retinopathy screening: a report by the American Academy of Ophthalmology. Ophthalmology 2004;111:1055–62 [DOI] [PubMed] [Google Scholar]
- 6. Ruia S, Tripathy K. Fluorescein angiography [Internet]. Treasure Island, FL: StatPearls Publishing, 2022 [PubMed] [Google Scholar]
- 7. Chu Z, Lin J, Gao C, Xin C, Zhang Q, Chen C-L, Roisman L, Gregori G, Rosenfeld PJ, Wang RK. Quantitative assessment of the retinal microvasculature using optical coherence tomography angiography. J Biomed Opt 2016;21:066008. [DOI] [PMC free article] [PubMed] [Google Scholar]
- 8. Alam M, Toslak D, Lim JI, Yao X. Color fundus image guided artery–vein differentiation in optical coherence tomography angiography. Invest Ophthalmol Vis Sci 2018;59:4953–62 [DOI] [PMC free article] [PubMed] [Google Scholar]
- 9. Ishibazawa A, De Pretto LR, Alibhai AY, Moult EM, Arya M, Sorour O, Mehta N, Baumal CR, Witkin AJ, Yoshida A. Retinal nonperfusion relationship to arteries or veins observed on widefield optical coherence tomography angiography in diabetic retinopathy. Invest Ophthalmol Vis Sci 2019;60:4310–8 [DOI] [PMC free article] [PubMed] [Google Scholar]
- 10. Alam M, Lim JI, Toslak D, Yao X. Differential artery–vein analysis improves the performance of OCTA staging of sickle cell retinopathy. Transl Vis Sci Technol 2019;8:33. [DOI] [PMC free article] [PubMed] [Google Scholar]
- 11. Muraoka Y, Tsujikawa A. Arteriovenous crossing associated with branch retinal vein occlusion. Jpn J Ophthalmol 2019;63:353–64 [DOI] [PubMed] [Google Scholar]
- 12. Samuel AL. Some studies in machine learning using the game of checkers. IBM J Res Dev 2000;44:206–26 [Google Scholar]
- 13. Thompson AC, Jammal AA, Medeiros FA. A review of deep learning for screening, diagnosis, and detection of glaucoma progression. Transl Vis Sci Technol 2020;9:42. [DOI] [PMC free article] [PubMed] [Google Scholar]
- 14. Kuruvilla J, Sukumaran D, Sankar A, Joy SP. A review on image processing and image segmentation. In: 2016 international conference on data mining and advanced computing (SAPIENCE), Ernakulam, India, 16–18 March 2016, pp.198–203. IEEE [Google Scholar]
- 15. Zeiler MD, Fergus R. Visualizing and understanding convolutional networks. In: European conference on computer vision, Zurich, Switzerland, 6–12 September 2014, pp. 818–33. Zurich, Switzerland: Springer [Google Scholar]
- 16. Jung H, Oh Y. Towards better explanations of class activation mapping. In: Proceedings of the IEEE/CVF international conference on computer vision, 1–17 October 2021, pp.1336–44. IEEE [Google Scholar]
- 17. Alam M, Son T, Toslak D, Lim JI, Yao X. Combining ODR and blood vessel tracking for artery–vein classification and analysis in color fundus images. Transl Vis Sci Technol 2018;7:23. [DOI] [PMC free article] [PubMed] [Google Scholar]
- 18. Son T, Alam M, Kim TH, Liu C, Toslak D, Yao X. Near infrared oximetry-guided artery–vein classification in optical coherence tomography angiography. Exp Biol Med (Maywood) 2019;244:813–8 [DOI] [PMC free article] [PubMed] [Google Scholar]
- 19. Alam M, Toslak D, Lim JI, Yao X. OCT feature analysis guided artery–vein differentiation in OCTA. Biomed Opt Express 2019;10:2055–66 [DOI] [PMC free article] [PubMed] [Google Scholar]
- 20. Kim T-H, Le D, Son T, Yao X. Vascular morphology and blood flow signatures for differential artery–vein analysis in optical coherence tomography of the retina. Biomed Opt Express 2021;12:367–79 [DOI] [PMC free article] [PubMed] [Google Scholar]
- 21. Adejumo T, Kim T-H, Le D, Son T, Ma G, Yao X. Depth-resolved vascular profile features for artery–vein classification in OCT and OCT angiography of human retina. Biomed Opt Express 2022;13:1121–30 [DOI] [PMC free article] [PubMed] [Google Scholar]
- 22. Alam M, Le D, Son T, Lim JI, Yao X. AV-Net: deep learning for fully automated artery–vein classification in optical coherence tomography angiography. Biomed Opt Express 2020;11:5249–57 [DOI] [PMC free article] [PubMed] [Google Scholar]
- 23. Abtahi M, Le D, Lim JI, Yao X. MF-AV-Net: an open-source deep learning network with multimodal fusion options for artery–vein segmentation in OCT angiography. Biomed Opt Express 2022;13:4870–88 [DOI] [PMC free article] [PubMed] [Google Scholar]
- 24. Gao M, Guo Y, Hormel TT, Tsuboi K, Pacheco G, Poole D, Bailey ST, Flaxel CJ, Huang D, Hwang TS, Jia Y. A deep learning network for classifying arteries and veins in montaged widefield OCT angiograms. Ophthalmol Sci 2022;2:100149. [DOI] [PMC free article] [PubMed] [Google Scholar]
- 25. Xu X, Yang P, Wang H, Xiao Z, Xing G, Zhang X, Wang W, Xu F, Zhang J, Lei J. AV-casNet: fully automatic arteriole–venule segmentation and differentiation in OCT angiography. IEEE Trans Med Imag 2022;42:481–92 [DOI] [PubMed] [Google Scholar]
- 26. Velickovic P, Cucurull G, Casanova A, Romero A, Lio P, Bengio Y. Graph attention networks. In : 6th international conference on learning representations, ICLR 2018 – conference track proceedings, Vancouver, BC, Canada, 30 April–3 May 2018 [Google Scholar]
- 27. Kushner-Lenhoff S, Li Y, Zhang Q, Wang RK, Jiang X, Kashani AH. OCTA derived vessel skeleton density versus flux and their associations with systemic determinants of health. Invest Ophthalmol Vis Sci 2022;63:19. [DOI] [PMC free article] [PubMed] [Google Scholar]
- 28. Dadzie AK, Le D, Abtahi M, Ebrahimi B, Son T, Lim JI, Yao V. Normalized blood flow index in optical coherence tomography angiography provides a sensitive biomarker of early diabetic retinopathy. Transl Vis Sci Technol 2023;12:3. [DOI] [PMC free article] [PubMed] [Google Scholar]
- 29. Abtahi M, Le D, Ebrahimi B, Dadzie AK, Lim JI, Yao X. An open-source deep learning network AVA-Net for arterial-venous area segmentation in optical coherence tomography angiography. Commun Med 2023;3:54. [DOI] [PMC free article] [PubMed] [Google Scholar]
- 30. Boulahia SY, Amamra A, Madi MR, Daikh S. Early, intermediate and late fusion strategies for robust deep learning-based multimodal action recognition. Mach Vis Appl 2021;32:1–18 [Google Scholar]
- 31. Kermany DS, Goldbaum M, Cai W, Valentim CC, Liang H, Baxter SL, McKeown A, Yang G, Wu X, Yan F. Identifying medical diagnoses and treatable diseases by image-based deep learning. Cell 2018;172:1122–31.e9 [DOI] [PubMed] [Google Scholar]
- 32. Nagasato D, Tabuchi H, Masumoto H, Enno H, Ishitobi N, Kameoka M, Niki M, Mitamura Y. Automated detection of a nonperfusion area caused by retinal vein occlusion in optical coherence tomography angiography images using deep learning. PLoS ONE 2019;14:e0223965 [DOI] [PMC free article] [PubMed] [Google Scholar]
- 33. Heisler M, Karst S, Lo J, Mammo Z, Yu T, Warner S, Maberley D, Beg MF, Navajas EV, Sarunic MV. Ensemble deep learning for diabetic retinopathy detection using optical coherence tomography angiography. Transl Vis Sci Technol 2020;9:20. [DOI] [PMC free article] [PubMed] [Google Scholar]
- 34. Mehta N, Liu K, Alibhai AY, Gendelman I, Braun PX, Ishibazawa A, Sorour O, Duker JS, Waheed NK. Impact of binarization thresholding and brightness/contrast adjustment methodology on optical coherence tomography angiography image quantification. Am J Ophthalmol 2019;205:54–65 [DOI] [PubMed] [Google Scholar]
- 35. Tang W, Liu W, Guo J, Zhang L, Xu G, Wang K, Chang Q. Wide-field swept-source OCT angiography of the periarterial capillary-free zone before and after anti-VEGF therapy for branch retinal vein occlusion. Eye Vis 2022;9:25. [DOI] [PMC free article] [PubMed] [Google Scholar]
- 36. Alam M, Son T, Toslak D, Lim J, Yao X, Tech TVS. Combining optical density ratio and blood vessel tracking for automated artery–vein classification and quantitative analysis in color fundus images. Trans Vis Sci Tech 2018;7:23. [DOI] [PMC free article] [PubMed] [Google Scholar]
- 37. Huang Y-H, Jia X, Georgoulis S, Tuytelaars T, Van Gool L. Error correction for dense semantic image labeling. In: Proceedings of the IEEE conference on computer vision and pattern recognition workshops, 18–22 June 2018, Salt Lake City, UT, USA, pp.998–1006. Salt Lake City, UT: IEEE [Google Scholar]
- 38. Xie Y, Zhang J, Lu H, Shen C, Xia Y. SESV: accurate medical image segmentation by predicting and correcting errors. IEEE Trans Med Imag 2020;40:286–96 [DOI] [PubMed] [Google Scholar]
- 39. Lee CS, Baughman DM, Lee AY. Deep learning is effective for the classification of OCT images of normal versus age-related macular degeneration. Ophthalmol Retina 2017;1:322–7 [DOI] [PMC free article] [PubMed] [Google Scholar]


