Abstract
Imaging flow cytometry combines the high throughput nature of flow cytometry with the advantages of single cell image acquisition associated with microscopy. The measurement of large numbers of features from the resulting images provides rich datasets which have resulted in a wide range of novel biomedical applications. In this primer we discuss the typical imaging flow instrumentation, the form of data acquired and the typical analysis tools that can be applied to this data. Using examples from the literature we discuss the progression of the analysis methods that have been applied to imaging flow cytometry data. These methods start from the use of simple single image features and multiple channel gating strategies, followed by the design and use of custom features for phenotype classification, through to powerful machine and deep learning methods. For each of these methods, we outline the processes involved in analyzing typical datasets and provide details of example applications. Finally we discuss the current limitations of imaging flow cytometry and the innovations which are addressing these challenges.
Introduction
Conventional flow cytometry is a widespread and powerful technique for the measurement of the light scatter and fluorescence from cells stained with phenotypic and functional markers 1,2. Cells are directed at high speed past laser excitation sources, collection optics and detectors allowing sampling rates of more than 10,000 cells per second, from in excess of 30 wavelength channels. The level of fluorescence intensity measured from each channel can subsequently be used to identify cells with various phenotypes of interest, using a range of multivariate analysis tools. Traditionally this is achieved using a series of two dimensional scatter plots of different combinations of markers onto which gated regions can be defined where marker intensities define a phenotype.
Imaging flow cytometry combines the high throughput sampling of traditional flow cytometry with the acquisition of an image of each cell 3, thereby providing spatial information as well as total fluorescence intensity from each channel. For example, the ImageStream system (Luminex) uses a CCD camera, run using time delay integration (TDI), to acquire up to 12 images of each cell including brightfield, darkfield (often referred to as side-scatter in traditional flow cytometry) and multiple fluorescent images at rates of up to 5,000 objects per second. The acquisition of images dramatically increases the measures available for each channel, for example cell area can be measured directly and more complicated metrics such as correlation, texture, and granularity give information on marker localization and morphology. Typically hundreds of measures or features can then be incorporated into the gating strategy to define cell phenotypes.
Early application of imaging flow cytometry relied on the definition of simple image features which relied on the spatial information, for example the overlap of a marker’s signal with the nucleus of the cell to measure nuclear translocation 4. However the availability of the rich multivariate dataset derived from the large numbers of image features has led to evermore powerful analyses and the application of machine learning techniques to enable cell classification and functional analysis.
In this primer we will focus on the typical types of analysis that can be carried out using imaging flow cytometry, in particular highlighting the advantages of the images acquired compared with traditional fluorescence flow cytometry. Using specific datasets we will focus on the data collection and analysis steps that can answer specific questions related to the biology of the cell. We will concentrate on the more typical analysis of data using simple features extracted from the images, however, we will highlight where more advanced machine and deep learning techniques can be applied to solve more advanced problems. While new imaging flow technologies are constantly being reported, we will focus mainly on the commercially available systems available from Luminex, which as a mature platform has been the mainstay of imaging flow studies to date. However, the strategies for using imaging flow cytometry data remain similar irrespective of the instrumentation and therefore the analysis examples given here will be easily adaptable to other systems. In this primer we will also discuss the limitations of imaging flow cytometry and outline the rapid advances which will be available in the near future to overcome them.
Experimentation
Instrumentation
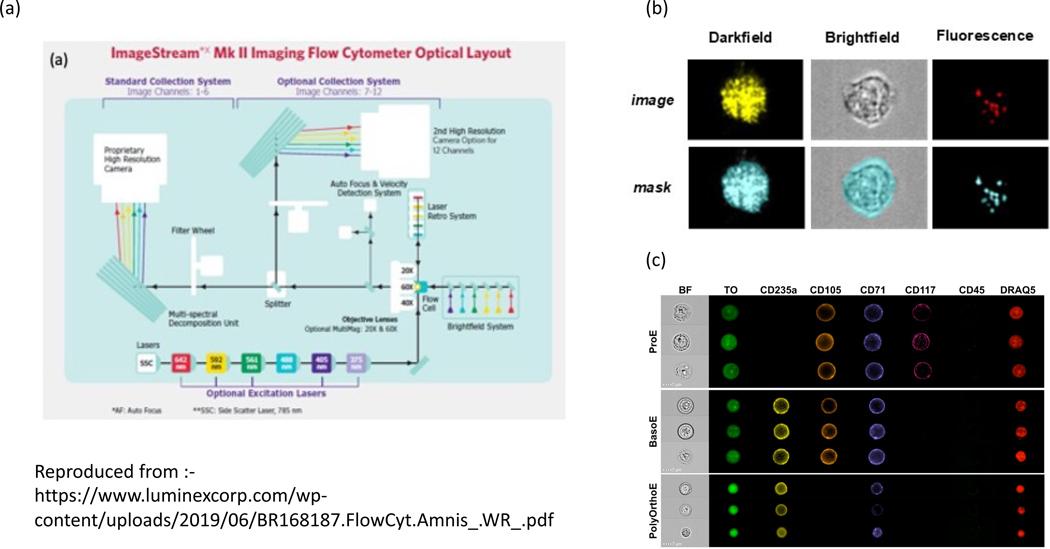
The first imaging flow cytometer was introduced in 2004 when George et al. developed the ImageStream system marketed by Amnis (now part of Luminex) 5. Cells in suspension are hydrodynamically guided into a core stream which is illuminated by an LED array and mixture of collinear and spatially separated laser lines at rates of up to 5,000 objects per second (Fig. 1a). The standard excitation laser has a wavelength of 488 nm however the system can be expanded with up to six further lasers at 375, 405, 561, 592, and 642 nm; a higher-power 488 nm laser is also available. The ImageStream MkII system doubles the original 6 channel acquisition capacity to 12 channels by using two image detection systems including filters, spectral decomposition systems and two CCD cameras. This enables the capture of images from 10 fluorescence channels together with brightfield and darkfield images. Images can be captured at 3 different magnifications 20, 40 and 60X giving a pixel resolution of 1, 0.5 and 0.3um. An extended depth of field 6 option maintains a focus over a greater depth, an option which is useful for the quantification of cellular structures throughout the cell. A high gain model has also been introduced which adjusts the gain setting to maximize the measured signal while minimally increasing the noise allowing the measurement of dim fluorescence markers or very small objects, such as extracellular vesicles 7 and viruses.
Figure 1:
Diagram of the optical layout of the Imagestream flow cytometer
A major strength of the ImageStream system is the user-friendly acquisition and analysis software that allows exploration and analysis of the rich multivariate datasets that the instrument delivers. The data acquisition software (INSPIRE) enables the basic self test, calibration and set up of the instrument. During data acquisition researchers can modify instrument operating parameters and observe the images obtained from each channel in real time. Furthermore, data can be acquired selectively, based on a gating strategy from image features to reduce the number of unwanted images in the subsequent data file.
Sample preparation and experimental design
Sample preparation for imaging flow cytometry is analogous, in practical terms, to any form of fluorescent antibody or dye based technology that is used to analyze cells or particles in suspension. In general terms, as with any form of experimentation, the first step is to formulate the question and determine what key measurements are needed. So for example, if the goal is to measure the degree or amount of FoxP3 in the nucleus of primary human regulatory (T-regs) CD4T cells, appropriate markers can be selected by looking at the capability of the available imaging flow cytometer. This impacts how many parameters the researcher could measure per cell as well as which fluorochromes and dyes the system could detect based on things like the number and wavelength of available excitation lasers as well as important information about the detection channels (for example one camera versus two camera system). In this design of the optical setup to be used it is possible to use several widely available online spectral viewers to create a “virtual” machine with the right lasers and filters. The next stage is to then draw up a list of the minimum number of biomarkers that would be required to identify the cell type of interest from a heterogeneous population. If additional channels are available, the researcher should seriously consider whether other parameters might be of interest and measured simultaneously.
For example, consider a protocol previously used to identify T-regs from whole, lysed human blood 8. To do this effectively, one may need to stain the sample with antibodies against CD45 (pan-white blood cell marker) to distinguish white blood cells from un-lysed red blood cells and debris. Next we would want to include an antibody against CD3 to identify all T cells within the CD45-positive white blood cell (WBC) population. As we want to focus on regulatory CD4-positive T cells, we will also need to include an antibody against CD4, as well as CD25 and CD127 (IL-7 receptor alpha chain). In all cases, each antibody would need to be tagged to a unique fluorochrome that would be compatible with the spectral setup of the system as well as each other, although an advantage of imaging cytometry is that markers may be used in the same spectral channel if they are spatially distinct. The selection of fluorochrome to marker/target follows the same rules and approaches for conventional and full spectral fluorescence flow cytometry where essentially low expressed markers are assigned to bright fluorochromes and highly expressed markers to dimmer fluorochromes 9. As we also want to measure the nuclear occupancy of the FoxP3 protein, we would also have to select an antibody against FoxP3 tagged to a compatible fluorochrome as well as spectrally compatible nuclear dye. In all cases, the fluorescent reagents require careful titration, including the nuclear dye, because signal saturation can pose a challenge: first, due to the reduced dynamic range on the CCD camera (12-bit compared to 18-bit on a non-imaging flow cytometer) and second, the lack of control over each imaging channel (signal intensity is controlled by laser power, meaning that it can be challenging to balance a dim and bright signal for the same laser). Once reagents have been optimized, however, sample preparation follows the same process as with conventional flow cytometry.
Briefly, cells are prepared in a single cell suspension and stained with optimized concentrations of surface marker antibodies. After washing, the cells are fixed in 2–5% formaldehyde then permeabilized using a detergent (such as TritonX-100, Nonidet-P40 or Saponin) after which intracellular antibodies are added for a period, with any nuclear dye added at the end, prior to acquisition. Of note, any nuclear dye must be carefully titrated so as to ensure it does not saturate the other signals. As with conventional flow cytometry, single stained controls are required for compensation for all markers (see next section). The most significant difference in sample preparation comes at the last step where it is essential to concentrate the samples in a maximum volume of 50 μl, and ideally if cell numbers allow, at a concentration of 20–30 million cells per ml (thus, 1 million cells total in 50 μl). While this may seem extreme, the imaging flow cytometer tends to run at a slower rate than conventional systems so it can take impractical amounts of time to acquire enough cells in dilute samples, particularly if looking for rarer cell types. A concentrated sample will help to alleviate these issues, however if working with larger and ‘sticky’ cell types, less concentrated samples may be preferred. Sample acquisition is relatively easy; it is often best to begin with a fully stained sample that is known to contain the brightest signals in the panel if possible. It is then relatively simple to use plots that show the “raw maximum pixel” for all events in any channel and to ensure that the excitation laser powers are set to achieve maximum signal without any saturation.
As with traditional flow cytometry, before any quantitative analysis can be performed, the data must be compensated for the spectral cross-talk between channels. However the process of compensating imaging flow cytometry data is more involved given the spatial nature of the data. Essentially the spatial resolved data requires compensation at an individual pixel level 10. Separate aliquots of sample are stained individually with each dye/marker required for the full experiment; the contributions of crosstalk from each marker into the ‘empty’ channels can then be quantified.
Results
The ImageStream is provided with IDEAS (ImageStream Data Exploration and Analysis Software), software that enables the data preprocessing and the usual gating analysis associated with traditional flow cytometry. It also includes several ‘building block’ tools which suggest suitable image features, masks and gating strategies for typical cell image analysis. The first step using IDEAS is to generate and implement a compensation matrix to correct for spectral spillover or crosstalk between channels using the individually stained samples. This is a familiar process for flow cytometry however in the case of image flow cytometry the compensation matrix is used to deconvolve the cross channel contributions in each single pixel. Furthermore, at instrument start-up the acquisition software corrects for the individual variations in each pixel’s dark current and gain, to give a uniform photometric response for each pixel in the image. Any vertical and horizontal pixel spatial offsets are also computed and these are corrected during acquisition. The result is a brightfield, darkfield (light scatter) and up to 10 fluorescence channel images for every event that triggers the acquisition process (Fig 1b).
IDEAS also automatically generates a segmentation mask for each channel per field of view (Fig 1b). This allows the user to mask the cell outline using the brightfield channel and the nucleus, for example, if a nuclear dye has been included in the experiment. Often the automated masking parameters need to be adjusted 11, for example, by changing the intensity threshold level for segmentation, a process which is critical especially when detecting subcellular organelles etc. Once the object masks are accurately defined, shape morphology features such as area, perimeter, aspect ratio etc. can be measured which can be used in cell gating strategies. IDEAS also allows the measurement of more complicated image features which measure the texture and granularity which significantly enhances the assay opportunities compared with traditional flow cytometry, as will be discussed later.
Preprocessing : Preparing the cell images prior to data analysis
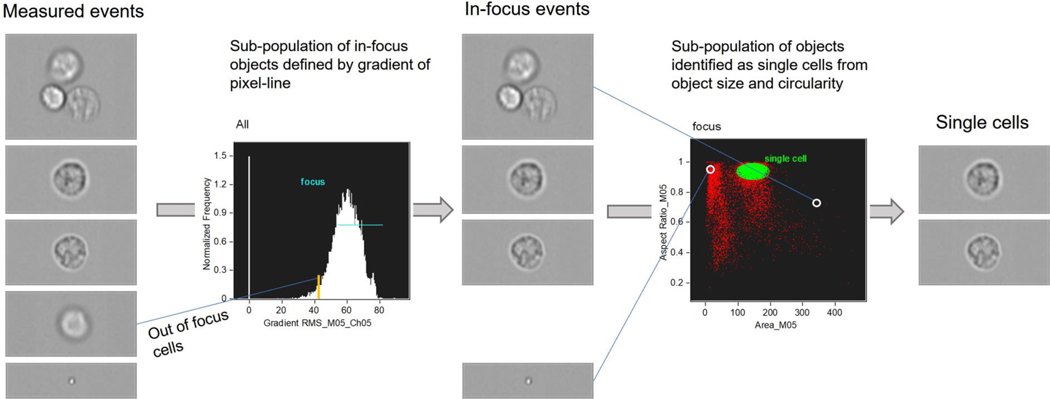
Before analysis of the acquired cell images can take place the data set needs to be filtered to remove images that are out of focus due to fluctuation of the fluid stream or that capture objects other than single cells (Fig 2). To identify the in-focus events the intensity gradient along a pixel line is used (the focus ‘building block’ within IDEAS software); in a well-focused brightfield image, the cell boundaries create a sharp intensity change and hence a high gradient value (feature Gradient {RMS, Mx, Chx}). Definition of the in-focus sub-population can then be made with a high-pass gating of the gradient histogram. Having defined the in-focus events, the focus sub-population may be further filtered to select single cells based on object size and shape (the single cell ‘building block’). This operates on morphological features obtained from the brightfield image mask, producing a 2D scatter plot of aspect ratio versus area. A single-cell sub-population may be defined from the dense cluster of events with high aspect ratio (tending to circular shape) and intermediate area (lying above a band of smaller objects corresponding to debris, and below higher points representing images containing multiple cells). After gating to define the single cell, in focus population the user is in a position to take advantage of the unique image based features this technology provides.
Figure 2:
Process flow employed to select in-focus, single cell images from an acquired event set.
Applications
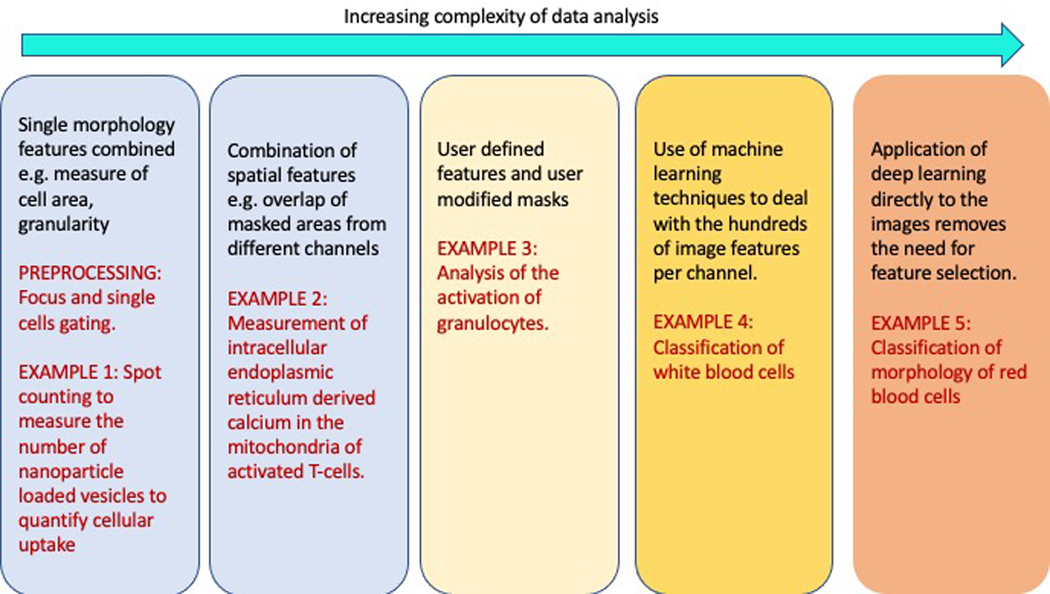
The range of applications of imaging flow cytometry has increased significantly over the past 15 years and this has been driven not only by new advances in the technology’s hardware but also in the rapid development of computational techniques available to analyze the rich multivariate datasets acquired using these instruments. Applications have matured from using a single, simple image feature through to the deployment of advanced deep learning algorithms Box 1 and in this primer we will illustrate examples of each.
Box 1:
Progression of analysis of imaging flow cytometry data
1. Use of image features in flow cytometry gating
The ability to capture images of single cells at different wavelengths clearly opens up many new avenues of investigation in comparison with traditional flow cytometry 12. For example, compared with measuring just an intensity value per channel, imaging flow cytometry allows capturing morphological features for each channel, such as cell area, perimeter and shape metrics such as aspect ratio etc. Early applications of imaging flow cytometry exploited the use of these simple features unavailable to traditional flow cytometry for phenotype identification. For example, while a rough approximation of cell size and shape can be obtained using traditional flow cytometry using forward and side scatter, an obvious application of imaging flow cytometry would be the direct measurement of cell size and shape. Imaging flow cytometry has been used extensively to study the cell cycle control in fission yeast where a detailed measurement of cell size is critical 13 14 15. Similarly the technique has allowed the classification of the morphological phenotypes of budding yeast based on the measurement of the size of bud lengths 16. Similarly the change in shape of the nucleus during mitosis allowed the detection of the anaphase, prophase, metaphase and telophase of the cell cycle with only a DNA marker 17.
Furthermore, Imaging flow cytometry can analyze subcellular structures which is clearly far more difficult, if not impossible, with traditional flow cytometry. For example, the IDEAS analysis software allows the detection of ‘spots’ in the cellular image; this was used, for example, to measure the uptake of nanoparticles by cells, by determining the number of vesicles that were loaded with particles and assessing the inheritance of these by daughter cells during mitosis 18. Similarly spot counting was used to measure the frequency of γH2AX foci induction in DNA double strand break repair defective human cell lines 19. Imaging flow cytometry also has a resolution that allows the quantification of the uptake of extracellular vesicles by cells using spot counting 20. A recent update to the IDEAS software allows the use of connected component masks, where a channel mask can be broken down into multiple individual components. All the feature measurements available for masks can then be applied to the individual components. This addition is especially useful when measuring multiple subcellular structures, for example in particle uptake studies 21.
Example Application 1 : Analysis of nanoparticle uptake using spot counting
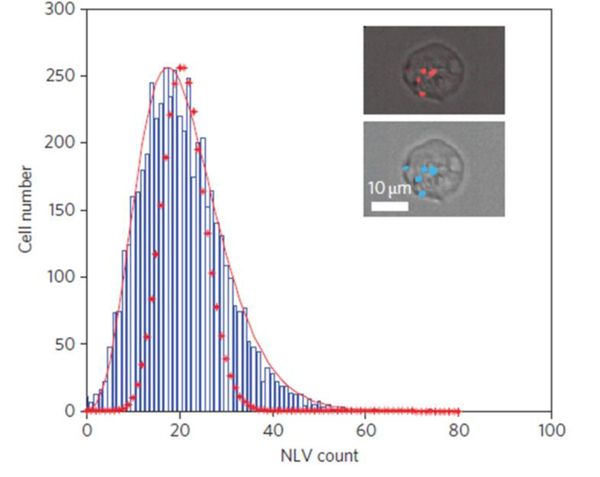
The capability to spatially analyze intra-cellular objects is probably the single most important factor in deciding to use imaging rather than traditional flow cytometry and so the most obvious example to present for imaging cytometry is the recognition and enumeration of sub-cellular areas, i.e. punctate spots within a cell image. Here we present an application using fluorescent nanoparticles (quantum dots) in which the heterogeneity of particle loading into endosomes is assessed. In this case the relevant fluorescent channel clearly shows bright spots under laser excitation corresponding to endosomal vesicles loaded with nanoparticles (Fig 3). Using the masks feature these fluorescent areas can be identified using one of a number of possible masking functions such as intensity, peak or spot. A measurement feature may then be generated from the spot mask to generate a summed spot area or a spot count per cell. In the specific application considered here these represent a dose metric for the accumulated nanoparticles and would be of relevance to a nanotoxicology or nanomedicine assay. It should be noted that this process of mask generation and feature extraction relies only on the presence of distinct pixel intensity clusters that may be identified within the cell image. A fluorescence image is not therefore essential and sub-cellular morphology may be clear within the scattered light variation of the dark field channel or indeed, as dark spots in a bright field image (see example application 3).
Figure 3:
Histogram of the number of nanoparticle loaded vesicles (NLV) in a cell population under uniform particle exposure. The distribution exhibits over-dispersion relative to a Poisson process (dotted line) with accurate representation of the data being achieved using a negative binomial distribution function (solid red line).
The extraction of spatial metrics is of course not an end in itself and the real impact of imaging cytometry lies in the application of post-measurement models and analysis of the data. For example, in this nanoparticle uptake data the statistical distribution of the number of nanoparticle loaded vesicles per cell is overdispersed relative to the Poisson distribution expected on a hypothesis of random particle arrival and internalization. Further study shows that this is due to cell area heterogeneity and provides predictions of the dose heterogeneity of nano-vectors 22. Here we see potential for probabilistic models of cell processes, enabled by the ability to extract spatial information across large populations.
2. Analysis techniques using combinations of image features, masks and different channels
As well as detecting changes in sizes and shape, images allow biological assays that require a detailed assessment of the position of fluorescent biomarkers within subcellular structures, such as protein colocalization. The individual channel image pixels are in spatial registry allowing the direct comparison of fluorescence from each channel at the resolution given by a single pixel. The pixel intensities from any two channel images can then be compared using for example a normalized Pearson correlation to define a metric or similarity score that measures the overlap of the fluorescence. For example, the Nuclear Factor-kappa B (NF-κB) translocation in THP-1 cells after treatment with lipopolysaccharide was measured using the similarity score of a nuclear dye and the NF-κB fluorescence using the ImageStream system 23. Likewise the ImageStream was used to study the interferon mediated pathway in hepatoma cells expressing the hepatitis C virus by measuring the nuclear translocation of IRF724. The accuracy of the quantification of the nuclear translocation p65 and NF-κB using imaging flow cytometry was confirmed by correlation microscopy, and western blot data.
Example Application 2: Spatiotemporal Calcium Mobilization in Activated T Cells
To illustrate the use of overlapping fluorescent image channels we use the example of the requirement to determine the position of calcium in the cell (Fig 4). Calcium acts as a ubiquitous signaling moiety in cell biology, passing on extracellular signals to drive changes in gene expression and cellular responses. In the immune system, calcium acts as a key secondary messenger downstream of the T cell Receptor (TCR) after recognising foreign antigens. The measurement of calcium mobilization in T cells is therefore of significant interest and is often a critical assay for the characterization of cells from patients and from various transgenic mouse models, where T cell signaling is suspected to have been perturbed in some way. One of the key features of calcium signaling and mobilization is the spatial aspect, with temporal involvements and dependencies on different subcellular locations making it a very attractive model system to be measured using imaging flow cytometry.
Figure 4:
(a) A schematic overview highlighting the major methodological steps required to measure the spatio-temporal flux of calcium in immune cells in response to various stimuli. (b) Example data whereby Jurkat T cells were labeled with the relevant vital dyes and acquired on an ImageStream X (ISx), initially for a period of 60 seconds to establish a resting baseline after which samples were unloaded and either Thapsigargin (red line) or anti-CD3 (blue line) was added at optimized concentrations. Samples were then re-loaded on to the ISx and acquired for a further time period. As a positive control for calcium mobilization, samples were unloaded for one final time and the ionophore Ionomycin was added prior to reloading the sample and a further period of data acquisition. The upper panel shows the intensity of MagFluo4 within the area of the cell image defined as the Endoplasmic reticulum (ER) as a percentage of the initial value at baseline. The lower panel shows example multi-spectral images at each phase of measurement.
To this end a fluorescent dye panel that is compatible with a 4 laser, 2 camera, 12 channel imaging flow cytometer is used to identify: two key intracellular organelles involved in calcium mobilization, namely the endoplasmic reticulum (ER) and the mitochondria, and secondly, to report the flux of calcium ions in these locations 25. These dyes were carefully titrated to ensure 1) optimal signal to noise 2) onward cell viability 3) organelle specificity. For the latter consideration, it is possible to use spatial information to confirm specificity of each organelle dye as it has been shown that excessive concentrations of such dyes will lead to a loss of specificity and a generic labeling of intracellular structures. In this case the bright detail similarity feature provides a metric for the spatial segregation of two distinct organelle dyes with low feature values (less than 1.5) representing good spatial segregation. After ~60 seconds of data collection, the sample was unloaded, a stimulus such as anti-CD3 antibodies or Calcium modulator added and then the sample reloaded to continue data acquisition. Single-stained samples were collected for compensation purposes.
Corrected and compensated data was analyzed by creating a range of masks based on the specific organelle stains and restricting the kinetic measurement of various fluorescent calcium probes to these structures versus the whole cell signal. Utilization of this approach uncovers interesting features of calcium mobilization in activated T cells, namely that mitochondria seem to be able to act as a “sink” for intracellular ER-derived calcium and not just from an extracellular influx; this observation is wholly dependent on the ability to obtain single cell, kinetic spatial information at a population-wide level.
3. Use of user defined masks and features
A strength of the IDEAS software is the flexibility it provides to take the basic features and masks and modify them to provide custom measures tailored to the application.For example, the internalization of nanoparticles by cells was quantified using an internalization score, which was derived from the correlation of the fluorescence nanoparticle pixels in the cell mask and the same cell mask that was eroded by 3μm to remove the outer membrane region 26. A similar strategy was also used to measure the extent of the ciliary zone thickness in mature human bronchial epithelial multiciliated cells, as the difference in area between the cell body and the ciliated zone mask 27.
Example Application 3 : Analysis of the morphology of granulocytes
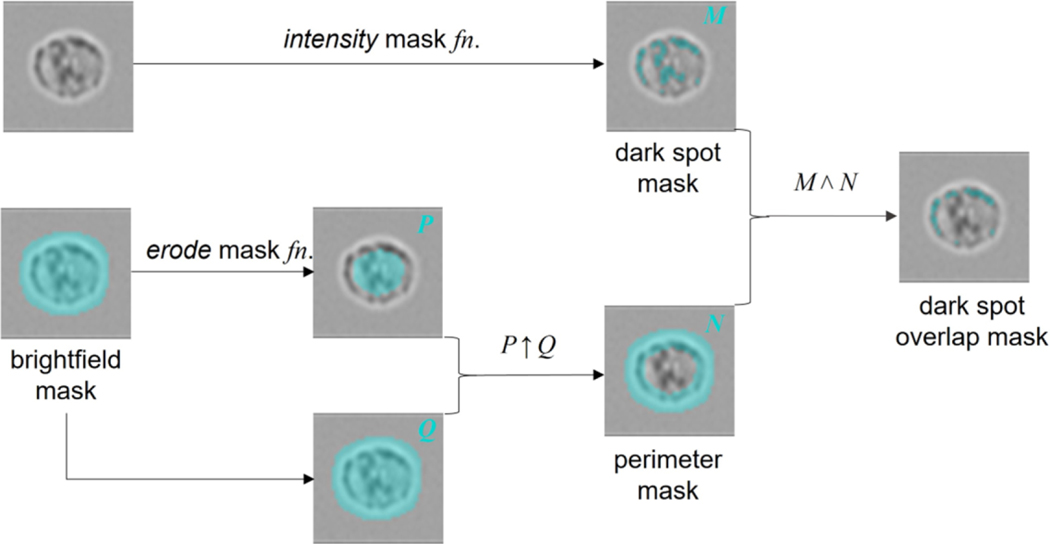
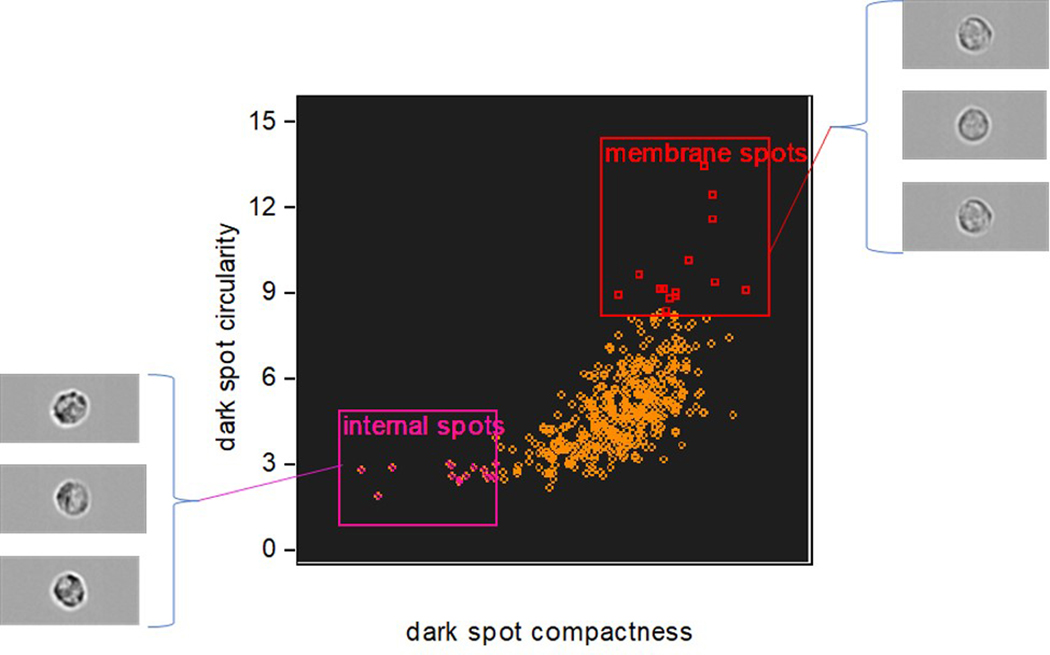
While traditional flow cytometry can indirectly measure granularity via the intensity of the scattered laser imaging flow cytometry can directly measure spatial variation in the brightfield, darkfield and fluorescence images. In this example we analyze the pronounced morphological features of granulocyte white blood cells. The granules for which these cells are named consist of enzyme-filled vesicles and these produce high-contrast dark spots within brightfield images. If we want to quantify whether the granules are located at the outer edge of the cytoplasm, next to the membrane, or more evenly distributed within the cell. Here we outline a procedure for assessing the sub-cellular distribution of these granules, but the general approach is applicable to any analysis of cell morphology based on brightfield image contrast.
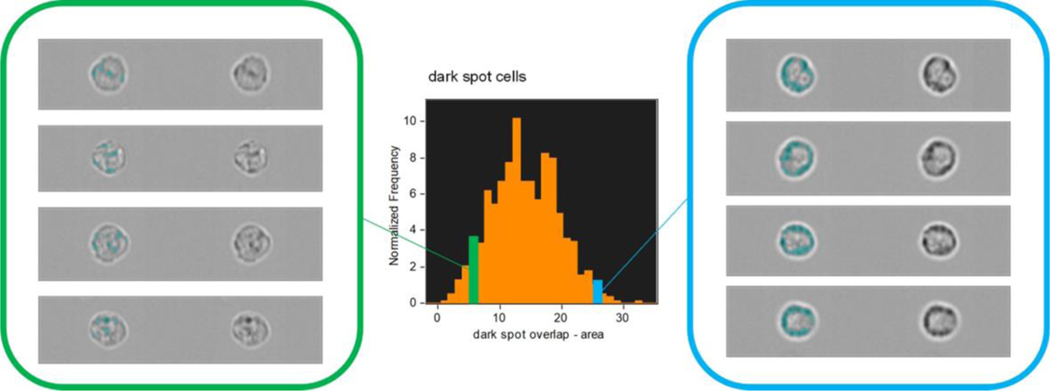
The analysis is based on the creation of area masks to define general sub-regions of the cell and to define the granules (using the masks function) (Fig 5). Logical mathematical operations using these masked areas can then identify degree of overlap and quantify the spatial distribution of the granule dark spots (using the features function). A mask of the brightfield channel is automatically generated by the IDEAS software; erosion of this mask isolates the inner body of the cell. Logical combination of original plus eroded masks can then produce a mask of the cell perimeter, through a NOT AND operation, i.e. shared areas, common to both masks, are removed from the original brightfield mask. Having created location masks that define the cell interior and perimeter, we can proceed to mask the image spots corresponding to granules. This can be achieved with a number of alternative masking functions such as intensity, peak or spot, with selection determined by user preference and their relative performance when applied to the specific cell image set being analyzed. Final extraction of a measurement feature, defining the degree of membrane association of the granules, is achieved by calculating the area of a combined mask resulting from logical combination of granule mask AND perimeter mask, i.e. selecting the masked granule areas that lie close to the cell membrane (Fig 6).
Figure 5:
Process flow for the masking strategy used to isolate membrane-associated granules.
Figure 6:
Differentiation of cell populations with membrane-associated or dispersed granules, according to mask area.
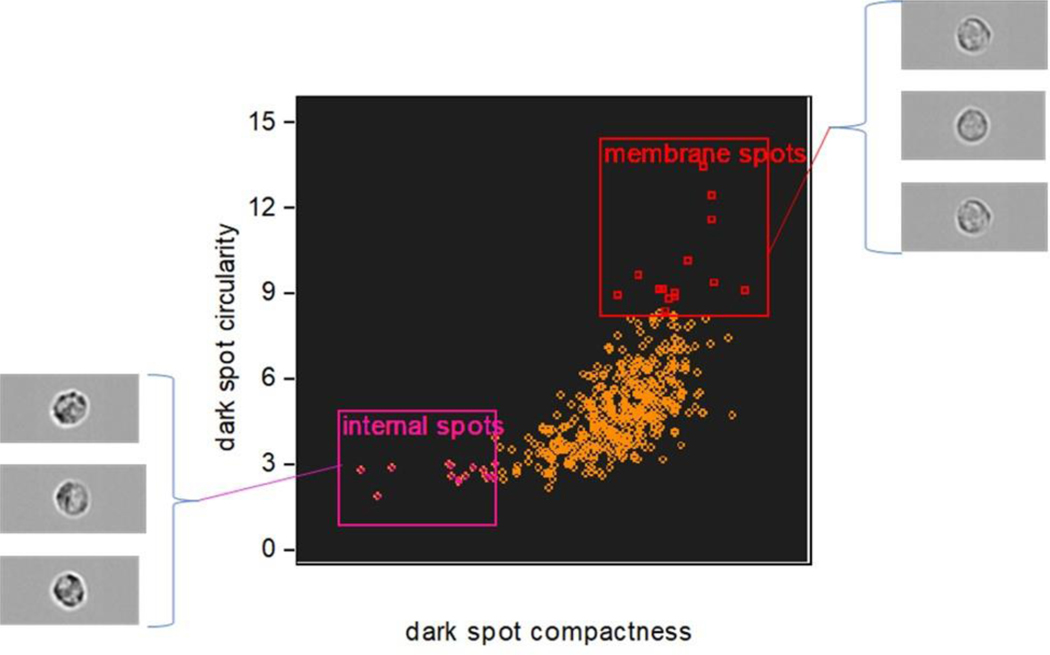
There are often alternative approaches that may be taken in a spatial analysis and here, by example, we can implement a morphology-based approach using only the dark spot mask (Fig 7). Rather than isolating the membrane associated granules this approach seeks to classify the different spatial distributions seen across a cell population, i.e. to differentiate between examples where granules are distributed across the whole of the cell and those where they are preferentially clustered at the cell membrane. Having identified the granule positions with the dark spot mask, their spatial orientation can be quantified using compactness and circularity feature functions. A scatter plot of these features presents a distribution of the cell-state extending from cells with centrally located granules on the lower left (dispersed and asymmetric pattern) to those with strong membrane association in the upper right (localized and symmetrical pattern).
Figure 7:
Differentiation of cell populations with membrane-associated or dispersed granules, according to the morphology of their spatial distribution.
4. Machine Learning Analysis Strategies
While scoring cells based on individual spatial features has led to numerous new biological cellular assays, more recently it has been recognised that combining the large numbers of possible features which can be derived from each channel image for every cell in the population can lead to an incredibly rich dataset with the power to identify more complex phenotypes. These multivariate datasets are perfect candidates for the application for high content approaches to identifying cell phenotypes and determining cell function.
One of the first examples applying machine learning to imaging flow data identified the stages of the cell cycle including mitosis, as well as DNA content, in a completely label-free assay 28. In the machine learning training step, Jurkat cells were stained with propidium iodide, to quantify DNA content, and a MPM2 (mitotic protein monoclonal #2) antibody, to identify mitotic cells. This enabled identifying cells in G1, S, G2 phases and the four mitotic phases–prophase, metaphase, anaphase and telophase–using traditional gating techniques. The annotated cells were used to train a network to classify the phases based on the brightfield and darkfield channels alone – in other words, the machine learning model was not allowed to use the fluorescence channels. Finally, in the prediction (or inference) step, the trained machine learning model used the label-free channels alone to classify cells into phrases and predict the intensity of propidium iodide stain. This machine learning strategy has also been employed to classify human white blood cells where CD markers were used to annotate the B, T cells, eosinophils, monocytes and granulocytes. Trained machine learning algorithms were able to identify the cell types using just the brightfield and darkfield channels 29, 30.
To apply machine learning the user must extract a table of image features for each cell. IDEAS can measure large numbers of features for each channel and these can be output for future analysis. Similarly open source software tools such as CellProfiler 31 which has been designed specifically to extract large numbers of shape, intensity and textures features for multivariate analysis can be used 32. We note that the user must decide on what features are used in the analysis depending on the classification or regression task at hand. Care must be taken to remove any non-biological features that can be present such as cell number or a timestamp. Also the user can pre-filter the data to remove any correlated or redundant features which can confound the learning process and can also speed up analysis times 33,34. Once the feature table has been extracted the user is free to choose any appropriate analysis tools, for example, MATLAB has an user friendly machine learning toolkit, Python has extensive libraries such as Scikit-learn and also the open source R language has been specifically designed for statistical computing. Also, a machine learning module has recently become available within the IDEAS software package to enable the application of machine learning techniques to the image data with no expert knowledge.
Example Application 4 - White blood cell classification using machine learning
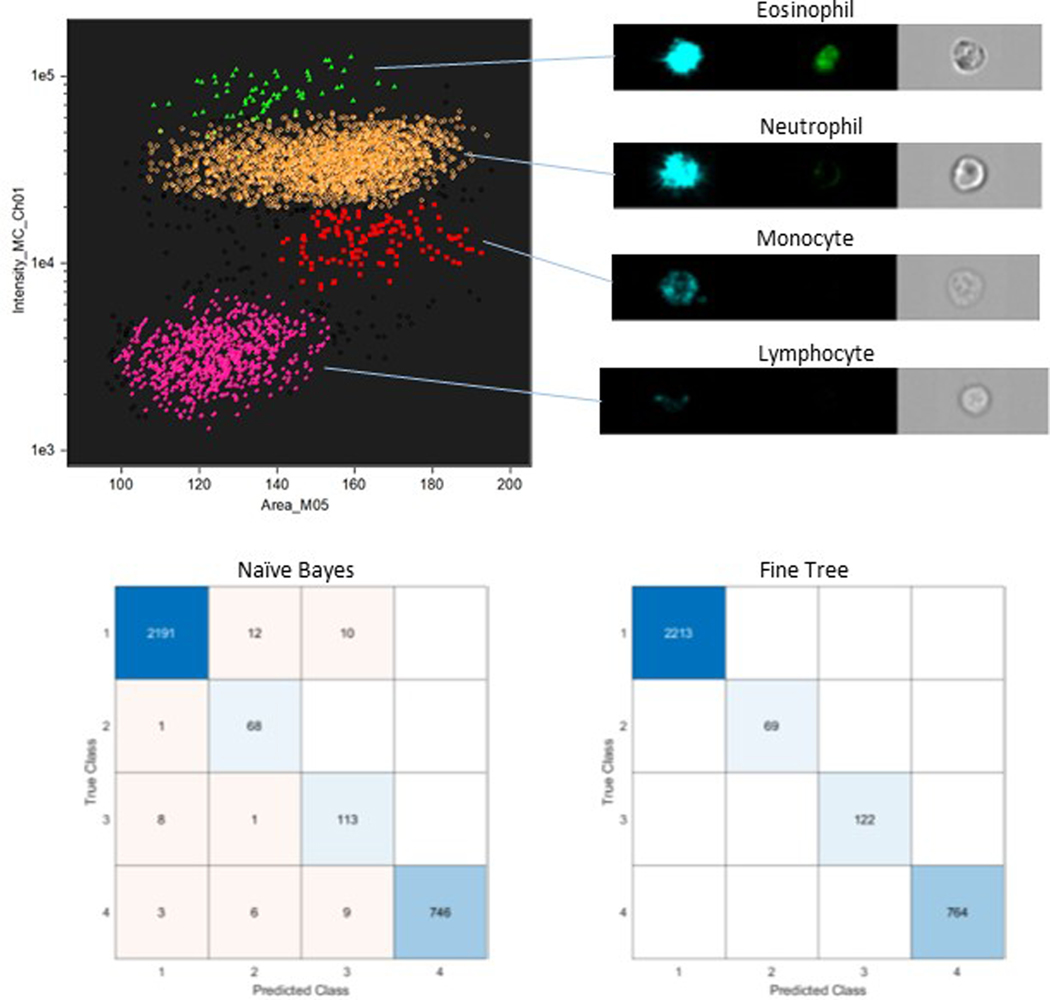
To provide a clear demonstration of the steps involved in applying machine learning for automated analysis we consider the common, well understood task of white blood cell phenotype identification. In traditional flow cytometry this is typically achieved by manually gating a scatter plot of side and forward scatter. A similar procedure can be invoked in imaging cytometry using the darkfield intensity and brightfield mask area features (Fig 8). To employ machine learning for this task the first step is to export all used features to a data text file (in this example the measurement features for darkfield, brightfield and channel 4, which contains autofluorescence images). In this demonstration example this is done for each of the four gate-defined populations of eosinophil, neutrophil, monocyte and lymphocyte cell phenotypes. It should be noted that in addition to image channel features IDEAS also exports cell object and time data columns, these biologically irrelevant metrics need to be removed from the data prior to implementation of machine learning. Here we assess the ability of machine learning algorithms to correctly classify the cell phenotypes using the combined data set of all sub-populations. In this case the combined data for the 3 channels provides a data matrix of 115 metrics for 3,168 cells. The feature data matrix may be used with any chosen machine learning software, in the figure below we present results, in the form of confusion matrices, from MATLAB’s classification learner app. For illustration purposes we choose two algorithms: a naive Bayes and a fine tree. Both deliver highly accurate classification and unsurprisingly the decision tree is optimum as it follows the binary signal discrimination employed in the original manual gating.
Figure 8:
Machine learning approaches to white blood cell classification.
5. Application of deep learning
The examples we have described so far can be quite powerful, and they all have one step in common: they require the measurement of particular image features that are pre-defined by software. The IDEAS software, as well as open-source bioimage analysis tools such as CellProfiler and ImageJ, can measure a large number of features, which can be selected by the researcher or used en masse for machine learning. A new type of machine learning algorithm has the potential to go beyond features that humans have pre-programmed into software: deep learning. Also known as neural networks and named for their many, deep layers, deep learning algorithms use full images as the input to a convolutional network. When appropriately trained, the network generates the features required for the analysis applications; these features can often be more powerful than human-designed ones. Deep convolutional neural networks for image classification are well suited to small multichannel images and they require large numbers of images to train, which makes them perfect candidates for the analysis of data from imaging flow cytometers.
One of the first applications of deep learning to imaging flow data 35 trained a deep convolutional neural network to detect the different phases of the cell cycle using the pixel data of the images rather than extracting conventional image features. Other challenging applications are quite diverse. Dunker et. al. trained a convolution neural network to classify phytoplankton species and also identify the stages of the life cycle 36. More recently the same researchers used the same deep learning algorithms to classify large numbers of pollen species with high accuracy 37. Furthermore, they were able to determine morphological and fluorescence features that were conserved at the various levels of taxonomy. Similarly, deep learning was similarly used for predicting Cryptosporidium and Giardia in drinking water 38.
Example 5: Classification of micronuclei events using deep learning
A typical application of deep learning to imaging flow cytometry data is to take advantage of the large number of single cell images to classify individual phenotypes. As an example we will examine the use of deep learning to classify micronuclei events from imaging flow data. The in vitro micronucleus assay is the standard method for the assessment of possible DNA damage induced by chemical / radiative perturbation. The assay is the gold standard test of genotoxicity in the development of all chemicals and pharmaceuticals. When the nucleus divides during mitosis, chromosome fragments that fail to be incorporated into the daughter nuclei appear as ‘micronuclei’ within the cell. Imaging flow cytometry has been shown to be an effective measurement tool for the micronucleus assay giving the high throughput single cell nature of the data 39, 40, 41. The assay was partly automated using spot counting to find the micronuclei within the cells 42 however it was subsequently shown that this is a perfect application for the use of deep learning to fully automate the classification of cells with micronuclei 43 44.
As with the application of deep learning to any problem we must first decide on the type of neural network to be used. Several classification networks have been applied to imaging flow data including AlexNet 45, ResNet50 46 and VGG-16 47, all of which have been pre trained on many thousands of annotated images. The number of layers and complexity of the network can improve classification accuracy but also increase the time required to re-train the neural network. Once the network has been selected the input layer needs to be matched to the single cell image size pixel sizes. The individual images extracted are often of different sizes and therefore they need to be cropped or padded to the network input size. Also the application will dictate which image channels will be input into the network for classification. While classification networks were the first to be applied to imaging flow data we note that other networks can be used, for example a Faster region-based convolutional neural network was used to quantitatively analysis of phagocytosis in cells using imaging flow cytometry data 48.
As discussed for the application of machine learning techniques it is also important to consider which programming language to use to implement the network. Matlab has useful deep learning toolboxes however again Python has a host of different packages to implement convolutional neural networks including Keras, Cafe and TensorFlow. Although for non-experts, as with the addition of machine learning into the IDEAS software, likewise a deep learning module has now also been developed. This tool was used recently to classify silicone oil droplets from protein particles 49, a protocol which has significant application in the development of biopharmaceuticals.
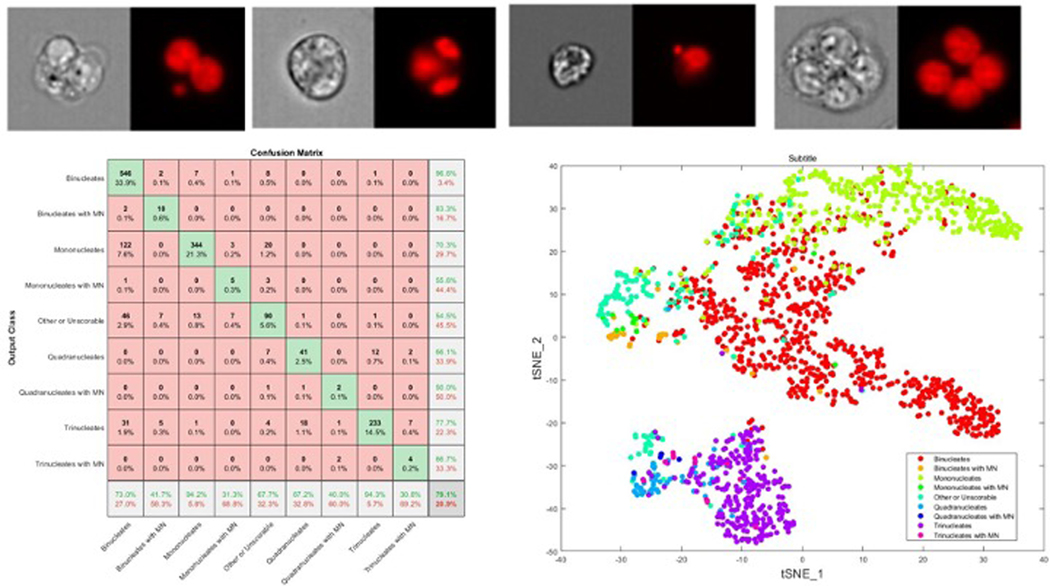
Here we take the publicly available dataset 44 which contains TK6 cells which exhibit mono, bi, tri and quardanuclated phenotypes together with micronuclei events (Fig 9) after exposure to carbendazim. The human annotated dataset has both brightfield and DNA fluorescence images which have been cropped/padded to 64×64 pixels and maximum/minimum renormalised per image. As a simple example we input just the DNA channel into the ‘DeepFlow’ neural network 35 developed specifically for Imaging flow cytometry data which is available in Python and Matlab 44 for this image size and trained on 6445 randomly selected images from each class over 30 epochs, minibatch size of 30 using the ADAM optimizer. The resulting confusion matrix (Fig 9e) shows the results of the trained network on 1609 test images, which gives an overall accuracy of 79.1% This can be significantly improved by augmenting the rarer cell classes, using the brightfield channel and increasing the number images used to train. As well as classification the weights of the penultimate layers of the trained network can be used to visualize the performance of the network or even for regression analysis. Here we demonstrate this by extracting the weights from the (average pooling) layer above the classification layer and use tSNE to reduce the features to 2 dimensions to visualize the class prediction.
Figure 9:
Application of deep learning to classification of micronuclei events in TK6 cells. Typical images of (a) binucleated cell with micronuclei, (b) trinuclated cell, (c) mononuclear cell with micronucleus and a (d) quadra nucleated cell. Confusion matrix (e) for a random sample of 1609 cells and the tSNE plot of the penultimate layer (pooling layer) to the classification layer (f)
Reproducibility and data deposition
If we consider the ImageStream system which has an extensive calibration, self check and initialisation start-up process the data reproducibility is excellent. As with all protocols that require staining or labeling cells, variable uptake of the markers or target binding can lead to problems with reproducibility in the analysis, however this is not a problem specific to imaging flow cytometry. In fact, a study to detect micronuclei events in cell conducted at three different laboratories (using different instrument settings e.g. excitation laser intensities) using different DNA stains demonstrated that deep learning algorithms trained on data from one laboratory could be used to classify results from the other laboratories with high accuracy 44.
The move to open and transparent data analysis has led to authors depositing data and analysis code using platforms such as FigShare, GitHub and also within supplementary information with manuscripts. The flow cytometry community has adopted a set of minimum standards required for data 50 and the prefered depository, FlowRepository. While no formal standards exist for Imaging Flow Cytometry, attempts have been made to outline best practice in report results and depositing data 51 which will become more important as more data is being made available.
Limitations and optimizations
Clearly, imaging flow cytometry has proven value in combining the advantages of a microscope and a flow cytometer. However the technique does have limitations, for example, in lacking capability for: workflow automation, cell sorting, repeated time-lapse imaging of the same cell and 3D resolution. Nevertheless, recent advances, in the field of imaging flow cytometry itself and from other disciplines, are beginning to address these limitations.
Automation:
An imaging flow cytometry workflow involves multiple steps, in which both the laboratory procedures for data acquisition and the computational procedures for data analysis often require manual handling, including sample staining, centrifuging, washing, sample handling, instrument preparation, data capturing, event gating, triggering, data cleaning, profiling and so forth. For wet-lab procedures, as yet there are no robotic options as seen in plate-based or slide-based high-throughput machines. For computational processes, although batch processing capability could be deployed, custom, expert-guided analysis is the norm and thus difficult for scaling within an automated and distributed computing platform. This poses a major challenge in downstream analyses, in which 100+ unique features, typically dozens of masks for cellular objects and subcellular compartments, as well as a large collection of algorithms available for each channel, yields several thousands of combinations to identify features and populations of interest. Partial automation is available, for instance, the Luminex ImageStream system is accompanied by data acquisition software (INSPIRE) and a separate analysis suite (IDEAS). This analysis platform does provide biologist-friendly templates (“wizards”) to guide users through common analysis scenarios, including foundational (compensation, gating), application-specific (apoptosis, localization, internalization), and exploratory (feature finder) schemes. Moreover, there are open-source attempts to orchestrate software modules and algorithms to improve automation in analysis procedures, commonly written in Python, MatLab 52, or R 53.
Sorting is an important feature of a cytometric system, regardless of imaging capability, because it allows physical segregation of objects to isolate subpopulations of unique cell types. This can allow subsequent assays on the subpopulations, or valuable procedures such as clonal selection and expansion. Unfortunately, constructing an image-based cell sorter requires several major modernizations in high-speed image acquisition, intelligent data analysis (often machine learning-based), and microscale sorting modules. In contrast to a range of choices for sorting flow cytometry, only a few sorting Imaging flow cytometry systems have been designed, and these are yet to become commercially available 54, 55, 56, 57.
Temporal resolution:
In a flow-based system, once the objects flow past the imager, they are either discarded or recollected in a common container. It is not, therefore, readily feasible to enable repeated imaging of the same cell, as seen in time-lapse, slide-based microscopy. The limitation to a single snapshot of each cell also rules against implementation of 3D reconstruction approaches such as confocal sectioning. Future development could alleviate snapshot restrictions through implementation of object tracking and unique identification using cellular barcodes 58 59.
Multi-object interaction:
Imaging flow cytometers can capture multiple objects if they appear within the same field of view at the point of acquisition, and can therefore provide information on close-proximity, object interaction. For example, the platform has been used to identify platelet binding to white blood cells 60. However, complex and/or long-range interactions between multiple objects would be a considerable challenge, if not impossible, to achieve.
Outlook
Similar to many imaging systems, Imaging flow cytometry is susceptible to the triangle of imaging constraints—speed, resolution, and sensitivity—improving one parameter causes the others to suffer. These compromises become even more critical as data volumes, velocity, and variety of biomedical research (the famous 3 Vs of Big Data) increase in the next 5–10 years. Even so, there are certain gaps for improvement in photonics and optics that are likely to improve Imaging flow cytometry systems. Future iterations may bring novel data acquisition and sorting technologies at higher resolution, with higher dimensions (larger 2D/3D FOV, temporal feature availability), while retaining, if not improving, the high throughput that makes Imaging flow cytometry advantageous over other single-cell imaging platforms.
Equally important will be improvements in data analysis techniques, in which feature stability, model reproducibility, and automation should be prioritized. Even with machine learning-based assistance incorporated in today’s workflows, users are still heavily taxed with many iterations of data cleaning and modeling processes, such as quality control checks, manual annotations in supervised learning, normalization of all features to a common base to offset the wide variation in feature value ranges, feature selection to alleviate the curse of dimensionality, feature ranking and combinations to optimize population separations. It would be helpful to see advanced AI methodologies incorporated into a biologist-friendly pipeline to deliver more automated, less supervised and more reliable classifier/phenotyping models.
Considering clinical applications the ever-increasing levels of information to be captured from single cells, Imaging flow cytometry coupled with machine learning approaches provides a powerful platform for disease fingerprinting. Rare events (e.g., metastatic cancer cells) may be detected better than by microscopy, and disease states may be detectable that are otherwise invisible to clinicians. With sorting capability, Imaging flow cytometry would prove to be a very useful tool for clinical diagnosis and treatment monitoring, especially for hematological disorders, even without the use of biomarkers 61. If an intelligent, label-free, sorting Imaging flow cytometry is developed, users might collect sorted cells to allow clonal selection and expansion, and do so iteratively to produce an effective cell therapy. Sorting Imaging flow cytometry would excel in pooled screening campaigns, in which multitudes of gene/compound combinations can be tested in an unprecedented throughput. In pool-based format, nucleic acids, CRISPR-ed oligos, small molecules or antibodies are mixed in the microfluidic device into the cellular or droplet form, then screened by image-based sorting followed by downstream omic techniques such as next-generation sequencing or proteomics. Novel readouts include combinatorial treatment responses, differential co-expression, network and pathway analyses, to help discern complex phenotypes and regulatory programs, and subsequently prioritize candidate genes or compounds for biopharmaceutical manufacturing.
References
- 1.Brown M. & Wittwer C. Flow Cytometry: Principles and Clinical Applications in Hematology. Clinical Chemistry vol. 46 1221–1229 (2000). [PubMed] [Google Scholar]
- 2.De Rosa SC, Brenchley JM & Roederer M. Beyond six colors: a new era in flow cytometry. Nat. Med 9, 112–117 (2003). [DOI] [PubMed] [Google Scholar]
- 3.Basiji DA, Ortyn WE, Liang L, Venkatachalam V. & Morrissey P. Cellular Image Analysis and Imaging by Flow Cytometry. Clinics in Laboratory Medicine vol. 27 653–670 (2007). [DOI] [PMC free article] [PubMed] [Google Scholar]
- 4.Maguire O, Collins C, O’Loughlin K, Miecznikowski J. & Minderman H. Quantifying nuclear p65 as a parameter for NF-κB activation: Correlation between ImageStream cytometry, microscopy, and Western blot. Cytometry Part A vol. 79A 461–469 (2011). [DOI] [PMC free article] [PubMed] [Google Scholar]
- 5.George TC et al. Distinguishing modes of cell death using the ImageStream multispectral imaging flow cytometer. Cytometry A 59, 237–245 (2004). [DOI] [PubMed] [Google Scholar]
- 6.Ortyn WE et al. Extended depth of field imaging for high speed cell analysis. Cytometry A 71, 215–231 (2007). [DOI] [PubMed] [Google Scholar]
- 7.Haley Renee Pugsley and Raymond K Kong. Demonstration of High Gain mode in combination with Imaging Flow Cytometry for improved EV analysis. Mian Yi Xue Za Zhi 204, 15 (2020). [Google Scholar]
- 8.Fazekas de St Groth B, Zhu E, Asad S. & Lee L. Flow cytometric detection of human regulatory T cells. Methods Mol. Biol 707, 263–279 (2011). [DOI] [PubMed] [Google Scholar]
- 9.Holmberg-Thyden S, Grønbæk K, Gang AO, El Fassi D. & Hadrup SR A user’s guide to multicolor flow cytometry panels for comprehensive immune profiling. Anal. Biochem 627, 114210 (2021). [DOI] [PubMed] [Google Scholar]
- 10.Ortyn WE et al. Sensitivity measurement and compensation in spectral imaging. Cytometry A 69, 852–862 (2006). [DOI] [PubMed] [Google Scholar]
- 11.Dominical V, Samsel L. & McCoy JP Jr. Masks in imaging flow cytometry. Methods 112, 9–17 (2017). [DOI] [PMC free article] [PubMed] [Google Scholar]
- 12.Barteneva NS & Vorobjev IA Imaging Flow Cytometry: Methods and Protocols. (Humana Press, 2015). [Google Scholar]
- 13.Patterson JO, Swaffer M. & Filby A. An Imaging Flow Cytometry-based approach to analyse the fission yeast cell cycle in fixed cells. Methods 82, 74–84 (2015). [DOI] [PubMed] [Google Scholar]
- 14.Patterson JO, Basu S, Rees P. & Nurse P. CDK control pathways integrate cell size and ploidy information to control cell division. Elife 10, (2021). [DOI] [PMC free article] [PubMed] [Google Scholar]
- 15.Patterson JO, Rees P. & Nurse P. Noisy Cell-Size-Correlated Expression of Cyclin B Drives Probabilistic Cell-Size Homeostasis in Fission Yeast. Curr. Biol 29, 1379–1386.e4 (2019). [DOI] [PMC free article] [PubMed] [Google Scholar]
- 16.Calvert MEK, Lannigan JA & Pemberton LF Optimization of yeast cell cycle analysis and morphological characterization by multispectral imaging flow cytometry. Cytometry Part A vol. 73A 825–833 (2008). [DOI] [PMC free article] [PubMed] [Google Scholar]
- 17.Filby A. et al. An imaging flow cytometric method for measuring cell division history and molecular symmetry during mitosis. Cytometry A 79, 496–506 (2011). [DOI] [PubMed] [Google Scholar]
- 18.Summers HD et al. Statistical analysis of nanoparticle dosing in a dynamic cellular system. Nature Nanotechnology vol. 6 170–174 (2011). [DOI] [PubMed] [Google Scholar]
- 19.Bourton EC et al. Multispectral imaging flow cytometry reveals distinct frequencies of γ-H2AX foci induction in DNA double strand break repair defective human cell lines. Cytometry Part A vol. 81A 130–137 (2012). [DOI] [PMC free article] [PubMed] [Google Scholar]
- 20.Jurgielewicz BJ, Yao Y. & Stice SL Kinetics and Specificity of HEK293T Extracellular Vesicle Uptake using Imaging Flow Cytometry. Nanoscale Res. Lett 15, 170 (2020). [DOI] [PMC free article] [PubMed] [Google Scholar]
- 21.Fei C, Lillico DME, Hall B, Rieger AM & Stafford JL Connected component masking accurately identifies the ratio of phagocytosed and cell-bound particles in individual cells by imaging flow cytometry. Cytometry A 91, 372–381 (2017). [DOI] [PubMed] [Google Scholar]
- 22.Rees P, Wills JW, Brown MR, Barnes CM & Summers HD The origin of heterogeneous nanoparticle uptake by cells. Nat. Commun 10, 2341 (2019). [DOI] [PMC free article] [PubMed] [Google Scholar]
- 23.George TC et al. Quantitative measurement of nuclear translocation events using similarity analysis of multispectral cellular images obtained in flow. J. Immunol. Methods 311, 117–129 (2006). [DOI] [PubMed] [Google Scholar]
- 24.Chang S, Kodys K. & Szabo G. Impaired expression and function of toll-like receptor 7 in hepatitis C virus infection in human hepatoma cells. Hepatology 51, 35–42 (2010). [DOI] [PubMed] [Google Scholar]
- 25.Cerveira J, Begum J, Di Marco Barros R, van der Veen AG & Filby A. An imaging flow cytometry-based approach to measuring the spatiotemporal calcium mobilisation in activated T cells. J. Immunol. Methods 423, 120–130 (2015). [DOI] [PubMed] [Google Scholar]
- 26.Vranic S. et al. Deciphering the mechanisms of cellular uptake of engineered nanoparticles by accurate evaluation of internalization using imaging flow cytometry. Part. Fibre Toxicol 10, 2 (2013). [DOI] [PMC free article] [PubMed] [Google Scholar]
- 27.Chivukula RR et al. A human ciliopathy reveals essential functions for NEK10 in airway mucociliary clearance. Nat. Med 26, 244–251 (2020). [DOI] [PMC free article] [PubMed] [Google Scholar]
- 28.Blasi T. et al. Label-free cell cycle analysis for high-throughput imaging flow cytometry. Nat. Commun 7, 10256 (2016). [DOI] [PMC free article] [PubMed] [Google Scholar]
- 29.Nassar M. et al. Label-Free Identification of White Blood Cells Using Machine Learning. Cytometry A 95, 836–842 (2019). [DOI] [PMC free article] [PubMed] [Google Scholar]
- 30.Lippeveld M. et al. Classification of Human White Blood Cells Using Machine Learning for Stain-Free Imaging Flow Cytometry. Cytometry A 97, 308–319 (2020). [DOI] [PubMed] [Google Scholar]
- 31.Carpenter AE et al. CellProfiler: image analysis software for identifying and quantifying cell phenotypes. Genome Biol. 7, R100 (2006). [DOI] [PMC free article] [PubMed] [Google Scholar]
- 32.Hennig H. et al. An open-source solution for advanced imaging flow cytometry data analysis using machine learning. Methods 112, 201–210 (2017). [DOI] [PMC free article] [PubMed] [Google Scholar]
- 33.Ding C. & Peng H. Minimum redundancy feature selection from microarray gene expression data. Computational Systems Bioinformatics. CSB2003 Proceedings of the 2003 IEEE Bioinformatics Conference. CSB2003 doi: 10.1109/csb.2003.1227396. [DOI] [PubMed] [Google Scholar]
- 34.Mandal M. & Mukhopadhyay A. An Improved Minimum Redundancy Maximum Relevance Approach for Feature Selection in Gene Expression Data. Procedia Technology vol. 10 20–27 (2013). [Google Scholar]
- 35.Eulenberg P. et al. Reconstructing cell cycle and disease progression using deep learning. Nat. Commun 8, 463 (2017). [DOI] [PMC free article] [PubMed] [Google Scholar]
- 36.Dunker S, Boho D, Wäldchen J. & Mäder P. Combining high-throughput imaging flow cytometry and deep learning for efficient species and life-cycle stage identification of phytoplankton. BMC Ecol. 18, 51 (2018). [DOI] [PMC free article] [PubMed] [Google Scholar]
- 37.Dunker S. et al. Pollen analysis using multispectral imaging flow cytometry and deep learning. New Phytol. 229, 593–606 (2021). [DOI] [PubMed] [Google Scholar]
- 38.Luo S. et al. Deep learning-enabled imaging flow cytometry for high-speed Cryptosporidium and Giardia detection. Cytometry A 99, 1123–1133 (2021). [DOI] [PubMed] [Google Scholar]
- 39.Rodrigues MA, Beaton-Green LA, Kutzner BC & Wilkins RC Automated analysis of the cytokinesis-block micronucleus assay for radiation biodosimetry using imaging flow cytometry. Radiat. Environ. Biophys 53, 273–282 (2014). [DOI] [PubMed] [Google Scholar]
- 40.Rodrigues MA, Probst CE, Beaton-Green LA & Wilkins RC Optimized automated data analysis for the cytokinesis-block micronucleus assay using imaging flow cytometry for high throughput radiation biodosimetry. Cytometry A 89, 653–662 (2016). [DOI] [PMC free article] [PubMed] [Google Scholar]
- 41.Verma JR et al. Evaluation of the automated MicroFlow® and Metafer™ platforms for high-throughput micronucleus scoring and dose response analysis in human lymphoblastoid TK6 cells. Archives of Toxicology vol. 91 2689–2698 (2017). [DOI] [PMC free article] [PubMed] [Google Scholar]
- 42.Rodrigues MA Automation of the in vitro micronucleus assay using the Imagestream imaging flow cytometer. Cytometry A 93, 706–726 (2018). [DOI] [PMC free article] [PubMed] [Google Scholar]
- 43.Rodrigues MA et al. The in vitro micronucleus assay using imaging flow cytometry and deep learning. npj Systems Biology and Applications vol. 7 (2021). [DOI] [PMC free article] [PubMed] [Google Scholar]
- 44.Wills JW et al. Inter-laboratory automation of the in vitro micronucleus assay using imaging flow cytometry and deep learning. Arch. Toxicol 95, 3101–3115 (2021). [DOI] [PMC free article] [PubMed] [Google Scholar]
- 45.Krizhevsky A, Sutskever I. & Hinton GE ImageNet classification with deep convolutional neural networks. Communications of the ACM vol. 60 84–90 (2017). [Google Scholar]
- 46.He K, Zhang X, Ren S. & Sun J. Deep Residual Learning for Image Recognition. 2016 IEEE Conference on Computer Vision and Pattern Recognition (CVPR) (2016) doi: 10.1109/cvpr.2016.90. [DOI] [Google Scholar]
- 47.Website. 10.48550/arXiv.1409.1556 doi: 10.48550/arXiv.1409.1556. [DOI]
- 48.Mochalova EN, Kotov IA, Lifanov DA, Chakraborti S. & Nikitin MP Imaging flow cytometry data analysis using convolutional neural network for quantitative investigation of phagocytosis. Biotechnol. Bioeng 119, 626–635 (2022). [DOI] [PubMed] [Google Scholar]
- 49.Probst C, Zayats A, Venkatachalam V. & Davidson B. Advanced Characterization of Silicone Oil Droplets in Protein Therapeutics Using Artificial Intelligence Analysis of Imaging Flow Cytometry Data. J. Pharm. Sci 109, 2996–3005 (2020). [DOI] [PubMed] [Google Scholar]
- 50.Spidlen J, Breuer K. & Brinkman R. Preparing a Minimum Information about a Flow Cytometry Experiment (MIFlowCyt) compliant manuscript using the International Society for Advancement of Cytometry (ISAC) FCS file repository (FlowRepository.org). Curr. Protoc. Cytom Chapter 10, Unit 10.18 (2012). [DOI] [PubMed] [Google Scholar]
- 51.Filby A. & Davies D. Reporting imaging flow cytometry data for publication: why mask the detail? Cytometry A 81, 637–642 (2012). [DOI] [PubMed] [Google Scholar]
- 52.Doan M. et al. Deepometry, a framework for applying supervised and weakly supervised deep learning to imaging cytometry. Nat. Protoc 16, 3572–3595 (2021). [DOI] [PMC free article] [PubMed] [Google Scholar]
- 53.Demont Y. Tools for Imaging Flow Cytometry [R package IFC version 0.1.2]. (2021). [Google Scholar]
- 54.Schraivogel D. et al. High-speed fluorescence image–enabled cell sorting. Science vol. 375 315–320 (2022). [DOI] [PMC free article] [PubMed] [Google Scholar]
- 55.Ota S. et al. Ghost cytometry. Science 360, 1246–1251 (2018). [DOI] [PubMed] [Google Scholar]
- 56.Gu Y. et al. Machine Learning Based Real-Time Image-Guided Cell Sorting and Classification. Cytometry A 95, 499–509 (2019). [DOI] [PMC free article] [PubMed] [Google Scholar]
- 57.Nitta N. et al. Intelligent Image-Activated Cell Sorting. Cell 175, 266–276.e13 (2018). [DOI] [PubMed] [Google Scholar]
- 58.Kebschull JM & Zador AM Cellular barcoding: lineage tracing, screening and beyond. Nat. Methods 15, 871–879 (2018). [DOI] [PubMed] [Google Scholar]
- 59.Rees P. et al. Nanoparticle vesicle encoding for imaging and tracking cell populations. Nat. Methods 11, 1177–1181 (2014). [DOI] [PubMed] [Google Scholar]
- 60.Ouk C, Jayat-Vignoles C, Donnard M. & Feuillard J. Both CD62 and CD162 antibodies prevent formation of CD36-dependent platelets, rosettes, and artefactual pseudoexpression of platelet markers on white blood cells: a study with ImageStream®. Cytometry A 79, 477–484 (2011). [DOI] [PubMed] [Google Scholar]
- 61.Ugawa M. et al. In silico-labeled ghost cytometry. (2021) doi: 10.7554/eLife.67660. [DOI] [PMC free article] [PubMed] [Google Scholar]


