Abstract
Background
We aimed to clarify the genomic characteristics of HER2‐positive and negative gastric cancer cases that potentially affect tumor progression and treatment response in a prospective trial.
Methods
We collected 80 formalin‐fixed paraffin‐embedded (FFPE) samples (49 HER2+ and 31 HER2‐) from gastric cancer patients who participated in the TROX‐A1 trial (UMIN000036865). We queried a 435‐gene panel (CANCERPLEX‐JP) to generate comprehensive genomic profiling data, including the tumor mutation burden, somatic mutations, and copy number variations. In addition, the genomic differences between HER2+ and HER2‐ gastric cancer patients were analyzed.
Results
Mutational analyses showed that TP53 was the most frequently mutated gene regardless of HER2 status. ARID1A mutation was significantly enriched in HER2‐negative patients. The number of total mutations in HER2‐negative patients with ARID1A mutation was remarkably higher than that in HER2‐positive patients. Next, copy number variation analyses showed that the number of amplified genes (such as CCNE1, PGAP3, and CDK12) in HER2‐positive cases was significantly higher than that in HER2‐negative cases. Moreover, PTEN deletion was more common in HER2‐positive cases. Finally, we found that, compared with HER2‐positive patients, HER2‐negative patients tended to have a higher tumor mutation burden, particularly in patients with ARID1A mutation. Pathway analyses of the gene alterations showed an enrichment of several immune‐related pathways in HER2‐negative patients.
Conclusions
According to the genomic profiling of HER2‐positive and negative gastric cancer, several gene alterations in the HER2 pathway may be the potential mechanism underlying trastuzumab resistance. Relative to HER2‐positive gastric cancer, HER2‐negative gastric tumors with ARID1A mutation may be sensitive to immune checkpoint inhibitors.
Keywords: biomarker, gastric cancer, genomic profiling, HER2, TROX trial
This study clarified the genomic characteristics of HER2‐positive and negative gastric cancer, providing evidence for understanding the mechanism underlying tumor progression and treatment responses in HER2‐positive and negative patients.
1. INTRODUCTION
Gastric cancer is a common malignant neoplasm and one of the leading causes of cancer‐related death worldwide. 1 Limited targeted treatment options contribute to the poor prognosis of metastatic gastric cancer patients. Recently, precision medicine methods focused on genetic alterations have improved the prognosis of patients with solid tumors, including gastric cancer. 2 In gastric cancer, targeted therapies have been developed and demonstrated to be effective for patients with human epidermal growth factor receptor 2 (HER2)‐positive, 3 microsatellite instability (MSI)‐High, 4 and neurotrophic tyrosine receptor kinase (NTRK) gene fusions. 5 Recently, a phase 3 clinical trial named SPOTLIGHT showed that Zolbetuximab, an anti‐claudin 18.2 antibody, improved progression‐free survival (PFS) and overall survival (OS) in claudin 18.2‐positive, HER2‐negative gastric cancer patients (NCT03504397). Moreover, inhibitors of fibroblast growth factor receptor (FGFR) gene alterations are being developed in several clinical studies for gastric cancer (TAS‐120: NCT04189445, FORTUNE Trial: NCT04962867). These findings may help provide new standard therapies in the future. With the rise of next‐generation sequencing (NGS) methods for genomic profiling, both research and development approaches and clinical practice concerning targeted therapy have changed drastically.
HER2, encoded by the ERBB2 gene, is overexpressed/amplified in approximately 15% of gastric cancer patients. 3 , 6 , 7 ERBB2 is an oncogene that drives tumor progression via activation of PI3K/Akt pathway. Thus, targeting HER2 is an attractive strategy for treating gastric cancer cases that have HER2 overexpression. In 2010, the ToGA trial results showed that the combination of trastuzumab, an anti‐HER2 antibody, and chemotherapy had a survival benefit in HER2‐positive gastric cancer patients. 3 Median OS in the trastuzumab group was 13.8 months versus 11.1 months in the chemotherapy‐only group (hazard ratio (HR) = 0.74; 95% confidence interval (CI) = 0.60–0.91; p = 0.0046). These results established trastuzumab and chemotherapy as the first‐line therapy for patients with HER2‐positive gastric cancer. However, some cases of HER2‐positive gastric cancer did not benefit from trastuzumab therapy. Several previous studies presented immunohistochemistry (IHC) data that showed that low phosphatase and tensin homolog (PTEN) expression is a reason for trastuzumab resistance in gastric cancer. 8 , 9 , 10 To further clarify the mechanism underlying anti‐HER2 therapy resistance, comprehensive genomic analyses of HER2‐positive gastric cancer cases using NGS may be an efficient approach.
We previously identified several novel driver genes involved in gastric cancer progression through comprehensive genomic analyses. 11 , 12 , 13 In this study, we evaluated the genomic profiles of 80 gastric cancer patients using a large gene panel based on NGS analyses who participated in the TROX‐A1 trial (UMIN000036865). We compared the genomic profiles of 49 HER2‐positive and 31 HER2‐negative gastric cancer patients and then examined the potential influences of the genomic differences on tumor progression and treatment responses, including the mechanism underlying anti‐HER2 therapy resistance in gastric cancer patients.
2. MATERIALS AND METHODS
2.1. Patients and sample collection
This was a companion study to the TROX trial, preplanned as the TROX‐A1 trial (UMIN000036865). HER2‐positive patients were enrolled in the parent study (TROX trial), a randomized, open‐label, multicenter, phase II trial comparing regimens of trastuzumab biosimilar combined with oxaliplatin, either plus TS‐1 or capecitabine, as a first‐line therapy for HER2‐positive metastatic gastric cancer patients (jRCTs071190007). The key inclusion criteria of the TROX trial were as follows: (I) the individual provided written informed consent for receiving the protocol treatment; (II) the patient is 20–80 years old; (III) patients with gastric adenocarcinoma confirmed by histopathology; (IV) patients with advanced/recurrent gastric cancer not amenable to curative surgery; (V) patients with no prior antitumor therapy, including chemotherapy, radiotherapy, targeted therapy, or immunotherapy; (VI) patients with the Eastern Cooperative Oncology Group (ECOG) performance status score of ≤1. HER2‐negative gastric cancer patients were enrolled as controls in the TROX‐A1 trial with the same inclusion criteria as the TROX trial.
The HER2 status of each patient was determined by clinicians using IHC and/or fluorescence in situ hybridization (FISH). HER2‐positive was defined as an IHC score of 3 or an IHC score of 2 with a FISH HER2/CEP17 score ≥2. We collected formalin‐fixed, paraffin‐embedded sections (FFPE) from 49 HER2‐positive and 31 HER2‐negative gastric cancer patients and extracted genomic DNA from the FFPE sections.
2.2. Genomic DNA extraction
Genomic DNA was extracted from FFPE sections using methods previously described. 14 For quality control (QC) purposes, extracted genomic DNA was evaluated by measuring DIN with TapeStation (Agilent Technologies). Only samples with genomic DNA quantitation >50 ng or 20–50 ng with DIN >3.5 were used for NGS analyses.
2.3. Genomic profiling by NGS
We evaluated the genomic profiles of 80 gastric cancer patients using the CANCERPLEX‐JP panel (DENKA Kew Genomics), as previously described, 15 which examines 435 genes detecting single nucleotide variants (SNVs), indels, copy number variants (CNVs), and fusions. In addition, the tumor mutational burden (TMB) was determined using the algorithm of the CANCERPLEX‐JP panel.
2.4. The Cancer Genome Atlas
We obtained gene expression data (RNA‐seq) from 415 gastric cancer samples, CNV data from 441 gastric cancer samples, and somatic mutation data from 395 gastric cancer samples in the Firehose pipeline at the Broad Institute (http://firebrowse.org/?cohort=STAD). The mRNA expression data (FPKM values, raw counts) were subjected to quantile normalization as previously described. 11 We calculated the (cytolytic activity) CYT score using the geometric mean of GZMA and PRF1 mRNA expression levels in the The Cancer Genome Atlas (TCGA) dataset as previously described. 16 Patients with ERBB2 copy number >2.5 was defined as ERBB2 amplification. Total mutation numbers in gastric cancer tumor tissues were counted according to somatic mutation data.
2.5. Database for annotation, visualization, and integrated discovery
We used the Database for annotation, visualization, and integrated discovery (DAVID) online tool (https://david.ncifcrf.gov) for pathway analyses of gene alterations based on HER2 status. The input genes, identified as the gene alterations enriched in HER2‐positive and HER2‐negative gastric cancer patients, are listed in Table S1. The significance of enrichment is expressed as a q‐value in the DAVID online tool. The q‐value is a false discovery rate (FDR) adjusted p‐value, with <0.05 considered significant in this study.
2.6. Statistical analysis
Statistical analyses with the Fisher's exact test, Student's t‐test, Mann–Whitney U test, and visualization were performed using R version 3.3.2 (R Foundation) and JMP Pro 15 software (SAS Institute). A two‐sided p‐value <0.05 was considered significant in this study. FDR adjustment (Benjamini–Hochberg method) was performed in pathway analyses (multiple testing). A q‐value <0.05 was considered significant. In the Fisher's exact test, the odds ratio (OR) was calculated, with OR >2 or <1/2 defined as an enriched gene alteration.
3. RESULTS
3.1. Genomic profiling by NGS using 80 gastric cancer tissues
We enrolled 49 HER2‐positive and 31 HER2‐negative gastric cancer patients in this study (TROX‐A1 trial, Figure 1). The background data of all patients are shown in Table S2. Using the CANCERPLEX‐JP reports, we generated comprehensive genomic profiles of the 80 gastric cancer patients. Ninety‐eight nonsynonymous mutations, 107 amplifications, and 114 deletions were identified in the 49 HER2‐positive gastric cancer patients. Seventy‐four nonsynonymous mutations, 31 amplifications, and 61 deletions were identified in the 31 patients with HER2‐negative gastric cancer. We explored the genomic landscape within the HER2‐defined subgroups (Figure 2A,B). As shown in Figure 2, the most frequently somatically mutated genes were TP53 (78%), APC (14%), and RHOA (12%), and the most frequent CNVs were ERBB2 amplification (63%), CDK12 amplification (39%), and PGAP3 amplification (39%) in HER2‐positive gastric cancer patients. In HER2‐negative patients, TP53 mutation (65%), ARID1A mutation (32%), RHOA mutation (23%), STK11 deletion (29%), AMER1 deletion (19%), and TSC2 deletion (16%) were the most frequent gene alterations.
FIGURE 1.
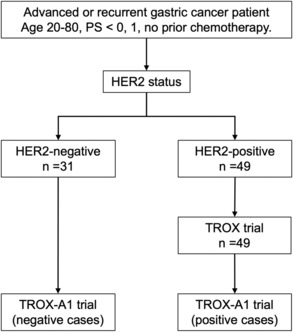
Study flowchart of the TROX‐A1 trial (n = 80).
FIGURE 2.
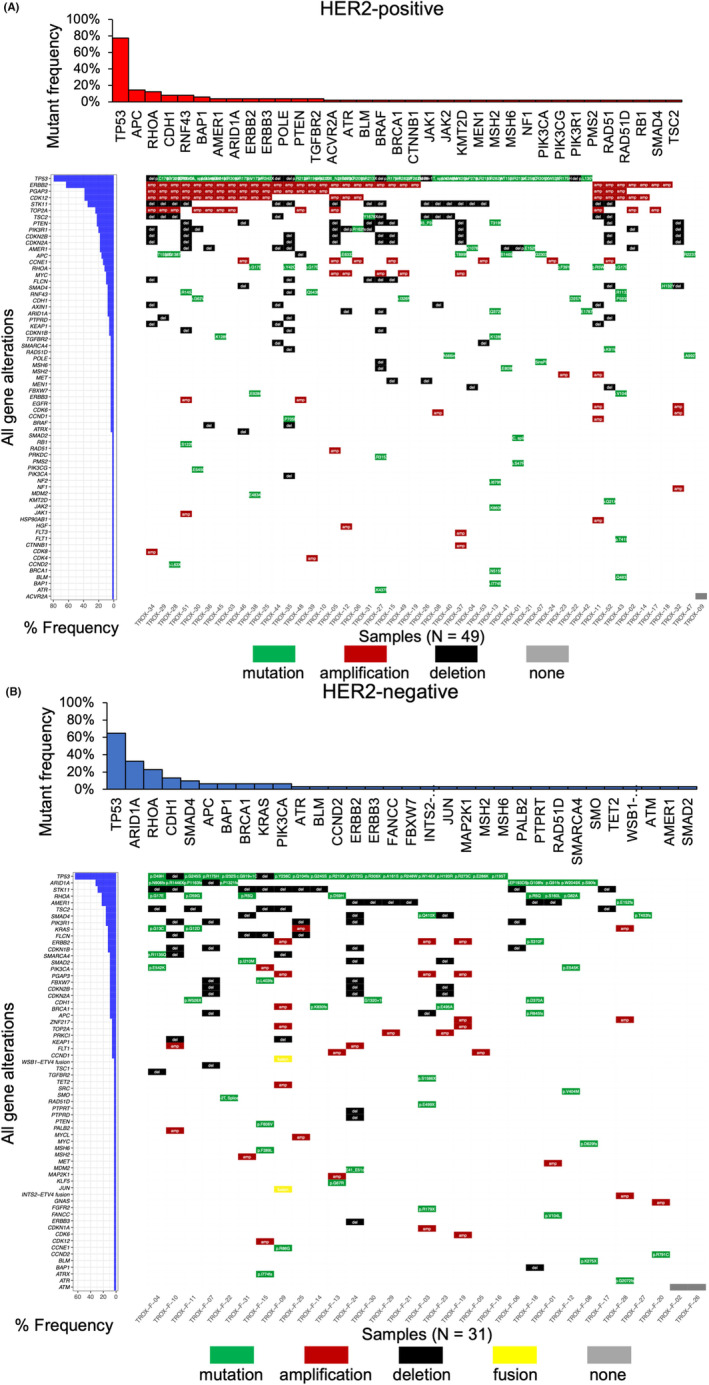
Genomic landscape based on HER2 status in this study (n = 80). Middle panel: All gene alterations identified by CANCERPLEX‐JP are shown in the tile plots. Green represents a mutation with detailed data described in each box; red represents amplification; black represents a deletion; yellow represents a fusion gene; gray represents no gene alterations found. Left panel: Bar plots denote the individual prevalence of all gene alterations. Upper panel: Bar plots denote the individual prevalence of all gene mutations. (A) Molecular characteristics of HER2‐positive gastric cancer patients (n = 49). (B) Molecular characteristics of HER2‐negative gastric cancer patients (n = 31).
3.2. Nonsynonymous mutations between HER2‐positive and HER2‐negative gastric cancer patients
Next, we compared nonsynonymous mutations between HER2‐positive and HER2‐negative gastric cancer cases. There were no significant differences in the number of nonsynonymous mutations between HER2‐positive and HER2‐negative patients (Figure 3A). However, the total mutational numbers in HER2‐negative patients with ARID1A mutation were significantly higher than in HER2‐positive patients (Figure 3A, Mann–Whitney U test p = 0.003). The median number of nonsynonymous mutations in HER2‐negative tumors with ARID1A mutation and HER2‐positive tumors with ARID1A mutation was 4 and 5.5, respectively (Figure S1). The volcano plot shows the enrichment of nonsynonymous mutations based on the HER2 status (Figure 3B). ARID1A mutation was significantly enriched in HER2‐negative patients (Fisher's exact test p < 0.001). Although not significant, the enriched mutations in HER2‐negative patients included KRAS, RHOA, SMAD4, FBXW7, SMO, ATM, MAP2K1, JUN, PTPRT, SMARCA4, TET2, FANCC, CCND2, PALB2, BRCA1, SMAD2, and PI3KCA. The enriched mutations in HER2‐positive patients were RNF43, APC, PTEN, POLE, and TGFBR2.
FIGURE 3.
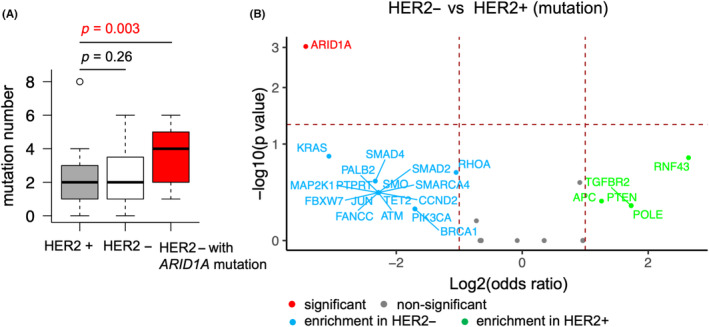
Differences in nonsynonymous mutations between HER2‐positive and HER2‐negative gastric cancer. HER2+, HER2‐positive; HER2‐, HER2‐negative. (A) The numbers of mutations in HER2‐positive patients (n = 49), HER2‐negative patients (n = 31), and HER2‐negative patients with ARID1A mutation (n = 10) are shown in the boxplot. Mann–Whitney U test p‐value <0.05 is shown in red. (B) Volcano plot showing the enriched gene mutations in HER2‐positive (n = 49) and HER2‐negative (n = 31) gastric cancer patients. The horizontal madder red line denotes a p‐value of 0.05, and the two vertical madder red lines denote a log2 odds ratio (OR) of 1. Only the genes that have log2 OR >1 are annotated. Fisher's exact tests were performed, and the genes with p < 0.05 are annotated in red.
3.3. CNVs between HER2‐positive and HER2‐negative gastric cancer patients
Furthermore, we compared the gene alterations of CNVs between HER2‐positive and HER2‐negative gastric cancer cases. The number of gene amplifications was significantly higher in HER2‐positive patients than in HER2‐negative patients (Figure 4A, Mann–Whitney U test p = 0.001). There were no significant differences in the number of gene deletions between HER2‐positive and HER2‐negative patients (Figure 4B). Additionally, the amplifications of ERBB2, CDK12, and PGAP3 were significantly enriched in HER2‐positive patients (Figure 4C, Fisher's exact test p < 0.01). Although not significantly, the amplifications of TOP2A, CCNE1, MYC, MET, and EGFR, and the deletions of PTEN, AXIN1, CDKN2A, CDKN2B, MEN1, and TP53 were enriched in HER2‐positive patients (Figure 4C,D). In HER2‐negative patients, the enriched CNVs included amplifications of PRKCI, ZNF217, KRAS, PIK3CA, CDK6, GNAS, FGFR2, MYCL, FLT1, KLF5, SRC, BRCA1, MDM2, and FLT1, and deletions of TSC1, CDKN1A, TGFBR2, APC, SMAD2, and CDKN1B (Figure 4C,D).
FIGURE 4.
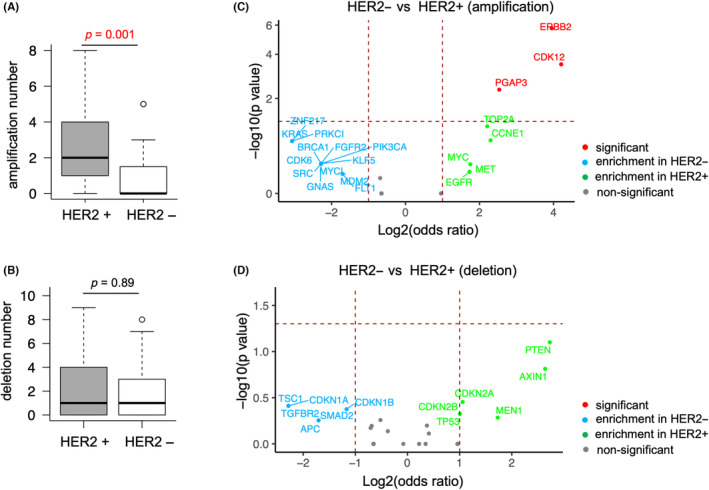
Differences in copy number variations (CNVs) between HER2‐positive and HER2‐negative gastric cancer patients. HER2+, HER2‐positive; HER2‐, HER2‐negative. The horizontal madder red line denotes a p‐value of 0.05, and the two vertical madder red lines denote a log2 odds ratio (OR) of 1. Only the genes that have log2 OR >1 or < −1 are annotated. Fisher's exact tests were performed, and the genes with p < 0.05 are annotated in red. (A) The numbers of amplifications in HER2‐positive patients (n = 49) and HER2‐negative patients (n = 31) are shown in the boxplot. Mann–Whitney U test p‐value <0.05 is shown in red. (B). The numbers of deletions in HER2‐positive patients (n = 49) and HER2‐negative patients (n = 31) are shown in the boxplot. (C) Volcano plot showing the enriched gene amplifications in HER2‐positive and HER2‐negative patients. (D) Volcano plot showing the enriched gene deletions in HER2‐positive and HER2‐negative patients.
3.4. Pathway analyses using gene alterations
According to the enriched gene alterations, we performed pathway analyses to clarify the potential mechanism underlying tumor progression in HER2‐positive and negative gastric cancer patients. We assessed the enrichment of the KEGG pathway using DAVID bioinformatics resources, as described in the Materials and Methods section. The pathways significantly enriched in both HER2‐positive and negative patients were defined as shared pathways, while those only significantly enriched in HER2‐positive or negative patients were defined as unique pathways. As shown in Figure 5, 14 shared pathways were identified, most of which were critical for tumorigenesis and progression. Only one pathway, transcriptional misregulation in cancer, was a unique pathway of HER2‐positive patients. Seventeen unique pathways of HER2‐negative patients were identified, including several immune‐related pathways.
FIGURE 5.
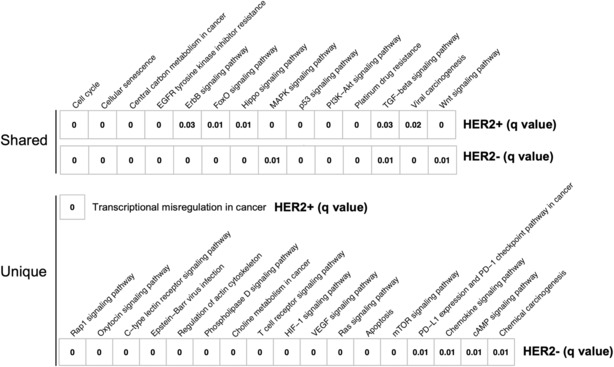
Pathway analyses for the enriched gene alterations in HER2‐positive and HER2‐negative gastric cancer. The FDR‐adjusted p‐value (q‐value) is shown in each box and represents the significance of associations between KEGG pathways and HER2 status. The pathways significantly enriched in both HER2‐positive and negative patients are defined as shared pathways. The pathways only significantly enriched in HER2‐positive or negative patients are defined as unique pathways.
3.5. Comparison of TMB between HER2‐positive and HER2‐negative gastric cancer patients
In addition, we focused on TMB differences between HER2‐positive and HER2‐negative gastric cancer patients. TMB, defined as the rate of peptide‐changing SNVs per Mb, was determined using the CANCERPLEX‐JP panel. The median TMB value for HER2‐positive patients, HER2‐negative patients, and HER2‐negative patients with ARID1A mutation was 14.6, 16.2, and 17.7, respectively (Figure 6A, Mann–Whitney U test, HER2‐positive vs HER2‐negative p = 0.15 & HER2‐positive vs HER2‐negative with ARID1A mutation p = 0.22). The median TMB value for HER2‐positive patients with ARID1A mutation was 16.2 (Figure S1). There was a trend toward a higher TMB in HER2‐negative gastric cancer patients, particularly in patients with ARID1A mutation, though this was not statistically significant.
FIGURE 6.
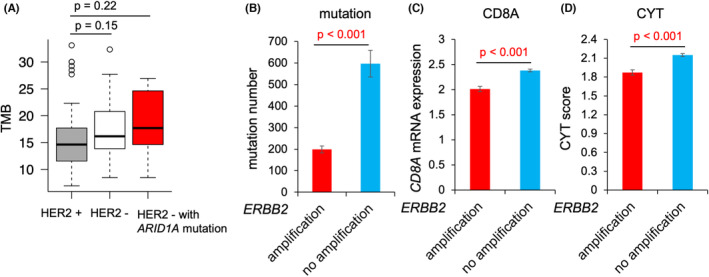
Associations between HER2 status and local immune environment factors. (A) TMB of HER2‐positive patients (n = 49), HER2‐negative patients (n = 31), and HER2‐negative patients with ARID1A mutation (n = 10) are shown in the boxplot. (B) Bar plot showing the total number of mutations in ERBB2‐amplified gastric cancer patients (n = 70) and ERBB2‐nonamplified gastric cancer patients (n = 323) from The Cancer Genome Atlas (TCGA) dataset. Student's t‐test p‐value <0.05 is shown in red. (C) Bar plot showing CD8A mRNA expression levels in ERBB2‐amplified gastric cancer patients (n = 75) and ERBB2‐nonamplified gastric cancer patients (n = 338) from the TCGA dataset. Student's t‐test p‐value <0.05 is shown in red. (D) Bar plot showing the CYT score in ERBB2‐amplified gastric cancer patients (n = 75) and ERBB2‐nonamplified gastric cancer patients (n = 338) from the TCGA dataset. Student's t‐test p‐value <0.05 is shown in red.
3.6. Association between the local immune environment and ERBB2 amplification in gastric cancer patients
We also assessed the associations between ERBB2 amplification and local immune environment factors in gastric cancer patients from the TCGA dataset. Local immune environment factors included the number of nonsynonymous mutations, CD8A mRNA expression levels, and CYT score, which has already been reported as a quantitative method of antitumor immunity. 16 The total number of nonsynonymous mutations was significantly higher in patients without ERBB2 amplification (n = 323) compared with that in patients with ERBB2 amplification (n = 70; Figure 6B, Student's t‐test p < 0.001). Moreover, CD8A mRNA expression levels, a marker of CD8+ T cells, and CYT score were both significantly higher in patients without ERBB2 amplification (n = 338) than in patients with ERBB2 amplification (n = 75; Figure 6C,D, Student's t‐test p < 0.001).
3.7. HER2/ ERBB2 concordance in this study
Lastly, we assessed the concordance between HER2 status determined by clinicians using traditional methods and ERBB2 amplification measured by the CANCERPLEX‐JP panel (Table S3). HER2 positivity was defined as an IHC score of 3 or an IHC score of 2 with a FISH HER2/CEP17 score ≥2. Overall, the HER2/ERBB2 concordance rate was 73.8% (59/80). The HER2/ERBB2 positive percentage agreement among patients who were HER2‐positive was 63.3% (31/49), while the HER2/ERBB2 negative percentage agreement among patients who were HER2‐negative was 90.3% (28/31). Furthermore, the HER2/ERBB2‐positive percentage agreements among patients who were IHC score of 3 was 67.6% (25/37). The HER2/ERBB2‐positive percentage agreements among patients who were IHC score of 2 with a FISH HER2/CEP17 score ≥2 was 50% (6/12). The HER2/ERBB2‐positive percentage agreement was higher in patients with an IHC score of 3 than in patients with an IHC score of 2 with a FISH HER2/CEP17 score ≥2.
4. DISCUSSION
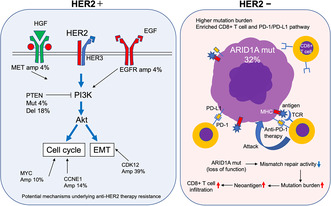
Several elegant studies have described the genomic profile differences between HER2‐positive and HER2‐negative gastric cancer cases, suggesting the potential mechanism underlying trastuzumab resistance in these patients. 17 , 18 , 19 However, most were small‐size retrospective studies and how the genomic differences potentially affect tumor progression in HER2‐positive and negative gastric cancer remains unclear. Using the CANCERPLEX‐JP 435‐gene panel, we profiled the genomic landscape of 49 HER2‐positive and 31 HER2‐negative gastric cancer patients who were enrolled in a prospective phase II trial. Specifically, we identified the enriched gene alterations and pathways based on patient HER2 status and examined the potential influences of the genomic differences on tumor progression and treatment responses (Figure 7).
FIGURE 7.
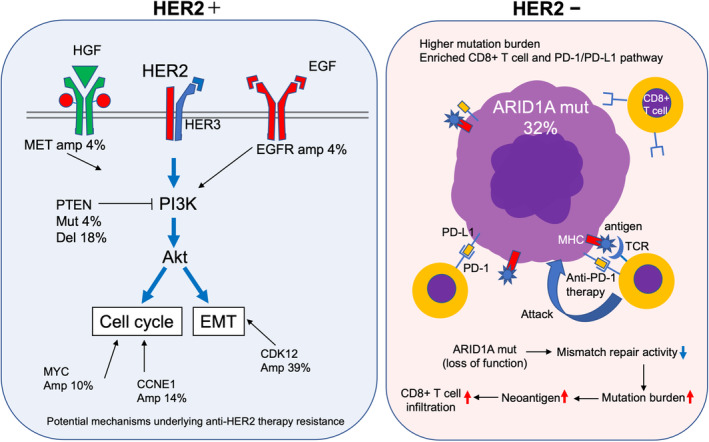
Overall summary of genomic characteristics of HER2‐positive and negative gastric cancer patients. Percentages around the gene symbol represent the frequency of gene alterations. Amp, amplification; Del, deletion; Mut, mutation.
In HER2‐positive tumors, we first focused on two enriched gene alterations: PTEN mutations and PTEN deletions. The PTEN mutations were p.T319fs, a frameshift mutation, and p.Q245_P248del, a novel nucleotide deletion, that were observed in two patients. Both can lead to the loss of PTEN function and subsequent activation of the PI3K/Akt pathway. Moreover, we observed PTEN deletions as CNVs in nine patients. PTEN deletions lead to low PTEN gene expression levels. Numerous studies have shown that PTEN‐negative tumors are unresponsive to trastuzumab, including breast and gastric cancers. 8 , 9 , 18 , 20 Thus, the observed PTEN mutations and deletions may be the potential mechanism underlying trastuzumab resistance in HER2‐positive gastric cancer.
Next, we found a significantly higher number of gene amplifications in HER2‐positive patients than in HER2‐negative patients, suggesting that gene amplification may be involved in acquired resistance to anti‐HER2 therapy. We focused on the enriched amplifications of CDK12, MET, and EGFR in HER2‐positive patients. Both ERBB2 and CDK12 are located at chromosome 17q12, which is a highly amplified region in gastric cancer. 21 Consistent with several previous reports, 21 , 22 , 23 our results suggested that ERBB2 and CDK12 were co‐amplified in 39% of HER2‐positive patients, as shown in Figure 2A. Interestingly, recent in vitro experiments showed that CDK12 drove trastuzumab resistance and treatment with a CDK12 inhibitor enhanced the sensitivity to anti‐HER2 therapy through the PI3K/Akt and Wnt pathways in breast cancer. 24 , 25 Thus, co‐amplification of CDK12 and ERBB2 may be a potential mechanism underlying trastuzumab resistance in gastric cancer. Furthermore, MET and EGFR are well‐known oncogenes that activate the PI3K/Akt pathway in breast cancer, so trastuzumab cannot completely mitigate this signaling. 26 , 27 These gene amplifications may also potentially affect the response to anti‐HER2 therapy in gastric cancer.
In HER2‐negative patients, we focused on the ARID1A mutations, which were the most enriched and the second most common after TP53 mutations. Consistent with a previous report, 28 the majority of ARID1A mutations in our study were inactivating mutations that can lead to the loss of ARID1A expression. Interestingly, ARID1A interacts with mismatch repair protein MSH2, and ARID1A deficiency could increase the mutation load across multiple human cancer types. 29 Moreover, an ARID1A‐deficient ovarian cancer mice model displayed an increased mutation load, elevated numbers of tumor‐infiltrating lymphocytes, and higher PD‐L1 expression levels. 29 These data indicate that HER2‐negative tumors with ARID1A mutation may be a “hot tumor” and encouraged us to further explore the associations between local immune environments and HER2 status in gastric cancer. Although only two tumors with ARID1A mutation were found in HER2‐positive patients (2/49), there were no obvious differences in mutation numbers and TMB between HER2‐positive tumors with ARID1A mutation and HER2‐negative tumors with ARID1A mutation. Therefore, the immunogenicity in HER2‐positive tumors with ARID1A mutation may be similar to that in HER2‐negative tumors with ARID1A mutation.
Pathway analyses showed that several immune‐related pathways were significantly associated with HER2‐negative gastric cancer, including PD‐L1 expression and the PD‐1 immune checkpoint pathway. Furthermore, compared with that in HER2‐positive patients, the TMB value calculated by the targeted NGS panel tended to be higher in HER2‐negative patients, particularly in patients with ARID1A mutation. In addition, TCGA whole exome sequencing dataset analyses showed that ERBB2‐nonamplified gastric cancer cases harbored higher mutation numbers, CD8A expression levels, and CYT scores. All these findings supported our hypothesis that HER2‐negative gastric cancer is a relatively “hot tumor,” while HER2‐positive gastric cancer is a relatively “cold tumor.” According to our hypothesis, patients with HER2‐positive gastric cancer may not benefit from immune checkpoint inhibitors. However, trastuzumab has been shown to activate both innate and adaptive immune responses through antibody‐dependent cellular cytotoxicity (ADCC) 30 and antibody‐dependent cellular phagocytosis (ADCP). 31 This is believed to be a reason why patients with HER2‐positive gastric cancer have better responses to immune checkpoint inhibitors when combined with trastuzumab therapy. 32
The concordance rate of HER2 status and ERBB2 amplification was 73.8% in this study, similar to the concordance rates in several previous reports. 33 , 34 Intratumor heterogeneity possibly induces the differences between HER2 status and ERBB2 amplification. This study has two limitations. First, clinical data will only be available when the clinical analysis of the parent study is completed. Second, no in vivo or in vitro experiments have been conducted to further support our hypothesis. The results of this study should be validated in the future using genomic analysis that combines the clinical and experimental data.
It is well known that alcohol consumption is a risk factor for gastric cancer. Gastric ADH (alcohol dehydrogenase) is responsible for the majority of ethanol metabolism in human gastric cells and forms a metabolic barrier against orally administered alcohol. 35 , 36 , 37 Therefore, gastric ADH may be involved in carcinogenesis, and it would be interesting to determine the role of ADH in gastric cancer. However, ADH is not included in the cancer gene panel used in this study. The association between gastric ADH and HER2 status should be investigated in the future.
In conclusion, here we showed the comprehensive genomic differences between HER2‐positive and HER2‐negative gastric cancer patients from a prospective trial. Several gene alterations in the HER2 pathway may be the potential mechanism underlying trastuzumab resistance. Moreover, relative to HER2‐positive gastric cancer, HER2‐negative gastric cancer cases with ARID1A mutation may be hot tumors that are responsive to immune checkpoint inhibitors.
AUTHOR CONTRIBUTIONS
Qingjiang Hu: Conceptualization (lead); data curation (lead); formal analysis (lead); funding acquisition (lead); investigation (lead); methodology (lead); project administration (lead); resources (lead); software (lead); validation (lead); visualization (lead); writing – original draft (lead); writing – review and editing (lead). Eiji Oki: Data curation (equal); funding acquisition (equal); project administration (equal); supervision (equal). Teppei Yamada: Supervision (equal). Tomomi Kashiwada: Resources (equal). Hideto Sonoda: Resources (equal). Masato Kataoka: Resources (equal). Hirofumi Kawanaka: Resources (equal). Yasushi Tsuji: Resources (equal). Akitaka Makiyama: Resources (equal). Yuichiro Nakashima: Project administration (equal); resources (equal). Mitsuhiko Ota: Resources (equal); supervision (equal). Yasue Kimura: Resources (equal); supervision (equal). Tomoharu Yoshizumi: Supervision (equal).
CONFLICT OF INTEREST STATEMENT
Eiji Oki reports research funding from Guardant Health, Inc. and reports honoraria from Ono Pharm., Takeda Pharm., Bayer, Chugai Pharm, Taiho Pharm., Eli Lilly Japan, and Bristol‐Myers Squibb. Yasue Kimura belonged to an endowed chair funded by Denka Company Limited from June 2020 to March 2023.
ETHICAL APPROVAL STATEMENT
This study was approved by Kyushu University Certified Institutional Review Board for Clinical Trials. Informed consent was obtained from all participants.
Supporting information
Figure S1.
Table S1.
Table S2.
Table S3.
ACKNOWLEDGMENTS
The authors thank S Sakamoto, S Tsurumaru, A Nakamura, M Nakashima, and Y Kubota for their technical assistance. This work was managed by the Kyushu study group of clinical cancer (KSCC). We thank J. Iacona, Ph.D., from Edanz (https://jp.edanz.com/ac) for editing a draft of this manuscript. This work was supported in part by the following grants and foundations: Nippon Kayaku, Hirose Foundation, and DENKA Company Limited.
Hu Q, Oki E, Yamada T, et al. Genomic characterization between HER2‐positive and negative gastric cancer patients in a prospective trial. Cancer Med. 2023;12:16649‐16660. doi: 10.1002/cam4.6269
DATA AVAILABILITY STATEMENT
The data that support the findings of this study are available from the corresponding author upon reasonable request.
REFERENCES
- 1. Bray F, Ferlay J, Soerjomataram I, Siegel RL, Torre LA, Jemal A. Global cancer statistics 2018: GLOBOCAN estimates of incidence and mortality worldwide for 36 cancers in 185 countries. CA Cancer J Clin. 2018;68(6):394‐424. doi: 10.3322/caac.21492 [DOI] [PubMed] [Google Scholar]
- 2. Nakamura Y, Taniguchi H, Ikeda M, et al. Clinical utility of circulating tumor DNA sequencing in advanced gastrointestinal cancer: SCRUM‐Japan GI‐SCREEN and GOZILA studies. Nat Med. 2020;26(12):1859‐1864. doi: 10.1038/s41591-020-1063-5 [DOI] [PubMed] [Google Scholar]
- 3. Bang YJ, Van Cutsem E, Feyereislova A, et al. Trastuzumab in combination with chemotherapy versus chemotherapy alone for treatment of HER2‐positive advanced gastric or gastro‐oesophageal junction cancer (ToGA): a phase 3, open‐label, randomised controlled trial. Lancet. 2010;376(9742):687‐697. doi: 10.1016/S0140-6736(10)61121-X [DOI] [PubMed] [Google Scholar]
- 4. Shitara K, Ozguroglu M, Bang YJ, et al. Pembrolizumab versus paclitaxel for previously treated, advanced gastric or gastro‐oesophageal junction cancer (KEYNOTE‐061): a randomised, open‐label, controlled, phase 3 trial. Lancet. 2018;392(10142):123‐133. doi: 10.1016/S0140-6736(18)31257-1 [DOI] [PubMed] [Google Scholar]
- 5. Doebele RC, Drilon A, Paz‐Ares L, et al. Entrectinib in patients with advanced or metastatic NTRK fusion‐positive solid tumours: integrated analysis of three phase 1‐2 trials. Lancet Oncol. 2020;21(2):271‐282. doi: 10.1016/S1470-2045(19)30691-6 [DOI] [PMC free article] [PubMed] [Google Scholar]
- 6. Shitara K, Baba E, Fujitani K, Oki E, Fujii S, Yamaguchi K. Discovery and development of trastuzumab deruxtecan and safety management for patients with HER2‐positive gastric cancer. Gastric Cancer. 2021;24(4):780‐789. doi: 10.1007/s10120-021-01196-3 [DOI] [PMC free article] [PubMed] [Google Scholar]
- 7. Cancer Genome Atlas Research N . Comprehensive molecular characterization of gastric adenocarcinoma. Nature. 2014;513(7517):202‐209. doi: 10.1038/nature13480 [DOI] [PMC free article] [PubMed] [Google Scholar]
- 8. Kim C, Lee CK, Chon HJ, et al. PTEN loss and level of HER2 amplification is associated with trastuzumab resistance and prognosis in HER2‐positive gastric cancer. Oncotarget. 2017;8(69):113494‐113501. doi: 10.18632/oncotarget.23054 [DOI] [PMC free article] [PubMed] [Google Scholar]
- 9. Yokoyama D, Hisamori S, Deguchi Y, et al. PTEN is a predictive biomarker of trastuzumab resistance and prognostic factor in HER2‐overexpressing gastroesophageal adenocarcinoma. Sci Rep‐Uk. 2021;11(1):9013. doi: 10.1038/s41598-021-88331-3 [DOI] [PMC free article] [PubMed] [Google Scholar]
- 10. Zaitsu Y, Oki E, Ando K, et al. Loss of heterozygosity of PTEN (encoding phosphate and tensin homolog) associated with elevated HER2 expression is an adverse prognostic indicator in gastric cancer. Oncology. 2015;88(3):189‐194. doi: 10.1159/000368984 [DOI] [PubMed] [Google Scholar]
- 11. Hu QJ, Masuda T, Koike K, et al. Oxysterol binding protein‐like 3 (OSBPL3) is a novel driver gene that promotes tumor growth in part through R‐Ras/Akt signaling in gastric cancer. Sci Rep‐Uk. 2021;11(1):19178. doi: 10.1038/s41598-021-98485-9 [DOI] [PMC free article] [PubMed] [Google Scholar]
- 12. Hu QJ, Masuda T, Kuramitsu S, et al. Potential association of LOXL1 with peritoneal dissemination in gastric cancer possibly via promotion of EMT. Plos One. 2020;15(10):e0241140. doi: 10.1371/journal.pone.0241140 [DOI] [PMC free article] [PubMed] [Google Scholar]
- 13. Hu Q, Masuda T, Sato K, et al. Identification of ARL4C as a peritoneal dissemination‐associated gene and its clinical significance in gastric cancer. Ann Surg Oncol. 2018;25(3):745‐753. doi: 10.1245/s10434-017-6292-6 [DOI] [PubMed] [Google Scholar]
- 14. Yost SE, Smith EN, Schwab RB, et al. Identification of high‐confidence somatic mutations in whole genome sequence of formalin‐fixed breast cancer specimens. Nucleic Acids Res. 2012;40(14):e107. doi: 10.1093/nar/gks299 [DOI] [PMC free article] [PubMed] [Google Scholar]
- 15. Eifert C, Pantazi A, Sun R, et al. Clinical application of a cancer genomic profiling assay to guide precision medicine decisions. Per Med. 2017;14(4):309‐325. doi: 10.2217/pme-2017-0011 [DOI] [PMC free article] [PubMed] [Google Scholar]
- 16. Hu QJ, Nonaka K, Wakiyama H, et al. Cytolytic activity score as a biomarker for antitumor immunity and clinical outcome in patients with gastric cancer. Cancer Med‐Us. 2021;10(9):3129‐3138. doi: 10.1002/cam4.3828 [DOI] [PMC free article] [PubMed] [Google Scholar]
- 17. Zhou CF, Feng XJ, Yuan F, et al. Difference of molecular alterations in HER2‐positive and HER2‐negative gastric cancers by whole‐genome sequencing analysis. Cancer Manag Res. 2018;10:3945‐3954. doi: 10.2147/Cmar.S172710 [DOI] [PMC free article] [PubMed] [Google Scholar]
- 18. Diaz‐Serrano A, Angulo B, Dominguez C, et al. Genomic profiling of HER2‐positive gastric cancer: PI3K/Akt/mTOR pathway as predictor of outcomes in HER2‐positive advanced gastric cancer treated with trastuzumab. Oncologist. 2018;23(9):1092‐1102. doi: 10.1634/theoncologist.2017-0379 [DOI] [PMC free article] [PubMed] [Google Scholar]
- 19. Hino K, Nishina T, Kajiwara T, et al. Association of ERBB2 copy number and gene Coalterations with trastuzumab efficacy and resistance in human epidermal growth factor receptor 2‐positive esophagogastric and gastric cancer. JCO Precis Oncol. 2022;6:e2200135. doi: 10.1200/PO.22.00135 [DOI] [PMC free article] [PubMed] [Google Scholar]
- 20. Nagata Y, Lan KH, Zhou XY, et al. PTEN activation contributes to tumor inhibition by trastuzumab, and loss of PTEN predicts trastuzumab resistance in patients. Cancer Cell. 2004;6(2):117‐127. doi: 10.1016/j.ccr.2004.06.022 [DOI] [PubMed] [Google Scholar]
- 21. Kwon MJ, Kim RN, Song K, et al. Genes co‐amplified with ERBB2 or MET as novel potential cancer‐promoting genes in gastric cancer. Oncotarget. 2017;8(54):92209‐92226. doi: 10.18632/oncotarget.21150 [DOI] [PMC free article] [PubMed] [Google Scholar]
- 22. Koboldt DC, Fulton RS, McLellan MD, et al. Comprehensive molecular portraits of human breast tumours. Nature. 2012;490(7418):61‐70. doi: 10.1038/nature11412 [DOI] [PMC free article] [PubMed] [Google Scholar]
- 23. Li ZT, Chen SY, Feng WJ, et al. A pan‐cancer analysis of HER2 index revealed transcriptional pattern for precise selection of HER2‐targeted therapy. EBioMedicine. 2020;62:103074. doi: 10.1016/j.ebiom.2020.103074 [DOI] [PMC free article] [PubMed] [Google Scholar]
- 24. Choi HJ, Jin S, Cho H, et al. CDK12 drives breast tumor initiation and trastuzumab resistance via WNT and IRS1‐ErbB‐PI3K signaling. EMBO Rep. 2019;20(10):e48058. doi: 10.15252/embr.201948058 [DOI] [PMC free article] [PubMed] [Google Scholar]
- 25. Li H, Wang JS, Yi ZB, et al. CDK12 inhibition enhances sensitivity of HER2+breast cancers to HER2‐tyrosine kinase inhibitor via suppressing PI3K/AKT. Eur J Cancer. 2021;145:92‐108. doi: 10.1016/j.ejca.2020.11.045 [DOI] [PubMed] [Google Scholar]
- 26. Gallardo A, Lerma E, Escuin D, et al. Increased signalling of EGFR and IGF1R, and deregulation of PTEN/PI3K/Akt pathway are related with trastuzumab resistance in HER2 breast carcinomas. Br J Cancer. 2012;106(8):1367‐1373. doi: 10.1038/bjc.2012.85 [DOI] [PMC free article] [PubMed] [Google Scholar]
- 27. Shattuck DL, Miller JK, Carraway KL 3rd, et al. Met receptor contributes to trastuzumab resistance of Her2‐overexpressing breast cancer cells. Cancer Res. 2008;68(5):1471‐1477. doi: 10.1158/0008-5472.CAN-07-5962 [DOI] [PubMed] [Google Scholar]
- 28. Wu RC, Wang TL, Shih Ie M. The emerging roles of ARID1A in tumor suppression. Cancer Biol Ther. 2014;15(6):655‐664. doi: 10.4161/cbt.28411 [DOI] [PMC free article] [PubMed] [Google Scholar]
- 29. Shen JF, Ju ZL, Zhao W, et al. ARID1A deficiency promotes mutability and potentiates therapeutic antitumor immunity unleashed by immune checkpoint blockade. Nat Med. 2018;24(5):556‐562. doi: 10.1038/s41591-018-0012-z [DOI] [PMC free article] [PubMed] [Google Scholar]
- 30. Clynes RA, Towers TL, Presta LG, Ravetch JV. Inhibitory Fc receptors modulate in vivo cytotoxicity against tumor targets. Nat Med. 2000;6(4):443‐446. doi: 10.1038/74704 [DOI] [PubMed] [Google Scholar]
- 31. Grugan KD, McCabe FL, Kinder M, et al. Tumor‐associated macrophages promote invasion while retaining Fc‐dependent anti‐tumor function. J Immunol. 2012;189(11):5457‐5466. doi: 10.4049/jimmunol.1201889 [DOI] [PubMed] [Google Scholar]
- 32. Janjigian YY, Kawazoe A, Yanez P, et al. The KEYNOTE‐811 trial of dual PD‐1 and HER2 blockade in HER2‐positive gastric cancer. Nature. 2021;600(7890):727‐730. doi: 10.1038/s41586-021-04161-3 [DOI] [PMC free article] [PubMed] [Google Scholar]
- 33. Stein SM, Snider J, Ali SM, et al. Real‐world association of HER2/ERBB2 concordance with trastuzumab clinical benefit in advanced esophagogastric cancer. Future Oncol. 2021;17(31):4101‐4114. doi: 10.2217/fon-2021-0203 [DOI] [PubMed] [Google Scholar]
- 34. Cho‐Phan CD, Snider J, Zhang LL, McGregor K, Schrock AB, Castellanos E. Concordance of HER2+status by IHC/ISH and ERBB2 status by NGS in a real‐world clinicogenomic database and analysis of outcomes in patients (pts) with metastatic breast cancer (mBC). J Clin Oncol. 2021;39(15):1036. doi: 10.1200/JCO.2021.39.15_suppl.1036 [DOI] [Google Scholar]
- 35. Jelski W, Chrostek L, Szmitkowski M. The activity of class I, III and IV of alcohol dehydrogenase isoenzymes and aldehyde dehydrogenase in gastric cancer. Dig Dis Sci. 2007;52:531‐535. [DOI] [PubMed] [Google Scholar]
- 36. Jelski W, Chrostek L, Zalewski B, Szmitkowski M. Alcohol dehydrogenase (ADH) isoenzymes and aldehyde dehydrogenase (ALDH) activity in the sera of patients with gastric cancer. Dig Dis Sci. 2008;53:2101‐2105. [DOI] [PubMed] [Google Scholar]
- 37. Jelski W, Orywal K, Łaniewska M, et al. The diagnostic value of alcohol dehydrogenase (ADH) isoenzymes and aldehyde dehydrogenase (ALDH) measurement in the sera of gastric cancer patients. Clin Exp Med. 2010;4:215‐219. [DOI] [PubMed] [Google Scholar]
Associated Data
This section collects any data citations, data availability statements, or supplementary materials included in this article.
Supplementary Materials
Figure S1.
Table S1.
Table S2.
Table S3.
Data Availability Statement
The data that support the findings of this study are available from the corresponding author upon reasonable request.


