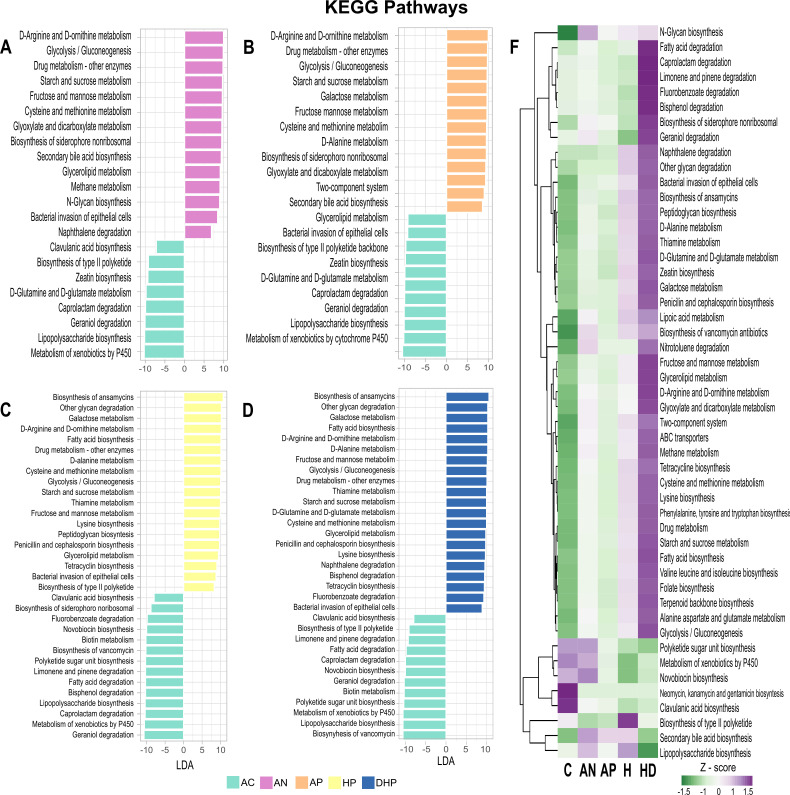
FIG 7.
Metabolic activity by the bacterial community present in each clinical group as inferred by Picrust2 software and KEGG database. (A), (B), (C), and (D) differentially abundant pathways between clinical groups. Pathways enriched in the AC group are indicated with negative LDA score (mint green) and pathways enriched in symptomatic groups with a positive score. Only pathways with a significant LDA threshold of > 5 are shown; (F) presents heatmap with z-scores of the relative abundance of the metabolic pathways level 3 as defined in KEGG.

