Fig 2.
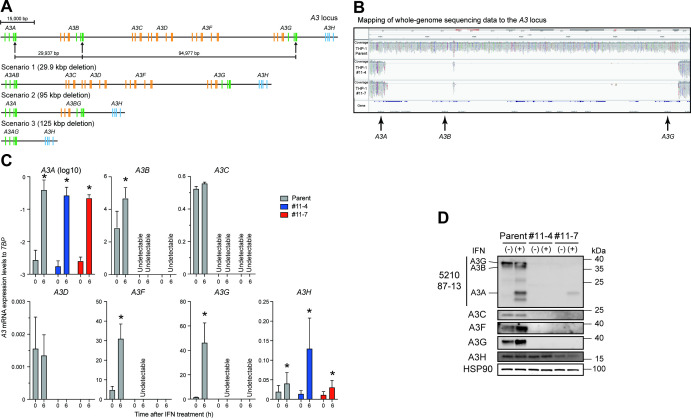
Disruption of the A3A to A3G genes in THP-1 cells. (A) Schematic of the A3 gene at the A3 locus. The A3 family of genes comprises seven members with one or two Z domains (single- or double-domain deaminases) which belong to three phylogenetically distinct groups shown in green, orange, and blue. Three sites with an identical sequence (5´-GAG TGG GAG GCT GCG GGC CA) in exon 4 of the A3A gene, exon 7 of the A3B gene, and exon 7 of the A3G gene are targeted by gRNA, as indicated by arrows. The three predicted scenarios are shown. Bar represents 15,000 bp. (B) Mapping of WGS data to the A3 locus. Genomic DNAs from parental THP-1, THP-1#11-4, and #11-7 cells were subjected to WGS analysis, with an extensive deletion including the A3A–A3G genes observed in THP-1#11-4 and #11-7 clones. (C) RT-qPCR data. Parental THP-1, THP-1#11-4, and #11-7 cells were treated with 500 units/mL type I IFN. Total RNA was isolated after 6 h. A3 mRNA expression levels were quantified by RT-qPCR and are normalized to TATA-binding protein (TBP) mRNA levels. Each bar represents the average of three independent experiments with SD. Statistical significance was determined using the two-sided paired t test. *, P < 0.05 compared to untreated cells. (D) Representative western blots of three independent experiments. Levels of indicated A3 proteins in whole-cell lysates from cells treated with or without type I IFN are shown. HSP90 was used as a loading control.

