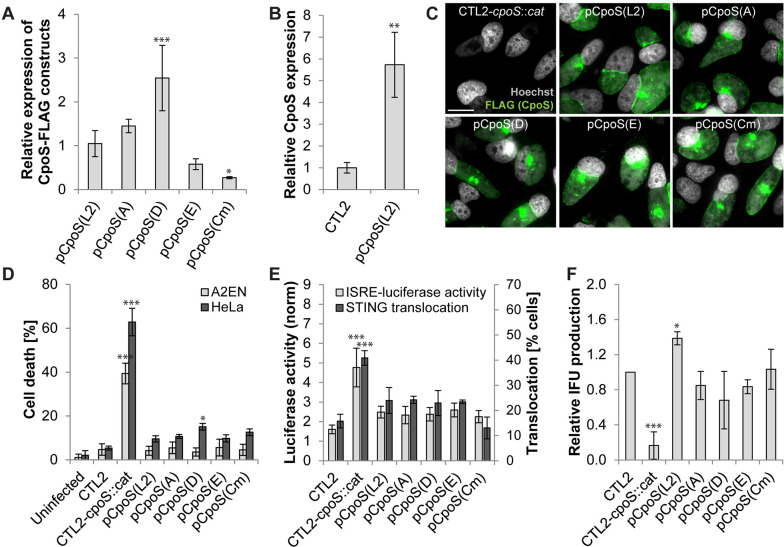
Fig 1.
CpoS orthologs broadly complement a cpoS null mutant in C. trachomatis L2. (A and B) Expression levels of CpoS orthologs in infected HeLa cells [10 inclusion forming units (IFU)/cell, 32 hpi] determined by western blot analysis using anti-FLAG (A) or anti-CpoS (B) antibodies and displayed relative to levels observed during infection with CTL2-cpoS::cat/pCpoS(L2)-FLAG (A) or CTL2 (B). (C) Localization of CpoS orthologs in infected HeLa cells (5 IFU/cell, 22 hpi, scale = 20 µm). (D) Ability of CpoS orthologs to block cell death in infected cells (10 IFU/cell, 24 hpi). (E) Ability of CpoS orthologs to dampen the IFN response. Left y-axis: Luciferase activity in infected A2EN-ISRE reporter cells (10 IFU/cell, 14 hpi). Right y-axis: Frequency of STING activation (defined as microscopically detectable STING translocation from the ER to perinuclear vesicles) in MLFs (2.5 IFU/cell, 18 hpi, at least 270 cells per condition analyzed). (F) Ability of CpoS orthologs to restore the production of IFUs (i.e., EBs) in HeLa cells (measured at 36 hpi and displayed relative to IFU production by CTL2). All quantitative data in Fig. 1 represent mean ± SD [n = 6 (A2EN in the panel D), n = 3 (else); Student’s t-test (B) or one-way ANOVA (else): indicated are significant differences compared to pCpoS(L2) (A) or CTL2 (else)].

