

Key Points
-
•
Patients with MZL who had M-protein at diagnosis had inferior PFS compared with those with no M-protein.
-
•
MZLs producing M-protein at diagnosis have a higher risk of histologic transformation.
Visual Abstract
Abstract
Given the paucity of data surrounding the prognostic relevance of monoclonal paraprotein (M-protein) in marginal zone lymphoma (MZL), we sought to evaluate the impact of detecting M-protein at diagnosis on outcomes in patients with MZL in a large retrospective cohort. The study included 547 patients receiving first-line therapy for MZL. M-protein was detectable at diagnosis in 173 (32%) patients. There was no significant difference in the time from diagnosis to initiation of any therapy (systemic and local) between the M-protein and no M-protein groups. Patients with M-protein at diagnosis had significantly inferior progression-free survival (PFS) compared with those without M-protein at diagnosis. After adjusting for factors associated with inferior PFS in univariate models, presence of M-protein remained significantly associated with inferior PFS (hazard ratio, 1.74; 95% confidence interval, 1.20-2.54; P = .004). We observed no significant difference in the PFS based on the type or quantity of M-protein at diagnosis. There were differential outcomes in PFS based on the first-line therapy in patients with M-protein at diagnosis, in that, those receiving immunochemotherapy had better outcomes compared with those receiving rituximab monotherapy. The cumulative incidence of relapse in stage 1 disease among the recipients of local therapy was higher in the presence of M-protein; however, this did not reach statistical significance. We found that M-protein at diagnosis was associated with a higher risk of histologic transformation. Because the PFS difference related to presence of M-protein was not observed in patients receiving bendamustine and rituximab, immunochemotherapy may be a preferred approach over rituximab monotherapy in this group and needs to be explored further.
Introduction
Marginal zone lymphomas (MZL) are a group of indolent B-cell non-Hodgkin lymphomas1, 2, 3 that are classified into 3 specific subtypes: extranodal MZL of mucosa-associated lymphoid tissue (EMZL or MALT lymphoma), splenic MZL (SMZL), and nodal MZL (NMZL).4 MZLs are characterized, in some cases, by plasmacytic differentiation,5, 6, 7 even though their cellular origin and clinical behavior are very diverse.8 They can contain admixed monotypic plasmacytes, sometimes loaded with immunoglobulin inclusions or globules.4 Up to 25% of SMZL,9,10 35% of EMZL/MALT,11,12 and an unspecified proportion of NMZL produce a monoclonal paraprotein (M-protein) of any class, such as immunoglobulin G (IgG), IgM, and IgA. In fact, these lymphomas frequently may be diagnosed during evaluation of monoclonal gammopathy of undetermined significance. However, previous studies examining patients with MZL producing M-protein were small, precluding a detailed analysis. In addition, there are limited data on why MZL tumors produce M-protein whereas others do not and whether this feature has any prognostic significance. Given the paucity of data surrounding the relevance of M-protein in MZL, we sought to evaluate the impact of M-protein at diagnosis on outcomes in patients with MZL in a large cohort from the United States.
Patients and methods
Study design
This multicenter, retrospective cohort study included adult patients (≥18 years) with MZL diagnosed between 2010 and 2020 at 11 US medical centers. The study was approved by the institutional review boards of all participating sites and was conducted in compliance with the Declaration of Helsinki. To be eligible for analysis, patients must have information on M-protein at diagnosis. The presence of M-protein was ascertained at any time before the start of first-line therapy from serum protein electrophoresis (SPEP), immunofixation (SIFE), or an abnormal free kappa-to-lambda (κ:λ) ratio on free light chain (FLC) assay.
We collected variables known to be significantly associated with survival outcomes in all subtypes of MZL.13,14 Values of laboratory tests (albumin, hemoglobin, serum lactate dehydrogenase, and β-2-microglobulin) were harmonized based on the upper or lower limit of normal at each institution. All staging procedures (eg, bone marrow evaluations) and treatment evaluations were conducted in accordance with local practice.
Study objectives and definitions
The study population was divided into 2 groups based on the presence or absence of M-protein at diagnosis. The primary objective was to evaluate the progression-free survival (PFS) in these 2 groups. PFS was defined as the time from the start of first-line therapy to lymphoma relapse, progression, death from any cause, or censoring at the last clinical assessment. The secondary objectives included the evaluation of time from diagnosis to initiation of treatment, assessment of the cumulative incidence of relapse in stage 1 disease after local treatment (surgery or radiation therapy), the cumulative incidence of transformation in groups with or without the M-protein, and the evaluation of overall survival (OS) between the 2 groups. OS was defined as the time from diagnosis to death from any cause or censoring at the last clinical assessment.
Statistical analysis
Demographic and disease characteristics were summarized using medians and ranges for continuous variables and frequencies and percentages for categorical variables. They were compared among study groups using the Wilcoxon rank sum test for continuous variables and χ2 test or Fisher exact test for categorical variables. PFS was estimated using the Kaplan-Meier method and compared between groups using the log-rank test. Cox proportional hazard regression models were used to estimate the hazard ratios (HRs) for risk of progression or death. The multivariable Cox model was built including all the variables significantly associated with PFS in the univariable model. The proportional hazard assumption was verified using Schoenfeld residuals after fitting Cox models. The cumulative incidence of relapse and cumulative incidence of transformation was calculated by treating death as a competing risk and compared between groups using competing regression models. OS was calculated from diagnosis and compared using the log-rank test. Analyses were performed using Stata version 17 (StataCorp, College Station, TX), and all statistical tests were 2-sided, with a type-1 error <0.05 indicating statistical significance. All estimates were reported with 95% confidence intervals (95% CIs).
Results
Baseline characteristics
The study included 547 patients. Among these, 173 (32%) had detectable M-protein at diagnosis, whereas 374 (68%) did not. Among the patients with M-protein, 56% (n = 97) had IgM, 31% (n = 53) had IgG, 3% (n = 5) had both IgM and IgG, 5% (n = 9) had IgA, and 5% (n = 9) had circulating FLCs only. Among the patients with M-protein, 90% (n = 155) had quantifiable levels; with 48% (n = 74) with levels <0.5 gm/dL, 20% (n = 31) with levels from 0.5 to 1.5 gm/dL, another 20% (n = 31) with levels from 1.6 to 3 gm/dL, and 12% (n = 19) with >3 gm/dL. The median age at diagnosis was 65 years in the M-protein group compared with 62 years in the no M-protein group (P < .01). Within the M-protein group, the proportion of patients with M-protein was highest in EMZL (50%), followed by NMZL (28%), and SMZL (22%). Compared with patients without M-protein, those with M-protein at diagnosis had significantly worse performance status, a higher incidence of advanced-stage lymphoma, lower albumin, and a greater frequency of treatment with a combination immunochemotherapy rather than other modalities. The most common immunochemotherapy regimen in the entire cohort was rituximab (R)-bendamustine (BR; n=110), followed by R–cyclophosphamide, vincristine, and prednisone (n = 25), and R–cyclophosphamide, vincristine, and prednisone (n = 16). Up to 72% of patients in this study had bone marrow biopsies performed at diagnosis for adequate staging. Table 1 shows the baseline characteristics of the patient population according to the presence or absence of M-protein.
Table 1.
Baseline characteristics
| Variable | All patients N = 547 (%) |
M-protein n = 173 |
No M-protein n = 374 |
P value |
|---|---|---|---|---|
| Median age, range (y) | 63 (19-98) | 65 (35-98) | 62 (19-93) | < .01 |
| Sex, n (%) | .05 | |||
| Males | 280 (51) | 99 (57) | 181 (48) | |
| Females | 267 (49) | 74 (43) | 193 (52) | |
| BMI < 30 kg/m2, n (%) | 357 (69) | 116 (72) | 241 (67) | .26 |
| MZL subtype, n (%) | .02 | |||
| EMZL | 319 (58) | 86 (50) | 233 (62) | |
| NMZL | 121 (22) | 49 (28) | 72 (19) | |
| SMZL | 107 (20) | 38 (22) | 69 (18) | |
| ECOG PS, n (%) | .01 | |||
| 0 | 291 (57) | 74 (47) | 217 (62) | |
| 1 | 185 (36) | 67 (43) | 118 (33) | |
| ≥2 | 34 (7) | 16 (10) | 18 (5) | |
| Stage, n (%) | < .01 | |||
| 1-2 | 215 (40) | 46 (27) | 169 (46) | |
| 3-4 | 321 (60) | 125 (73) | 196 (54) | |
| B symptoms, n (%) | 110 (20) | 41 (25) | 69 (19) | .10 |
| LDH > ULN, n (%) | 137 (27) | 40 (25) | 97 (27) | .66 |
| Albumin < ULN, n (%) | 91 (17) | 39 (24) | 52 (14) | < .01 |
| BM involvement, n (%) | 185 (47) | 82 (65) | 103 (38) | .001 |
| First-line treatment, n (%) | < .01 | |||
| R | 244 (45) | 72 (42) | 172 (46) | |
| BR | 110 (20) | 51 (29) | 59 (16) | |
| R-CHOP | 25 (5) | 6 (3) | 19 (5) | |
| R-CVP | 16 (3) | 8 (5) | 8 (2) | |
| Other systemic therapy | 20 (4) | 8 (5) | 12 (3) | |
| XRT | 19 (16) | 21 (12) | 70 (19) | |
| Surgery | 41 (7) | 7 (4) | 34 (9) | |
| Median follow-up (y) | 4.4 | 4.6 | 4.3 |
BM, bone marrow; BMI, body mass index; ECOG PS, Eastern Cooperative Oncology Group performance status; LDH, lactate dehydrogenase; R-CHOP, rituximab, cyclophosphamide, vincristine, and prednisone; R-CVP, rituximab, cyclophosphamide, vincristine, and prednisone; ULN, upper limit of normal; XRT, radiation therapy.
Response rates
The overall response rate among the patients in the M-protein group compared with those in the no M-protein group who received R monotherapy was 64% (n = 46) and 83% (n = 143), respectively; whereas for those who received immunochemotherapy, it was 82% (n = 55) and 91% (n = 83), respectively. The corresponding rates of complete response in the M-protein group compared with no M-protein group who received R monotherapy was 50% (n = 23) and 64% (n = 91), respectively; whereas for those who received immunochemotherapy, it was 69% (n = 38) and 79% (n = 66), respectively.
PFS
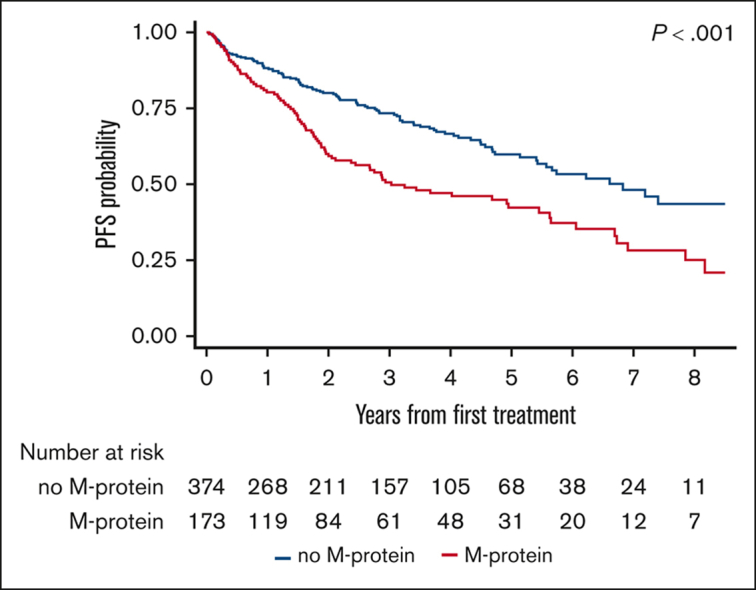
The median PFS after first-line therapy was 3 years (95% CI, 2.1-5.5) in the M-protein group compared with 6.8 years (95% CI, 5.4 to not reached [NR]) in the no M-protein group (log-rank P < .001; Figure 1). The 3- and 5-year PFS estimates were 51% (95% CI, 42%-59%) and 42% (95% CI, 33%-51%) in the M-protein group compared with 73% (95% CI, 68%-78%) and 60% (95% CI, 53%-66%) in the no M-protein group, respectively (log-rank P < .001; Figure 1).
Figure 1.

PFS after first-line systemic therapy among patients with MZL, stratified based on the presence or absence of M-protein.
In univariable Cox models among patients who received systemic therapy (n = 402), factors associated with inferior PFS included presence of M-protein, age, Eastern Cooperative Oncology Group performance status ≥ 1, and lactate dehydrogenase > upper limit of normal, whereas EMZL (compared with the reference level of NMZL) and the receipt of first-line immunochemotherapy (compared to rituximab monotherapy) were associated with superior PFS (Table 2). After adjusting for these factors in a multivariable Cox model, the presence of M-protein remained associated with significantly inferior PFS (HR, 1.74; 95% CI, 1.20-2.54; P = .004; Table 2).
Table 2.
Univariable and multivariable Cox modeling on PFS analysis among patients who received systemic therapy
| Variable | Univariate |
Multivariable |
||
|---|---|---|---|---|
| HR (95% CI) | P value | HR (95% CI) | P value | |
| Monoclonal protein | ||||
| No M-protein | 1.00 | 1.00 | ||
| M-protein | 1.60 (1.19-2.16) | .002 | 1.74 (1.20-2.54) | .004 |
| Age (y) | 1.02 (1.00-1.03) | .01 | 1.01 (0.99-1.02) | .46 |
| Sex | ||||
| Males | 1.00 | .71 | - | - |
| Females | 0.94 (0.67-1.32) | - | - | |
| ECOG PS | ||||
| 0 | 1.00 | 1.00 | ||
| 1 | 1.50 (1.05-2.16) | .03 | 1.34 (0.91-1.97) | .14 |
| ≥2 | 1.62 (0.89-2.94) | .12 | 1.31 (0.69-2.51) | .41 |
| B symptoms | ||||
| No | 1.00 | - | - | |
| Yes | 1.23 (0.87-1.73) | .23 | - | - |
| MZL subtype | ||||
| NMZL | 1.00 | 1.00 | ||
| SMZL | 0.87 (0.58-1.29) | .48 | 0.66 (0.40-1.09) | .10 |
| EMZL | 0.68 (0.48-0.97) | .03 | 0.61 (0.39-0.97) | .03 |
| Stage | ||||
| 1-2 | 1.00 | - | - | |
| 3-4 | 1.14 (0.76-1.71) | .51 | - | - |
| LDH > ULN | ||||
| No | 1.00 | 1.00 | ||
| Yes | 1.70 (1.24-2.35) | .001 | 1.55 (1.05-2.30) | .03 |
| Albumin < ULN | ||||
| Normal | 1.00 | 1.00 | ||
| Low | 1.35 (0.93-1.97) | .11 | 1.10 (0.72-1.69) | .66 |
| BM involvement | ||||
| No | 1.00 | - | - | |
| Yes | 1.09 (0.77-1.53) | .64 | - | - |
| First-line treatment | ||||
| R alone | 1.00 | 1.00 | ||
| R-chemotherapy | 0.65 (0.47-0.89) | .007 | 0.64 (0.43-0.95) | .03 |
| Others | 0.57 (0.18-1.80) | .34 | 0.47 (0.14-1.52) | .21 |
BM, bone marrow; ECOG PS, Eastern Cooperative Oncology Group performance status; LDH, lactate dehydrogenase; ULN, upper limit of normal.
Subgroup analysis
The median PFS was not significantly different between patients with M-protein of different subclasses, namely IgM, IgG, IgM and IgG, IgA, and FLCs (median, 2.9 years vs 2.1 years vs 2.9 years vs NR vs 2.9 years, respectively; P = .80; Figure 2A). In addition, there was no difference in PFS based on the quantity of M-protein level (median, 2.9 vs 2.1 vs 4.9 vs 2.9 years for <0.5, 0.5-1.5, 1.6-3.0, and >3.0 gm/dL, respectively; P = .87; Figure 2B).
Figure 2.

PFS based on the type and quantity of M-protein in MZL.
Given the disparate PFS related to the receipt of first-line systemic therapy (PFS was significantly shorter with R monotherapy vs immunochemotherapy; supplemental Figure 1), we further investigated the prognostic value of M-protein in groups treated with R monotherapy or immunochemotherapy separately. Among patients treated with R monotherapy, the presence of M-protein was associated with a significantly shorter PFS (median, 1.8 vs 5.1 years for the no M-protein group; P < .001; Figure 3A). In contrast, there was no significant difference in PFS between the 2 groups among those treated with immunochemotherapy (median, 4.9 vs 6.8 years, respectively; P = .15; Figure 3B). Within the specific subgroup of patients receiving BR (the most common immunochemotherapy regimen), PFS did not differ based on the presence or absence of M-protein at diagnosis (median, 6.1 years vs NR, respectively; P = .29; supplemental Figure 2).
Figure 3.

PFS between M-protein and no M-protein groups based on first-line systemic therapy. (A) Treated with R monotherapy and (B) immunochemotherapy.
Considering significant clinical and treatment differences between the histologic subtypes of MZL, we examined the association between the presence of M-protein and PFS in each histology separately. Patients with EMZL had significantly inferior PFS when they had M-protein at diagnosis compared with those with no M-protein (median, 6.1 vs 7.4 years; P = .01; supplemental Figure 3A). A similar association was noted in NMZL (median, 2 vs 6.8 years, respectively; P = .03; supplemental Figure 3B). Although the direction of association was consistent in the SMZL (supplemental Figure 3C) subgroup, the difference in PFS difference for this histology was not significant (2.9 vs 4.7 years, respectively; P = .11).
Because the presence of M-protein was significant for PFS in EMZL and NMZL, we further explored the significance of M-protein after adjusting for known prognostic scoring systems. In patients with EMZL who received systemic therapy (n = 210), the presence of M-protein remained significant after adjusting for the MALT lymphoma international prognostic index13 (HR, 1.77; 95% CI, 1.08-2.90; P = .02). Because of a lack of information on the number of nodal sites, we could not perform a similar adjusted analysis (adjusted for Follicular Lymphoma International Prognostic Index) in NMZL.
Time from diagnosis to therapy
There was no significant difference in the time from diagnosis to initiation of any therapy (systemic and local) between the groups with or without M-protein (supplemental Figure 4A). The percentage of patients who started treatment at 1, 3, and 5 years in the M-protein vs no M-protein groups was 91% vs 88%, 97% vs 95%, and 99% vs 99%, respectively (P = .06). A similar trend was noted when we evaluated the time from diagnosis to the initiation of systemic therapy (supplemental Figure 4B). The percentage of patients who started treatment at 1, 3, and 5 years in the M-protein vs no M-protein groups was 90% vs 87%, 97% vs 94%, and 99% vs 99%, respectively (P = .12).
Cumulative incidence of relapse
In patients with stage 1 disease who received local therapy (n = 96; M-protein = 20 and no M-protein = 76), there were 14 relapses in total with 8 (40%) in the M-protein group and 6 (8%) in the no M-protein group. The cumulative incidence of relapse in stage 1 disease among the recipients of local therapy was higher in the M-protein group than the no M-protein group, although it did not reach statistical significance (P = .05; supplemental Figure 5), with 3- and 5-year rates of 16% vs 9% and 35% vs 14%, respectively.
Cumulative incidence of histologic transformation
There were 15 transformation events in the study, 12 in the M-protein group and 3 in the no M-protein group. The cumulative incidence of transformation in the entire cohort at 3 and 5 years was 2% and 3.5%, respectively. The cumulative incidence of transformation was significantly higher in the M-protein group than in the no M-protein group, with 3- and 5-year rates of transformation of 4.9% vs 0.6% and 7.9% vs 1.2%, respectively (P = .001; Figure 4).
Figure 4.

Cumulative incidence of transformation in MZL between M-protein and no M-protein groups.
OS
There was no difference in the OS between the M-protein group and no M-protein group (median OS, NR in both groups; P = .23; supplemental Figure 6A), including those who received systemic therapy in the first-line setting (P = .65; supplemental Figure 6B). A similar finding was noted in all the MZL subtypes, namely EMZL (P = .40; supplemental Figure 7A), NMZL (P = .69; supplemental Figure 7B), and SMZL (P = .68; supplemental Figure 7C).
Association of M-protein with POD24
Because POD24 (progression of disease within 24 months of initiation of systemic therapy) was shown to be an independent prognostic factor in MZL,15 we evaluated the association of M-protein and the first-line systemic therapy with POD24. Patients with MZL producing M-protein had a higher cumulative incidence of POD24 compared with those without M-protein regardless of the receipt of first-line systemic therapy (R monotherapy, 54% vs 26%, respectively; and immunochemotherapy, 27% vs 16%, respectively; supplemental Figure 8). Patients with MZL producing M-protein in the POD24 cohort have poor outcomes, and this has been shown recently in a separate article.15
Discussion
In this multicenter retrospective cohort study, we evaluated the impact of M-protein at diagnosis in patients with MZL and made several important observations. Firstly, patients who had M-protein at diagnosis had inferior PFS compared with those with no M-protein. Secondly, there was no difference in the PFS based on the type or quantity of M-protein at diagnosis. Thirdly, patients with M-protein who received R monotherapy had significantly shorter PFS compared with the no M-protein group; however, we observed no significant difference in the PFS among patients treated with immunochemotherapy. Fourthly, the cumulative incidence of relapse in stage 1 disease among the recipients of local therapy was higher in the presence of M-protein at diagnosis; however, this did not reach statistical significance likely because of the small sample size. Lastly, patients with M-protein at diagnosis had a significantly higher risk for histologic transformation than those without M-protein.
The incidence of M-protein varied across prior studies in MZL, ranging from 8% to 46%9, 10, 11, 12,14,16, 17, 18, 19, 20, 21, 22, 23, 24, 25, 26 (Table 3). In our study, 32% of patients had an M-protein at diagnosis, with 27% in EMZL, 40% in NMZL, and 35% in SMZL. We noted a higher incidence of M-protein in both EMZL and SMZL subtypes than that noted in most of the previous studies.9, 10, 11, 12,26 This is, to our knowledge, the first study to report the incidence of M-protein in the NMZL subtype as well as show the prognostic significance (or lack thereof) based on the type and quantity of M-protein.
Table 3.
Studies that reported the incidence of M-protein in patients with MZL
| Study | MZL subtype | Sample size (N) | Prevalence of M-protein at diagnosis N (%) |
Key observations |
|---|---|---|---|---|
| Berger et al16 | All | 124 | 19 (15) | IgM = 15, IgG = 1, and IgA = 3 The median level of the M-protein was 8 g/L (1-51 g/L). |
| Thieblemont et al17 | SMZL | 81∗ | 34 (46) | IgM = 21, IgG = 7, and IgA = 3 Median (range) 6.5 (1-51) g/L The presence of an M-protein was significantly associated with a shorter TTP |
| Parry-Jones et al18 | SMZL | 107 | 24 (22) | IgM = 15, IgG = 8, and IgA = 1 50% had <10 g/L and the highest was 25 g/L |
| Wohrer et al19 | MALT/EMZL | 52 | 19 (36) | IgM = 10, IgG = 6, and IgA = 3 M-protein levels declined significantly in patients responding to chemotherapy or radiation |
| Arcaini et al14 | SMZL | 309 | 25 (8) | IgM = 19, IgG = 4, IgG/IgM = 1, and IgA = 1 Median 1 g/dL No prognostic relevance of M-protein for cause-specific survival in SMZL |
| Arcaini et al11 | MALT/EMZL | 208 | 36 (17) | IgM = 24, IgG = 9, and IgA = 3 The presence of M-protein correlated with advanced disease and shorter OS in MVA. |
| Troch et al24 | MALT/EMZL | 94 | 37 (39) | Did not report the breakdown of M-protein or prognostic relevance |
| Montalban et al9 | SMZL | 501 | 127 (25) | No prognostic relevance of M-protein for lymphoma-specific survival in SMZL |
| Desai et al25 | POAML | 58† | 12 (21) | IgM = 6, IgG = 4, and IgA = 2 |
| Alderuccio et al12 | MALT/EMZL | 328 | 35 (11) | IgM = 13, IgG = 15, IgA = 5, IgM/IgG = 1, and lambda LC = 1 The presence of M-protein was associated with shorter survival on univariate analysis |
| Bonfiglio et al10 | SMZL | 303‡ | 61 (20) | IgM = 39, IgG = 21, and missing = 1 No difference in M-protein between genomic subtypes of SMZL |
| Ren et al26 | MALT/EMZL | 218 | 42 (19) | IgM = 27, IgG = 5, IgA = 4, IgM/IgA = 3, IgM/IgG = 1, IgM/LC = 1, and LC = 1 M-protein was an independent prognostic factor for both PFS and OS in the multivariable analysis |
Only those with ≥10 cases of M-protein are shown.
LC, light chains; POAML, primary ocular adnexal MALT lymphoma.
Seven had missing information on monoclonal protein at diagnosis.
Among the 182 patients with POAML, 58 patients underwent blood examination for the presence of monoclonal gammopathy.
Monoclonal protein was missing in 104 patients.
The presence of M-protein was associated with inferior PFS in EMZL and NMZL, but not in SMZL, in our study. This is consistent with the previously published studies that showed the prognostic significance of M-protein for PFS in EMZL12,26 and lack of prognostic significance of M-protein in SMZL,9,14 including the different genomic subtypes of SMZL.10 Furthermore, we observed a prognostic relevance of M-protein in NMZL as well as differences in outcome based on the type of first-line therapy (R monotherapy vs immunochemotherapy). In contrast to the prior studies,14,26 M-protein was not a prognostic factor for OS in any of the MZL subtypes in this study. This may be related to the availability of effective salvage therapy options such as Bruton's tyrosine kinase inhibitors. In addition to evaluating the prognostic significance of M-protein for patients treated systemically, we found that the presence of M-protein is a risk factor for relapse in early-stage disease treated with local therapies, which is a very common approach, particularly in EMZL. This finding highlights the need for a thorough staging of EMZL before local therapy, because the presence of M-protein is often associated with subclinical disseminated disease. In fact, a comprehensive staging evaluation may reveal multifocal EMZL in ∼37% of patients presenting with clinically localized disease.27
Currently, the guidelines from the National Comprehensive Cancer Network28 recommend SPEP in selected cases for EMZL and NMZL but consider it for SMZL, whereas the European Society for Medical Oncology29 states that SPEP is mandatory for all MZL cases. Given the prognostic significance of M-protein in EMZL and NMZL and, more importantly, the difference in the prognostic significance based on the therapy used, we suggest checking SPEP/SIFE in all MZL subtypes, especially before R monotherapy. There may also be a value in checking SPEP/SIFE whether there is equipoise before choosing local therapy (radiation) and systemic therapy (R) for stage 1 EMZL because the presence of M-protein is associated with a higher risk of recurrence after local therapy. It may also be an indication for more extensive staging (eg, bone marrow biopsy), even if the disease is otherwise localized.
Although our study was focused on clinical characteristics and outcomes, the biological reasons why M-protein may be associated with shorter PFS in MZL are worth attention in future research. Based on our observation, several hypotheses can be formulated. Firstly, the fact that M-protein was associated with shorter PFS after R alone, but not after chemotherapy, may suggest that overproduction of M-protein could be associated with a more plasma cell–like biologic behavior, possibly less sensitive to treatment with anti-CD20 antibody alone. Secondly, PFS might be shorter because clinicians can follow M-protein to detect progression earlier than through clinical symptoms or infrequent radiographic assessments; this hypothesis may be supported by the lack of difference in OS with M-protein. However, the higher risk of histologic transformation raises a possibility that the presence of M-protein may correlate with unfavorable molecular features or subclinical dissemination, particularly in MALT lymphoma, which should certainly be investigated in the future. Of note, previous studies that looked at the risk factors for high-grade transformation from MZL30, 31, 32, 33, 34 did not include M-protein at diagnosis.
The study is subjected to the inherent limitations of a retrospective cohort, including the nonuniform selection of patients with MZL for performance of SPEP/SIFE at diagnosis. Although there was no central pathology review, any ambiguous cases of low-grade B-cell lymphoma with plasmacytic differentiation not clearly fitting the MZL diagnosis were excluded. We did not collect information on the M-protein levels at the end of treatment thereby precluding the evaluation of M-protein dynamics (before and after treatment).
In conclusion, in this study, evaluating the prognostic relevance of M-protein in MZL, we found that M-protein at diagnosis was associated with shorter PFS and a higher risk of histologic transformation. Because the PFS difference was not observed after BR, immunochemotherapy may be a preferred approach over R monotherapy in this group, but this hypothesis will need further examination in a prospective fashion. Future studies need to explore the possible biological differences between tumors that produce M-protein vs those that do not.
Conflict-of-interest disclosure: N.E. receives research funding from BeiGene; serves on the speakers bureau for Incyte and BeiGene; and reports honoraria/consulting/advisory board service for Merck, ADC Therapeutics, Lilly, and Novartis. R.K. is an advisory board member of Bristol Myers Squibb (BMS), Gilead Sciences/Kite Pharma, Janssen, Karyopharm, Pharmacyclics, MorphoSys, Epizyme, Genentech/Roche, EUSA, and Calithera; receives grants/research support from BMS, Takeda, BeiGene, Gilead Sciences/Kite, and Calithera; and is on the speakers bureau for AstraZeneca, BeiGene, and MorphoSys. P.T. reports honoraria/consulting/advisory board service for TG Therapeutics, ADC Therapeutics, Genentech, Genmab, and Lilly USA. I.B.G. is on the advisory boards for Kite and Stemline. Y.S. received research funding from BMS, Celgene, TG Therapeutics, and BeiGene, and has consulted for TG Therapeutics and Epizyme. B.C. received research funding from Genentech, Acerta, Triphase, MorphoSys, Seagen, Millenium, BMS, and F. Hoffmann-La Roche, and is on the advisory board of Genentech and ADC Therapeutics. S.K.B. received honoraria from Acrotech, Affimed, Daiichi Sankyo, Kyowa Kirin, Janssen, and Seagen. P.R.G. provides consultancy services to Kite Pharma, BMS, and Rafael Pharma, and served on the advisory boards of Pharmacyclics LLC, ADC Therapeutics, Cellectar Biosciences, and Ono Pharma. N.L.B. received research funding from ADC Therapeutics, Autolus, BMS, Celgene, Forty Seven, Genentech, Immune Design, Janssen, Merck, Millennium, Pharmacyclics, Affirmed Therapeutics, Dynavax, Gilead, MedImmune, and Novartis, and received consulting/advisory board fees from Kite Pharma, Pfizer, ADC Therapeutics, Roche/Genentech, Seattle Genetics, BTG, and Acerta. N.S.G. received research funding from Genentech and Tessa Therapeutics, and received honoraria/consulting/advisory board feess from ADC Therapeutics, Genentech, Kite, Novartis, Tessa Therapeutics, and Seattle Genetics. A.J.O. received funding from Genmab, Precision Bio, Adaptive Biotechnologies, Celldex, Acrotech Biopharma, Schrodinger, TG Therapeutics, and Genentech. The remaining authors declare no competing financial interests.
Acknowledgments
Authorship
Contribution: N.E. conceived and designed the study and prepared the first draft; N.E., Q.Z., and A.J.O. performed data analysis; and all authors collected, assembled, and interpreted the data, provided critical and insightful comments, and gave final approval for the publication of the manuscript.
Footnotes
Data are available on request from the corresponding author, Narendranath Epperla (narendranath.epperla@osumc.edu).
The full-text version of this article contains a data supplement.
Supplementary Material
References
- 1.Teras LR, DeSantis CE, Cerhan JR, Morton LM, Jemal A, Flowers CR. 2016 US lymphoid malignancy statistics by World Health Organization subtypes. CA Cancer J Clin. 2016;66(6):443–459. doi: 10.3322/caac.21357. [DOI] [PubMed] [Google Scholar]
- 2.Rossi D, Bertoni F, Zucca E. Marginal-zone lymphomas. N Engl J Med. 2022;386(6):568–581. doi: 10.1056/NEJMra2102568. [DOI] [PubMed] [Google Scholar]
- 3.Alaggio R, Amador C, Anagnostopoulos I, et al. The 5th edition of the World Health Organization classification of haematolymphoid tumours: lymphoid neoplasms. Leukemia. 2022;36(7):1720–1748. doi: 10.1038/s41375-022-01620-2. [DOI] [PMC free article] [PubMed] [Google Scholar]
- 4.Swerdlow SH, Campo E, Pileri SA, et al. The 2016 revision of the World Health Organization classification of lymphoid neoplasms. Blood. 2016;127(20):2375–2390. doi: 10.1182/blood-2016-01-643569. [DOI] [PMC free article] [PubMed] [Google Scholar]
- 5.Duong Van Huyen JP, Molina T, Delmer A, et al. Splenic marginal zone lymphoma with or without plasmacytic differentiation. Am J Surg Pathol. 2000;24(12):1581–1592. doi: 10.1097/00000478-200012000-00001. [DOI] [PubMed] [Google Scholar]
- 6.Wöhrer S, Troch M, Streubel B, et al. Pathology and clinical course of MALT lymphoma with plasmacytic differentiation. Ann Oncol. 2007;18(12):2020–2024. doi: 10.1093/annonc/mdm375. [DOI] [PubMed] [Google Scholar]
- 7.Molina TJ, Lin P, Swerdlow SH, Cook JR. Marginal zone lymphomas with plasmacytic differentiation and related disorders. Am J Clin Pathol. 2011;136(2):211–225. doi: 10.1309/AJCP63OGXHXCSKSC. [DOI] [PubMed] [Google Scholar]
- 8.Kuppers R. Mechanisms of B-cell lymphoma pathogenesis. Nat Rev Cancer. 2005;5(4):251–262. doi: 10.1038/nrc1589. [DOI] [PubMed] [Google Scholar]
- 9.Montalbán C, Abraira V, Arcaini L, et al. Risk stratification for splenic marginal zone lymphoma based on haemoglobin concentration, platelet count, high lactate dehydrogenase level and extrahilar lymphadenopathy: development and validation on 593 cases. Br J Haematol. 2012;159(2):164–171. doi: 10.1111/bjh.12011. [DOI] [PubMed] [Google Scholar]
- 10.Bonfiglio F, Bruscaggin A, Guidetti F, et al. Genetic and phenotypic attributes of splenic marginal zone lymphoma. Blood. 2022;139(5):732–747. doi: 10.1182/blood.2021012386. [DOI] [PubMed] [Google Scholar]
- 11.Arcaini L, Burcheri S, Rossi A, et al. Nongastric marginal-zone B-cell MALT lymphoma: prognostic value of disease dissemination. Oncologist. 2006;11(3):285–291. doi: 10.1634/theoncologist.11-3-285. [DOI] [PubMed] [Google Scholar]
- 12.Alderuccio JP, Zhao W, Desai A, et al. Short survival and frequent transformation in extranodal marginal zone lymphoma with multiple mucosal sites presentation. Am J Hematol. 2019;94(5):585–596. doi: 10.1002/ajh.25446. [DOI] [PubMed] [Google Scholar]
- 13.Thieblemont C, Cascione L, Conconi A, et al. A MALT lymphoma prognostic index. Blood. 2017;130(12):1409–1417. doi: 10.1182/blood-2017-03-771915. [DOI] [PubMed] [Google Scholar]
- 14.Arcaini L, Lazzarino M, Colombo N, et al. Splenic marginal zone lymphoma: a prognostic model for clinical use. Blood. 2006;107(12):4643–4649. doi: 10.1182/blood-2005-11-4659. [DOI] [PubMed] [Google Scholar]
- 15.Epperla N, Welkie RL, Torka P, et al. Impact of early relapse within 24 months after first-line systemic therapy (POD24) on outcomes in patients with marginal zone lymphoma: a US multisite study. J Hematol Oncol. 2023;16(1):49. doi: 10.1186/s13045-023-01448-y. [DOI] [PMC free article] [PubMed] [Google Scholar]
- 16.Berger F, Felman P, Thieblemont C, et al. Non-MALT marginal zone B-cell lymphomas: a description of clinical presentation and outcome in 124 patients. Blood. 2000;95(6):1950–1956. [PubMed] [Google Scholar]
- 17.Thieblemont C, Felman P, Berger F, et al. Treatment of splenic marginal zone B-cell lymphoma: an analysis of 81 patients. Clin Lymphoma. 2002;3(1):41–47. doi: 10.3816/clm.2002.n.010. [DOI] [PubMed] [Google Scholar]
- 18.Parry-Jones N, Matutes E, Gruszka-Westwood AM, Swansbury GJ, Wotherspoon AC, Catovsky D. Prognostic features of splenic lymphoma with villous lymphocytes: a report on 129 patients. Br J Haematol. 2003;120(5):759–764. doi: 10.1046/j.1365-2141.2003.04165.x. [DOI] [PubMed] [Google Scholar]
- 19.Wöhrer S, Streubel B, Bartsch R, Chott A, Raderer M. Monoclonal immunoglobulin production is a frequent event in patients with mucosa-associated lymphoid tissue lymphoma. Clin Cancer Res. 2004;10(21):7179–7181. doi: 10.1158/1078-0432.CCR-04-0803. [DOI] [PubMed] [Google Scholar]
- 20.Asatiani E, Cohen P, Ozdemirli M, Kessler CM, Mavromatis B, Cheson BD. Monoclonal gammopathy in extranodal marginal zone lymphoma (ENMZL) correlates with advanced disease and bone marrow involvement. Am J Hematol. 2004;77(2):144–146. doi: 10.1002/ajh.20157. [DOI] [PubMed] [Google Scholar]
- 21.Traverse-Glehen A, Felman P, Callet-Bauchu E, et al. A clinicopathological study of nodal marginal zone B-cell lymphoma. A report on 21 cases. Histopathology. 2006;48(2):162–173. doi: 10.1111/j.1365-2559.2005.02309.x. [DOI] [PubMed] [Google Scholar]
- 22.Arcaini L, Paulli M, Burcheri S, et al. Primary nodal marginal zone B-cell lymphoma: clinical features and prognostic assessment of a rare disease. Br J Haematol. 2007;136(2):301–304. doi: 10.1111/j.1365-2141.2006.06437.x. [DOI] [PubMed] [Google Scholar]
- 23.Papaxoinis G, Fountzilas G, Rontogianni D, et al. Low-grade mucosa-associated lymphoid tissue lymphoma: a retrospective analysis of 97 patients by the Hellenic Cooperative Oncology Group (HeCOG) Ann Oncol. 2008;19(4):780–786. doi: 10.1093/annonc/mdm529. [DOI] [PubMed] [Google Scholar]
- 24.TROCH M, WÖHRER S, RADERER M. Assessment of the prognostic indices IPI and FLIPI in patients with mucosa-associated lymphoid tissue lymphoma. Anticancer Res. 2010;30(2):635–639. [PubMed] [Google Scholar]
- 25.Desai A, Joag MG, Lekakis L, et al. Long-term course of patients with primary ocular adnexal MALT lymphoma: a large single-institution cohort study. Blood. 2017;129(3):324–332. doi: 10.1182/blood-2016-05-714584. [DOI] [PubMed] [Google Scholar]
- 26.Ren YM, Shang CY, Liang JH, et al. Prognostic significance of serum immunoglobulin paraprotein in mucosa-associated lymphoid tissue (MALT) lymphoma. Br J Haematol. 2022;196(6):1353–1361. doi: 10.1111/bjh.18000. [DOI] [PubMed] [Google Scholar]
- 27.Raderer M, Wöhrer S, Streubel B, et al. Assessment of disease dissemination in gastric compared with extragastric mucosa-associated lymphoid tissue lymphoma using extensive staging: a single-center experience. J Clin Oncol. 2006;24(19):3136–3141. doi: 10.1200/JCO.2006.06.0723. [DOI] [PubMed] [Google Scholar]
- 28.B-cell lymphomas. Version 2.2023 National Comprehensive Cancer Network Clinical Practice Guidelines in Oncology. https://www.nccn.org/guidelines/category_1 [DOI] [PubMed]
- 29.Zucca E, Arcaini L, Buske C, et al. Marginal zone lymphomas: ESMO Clinical Practice Guidelines for diagnosis, treatment and follow-up. Ann Oncol. 2020;31(1):17–29. doi: 10.1016/j.annonc.2019.10.010. [DOI] [PubMed] [Google Scholar]
- 30.Conconi A, Franceschetti S, Aprile von Hohenstaufen K, et al. Histologic transformation in marginal zone lymphomas. Ann Oncol. 2015;26(11):2329–2335. doi: 10.1093/annonc/mdv368. [DOI] [PubMed] [Google Scholar]
- 31.Maeshima AM, Taniguchi H, Toyoda K, et al. Clinicopathological features of histological transformation from extranodal marginal zone B-cell lymphoma of mucosa-associated lymphoid tissue to diffuse large B-cell lymphoma: an analysis of 467 patients. Br J Haematol. 2016;174(6):923–931. doi: 10.1111/bjh.14153. [DOI] [PubMed] [Google Scholar]
- 32.Alderuccio JP, Zhao W, Desai A, et al. Risk factors for transformation to higher-grade lymphoma and its impact on survival in a large cohort of patients with marginal zone lymphoma from a single institution. J Clin Oncol. 2018;36(34):3370–3380. doi: 10.1200/JCO.18.00138. [DOI] [PubMed] [Google Scholar]
- 33.Qian L, Soderquist C, Schrank-Hacker A, et al. Deletion 20q12 is associated with histological transformation of nodal marginal zone lymphoma to diffuse large B-cell lymphoma. Am J Hematol. 2020;95(3):238–244. doi: 10.1002/ajh.25694. [DOI] [PMC free article] [PubMed] [Google Scholar]
- 34.Hsu A, Kurt H, Zayac AS, Olszewski AJ. CD5 expression in marginal zone lymphoma predicts differential response to rituximab or bendamustine/rituximab. Leuk Lymphoma. 2022;63(1):31–42. doi: 10.1080/10428194.2021.1973670. [DOI] [PubMed] [Google Scholar]
Associated Data
This section collects any data citations, data availability statements, or supplementary materials included in this article.