

Summary
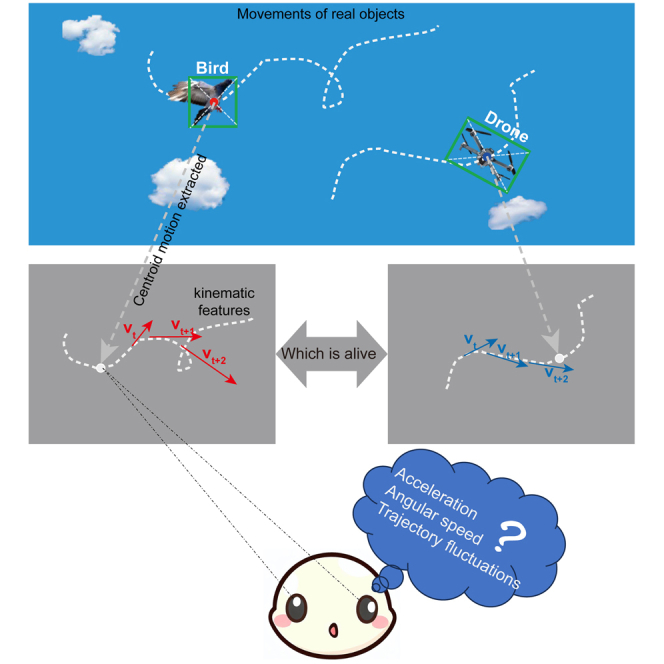
Humans can distinguish flying birds from drones based solely on motion features when no image information is available. However, it remains unclear which motion features of animate motion induce our animacy perception. To address this, we first analyzed the differences in centroid motion between birds and drones, and discovered that birds exhibit greater acceleration, angular speed, and trajectory fluctuations. We further determined the order of their importance in evoking animacy perception was trajectory fluctuations, acceleration, and speed. More interestingly, people judge whether a moving object is alive using a feature-matching strategy, implying that animacy perception is induced in a key feature-triggered way rather than relying on the accumulation of evidence. Our findings not only shed light on the critical motion features that induce animacy perception and their relative contributions but also have important implications for developing target classification algorithms based on motion features.
Subject areas: Neuroscience, Cognitive neuroscience, Psychology
Graphical abstract
Highlights
-
•
Inherent differences exist in centroid motion of birds (living objects) and drones
-
•
Birds have greater acceleration, angular speed, and trajectory fluctuations
-
•
The bird’s wingbeat frequency is reflected in the fluctuations of its flight path
-
•
Human animacy perception depends on the instant triggering of key motion features
Neuroscience; Cognitive neuroscience; Psychology
Introduction
Over millions of years of evolution, animals have developed specific motion patterns under the combined effects of gravitational and biomechanical forces. These patterns are difficult for non-living objects to mimic, at least with current technology. At the same time, humans and non-human animals have developed the ability to identify whether a moving object is animate or not, based on motion cues. This ability, known as animacy perception,1,2,3 is crucial for survival (e.g., foraging and avoiding danger) and fundamental for social interactions (e.g., identifying social partners). It is assumed that animacy perception evolved under natural selection pressures and is determined by the statistical regularity of animal movement characteristics.4
The motion of any object can be characterized by two aspects: relative motion in the object-based reference system and common motion in the global reference system.5 Accordingly, Troje6 classified the motion of animals into two types: biological motion and animate motion. Biological motion usually refers to relative motion and intrinsic motion, which is the motion of body parts in the object-based reference system. In contrast, animate motion usually refers to common motion and extrinsic motion, that is the motion of the entire object across the whole space. Studies on biological motion usually used the actual motion stimuli generated by the point-light display technique proposed by Johansson,7 while studies on animate motion usually utilized synthetic paths instead of actual paths.8 Therefore, it remains unclear which are the features and statistical regularity of actual animate motion.
Using synthetic paths, previous studies have identified several important motion cues that are important in triggering animacy perception. These cues can be divided into two categories. One category is the interaction between moving objects, such as chasing,9 and helping and hindering.10 The other is the motion characteristics of a single object, such as self-propulsion, that is the ability to move from the rest without external force;3,11 active resistance, that is actively reducing speed after being pushed;12 and suddenly changing the direction of speed to avoid possible collisions.13 In addition, adult humans perceive an object moving downward as less animate than an object moving upward.4 Similarly, newly hatched chicks also prefer objects moving against gravity.14 Stewart (1982) thus proposed the “energy violation” hypothesis, which suggests that the moving object is perceived as animate when its motion would require the object to have a hidden energy resource.15 This resource enables objects to change the magnitude and direction of speed, and make movements that defy “Newtonian laws”. This hypothesis seems reasonable since most non-living objects (such as leaves) throughout the evolution lack internal energy source and cannot move on their own without external forces. However, with the advances in technology, some non-living objects (e.g., unmanned aerial vehicles and planes) have now gained internal energy source and can display similar motion features (including self-propulsion, active resistance, and suddenly changing the direction of speed) as living objects. Given these developments, it is crucial to explore whether people can still differentiate between animate and inanimate motion when both animate and inanimate objects possess energy sources. Tremoulet and Feldman11 have refuted the “energy violation” hypothesis by showing that local orientation of the rectangle (i.e., the body-axis alignment), which did not correlate with the internal energy, also affected the strength of animacy perception. They also showed that the subjective ratings of animacy increased with the increase of changes in speed and moving direction. Gyulai further pointed out the moving object with a greater acceleration was more likely to be perceived as animate.16 These studies showed that the animacy perception depended on the kinematics of moving objects. However, these studies mainly utilized synthetic paths and typically defined the types of motion that trigger animacy perception as “animate motion”. This definition is not strict and is prone to ambiguity. In this study, we defined the motion pattern of living creatures as animate motion, which is an objective definition that is independent of the perception induced. In contrast, the animacy perception is a subjective definition that reflects our brain’s interpretation of target motion, regardless of whether the target itself is animate or not. Therefore, it remains unclear how animate motion (objective physical stimuli) relates to animacy perception (subjective definition).
Animacy perception emerges early in life.17,18 Both human newborns and visually naive chicks show a preference for biological motion19,20 and animate motion, such as objects that start to move from rest,21,22 change speed,23,24,25 and move in the direction of their main body-symmetry axis as if constrained by the bilateral body plan.26,27 The inexperienced chicks can also distinguish the temporal contingency between the motion of agents28 and use motion cues to select appropriate responses to avoid danger, fleeing from rapidly approaching objects and slowing down in response to sweeping objects.29 Human infants at three months old can discriminate between chasing and random patterns, and prefer to attend to the former.30,31 However, human newborns and infants with high risks for autism spectrum disorders showed differently to the biologically relevant motion stimuli.24,32 Compared to low-risk children, high-risk children looked more at inanimate stimuli when they were born but more at animate stimuli in 4 months. In the same vein, the chick’s preference for biological motion would be impaired if they were exposed to chemicals that increase the risk of autism spectrum disorder in the fetal stage.33,34,35 In addition, the early preferences for biologically relevant motion have a sensitive period.36 The preferences of chicks disappear after two days of hatching.37,38 The thyroid hormone T3 can regulate this time window, and it can restore the preference for changing speed in 3-day-old female chicks while inhibit the preference in day-1 chicks.39 These suggest that there are innate brain mechanisms sensitive to moving animacy cues. However, it should be noted that the innate brain mechanisms can be modulated by developmental processes and individual experiences.17,40 For example, using a natural swim path, researchers found that fish preferred intermittent bout-like motion (discontinuous jumps) with a specific interval that closely tracked their own swim bout frequency at each age, and preferred speed that closely tracked their own speed at each age.41 In addition, motor training improves the recognition of novel motor patterns.42 Furthermore, this animacy perception is stable across cultures, as there is no significant difference in the ability between German adults and Shuar adults.43 Moreover, this ability is common across a wide range of species, including monkeys,44 chicks,25 dogs,45 cats,46,47 zebrafishes,48 and even invertebrates such as spiders.49 These features (innate, cross-cultural, and cross-species) indicate that animacy perception is based on some basic motion feature detection capabilities common to almost all living creatures.
In this study, we aimed to clarify the nature of animate motion and animacy perception, and the relationship between them using actual motion trajectories. We introduced a novel approach to build a dataset containing actual animate motion. Two types of objects were selected to represent animate and inanimate objects: birds and unmanned aerial vehicles (UAVs, also known as drones). Birds flying is one of most common animate motions in the natural environment. This type of motion also has an extremely simple animate form from a distance. Drones are the fair control sample to birds, since they have high behavioral similarities but are non-living objects. We obtained the animate motion by extracting the motion of the object’s centroid (i.e., the center of gravity) from the original videos. By comparing the flight dynamic characteristics of drones and birds, we can characterize the motion features of animate motion in the global reference system.
Moreover, using the actual motion as visual stimuli, we conducted four psychophysical experiments to figure out the relationship between animacy perception and animate motion, and how the brain identifies whether a moving object is animate or not. We proposed two hypotheses. One is the “evidence accumulation” hypothesis, which means that the brain continuously accumulates evidence related to animacy perception and then makes a judgment at the end. This predicates that the longer the accumulation time, the more evidence is accumulated and the more accurate the judgment is. The other is the “feature-matching” hypothesis, which means that there are motion templates of animate motion in the brain, and when the brain notices motion features that match the inner template, the brain determines the moving object is animate. This predicts that the brain can quickly make accurate judgments. To test which hypothesis is correct, we designed two response paradigms: a) delayed response, which requires participants to respond after the motion stop signal, and b) fast response, which requires participants to respond as soon as they determine the category of the moving object. If the accuracy of the delayed response is higher than that of the fast response, then the “evidence accumulation” hypothesis is correct; otherwise, the “feature-matching” hypothesis is correct. In addition, we compared the relative importance of different motion features to animacy perception by stepwise regression method.
Results
Constructing the centroid motion dataset
Thanks to the development of computer vision algorithms, we proposed a new method to build a dataset of actual object motion. This method consists of two steps: (1) record original videos of object motion using cameras with high frame rates without camera motion and zooming; (2) track the position of the object’s centroid using the visual tracking algorithm. This algorithm usually creates a bounding box around the silhouette of the silent moving object in each frame, and the center of the bounding box is defined as the centroid of the target. Therefore, we obtained the centroid’s motion from the original video in this way.
Using this method, we constructed a dataset containing actual animate and inanimate motion. Three kinds of birds (pigeons, canaries, and zebra finches) were chosen based on their different body size and flying characteristics. Three kinds of drones (DJI Phantom 4, Mavic Pro, and Tello) were chosen based on their comparable size to each kind of bird. To better simulate the flying characteristics of birds, an experienced UAV operator imitated the flying trajectories of each kind of bird with the appropriate drone (i.e., pigeon vs. DJI Phantom 4, canary vs. Mavic Pro, and zebra finch vs. Tello). For each kind of flying object, 30 video clips were randomly selected and edited using video editing software (Adobe Premiere Pro CC 2018) to eliminate scenes with obvious motion characteristics that distinguish birds from drones, such as taking off, landing, and hovering. Then, the centroid motion of each flying object in each video clip was extracted using visual tracking algorithms (Figure 1A). Finally, each video clip containing only the centroid motion, which was represented as a single white dot moving on a black background, was cut to 2 s to control the visual motion information provided by each visual stimulus.
Figure 1.

Constructing centroid motion dataset
(A) Centroid motion extraction. The target tracking algorithms created a bounding box around the silhouette of the flying object in each frame, as illustrated by the green rectangles. The center of each bounding box (red and blue dots) was used as the estimated centroid of the moving object.
(B) Two example trajectories to demonstrate the motion kinetic differences between animate (red) and inanimate (blue) flying objects. Each flying trajectory was actually a series of spatial locations over time, and the small black circle represented the first spatial location of each trajectory.
Because the raw trajectories of the objects contain high-frequency noise, such as irregular oscillations caused by the high-speed rotation of the propeller, abnormal positions, and labeling errors, we performed wavelet signal denoising50 using the wdenoise function built into MATLAB (see the STAR Methods section for details) for each trajectory before further use. Two examples of the resulting trajectories are illustrated in Figure 1B. The red trajectory was derived from the motion of the animate flying object (bird: Zebra finch), and the blue trajectory was derived from the inanimate object (drone: Tello).
Characterizing centroid motion kinematics of animate motion
Theoretically, a flying object can be in any spatial location and move in any direction regardless of animateness. The motion features distinguishing animate from inanimate flying objects should directly relate to their power source and flying control differences. To identify kinematic features that can be used to define animate motion, we focused on three motion time-domain features of flying objects: speed (the rate of spatial location change over time), acceleration (the rate of speed change over time), and angular speed (the rate of moving direction changes over time). After computing these three kinematic features for each trajectory, we analyzed their differences in the robust central tendency (median) between birds and drones. We found that the medians of the speed (; Figure 2A), acceleration (; Figure 2B), and angular speed (; Figure 2C) were significantly higher for birds than for drones. It is obvious that we cannot reliably separate birds from drones based on their flying speeds. This is reasonable because, technically, the speed of drones could be matched to any type of bird if the data sample was large enough. However, due to essential differences in their flight dynamics, it would be harder for drones to fly as flexibly as birds, as reflected by their lower angular speed and acceleration. Actually, the flight control algorithm for drones tends to make their flight envelope as smooth as possible for the purposes of stability and safety.
Figure 2.

Characterizing motion time-domain features of flying animate and inanimate objects
(A–C) The medians of birds were significantly higher than those of drones. The dots represented individual data. ∗∗∗p < 0.001.
(D) Gaussian fitting results of average amplitude spectra of trajectory fluctuations. The trajectory fluctuation was defined as the difference between the denoised trajectory and the smoothed trajectory in both the horizontal and vertical directions. The smoothed trajectory was obtained by smoothing the denoised trajectory using the moving average filter with an appropriate time window. We first performed FFT on the trajectory fluctuations and averaged them across trajectories. For birds, the average amplitude spectra within specific frequency bands were then fitted using a Gaussian function, and the peak frequencies were marked on the corresponding peak location. The gray area around the average indicates the 95% confidence interval (see STAR Methods for details). The dashed line indicates the wingbeat frequency reported in previous studies.
In addition to the previously described three motion time-domain features, we also analyzed the motion frequency-domain features of trajectory fluctuations. As shown in Figure 1B, the flying trajectory of the animate objects is not as smooth as that of the inanimate objects. The small fluctuations in birds’ flight trajectories might be caused by wing flapping. To sustain flight, birds periodically flap their wings to generate lift force to support their weight and overcome drag on their wings and body,51 while drones are propeller driven. This results in undulatory flight trajectories (i.e., upward and downward oscillating flight trajectories) for birds, and relatively smooth trajectories for drones. To analyze the periodicity of fluctuations in the flight trajectories of birds, we first obtained the fluctuations by subtracting the smoothed trajectory from the raw trajectory. The smoothed trajectory, which represents the overall movement trend, was computed by smoothing the raw trajectory using the moving average filter with an appropriate time window. Then, we performed a fast Fourier transform on the horizontal and vertical trajectory fluctuations, respectively. The wingbeat frequency was determined by performing a Gaussian fit on the birds’ average amplitude spectrum within specific frequency bands (Figure 2D) (see the STAR Methods section for details). Amazingly, the calculated wingbeat frequency closely matched the number reported in previous studies52,53 (the gray dash line in Figure 2D, Zebra finch, estimated 24.3 Hz, previously reported, 23.4–27.8 Hz; Canary, estimated 17.6 Hz; Pigeon, estimated, 8.4 Hz, previously reported, 5–6 Hz).
The dependency of animacy perception on features of animate motion
We previously characterized four centroid motion features of birds and drones. To find out how they determine animacy perception, we conducted a series of psychophysical experiments with 24 human subjects. None of the subjects had seen such centroid motion trajectories before and were not informed as to what kind of movements they represented. The experimental procedures were similar across all experiments and are illustrated in Figure 3A. In Experiments 1 and 2, the visual stimulus of each trial was a trajectory randomly selected from the dataset with additional smoothing manipulation. Using trajectory smoothing allowed us to focus on the contributions of speed and acceleration to animacy perception by eliminating trajectory fluctuations caused by wing flapping. The downside of this manipulation was that it reduced angular speed as well. In Experiments 3 and 4, we further included the raw trajectories in the stimuli pool. Participants were asked to report on whether the moving dot represented an animate or inanimate object by pressing the left or right arrow key, respectively (two-alternative forced choice). In Experiments 1 and 3, participants were required to respond after the trial-end signal (Figure 3A, delayed resp.). However, in Experiments 2 and 4, they were instructed to make a decision as quickly as possible (Figure 3A, fast resp.). By comparing the delayed and fast responses, we were able to test whether additional observation time, which allows the participant to accumulate more kinematic features, was beneficial to behavioral performance or not. To ensure that participants make a quick response as requested, we first analyzed the response time in Exp. 2 and Exp. 4. The overall response time consists of two components: the time taken to process sensory information and making a decision (known as the net response time) and the time required to generate and execute the motor command (known as the motor reaction time). To estimate the motor reaction time, we computed the median of response times in a reaction time test task, where participants needed to press the space key immediately when they saw a dot appear. This task consisted of 100 trials (see STAR Methods for details). Then, we computed the net response time by subtracting the motor reaction time from the overall response time. As shown in Figure 3B, the response time of the fast response is significantly shorter than the duration of the moving trajectory (i.e., 2000 ms) in both Exp. 2 ( and Exp. 4 .
Figure 3.

The dependency of human animacy perception on centroid motion characteristics
(A) Experimental procedures. A white dot was first presented at the starting position of each trajectory for 500 ms to draw participants’ attention and then moved along the centroid’s trajectory. Observers were asked to determine the animacy of the moving dot in each trial by pressing keys after the dot stopped moving (Exps. 1 and 3) or pressing keys immediately after making decisions without waiting for the dot to stop moving (Exps. 2 and 4).
(B) The response time of each experiment. The color represented the response type, with blue indicating delayed response and green indicating fast response.
(C) The mean animacy probability of birds’ and drones’ trajectories in Exp. 1 and Exp. 2. The animacy probability here was defined as the percentage of trajectories perceived as animate.
(D) The overall accuracy of Exp. 1 and Exp. 2.
(E) The mean animacy probability of raw and smooth trajectories in Exp. 3.
(F) The overall accuracy of raw and smooth trajectories in Exp. 3.
The error bar represented the standard error of the mean (SEM), and the dots represented individual data. p values were Holm-corrected. ∗∗∗p < 0.001, ∗∗p < 0.01, ∗p < 0.05, n.s. means p > 0.05. See also Figure S1.
We asked each participant what kind of moving object they thought they saw after the formal experiments. Their guesses were diversely distributed and included swimming, running, and flying objects. However, we found that these participants were able to easily discriminate animate motion from inanimate motion based on only the smoothed centroid motion. We performed a 2 (object category: bird vs. drone) 2 (response type: delayed vs. fast) repeated measures analysis of variance on animacy probability of Exp. 1 and Exp. 2. The animacy probability was defined as the percentage of trajectories perceived as animate in each class. We found that the main effect of object category was significant (), and post hoc analysis showed that the animacy probability of birds’ trajectories was significantly higher than that of drones’ trajectories ( Figure 3C, bars with red edges vs. bars with blue edges, respectively). The interaction effect between object category and response type was also significant (). Post hoc analysis showed that for birds’ trajectories, the delayed response was significantly lower than that of the fast response (; see Figure 3C, bars with red edges, filled with red vs. gray); while for drones’ trajectories, there was no difference between the delayed and fast response (; see Figure 3C, bars with blue edges, filled with blue vs. gray). We also compared the overall accuracy between Exp. 1 and Exp. 2, and found that the accuracy of the delayed response was significantly lower than that of the fast response (). These results suggested that additional observation time might introduce some negative effects on behavioral performance. Therefore, according to our hypotheses, human observers adopt the “feature-matching” method instead of the “evidence accumulation” strategy, and they only utilized kinematic features within a small time-window, whose length might be limited by the working memory capacity, to reach a decision, instead of using evidence accumulated during the whole trial.
In Experiment 3, we further included the raw trajectories in the stimuli pool. We performed a 2 (object category: bird vs. drone) 2 (smoothness: smooth vs. raw) repeated measures ANOVA on animacy probability. We found that the main effect of object category was significant (, and post hoc analysis showed that the animacy probability of birds’ trajectories was significantly higher than that of drones’ trajectories (). The main effect of smoothness was significant (, and post hoc analysis showed that the animacy probability of raw trajectories was significantly higher than that of smooth trajectories (). The interaction effect between object category and smoothness was also significant (. Post hoc analysis showed that for birds’ trajectories, the animacy probability based on raw trajectories was significantly higher than that based on smooth trajectories (; Figure 3E, bars with red edges, filled with red vs. filled with green); while for drones’ trajectories, there was no difference between the animacy probability based on raw trajectories and that based on smooth trajectories (; Figure 3E). This might be because trajectory smoothing reduced the fluctuations of raw trajectories, which has a greater impact on birds’ raw trajectories with larger fluctuations than drones’ raw trajectories with small fluctuations. We also compared the overall accuracy of smooth and raw trajectories, and found that the overall accuracy of raw trajectories was significantly higher than that of smooth trajectories (; Figure 3F). These results suggest that additional information on trajectory fluctuations (i.e., larger acceleration, larger angular speed, and long-term periodicity) significantly increased the accuracy rate in discriminating birds from drones. It appears that trajectory fluctuations are a critical kinematic feature for the animacy detection of flying objects. The results of animacy probability in Exp. 4 (see Figure S1) were comparable to those in Exp. 3 and thus were not included in the main text (see supplemental information for detailed information).
Next, to better quantify how motion features affect animacy perception, we computed the robust Spearman’s correlation coefficient between each motion feature and animacy perception of raw trajectories in Exp. 3 separately (Figures 4A–4D) (see the STAR Methods section for details). Unsurprisingly, significant correlations were found for all features. Last, to determine the hierarchy of importance of the kinematic features in animacy perception, we further analyzed the dependency of animacy perception on the medians of speed, acceleration, and angular speed by stepwise linear regression in Exp. 1, and on all three motion features and trajectory fluctuations in Exp. 3. In Exp. 1, both speed and acceleration contributed significantly to animacy perception and together accounted for 85.7% of the variability in animacy perception. To quantify the relative importance of each kinematic feature contributing to animacy perception, we computed the standard coefficient B (see the STAR Methods section for details). It showed that acceleration (B = 0.785, p < 0.001) had a more important role than speed (B = 0.158, p = 0.007). The angular speed was not significant in this model, perhaps because it was dramatically reduced by trajectory smoothing. In Exp. 3, all kinematic features except angular speed contributed significantly to animacy perception and together accounted for 92.1% of the variability in animacy perception. The trajectory fluctuations (B = 0.485, p < 0.001) play a more important role than acceleration (B = 0.31, p < 0.001) and speed (B = 0.232, p < 0.001). The effect of angular speed was also not significant, which might be because angular speed is positively correlated with trajectory fluctuations (r = 0.83, 95% CI [0.79, 0.87]). Actually, what the trajectory fluctuations reflect is the periodic changes in the moving direction, which can also be understood as the pattern of angular velocity changes.
Figure 4.

Dependence of animacy probability of raw trajectories on motion kinetic features in Exp. 3
(A–D) The animacy probability is positively correlated with speed, acceleration, angular speed, and trajectory fluctuations, respectively. The red circles represent bird trajectories, and the blue circles represent drone trajectories. The black lines represent the results of linear regression. The gray areas around the regression line indicate the 95% confidence interval (CI) for the regression line. The horizontal dashed line indicates 0.5 AP (animacy probability). Please note that because we were evaluating the correlation between the probability of being perceived as animate and motion kinetic features contained in each trial, the animacy probability here was defined as the percentage of participants who perceived the trajectory as animate.
Discussion
In the current study, we have introduced a novel approach to build a dataset of actual animate motion. Using this approach, we built a dataset containing animate (birds’) and inanimate (drones’) motion. Then, we systematically compared the difference between animate and inanimate motion. We found that the nature of animate motion may lie in changes in the magnitude and direction of speed, i.e., acceleration and angular speed. Furthermore, using the actual animate motion as visual stimuli, we conducted four human behavior experiments to investigate the nature of animacy perception. Overall, this study can improve our understanding of the nature of animate motion, animacy perception, and their relationship.
Centroid motion dataset
We first built a dataset that contains centroid motion trajectories of six kinds of flying objects using our newly proposed method. Motion trajectories can be obtained by tracking radar54 and GPS trackers.55 However, compared to them, the method using computer vision algorithms was more convenient and low cost, and helped obtain objects’ trajectories which were hard to place the device on, and also did not interfere with the original movement.56,57 This method helps further investigation on animate motion and animacy perception.
The nature of animate motion
We conducted a systematic analysis to compare the differences in motion time-domain features between animate (birds’) and inanimate (drones’) motion. We found that compared to drones, birds have larger speed, acceleration, angular speed, and trajectory fluctuations. Although we found a significant difference in speed between birds and drones, it is important to note that this difference heavily depends on experimental settings, such as the types of drones and birds used. If we included more samples, drones could theoretically cover all the speed ranges of birds. However, in the present study, we were unable to ensure precise matching of the speed range between birds and drones due to several limitations. Firstly, the drone models and bird types that were commercially available were limited. Secondly, the shooting distance affected the speed data we recorded using the camera. The drones’ flight videos were shot outdoors because drones can fly over a wide area, while birds’ flight videos were recorded indoors since they would fly away when outside. Therefore, speed is not the major feature that distinguishes the motion of birds and drones. Instead, changes in speed magnitude (i.e., acceleration) and speed direction (i.e., angular speed) are less affected by the shooting distance, and they should be the essential kinematic features that distinguish between animate and inanimate motion.
One notable feature of flying birds is that they have better motion flexibility, which is the intrinsic property of body tissues that determines the range of motion achievable without injury at a joint or group of joints.58 The power source of birds is unstable because they are powered by the repetitive contractions and extensions of hundreds of muscles. The force exerted by a muscle depends on the shortening rate and its recent history: there is more force after stretching and less force after shortening.59 On the other hand, most drones are equipped with electrical motor-driven propellers, whose power source is a battery with a relatively fixed output.60 Moreover, the flight control algorithm of drones generally keeps the changes in speed and moving direction as smoothly as possible to avoid accidents. Given these differences, the motion flexibility, which can be quantified by the acceleration and angular speed, should be a good indicator for discriminating between the centroid motion of birds and drones. Indeed, acceleration and angular speed are more important than speed for animals: a predator with a higher acceleration catches prey more easily even if its maximum speed is slower than that of its prey,61 while a prey with a higher angular speed can escape even if its speed is slower than that of its predator.62
Another notable feature characterizing birds’ flying behavior is wing flapping. Wing flapping serves two purposes during flight: moving against gravity and in different directions. One direct consequence of wing flapping is repetitive fluctuations along the flight trajectory. We found that the fluctuation rates captured by our data analysis method perfectly matched birds’ previously reported wingbeat frequency.
In summary, the acceleration and angular speed might be the defining features of animate motion. The acceleration changes the magnitude of the speed, while the angular speed changes the direction of the speed. These two factors together caused the fluctuations in the trajectory. Assuming there is no acceleration or angular speed in the extreme case, the trajectory will be a straight line. Therefore, in other words, trajectory fluctuation is the defining feature of animate motion.
The nature of animacy perception
In the human behavior experiments, we found that the accuracy of fast response was higher than that of delayed response (Figure 3D), which suggests that the brain adopts the “feature-matching” method to determine whether a moving object is animate, instead of using “evidence accumulation” method. Next, by analyzing the relationship between motion features and animacy perception, we found that animacy perception is positively correlated with four motion features: speed, acceleration, angular speed, and trajectory fluctuations. The animacy probability is higher than 0.5 only when these motion features are higher than certain values. These results confirmed previous studies, which reported that animacy ratings increase with increased changes in speed and acceleration,11 and both actual and illusory faster speeds trigger higher animacy perception.63 Moreover, we ordered the relative contributions of these features to animacy perception, and found that fluctuations and acceleration played a more important role than speed. Since previous studies used synthetic paths, they only focused on one or two motion features. Using actual animate motion, we first demonstrated that some visual cues (e.g., acceleration) are more powerful than others (e.g., speed) when they are simultaneously presented. But we should notice that the weight of each motion feature is not fixed and is related to the properties of the moving object.
These results indicate that the brain is sensitive to acceleration and angular speed. We speculate that there might be specialized neurons and neural circuits in the brain to process them, such as acceleration-sensitive neurons and angular-speed-sensitive neurons. The acceleration-sensitive neurons obtain acceleration through time-delay speed integration, while the angular-speed-sensitive neurons obtain angular speed by integrating motion directions over time. These neurons and neural circuits are the foundations of animacy perception. In addition, using biological motion stimulus (i.e., point light walker), previous studies found that the vertical acceleration pattern of the feet is crucial in identifying animate motion.64 To explain these phenomena, Troje and Westhoff (2006) proposed a “life motion detector” theory, which argues that the visual system might contain innate “life detectors” which are sensitive to the life motion signals, especially those from the feet.65,66,67 The “life detectors” are defined by their functional capabilities, which are to detect the critical features of animate motion and biological motion. Since there are several key features of animate motion, such as acceleration and angular speed, there should be various types of “life detectors” in the brain, such as acceleration-sensitive detectors (i.e., acceleration-sensitive neurons) and angular-speed-sensitive detectors (i.e., angular-speed-sensitive neurons). In summary, these “life detectors” are primarily responsible for detecting features of animate motion and then triggering animacy perception, rather than representing animacy perception themselves.
Motion information is mainly processed by a series of brain areas along the dorsal visual pathway [for review see68]. Neurons in the primary visual cortex V1/V2 are capable of extracting local motion features, including speed, motion direction, and spatiotemporal frequency. Neurons in the middle temporal area (MT/V5) integrate the inputs from V1/V2 and exhibit clear feature detection capability of coherent motion direction and speed selectivity of both simple and complex visual motion patterns. A single MT neuron might not be able to encode acceleration, but the pooling responses of a population of MT neurons could estimate visual acceleration.69 Neurons in the medial superior temporal (MST) area receive major visual inputs from MT, are selective to complex optic flow patterns,70 and are capable of encoding multiple biological motion features (unpublished results of our laboratory), which could also be a type of “life detector”. Furthermore, the intraparietal sulcus (IPS) receives inputs from both the MT and MST and is capable of classifying the stimuli into different categories.71 A neuroimaging study found that in the task to indicate whether a single moving dot appeared alive, hMT+/V5 was activated, and the activation in the right IPS was positively correlated with perceived animacy instead of animacy cues.72 They proposed that the right IPS might be involved in matching stimuli to stored representations of animate motion. In addition, the animacy perception might be represented by the social behavior network (for reviews, see17,18). Visually naive chicks showed increased activity in the social behavior network of the brain increased when chicks met alive conspecifics.73 Specifically, the septum and preoptic area showed higher activity when chicks were exposed to biological motion74 and dynamic features of animate motion (such as changing speed),75 while the nucleus taeniae of the amygdala were more active to the static features of typical animate appearance.76 Overall, a series of brain areas along the dorsal visual pathway are important in detecting the kinematic features of animate motion, while the social brain network may be involved in representing animacy perception.
To better understand animacy perception, we propose a two-stage processing model of animacy perception, including a sensory information processing stage and a feature-matching stage. In the sensory information processing stage, the motion-sensitive neurons or neural circuits extract various motion features of the moving object. These neurons exhibit greater sensitivity to certain values of motion features (such as gravitational acceleration, and acceleration of animate motion) than to uncommon values. The extracted motion features are then transmitted to higher brain areas to determine the animacy of the object. In the subsequent feature-matching stage, the brain compares the similarity between the extracted motion features of the object with the intrinsic template of animate motion. We assume that there is a multi-dimensional feature space in the brain, and each dimension represents a motion feature, such as acceleration and angular speed. The intrinsic template is a specific cluster in the feature space, which is formed by the distributions of motion features of animate motion. If the motion features of one object are within or close to the cluster, the brain categorizes the object as animate. The template might be innate and can also be influenced by post-natal experience.21,25,41,42 Overall, this model provides a framework for understanding how the brain processes the information of moving object and determines its animacy.
Limitations of the study
This study also has some limitations. Firstly, this study only compared the motion differences between birds and drones, which may not be representative of all animate and inanimate objects. For example, if we compared the motion of a terrestrial animal (e.g., dog) vs. a robot moving on land (e.g., AIBO), we may find other distinguishing motion features, which are important for animacy perception. Secondly, the study only analyzed the kinematic features of centroid movement to identify the most basic features that defined animate motion. While this is a good point, it is important to note that the relative motion pattern of different body parts of animals should also contain critical information. The difference in the relative motion pattern between animate and inanimate objects is also an inherent feature caused by the fundamental difference in drive mode (muscle vs. motor) and gravity adaptation. Therefore, future studies can investigate the motion of a diverse range of animate and inanimate objects and use more advanced techniques to analyze the relative motion pattern of different body parts to obtain a comprehensive understanding of the motion differences.
STAR★Methods
Key resources table
| REAGENT or RESOURCE | SOURCE | IDENTIFIER |
|---|---|---|
| Deposited data | ||
| Trajectory data | This paper | https://doi.org/10.17632/gr6yp4fnb8.1 |
| Behavioral data | This paper | https://doi.org/10.17632/gr6yp4fnb8.1 |
| Software and algorithms | ||
| MATLAB | Mathworks | https://www.mathworks.com/products/matlab.html |
| NIMH MonkeyLogic | Hwang et al.77 | https://monkeylogic.nimh.nih.gov/ |
| JASP | The JASP Team | https://jasp-stats.org/ |
| ECO | Danelljan et al.78 | https://github.com/martin-danelljan/ECO |
| DIMP | Bhat et al.79 | https://github.com/visionml/pytracking#dimp |
| skipped_correlation | Pernet et al.80 | https://sourceforge.net/projects/robustcorrtool/ |
Resource availability
Lead contact
Further information and requests for resources and reagents should be directed to and will be fulfilled by the lead contact, Tao Zhang (taozhang@psych.ac.cn).
Materials availability
This study did not generate new unique reagents.
Experimental model and study participant details
Birds and drones used in video shooting
We used three kinds of birds, including six pigeons (body weight, 194–347 g; body length, 29.5–30 cm), one canary (15–20 g; 12.5 cm), and two zebra finches (7–12 g; 10–11 cm), which were bought from a bird and flower market. We also used three kinds of drones, including one DJI Phantom 4 (weight, 1380 g; symmetrical motor wheelbase, 35 cm), one Mavic Pro (734 g; 33.5 cm), and one Tello (80 g; 13.48 cm). Flight videos of each type of bird were recorded separately. The canary is a very active bird, and we were able to collect enough video data with only one bird. However, zebra finches and pigeons are less active due to captivity, so we need to use two or more birds to capture enough video data for analysis. These birds were given to suitable families for adoption after the experiment.
Subjects in the behaviour experiments
Twenty-nine Chinese college students were recruited. The data of 5 participants were removed due to using the opposite decision strategy from the other participants in judging slow motion as animate and fast motion as insnimate, or exhibiting a particular bias by judging all motion trajectories as animate. The remaining twenty-four students (12 females) aged between 18 and 30 years (M ± SD, 22.71 ± 3.03 years) participated in all four experiments. All participants were right-handed with normal or corrected-to-normal vision and provided informed written consent before the experiments. They were all naïve to the research purposes. The procedures and protocols used in this study were approved by the institutional review board of the Institute of Psychology of the Chinese Academy of Sciences.
Method details
Filming equipment and environment
The video recording device we used was a digital camera (SONY DSC-RX100M5A) that was kept steady on a tripod during shooting. The automatic zooming function was turned off to avoid accidental background movement. To capture high speed movements in good detail, the camera was set to 120 frames per second with a resolution of 1920x1080 pixels per frame. The flying activities of two small size birds (zebra finches and canary) were recorded using a customized filming box (height x length x width: 3x2x1 meters). The inner surface of the filming box was covered by a green curtain except for the transparent front, which was made of organic glass (3x2 meters). The flying activities of pigeons were recorded inside a stadium (height x length x width: 5x18x11 meters). The video clips of flying Tello, Mavic Pro, and Phantom 4 were taken inside an empty parking lot on a breezeless day. We employed an experienced UAV operator to imitate the flying trajectories of birds by observing their motion beforehand. The operator used a hand-operated joystick to control the drones, which made it difficult to precisely control the acceleration rate and frequency. Since the joystick was usually pushed to the bottom, the drones' flying trajectories we obtained should reflect the maximum acceleration and angular speed of drones, though they may not reflect the maximum velocity of drones. Then, for each type of flying object, thirty video clips were randomly selected and edited using video editing software (Adobe Premiere Pro CC 2018) to eliminate scenes with obvious motion characteristics that distinguish birds from drones, such as taking off, landing and hovering.
Behavioural recording techniques
Experimental stimuli and procedures were generated and displayed using MATLAB 2018b and NIMH MonkeyLogic77 on Display++ (1920×1080 screen resolution, 120 Hz refresh rate). During the experiment, participants put their heads on the chin rest to keep a viewing distance of 58 cm from the screen.
Stimuli and procedure
In the behavioral experiments, the denoised and corresponding smoothed trajectories from the dataset were utilized. The smoothed trajectories were obtained by smoothing the denoised trajectories using the moving average filter with appropriate window sizes (zebra finch and Tello, 7; canary and Mavic Pro, 9; pigeon and Phantom4, 15). All trajectories were downscaled equally to half of their original size to be presented within the center of the screen.
Each trial began with a white fixation cross ([255, 255, 255], 0.3 ° × 0.3 °) presented at the center of the screen for 300∼500 ms. Then, a white dot ([255, 255, 255], 0.3 ° × 0.3 °) was presented at the starting position of a trajectory for 300 ms to draw participants' attention to that location. Next, the white dot moved along the centroid's trajectory and turned black at the final position of the trajectory. The dot's position was refreshed at 120 Hz. In Experiments 1 and 2, the trajectories were randomly selected from the smoothed trajectory dataset, while in Experiments 3 and 4, they were randomly selected from both the denoised and the smoothed trajectories dataset. Participants were required to identify the category of the moving object (animate vs. inanimate) by pressing the left or right arrow keys, respectively. In Experiments 1 and 3, participants were required to respond within 2000 ms after the dot stopped moving, while in Experiments 2 and 4, participants were instructed to respond as soon as they identified the category of the object, and if they did not respond before the dot stopped moving, they were required to respond within 1000 ms. If participants did not respond in the required time, the trajectory would randomly present again in the remaining trials. The intertrial interval (ITI) was 2000 ms.
In Exp.1 and Exp.2, we presented participants 180 smooth trajectories (30 trajectories 6 object types). In Exp.3 and Exp.4, we presented participants 180 raw and 180 smooth trajectories. The order of the presentation of the trajectories was randomized. Participants completed 12 practice trials before the formal experiment. They performed the four experiments in the same order on the same day: Exp.1 (smooth stimuli with delayed response), Exp.2 (smooth stimuli with fast response), Exp.3 (raw and smooth stimuli with delayed response), and Exp.4 (raw and smooth stimuli with fast response). Participants took one minute break after every 60 trials in each experiment and rested for a longer period time between each experiment to ensure they were energetic. No feedback was given during the experiments.
Before performing the animacy judgment task, participants first completed a visual reaction time test task. In each trial, a white fixation cross ([255, 255, 255], 0.3 ° × 0.3 °) was presented at the center of the screen for 300∼500 ms, and then a white dot ([255, 255, 255], 0.3 ° × 0.3 °) was presented at the same location for 500 ms. Participants were required to press the space key immediately when they saw the dot. This trial was repeated 100 times. The median of the response time was computed as the robust estimation of the visual reaction time, which was then used to compute the net response time.
Quantification and statistical analysis
Trajectory pre-processing
To extract the location of the flying object in each frame of the video, we adopted ECO78 (for pigeons) or DIMP79 (for drones and the two other kinds of birds) algorithms in open-source code provided by the authors' GitHub. The choice of algorithm was evaluated by the experimenter frame-by-frame and was based on the centroid estimation performance of each object. To remove noise from raw trajectories, we first performed the wavelet signal denoising method using the wdenoise function built into MATLAB. The function used an empirical Bayesian method with a Cauchy prior, and the default wavelet was 'sym4'. Various parameters and options of the function were tested, and the small variations of the data did not affect the overall results and conclusions, which suggests that the denoising method is robust.
Motion feature analysis
We computed three motion time-domain features of flying objects: speed, acceleration, and angular speed. The calculation methods of speed () and acceleration () are shown in Equations 1 and 2, respectively. The angular speed was defined as the rate of moving direction changes over time, and its detailed calculation method is shown in Equations 3, 4, 5, and 6. , , and represent the position vector, velocity vector, and angular speed at time t, respectively. was used to determine the direction of rotation (i.e., clockwise or counterclockwise) and was computed using the direction of the cross product between and . Additionally, to fix oscillation around the π angle, we iteratively normalized using the procedure proposed by Vlachos et al.,81 which repeated Equation 4 n times or until stability was achieved. In our experiments, we iterated the normalization step 10 times.
| (Equation 1) |
| (Equation 2) |
| (Equation 3) |
| (Equation 4) |
| (Equation 5) |
| (Equation 6) |
Then, to reveal the difference in the statistical features of motion features between birds and drones, we performed the independent sample T-test and the nonparametric Mann–Whitney test if the Shapiro–Wilk test suggested deviations from normality.
For each type of flying object, we also analysed the trajectory fluctuations, which were defined as the difference between the denoised trajectory and the smoothed trajectory. The smoothed trajectory was obtained by smoothing the denoised trajectory using the moving average filter with window sizes varying from 3 to 19 with a step size of 2. Then, we performed the fast Fourier transform on the trajectory fluctuations and averaged them across thirty trajectories. For each type of bird, the appropriate window size was the one where a relatively large amplitude of peak frequency was observed. We then performed a Gaussian fit on the average amplitude spectrum of the specific frequency band (see Equation 7 (the actual frequency was obtained from previous research). Therefore, the frequency band was 8–42 Hz for zebra finches, 5.76–30.24 Hz for canaries, and 2.56–13.44 Hz for pigeons. The window size for each type of drone was set to be equal to that of a bird of corresponding size (DJI Phantom 4 for pigeon, Mavic Pro for canary, and Tello for zebra finch).
| (Equation 7) |
Statistical analysis of behaviour results
For the animacy probability of Experiments 1 and 2, we performed a 2 (object category: birds vs. drones) × 2 (response type: delayed (Exp. 1) vs. fast (Exp. 2)) repeated measures ANOVA. For the animacy probability of Experiments 3 and 4, we performed a 2 (object category: birds vs. drones) × 2 (smoothness: raw vs. smoothed) repeated measures ANOVA. Normality for all datasets was tested using the Shapiro–Wilk test. If the normality assumption was violated, we performed a nonparametric test, including a paired samples Wilcoxon signed-rank test and a one-sample Wilcoxon signed-rank test. The p values of post hoc tests were Holm adjusted to correct for Type I error.
The trajectory fluctuation was defined as the area between raw trajectories and smoothed trajectories, and was the sum of small areas determined by two adjacent frames. Since these areas ranged on a large scale across trajectories, they were then logarithmically transferred and added by ten. To determine the relationship between the animacy probability and motion features, we computed the robust Spearman's correlation using the skipped_correlation function in the MATLAB robust correlation toolbox.80 This function first identified bivariate outliers by computing all the distances to the center of the bivariate cloud and then checked whether the distances were greater than the given distance.82,83 This function also computes percentile 95% CIs for each correlation by the bootstrap method (B = 1000).
To further order the relative importance of motion features on animacy probability, we performed stepwise regression using JASP. All statistical tests were two-tailed. After the stepwise regression analysis, to detect the potential collinearity between the motion features in the animacy perception model, the variance inflation factor (VIF) analysis was performed. A feature whose VIF was larger than 10 was considered to have high collinearity with other features and was removed from the main model. The multivariate normality assumption was also tested by investigating whether the residuals of the regression model in a normal quantile–quantile plot lie on a diagonal line. In addition, to identify extreme cases that exerted undue influence on the model, we performed casewise diagnostics and removed outliers whose standardized residuals were larger than 3.
Acknowledgments
We thank Dr. Gang Wang for the valuable discussion on data collection and analysis. We thank Mr. Shaogang Li for his assistance in setting up the data processing computer. We thank Dr. Yi Jiang, Dr. Dajun Xing, and Dr. Sheng Li for the valuable comments on the manuscript. We thank Mr. Haiyan Liu for feeding the birds and helping collect data. This research was financially supported by the National Key Research and Development Program of China [No. 2018AAA0100201], the National Natural Science Foundation of China [No. 31830037], and the Open Research Fund of the State Key Laboratory of Cognitive Neuroscience and Learning [No. CNLZD1803].
Author contributions
Conceptualization, T.Z., L.L., and Y.W.; Methodology, Y.H., W.H., and L.L.; Software, W.H.; Investigation, Y.H., W.H., and L.L.; Formal Analysis, Y.H.; Writing – Original Draft, Y.H. and T.Z.; Writing – Review & Editing, T.Z. and Y.H.; Funding Acquisition, T.Z.; Supervision, T.Z., L.L., and Y.W.
Declaration of interests
The authors declare no competing interests.
Inclusion and diversity
We support inclusive, diverse, and equitable conduct of research.
Published: August 17, 2023
Footnotes
Supplemental information can be found online at https://doi.org/10.1016/j.isci.2023.107658.
Contributor Information
Liang Li, Email: liang.li.brain@aliyun.com.
Tao Zhang, Email: taozhang@psych.ac.cn.
Supplemental information
Data and code availability
-
•
Data including trajectories and human behavior experiments have been deposited at Mendely Data and are publicly available as of the date of publication. DOIs are listed in the key resources table.
-
•
All original code has been deposited at Mendely Data and is publicly available as of the date of publication. DOIs are listed in the key resources table.
-
•
Any additional information required to reanalyze the data reported in this work is available from the lead contact upon reasonable request.
References
- 1.Vallortigara G. MIT press; 2021. Born Knowing: Imprinting and the Origins of Knowledge. [Google Scholar]
- 2.Lorenzi E., Vallortigara G. The Cambridge handbook of animal cognition Cambridge handbooks in psychology. Cambridge University Press; 2021. Evolutionary and neural bases of the sense of animacy; pp. 295–321. [DOI] [Google Scholar]
- 3.Scholl B.J., Tremoulet P.D. Perceptual causality and animacy. Trends Cogn. Sci. 2000;4:299–309. doi: 10.1016/S1364-6613(00)01506-0. [DOI] [PubMed] [Google Scholar]
- 4.Szego P.A., Rutherford M.D. Dissociating the perception of speed and the perception of animacy: a functional approach. Evol. Hum. Behav. 2008;29:335–342. doi: 10.1016/j.evolhumbehav.2008.04.002. [DOI] [Google Scholar]
- 5.Johansson G. Erlbaum; 1950. Configurations in Event Perception (Uppsala: Almquist and Wiksell) [Google Scholar]
- 6.Troje N.F. 2013. What Is Biological Motion? Definition, Stimuli and Paradigms. Social Perception: Detection and Interpretation of Animacy, Agency, and Intention; pp. 13–36. [DOI] [Google Scholar]
- 7.Johansson G. Visual perception of biological motion and a model for its analysis. Percept. Psychophys. 1973;14:201–211. doi: 10.3758/BF03212378. [DOI] [Google Scholar]
- 8.Heider F., Simmel M. An experimental study of apparent behavior. Am. J. Psychol. 1944;57:243–259. doi: 10.2307/1416950. [DOI] [Google Scholar]
- 9.Gao T., McCarthy G., Scholl B.J. The Wolfpack Effect: Perception of Animacy Irresistibly Influences Interactive Behavior. Psychol. Sci. 2010;21:1845–1853. doi: 10.1177/0956797610388814. [DOI] [PubMed] [Google Scholar]
- 10.Kuhlmeier V., Wynn K., Bloom P. Attribution of Dispositional States by 12-Month-Olds. Psychol. Sci. 2003;14:402–408. doi: 10.1111/1467-9280.01454. [DOI] [PubMed] [Google Scholar]
- 11.Tremoulet P.D., Feldman J. Perception of animacy from the motion of a single object. Perception. 2000;29:943–951. doi: 10.1068/p3101. [DOI] [PubMed] [Google Scholar]
- 12.White P.A. Visual impressions of active and inanimate resistance to impact from a moving object. Vis. Cogn. 2020;28:263–278. doi: 10.1080/13506285.2020.1787571. [DOI] [Google Scholar]
- 13.Gelman R., Durgin F.H., Kaufman L. In: Causal Cognition: A Multidisciplinary Debate. Sperber D., Premack D., Premack A.J., editors. Oxford University Press; 1995. Distinguishing between animates and inanimates: not by motion alone. [Google Scholar]
- 14.Bliss L., Vasas V., Freeland L., Roach R., Ferrè E.R., Versace E. A spontaneous gravity prior: newborn chicks prefer stimuli that move against gravity. Biol. Lett. 2023;19:20220502. doi: 10.1098/rsbl.2022.0502. [DOI] [PMC free article] [PubMed] [Google Scholar]
- 15.Stewart J.A. 1982. Perception of Animacy. [Google Scholar]
- 16.Gyulai E. Considerations on perception of “animacy” in the motion a single object. Percept. Mot. Skills. 2004;99:1014–1026. doi: 10.2466/pms.99.3.1014-1026. [DOI] [PubMed] [Google Scholar]
- 17.Lemaire B.S., Vallortigara G. Life is in motion (through a chick’s eye) Anim. Cogn. 2023;26:129–140. doi: 10.1007/s10071-022-01703-8. [DOI] [PMC free article] [PubMed] [Google Scholar]
- 18.Di Giorgio E., Loveland J.L., Mayer U., Rosa-Salva O., Versace E., Vallortigara G. Filial responses as predisposed and learned preferences: Early attachment in chicks and babies. Behav. Brain Res. 2017;325:90–104. doi: 10.1016/j.bbr.2016.09.018. [DOI] [PubMed] [Google Scholar]
- 19.Vallortigara G., Regolin L., Marconato F. Visually inexperienced chicks exhibit spontaneous preference for biological motion patterns. PLoS Biol. 2005;3:e208. doi: 10.1371/journal.pbio.0030208. [DOI] [PMC free article] [PubMed] [Google Scholar]
- 20.Simion F., Regolin L., Bulf H. A predisposition for biological motion in the newborn baby. Proc. Natl. Acad. Sci. USA. 2008;105:809–813. doi: 10.1073/pnas.0707021105. [DOI] [PMC free article] [PubMed] [Google Scholar]
- 21.Di Giorgio E., Lunghi M., Simion F., Vallortigara G. Visual cues of motion that trigger animacy perception at birth: the case of self-propulsion. Dev. Sci. 2017;20:e12394. doi: 10.1111/desc.12394. [DOI] [PubMed] [Google Scholar]
- 22.Mascalzoni E., Regolin L., Vallortigara G. Innate sensitivity for self-propelled causal agency in newly hatched chicks. Proc. Natl. Acad. Sci. USA. 2010;107:4483–4485. doi: 10.1073/pnas.0908792107. [DOI] [PMC free article] [PubMed] [Google Scholar]
- 23.Di Giorgio E., Lunghi M., Vallortigara G., Simion F. Newborns’ sensitivity to speed changes as a building block for animacy perception. Sci. Rep. 2021;11:542. doi: 10.1038/s41598-020-79451-3. [DOI] [PMC free article] [PubMed] [Google Scholar]
- 24.Di Giorgio E., Rosa-Salva O., Frasnelli E., Calcagnì A., Lunghi M., Scattoni M.L., Simion F., Vallortigara G. Abnormal visual attention to simple social stimuli in 4-month-old infants at high risk for Autism. Sci. Rep. 2021;11:15785. doi: 10.1038/s41598-021-95418-4. [DOI] [PMC free article] [PubMed] [Google Scholar]
- 25.Rosa-Salva O., Grassi M., Lorenzi E., Regolin L., Vallortigara G. Spontaneous preference for visual cues of animacy in nave domestic chicks: the case of speed changes. Cognition. 2016;157:49–60. doi: 10.1016/j.cognition.2016.08.014. [DOI] [PubMed] [Google Scholar]
- 26.Rosa-Salva O., Hernik M., Broseghini A., Vallortigara G. Visually-naïve chicks prefer agents that move as if constrained by a bilateral body-plan. Cognition. 2018;173:106–114. doi: 10.1016/j.cognition.2018.01.004. [DOI] [PubMed] [Google Scholar]
- 27.Hernik M., Fearon P., Csibra G. Action anticipation in human infants reveals assumptions about anteroposterior body-structure and action. Proc. Biol. Sci. 2014;281:20133205. doi: 10.1098/rspb.2013.3205. [DOI] [PMC free article] [PubMed] [Google Scholar]
- 28.Lemaire B.S., Rosa-Salva O., Fraja M., Lorenzi E., Vallortigara G. Spontaneous preference for unpredictability in the temporal contingencies between agents’ motion in naive domestic chicks. Proc. Biol. Sci. 2022;289:20221622. doi: 10.1098/rspb.2022.1622. [DOI] [PMC free article] [PubMed] [Google Scholar]
- 29.Hébert M., Versace E., Vallortigara G. Inexperienced preys know when to flee or to freeze in front of a threat. Proc. Natl. Acad. Sci. USA. 2019;116:22918–22920. doi: 10.1073/pnas.1915504116. [DOI] [PMC free article] [PubMed] [Google Scholar]
- 30.Rochat P., Morgan R., Carpenter M. Young infants’ sensitivity to movement information specifying social causality. Cognit. Dev. 1997;12:537–561. doi: 10.1016/S0885-2014(97)90022-8. [DOI] [Google Scholar]
- 31.Frankenhuis W.E., House B., Barrett H.C., Johnson S.P. Infants’ perception of chasing. Cognition. 2013;126:224–233. doi: 10.1016/j.cognition.2012.10.001. [DOI] [PMC free article] [PubMed] [Google Scholar]
- 32.Di Giorgio E., Frasnelli E., Rosa Salva O., Scattoni M.L., Puopolo M., Tosoni D., NIDA-Network. Simion F., Vallortigara G. Difference in Visual Social Predispositions Between Newborns at Low- and High-risk for Autism. Sci. Rep. 2016;6:26395. doi: 10.1038/srep26395. [DOI] [PMC free article] [PubMed] [Google Scholar]
- 33.Matsushima T., Miura M., Patzke N., Toji N., Wada K., Ogura Y., Homma K.J., Sgadò P., Vallortigara G. Fetal blockade of nicotinic acetylcholine transmission causes autism-like impairment of biological motion preference in the neonatal chick. Cereb. Cortex Commun. 2022:tgac041. doi: 10.1093/texcom/tgac041. [DOI] [PMC free article] [PubMed] [Google Scholar]
- 34.Lorenzi E., Pross A., Rosa-Salva O., Versace E., Sgadò P., Vallortigara G. Embryonic Exposure to Valproic Acid Affects Social Predispositions for Dynamic Cues of Animate Motion in Newly-Hatched Chicks. Front. Physiol. 2019;10:501. doi: 10.3389/fphys.2019.00501. [DOI] [PMC free article] [PubMed] [Google Scholar]
- 35.Sgadò P., Rosa-Salva O., Versace E., Vallortigara G. Embryonic Exposure to Valproic Acid Impairs Social Predispositions of Newly-Hatched Chicks. Sci. Rep. 2018;8:5919. doi: 10.1038/s41598-018-24202-8. [DOI] [PMC free article] [PubMed] [Google Scholar]
- 36.Versace E., Martinho-Truswell A., Kacelnik A., Vallortigara G. Priors in Animal and Artificial Intelligence: Where Does Learning Begin? Trends Cogn. Sci. 2018;22:963–965. doi: 10.1016/j.tics.2018.07.005. [DOI] [PubMed] [Google Scholar]
- 37.Versace E., Ragusa M., Vallortigara G. A transient time window for early predispositions in newborn chicks. Sci. Rep. 2019;9:18767. doi: 10.1038/s41598-019-55255-y. [DOI] [PMC free article] [PubMed] [Google Scholar]
- 38.Rosa-Salva O., Mayer U., Versace E., Hébert M., Lemaire B.S., Vallortigara G. Sensitive periods for social development: Interactions between predisposed and learned mechanisms. Cognition. 2021;213:104552. doi: 10.1016/j.cognition.2020.104552. [DOI] [PubMed] [Google Scholar]
- 39.Lorenzi E., Lemaire B.S., Versace E., Matsushima T., Vallortigara G. Resurgence of an Inborn Attraction for Animate Objects via Thyroid Hormone T3. Front. Behav. Neurosci. 2021;15:675994. doi: 10.3389/fnbeh.2021.675994. [DOI] [PMC free article] [PubMed] [Google Scholar]
- 40.Pavlova M.A. Biological Motion Processing as a Hallmark of Social Cognition. Cereb. Cortex. 2012;22:981–995. doi: 10.1093/cercor/bhr156. [DOI] [PubMed] [Google Scholar]
- 41.Larsch J., Baier H. Biological Motion as an Innate Perceptual Mechanism Driving Social Affiliation. Curr. Biol. 2018;28:3523–3532.e4. doi: 10.1016/j.cub.2018.09.014. [DOI] [PubMed] [Google Scholar]
- 42.Casile A., Giese M.A. Nonvisual Motor Training Influences Biological Motion Perception. Curr. Biol. 2006;16:69–74. doi: 10.1016/j.cub.2005.10.071. [DOI] [PubMed] [Google Scholar]
- 43.Barrett H.C., Todd P.M., Miller G.F., Blythe P.W. Accurate judgments of intention from motion cues alone: A cross-cultural study. Evol. Hum. Behav. 2005;26:313–331. doi: 10.1016/j.evolhumbehav.2004.08.015. [DOI] [Google Scholar]
- 44.Hauser M.D. A nonhuman primate’s expectations about object motion and destination: The importance of self-propelled movement and animacy. Dev. Sci. 1998;1:31–37. doi: 10.1111/1467-7687.00009. [DOI] [Google Scholar]
- 45.Abdai J., Baño Terencio C., Miklósi Á. Novel approach to study the perception of animacy in dogs. PLoS One. 2017;12:e0177010. doi: 10.1371/journal.pone.0177010. [DOI] [PMC free article] [PubMed] [Google Scholar]
- 46.Abdai J., Uccheddu S., Gácsi M., Miklósi Á. Chasing perception in domestic cats and dogs. Anim. Cogn. 2022;25:1589–1597. doi: 10.1007/s10071-022-01643-3. [DOI] [PMC free article] [PubMed] [Google Scholar]
- 47.Abdai J., Uccheddu S., Gácsi M., Miklósi Á. Exploring the advantages of using artificial agents to investigate animacy perception in cats and dogs. Bioinspir. Biomim. 2022;17:065009. doi: 10.1088/1748-3190/ac93d9. [DOI] [PubMed] [Google Scholar]
- 48.Ma X., Yuan X., Liu J., Shen L., Yu Y., Zhou W., Liu Z., Jiang Y. Gravity-Dependent Animacy Perception in Zebrafish. Research. 2022;2022:9829016. doi: 10.34133/2022/9829016. [DOI] [PMC free article] [PubMed] [Google Scholar]
- 49.De Agrò M., Rößler D.C., Kim K., Shamble P.S. Perception of biological motion by jumping spiders. PLoS Biol. 2021;19:e3001172. doi: 10.1371/journal.pbio.3001172. [DOI] [PMC free article] [PubMed] [Google Scholar]
- 50.Chen X., Li Z., Yang Y., Qi L., Ke R. High-resolution vehicle trajectory extraction and denoising from aerial videos. IEEE Trans. Intell. Transp. Syst. 2021;22:3190–3202. doi: 10.1109/TITS.2020.3003782. [DOI] [Google Scholar]
- 51.Dentinger J.E., Street G.M. Vol. 83. Oxford University Press; 2019. p. 1474. (Animal Locomotion (second edition). Andrew A. Biewener and Sheila N. Patek). Oxford, U.K. 240 pp. $95.00 hardcover. ISBN: 978-019874316. J. Wildl. Manag. [DOI] [Google Scholar]
- 52.Tobalske B., Dial K. Flight kinematics of black-billed magpies and pigeons over a wide range of speeds. J. Exp. Biol. 1996;199:263–280. doi: 10.1242/jeb.199.2.263. [DOI] [PubMed] [Google Scholar]
- 53.Tobalske B.W., Peacock W.L., Dial K.P. Kinematics of flap-bounding flight in the zebra finch over a wide range of speeds. J. Exp. Biol. 1999;202:1725–1739. doi: 10.1242/jeb.202.13.1725. [DOI] [PubMed] [Google Scholar]
- 54.Bruderer B., Peter D., Boldt A., Liechti F. Wing-beat characteristics of birds recorded with tracking radar and cine camera. Ibis. 2010;152:272–291. doi: 10.1111/j.1474-919X.2010.01014.x. [DOI] [Google Scholar]
- 55.Taylor L.A., Taylor G.K., Lambert B., Walker J.A., Biro D., Portugal S.J. Birds invest wingbeats to keep a steady head and reap the ultimate benefits of flying together. PLoS Biol. 2019;17:e3000299. doi: 10.1371/journal.pbio.3000299. [DOI] [PMC free article] [PubMed] [Google Scholar]
- 56.Chin D.D., Lentink D. Birds repurpose the role of drag and lift to take off and land. Nat. Commun. 2019;10:5354. doi: 10.1038/s41467-019-13347-3. [DOI] [PMC free article] [PubMed] [Google Scholar]
- 57.Sholtis K.M., Shelton R.M., Hedrick T.L. Field flight dynamics of hummingbirds during territory encroachment and defense. PLoS One. 2015;10:e0125659. doi: 10.1371/journal.pone.0125659. [DOI] [PMC free article] [PubMed] [Google Scholar]
- 58.Holt J., Holt L.E., Pelham T.W. ISBS. 1995. Flexibility redefined. [Google Scholar]
- 59.Alexander R.M. Princeton University Press; 2013. Principles of Animal Locomotion. [Google Scholar]
- 60.Divya K., Østergaard J. Battery energy storage technology for power systems—an overview. Electr. Power Syst. Res. 2009;79:511–520. doi: 10.1016/j.epsr.2008.09.017. [DOI] [Google Scholar]
- 61.Elliott J.P., Cowan I.M., Holling C.S. Prey capture by the African Lion. Can. J. Zool. 1977;55:1811–1828. doi: 10.1139/z77-235. [DOI] [Google Scholar]
- 62.Howland H.C. Optimal strategies for predator avoidance: the relative importance of speed and manoeuvrability. J. Theor. Biol. 1974;47:333–350. doi: 10.1016/0022-5193(74)90202-1. [DOI] [PubMed] [Google Scholar]
- 63.Szego P.A., Rutherford M.D. Actual and illusory differences in constant speed influence the perception of animacy similarly. J. Vis. 2007;7:5.1–5.7. doi: 10.1167/7.12.5. [DOI] [PubMed] [Google Scholar]
- 64.Chang D.H.F., Troje N.F. Acceleration carries the local inversion effect in biological motion perception. J. Vis. 2009;9:19.1–19.17. doi: 10.1167/9.1.19. [DOI] [PubMed] [Google Scholar]
- 65.Chang D.H.F., Troje N.F. Animacy and direction from point-light displays: Is there a life detector? J. Vis. 2007;7:481. doi: 10.1167/7.9.481. [DOI] [Google Scholar]
- 66.Johnson M.H. Biological Motion: A Perceptual Life Detector? Curr. Biol. 2006;16:R376–R377. doi: 10.1016/j.cub.2006.04.008. [DOI] [PubMed] [Google Scholar]
- 67.Troje N.F., Westhoff C. The Inversion Effect in Biological Motion Perception: Evidence for a “Life Detector”. Curr. Biol. 2006;16:821–824. doi: 10.1016/j.cub.2006.03.022. [DOI] [PubMed] [Google Scholar]
- 68.Perry C.J., Fallah M. Feature integration and object representations along the dorsal stream visual hierarchy. Front. Comput. Neurosci. 2014;8:84. doi: 10.3389/fncom.2014.00084. [DOI] [PMC free article] [PubMed] [Google Scholar]
- 69.Lisberger S.G., Movshon J.A. Visual motion analysis for pursuit eye movements in area MT of macaque monkeys. J. Neurosci. 1999;19:2224–2246. doi: 10.1523/JNEUROSCI.19-06-02224.1999. [DOI] [PMC free article] [PubMed] [Google Scholar]
- 70.Duffy C.J., Wurtz R.H. Sensitivity of MST neurons to optic flow stimuli. II. Mechanisms of response selectivity revealed by small-field stimuli. J. Neurophysiol. 1991;65:1346–1359. doi: 10.1152/jn.1991.65.6.1346. [DOI] [PubMed] [Google Scholar]
- 71.Freedman D.J., Assad J.A. Experience-dependent representation of visual categories in parietal cortex. Nature. 2006;443:85–88. doi: 10.1038/nature05078. [DOI] [PubMed] [Google Scholar]
- 72.Schultz J., Bülthoff H.H. Perceiving animacy purely from visual motion cues involves intraparietal sulcus. Neuroimage. 2019;197:120–132. doi: 10.1016/j.neuroimage.2019.04.058. [DOI] [PubMed] [Google Scholar]
- 73.Mayer U., Rosa-Salva O., Vallortigara G. First exposure to an alive conspecific activates septal and amygdaloid nuclei in visually-naïve domestic chicks (Gallus gallus) Behav. Brain Res. 2017;317:71–81. doi: 10.1016/j.bbr.2016.09.031. [DOI] [PubMed] [Google Scholar]
- 74.Mayer U., Rosa-Salva O., Morbioli F., Vallortigara G. The motion of a living conspecific activates septal and preoptic areas in naive domestic chicks (Gallus gallus) Eur. J. Neurosci. 2017;45:423–432. doi: 10.1111/ejn.13484. [DOI] [PubMed] [Google Scholar]
- 75.Lorenzi E., Mayer U., Rosa-Salva O., Vallortigara G. Dynamic features of animate motion activate septal and preoptic areas in visually naïve chicks (Gallus gallus) Neuroscience. 2017;354:54–68. doi: 10.1016/j.neuroscience.2017.04.022. [DOI] [PubMed] [Google Scholar]
- 76.Mayer U., Rosa-Salva O., Loveland J.L., Vallortigara G. Selective response of the nucleus taeniae of the amygdala to a naturalistic social stimulus in visually naive domestic chicks. Sci. Rep. 2019;9:9849. doi: 10.1038/s41598-019-46322-5. [DOI] [PMC free article] [PubMed] [Google Scholar]
- 77.Hwang J., Mitz A.R., Murray E.A. NIMH MonkeyLogic: behavioral control and data acquisition in MATLAB. J. Neurosci. Methods. 2019;323:13–21. doi: 10.1016/j.jneumeth.2019.05.002. [DOI] [PMC free article] [PubMed] [Google Scholar]
- 78.Danelljan M., Bhat G., Khan F.S., Felsberg M. CVPR. 2016. ECO: efficient convolution operators for tracking. [Google Scholar]
- 79.Bhat G., Danelljan M., Gool L.V., Timofte R. Learning discriminative model prediction for tracking. arXiv. 2019 doi: 10.48550/arXiv.1904.07220. Preprint at. [DOI] [Google Scholar]
- 80.Pernet C.R., Wilcox R., Rousselet G.A. Robust correlation analyses: false positive and power validation using a new open source matlab toolbox. Front. Psychol. 2012;3:606. doi: 10.3389/fpsyg.2012.00606. [DOI] [PMC free article] [PubMed] [Google Scholar]
- 81.Vlachos M., Gunopulos D., Das G. Association for Computing Machinery; 2004. Rotation Invariant Distance Measures for Trajectories; pp. 707–712. [DOI] [Google Scholar]
- 82.Wilcox R.R. Academic Press; 2012. Introduction to Robust Estimation and Hypothesis Testing. [Google Scholar]
- 83.Dormann C.F., Elith J., Bacher S., Buchmann C., Carl G., Carré G., Marquéz J.R.G., Gruber B., Lafourcade B., Leitão P.J., et al. Collinearity: a review of methods to deal with it and a simulation study evaluating their performance. Ecography. 2013;36:27–46. doi: 10.1111/j.1600-0587.2012.07348.x. [DOI] [Google Scholar]
Associated Data
This section collects any data citations, data availability statements, or supplementary materials included in this article.
Supplementary Materials
Data Availability Statement
-
•
Data including trajectories and human behavior experiments have been deposited at Mendely Data and are publicly available as of the date of publication. DOIs are listed in the key resources table.
-
•
All original code has been deposited at Mendely Data and is publicly available as of the date of publication. DOIs are listed in the key resources table.
-
•
Any additional information required to reanalyze the data reported in this work is available from the lead contact upon reasonable request.