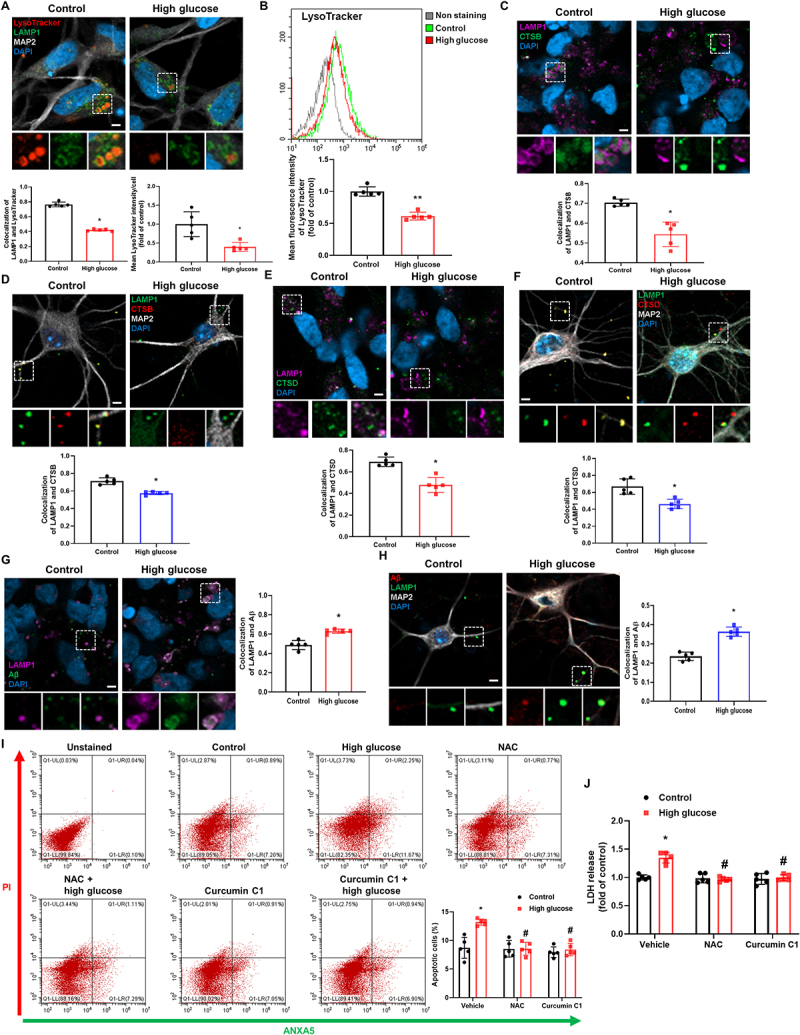
Figure 1.

High glucose induces lysosomal dysfunction resulting in Aβ accumulation and neuronal cell death. (A-C, and E) iPSC-NDs were exposed to high glucose (HG; 25 mM) for 24 h. (D and F) Hippocampal neurons were exposed to HG for 24 h at DIV 21. (A) Immunofluorescence staining of LAMP1, MAP2, and LysoTracker were visualized. DAPI was used to stain nuclei. (B) The mean fluorescence intensities of LysoTracker were measured by flow cytometric analysis. (C and D) Double immunofluorescence staining of LAMP1 and CTSB were analyzed in iPSC-NDs and hippocampal neurons. (E and F) iPSC-NDs and hippocampal neurons were immunostained with LAMP1 and CTSD. (G and H) iPSC-NDs and hippocampal neurons at DIV 21 were exposed to HG for 48 h. Immunofluorescence staining of LAMP1 and Aβ were visualized. (I and J) iPSC-NDs were pretreated with NAC (2 mM) or curcumin C1 (1 μM) for 30 min prior to high glucose (25 mM) exposure for 72 h. (I) The percentage of apoptotic cells (ANXA5 and PI positive) were measured by flow cytometric analysis. (J) LDH from cell supernatant were measured with LDH assay kit. n = 5. Scale bars: 8 μm. All data are representative. Quantitative data are represented as mean ± SD. *P < 0.05; **P < 0.01 versus control; #P <0.05 versus HG.
