

Abstract
Background
Anaemia affects approximately 1.8 billion people worldwide; over 60% of anaemia cases globally are due to iron deficiency (ID). Iron deficiency and anaemia contribute to the global burden of disease and affect physical and cognitive development in children, and work productivity and economic well‐being in adults. Fortification of food with iron, alone or in combination with other nutrients, is an effective intervention to control ID. Condiments and seasonings are ideal food vehicles for iron fortification in countries where they are commonly used.
Objectives
To determine the effects and safety of condiment and seasoning fortification with iron alone or iron plus other micronutrients on iron deficiency, anaemia, and health‐related outcomes in the general population.
Search methods
We searched CENTRAL, MEDLINE, Embase, CINAHL, and other databases up to 24 January 2023. We also searched the International clinical trials registry platform (ICTRP) for any ongoing trials.
Selection criteria
We included randomised controlled trials (RCTs) (randomisation at individual or cluster level), non‐randomised controlled trials, interrupted time series with at least three measure points both before and after intervention, and controlled before‐after studies. Participants were populations of any age (including pregnant women), from any country, excluding those with critical illness or severe co‐morbidities. We included interventions in which condiments or seasonings have been fortified with any combination of iron and other vitamins and minerals, irrespective of the fortification technology used.
Data collection and analysis
Two review authors independently screened and assessed the eligibility of studies. Disagreements were resolved through discussion or input from a third review author. Two review authors extracted the data and assessed the risk of bias in all the included studies. We followed the methods laid out by Cochrane and used GRADE criteria for assessing certainty of the evidence.
Main results
Our search identified 15,902 records after removal of duplicates. We included 16 studies with 20,512 participants (18,410 participants after adjusting for clustering effects). They were all carried out in upper‐middle‐ and lower‐middle‐income countries. Three studies were controlled before‐after studies, one was non‐randomised trial, and 12 were RCTs (including three cluster RCTs). Six studies took place in schools; seven in communities; and one each in a nursery/kindergarten, tea estate, and factory. Three studies involved only women, one study involved both women and their children, and all other studies focused on children and/or adolescents. Nine studies used salt as a vehicle for iron fortification, three used fish sauce, two used soy sauce, one used curry powder, and one a "seasoning powder". The dose of iron received by participants ranged from 4.4 mg to 55 mg/day. The sample sizes in the trials ranged from 123 to 14,398, and study durations ranged from three months to two years.
Twelve RCTs contributed data for meta‐analysis. Six trials compared iron‐fortified condiments versus the unfortified condiment, and six trials provided data comparing iron fortification in combination with other micronutrients versus the same condiment with other micronutrients, but no added iron. In one trial, the fortificant contained micronutrients that may have affected the absorption of iron. Overall no studies were assessed as having a low risk of bias. All included studies were assessed to have a high overall risk of bias, with the most concerns being around allocation concealment, blinding, and random sequence generation. There was very high heterogeneity amongst studies in almost all examined outcomes.
Condiments/seasonings fortified with iron versus unfortified condiments/seasonings
We are uncertain about whether consuming condiments/seasonings fortified with iron in comparison to the same unfortified condiment reduces anaemia at the end of intervention (risk ratio (RR) 0.34, 95% confidence interval (CI) 0.18 to 0.65; 2328 participants; 4 studies; very low‐certainty of evidence). We are uncertain about whether consuming iron‐fortified condiments increases haemoglobin concentrations (mean difference (MD) 6.40 (g/L), 95% CI ‐0.62 to 13.41; 2808 participants; 5 studies; very low‐certainty evidence). Fortification of condiments/seasonings with iron probably slightly reduces ID (RR 0.33, 95% CI 0.11 to 1.01; 391 participants; 2 studies; moderate‐certainty evidence). We are uncertain about whether fortification with iron increases ferritin concentration (MD 14.81 (µg/L), 95% CI 5.14 to 24.48; 4459 participants; 6 studies; very low‐certainty evidence).
Condiments/seasonings fortified with iron plus other micronutrients versus condiments/seasonings fortified with other micronutrients except iron
Consuming condiments/seasonings fortified with iron plus other micronutrients may reduce anaemia (RR 0.59, 95% CI 0.40 to 0.89; 1007 participants; 4 studies; low‐certainty evidence). We are uncertain about whether fortification of condiments/seasonings with iron plus other micronutrients will improve haemoglobin concentration (MD 6.22 g/dL, 95% CI 1.60 to 10.83; 1270 participants; 5 studies; very low‐certainty evidence). It may reduce ID (RR 0.36, 95% CI 0.19 to 0.69; 1154 participants; 4 studies; low‐certainty evidence). We are uncertain about whether fortification with iron plus other micronutrients improves ferritin concentration (MD 10.63 µg/L, 95% CI 2.40 to 18.85; 1251 participants; 5 studies; very low ‐certainty evidence).
Condiments/seasonings fortified with iron versus no intervention
No trial reported data on this comparison.
No studies reported adverse effects. Funding sources do not appear to have distorted the results in any of the assessed trials.
Authors' conclusions
We are uncertain whether consuming iron‐fortified condiments/seasonings reduces anaemia, improves haemoglobin concentration, or improves ferritin concentration. It may reduce ID. Findings about ferritin should be interpreted with caution since its concentrations increase during inflammation. Consuming condiments/seasonings fortified with iron plus other micronutrients may reduce anaemia, and we are uncertain whether this will improve haemoglobin concentration or ferritin concentration. More studies are needed to determine the true effect of iron‐fortified condiments/seasonings on preventing anaemia and improving health. The effects of this intervention on other health outcomes like malaria incidence, growth and development are unclear.
Keywords: Humans, Anemia, Anemia/prevention & control, Condiments, Ferritins, Hemoglobins, Iron, Iron Deficiencies, Powders
Plain language summary
Adding iron to condiments and seasonings for preventing anaemia and improving health
Key messages
‐ Adding iron to condiments/seasonings may slightly improve iron status and reduce iron deficiency. When iron is added along with other micronutrients, it may reduce anaemia. Unwanted effects were not reported.
‐ There was a lot of variation between the studies included in this review, making it more difficult to draw definitive conclusions. The effects of fortifying condiments and seasonings with iron should continue to be examined in populations consuming them through well‐designed studies.
What is anaemia?
Iron deficiency is one of the most common nutritional deficiencies throughout the world and contributes significantly to the global burden of disease. Multiple factors cause anaemia, including insufficient iron intake (the most common cause of anaemia), and it affects approximately 1.8 billion people worldwide. In general, low‐income countries have more anaemia than higher‐income countries. Iron deficiency and anaemia have several lifetime consequences that can affect physical and cognitive development in children, and work productivity and economic well‐being in adults. Fortifying condiments or seasonings with iron may be a useful and cost‐effective approach to help reduce iron deficiency. To date, there has been no systematic assessment of the safety and effectiveness of this intervention to inform policymaking.
What did we want to find out?
If fortifying condiments and seasonings with iron alone or iron plus other micronutrients improves measures of iron nutrition in the general population, in particular:
‐ anaemia;
‐ haemoglobin concentration;
‐ iron deficiency;
‐ iron status (including ferritin, transferrin saturation, and more).
We also wanted to find out if consuming iron‐fortified condiments/seasonings was associated with any unwanted effects.
What did we do? We searched for studies that provided iron‐fortified condiments/seasonings to one group, and condiments/seasonings not fortified with iron to another. We compared and summarised the results of the studies and rated our confidence in the evidence, based on study characteristics.
What did we find?
We identified 16 studies that involved 18,410 participants in middle‐income countries, most within schools or communities, with study durations ranging from three months to two years. The type of iron‐fortified condiments/seasonings used included salt, fish sauce, soy sauce, and seasoning powders. The dose of iron received by participants ranged from 4.4mg to 55 mg/day.
Compared to unfortified condiments/seasonings, those which are iron‐fortified likely improve iron deficiency slightly. We are uncertain whether they reduce anaemia, improve haemoglobin, or other measures of iron status. Condiments/seasonings fortified with iron plus other micronutrients may reduce anaemia; we are uncertain about whether they improve haemoglobin or ferritin concentrations. They may improve iron deficiency and total iron binding capacity. No studies reported adverse effects. More studies are needed to determine the effect of iron‐fortified condiments/seasonings on health such as malaria incidence, growth and development and any potential adverse effects.
What are the limitations of the evidence?
Our confidence in the evidence is very low to moderate; several factors reduced our confidence in the evidence. Firstly, we observed limitations in the way few studies were conducted with respect to the recruitment of people to assign interventions (this means that differences between the groups could be due to differences between people rather than between the treatments). Secondly, people in some studies may have been aware of which treatment they were getting. Also, not all the studies provided data about everything that were interested in, and results were inconsistent across the different studies. Finally, some studies were small. The results of future research could differ from the results of this review.
How up to date is this evidence?
The evidence is up‐to‐date to January 2023.
What this means
We judged the evidence in this review as very low to moderate certainty, which means we are not certain of the effect of condiments/seasonings with added iron on the reduction of anaemia and iron deficiency in people.
Summary of findings
Summary of findings 1. Condiments/seasonings fortified with iron versus unfortified condiments/seasonings for preventing anaemia and improving health.
| Condiments/seasonings fortified with iron versus unfortified condiments/seasonings for preventing anaemia and improving health | ||||||
|
Patient or population: population aged 2 years and above (Ballot 1989a (C) ‐ > 10 years, Chen 2005 (C) ‐ >3 years; Huo 2002 ‐ 11‐17 years, Longfils 2008‐ 6‐21 years, Thuy 2003a ‐17‐49 years; Thuy 2005 (C) ‐ 16‐49 years).
Settings: Cambodia (Longfils 2008), China (Chen 2005 (C); Huo 2002), South Africa (Ballot 1989a (C)) and Vietnam (Thuy 2003a; Thuy 2005 (C))
Intervention: condiments/seasonings fortified with iron. Condiment used were curry powder (Ballot 1989a (C)), soy sauce (Chen 2005 (C); Huo 2002) and fish sauce (Longfils 2008; Thuy 2003a; Thuy 2005 (C)). Comparison: unfortified condiments/seasonings | ||||||
| Outcomes | Illustrative comparative risks* (95% CI) | Relative effect (95% CI) | No of Participants (studies) | Certainty of the evidence (GRADE) | Comments | |
| Assumed risk | Corresponding risk | |||||
| Control | Condiments/seasonings fortified with iron versus unfortified condiments/seasonings | |||||
| Anaemia (defined as haemoglobin below WHO cut‐off for age and adjusted for altitude as appropriate) Follow‐up: mean 11 months | Study population | RR 0.34 (0.18 to 0.65) | 2328 (4 RCTs) | ⊕⊝⊝⊝ very low1,2,3 | Included studies: Chen 2005 (C); Huo 2002; Thuy 2003a; Thuy 2005 (C). Data for Chen 2005 (C); Thuy 2005 (C) are adjusted for clustering effect. | |
| 382 per 1000 | 130 per 1000 (69 to 248) | |||||
| Haemoglobin concentration (g/L) Follow‐up: mean 14 months | The mean haemoglobin concentration (g/l) in the intervention groups was 6.40 higher (0.62 lower to 13.41 higher) | 2808 (5 RCTs) | ⊕⊝⊝⊝ very low2,4,5 | Included studies: Ballot 1989a (C); Chen 2005 (C); Huo 2002; Longfils 2008; Thuy 2005 (C). Data for Chen 2005 (C); Thuy 2005 (C) are adjusted for clustering effect. | ||
| Iron deficiency (as defined by the trialists based on a biomarker of iron status) Follow‐up: mean 12 months | Study population | RR 0.33 (0.11 to 1.01) | 391 (2 RCTs) | ⊕⊕⊕⊝ moderate6,7 | Included studies: Thuy 2003a; Thuy 2005 (C). Data for Thuy 2005 (C) are adjusted for clustering effect. | |
| 365 per 1000 | 120 per 1000 (40 to 361) | |||||
| Ferritin concentration (µg/L) Follow‐up: mean 12 months | The mean ferritin (µg/l) in all age groups in the intervention groups was 14.81 higher (5.14 to 24.48 higher) | 4459 (6 RCTs) | ⊕⊝⊝⊝ very low2,8,9 | Included studies:Ballot 1989a (C); Chen 2005 (C); Huo 2002; Longfils 2008; Thuy 2003a; Thuy 2005 (C). Data for Ballot 1989a (C); Chen 2005 (C); Thuy 2005 (C) are adjusted for clustering effect. | ||
| Transferrin saturation Follow‐up: mean 3 months | The mean transferrin saturation (age groups combined) in the intervention groups was 20.54 lower (34.26 to 6.82 lower) | 240 (1 RCT) | ⊕⊕⊝⊝ low10,11 | Included study:Huo 2002 | ||
| Total iron binding capacity Follow‐up: mean 3 months | The mean total iron binding capacity (age grouping if data available) in the intervention groups was 0.01 higher (0.01 lower to 0.03 higher) | 240 (1 RCT) | ⊕⊕⊝⊝ low10,11 | Included study:Huo 2002 | ||
| Adverse effects | 0 (0) | No study reported on this outcome. | ||||
| *The basis for the assumed risk (e.g. the median control group risk across studies) is provided in footnotes. The corresponding risk (and its 95% confidence interval) is based on the assumed risk in the comparison group and the relative effect of the intervention (and its 95% CI). CI: Confidence interval; RR: Risk ratio; | ||||||
| GRADE Working Group grades of evidence High certainty: we are very confident that the true effect lies close to that of the estimate of the effect. Moderate certainty: we are moderately confident in the effect estimate; the true effect is likely to be close to the estimate of the effect, but there is a possibility that it is substantially different. Low certainty: our confidence in the effect estimate is limited; the true effect may be substantially different from the estimate of the effect. Very low certainty: we have very little confidence in the effect estimate; the true effect is likely to be substantially different from the estimate of effect. | ||||||
1 Downgraded one level for risk of bias due to limitations in the study design and execution. All four studies included for this outcome were at high overall risk of bias. 2 Downgraded one level for inconsistency due to the non‐overlapping confidence intervals across the studies. 3 Downgraded one level for indirectness. Out of four included studies, one was done among children, one among a population above 3 years, one among female factory workers, and one among women of childbearing age. Also, different condiments/seasonings were used in these studies. 4 Downgraded one level for risk of bias. All the five included trials were at a high overall risk of bias. 5 Downgraded one level for indirectness. Out of the five trials, one was carried out among the population above 10 years, one among those aged 3 years and above, one among adolescents aged 11 to 17 years, another 6‐21 years and one among women of childbearing age (16‐49 years). 6 Downgraded one level for risk of bias. Both the included studies had a high overall risk of bias. 7 Did not downgrade for indirectness. The included studies had females and similar age groups in their study population. 8 Downgraded one level for risk of bias. One study (Ballot 1989a (C)) had low risk in most of the domains. All other studies had a high or unclear risk of selection and performance bias. 9 Downgraded one level for indirectness. Two studies were conducted on women of childbearing age. Two studies were done on children and two were on the general population. 10 Downgraded one level for risk of bias. The included study had high or unclear risk of bias for selection and performance bias. 11 Downgraded one level for indirectness. The included study was carried out among children and adolescents. Hence the same may not be able to apply to the general population.
Summary of findings 2. Condiments/seasonings fortified with iron plus other micronutrients versus condiments/seasonings fortified with other micronutrients except iron for preventing anaemia and improving health.
| Condiments/seasonings fortified with iron plus other micronutrients versus condiments/seasonings fortified with other micronutrients except iron for preventing anaemia and improving health | ||||||
| Patient or population: population aged 2 years and above (Andersson 2008 ‐ 5‐18 years, Asibey‐Berko 2007 ~ 3 years, Chen Ke 2008 ‐ 2‐6 years, Haas 2014 ‐ women from 18 to 55 years, Zimmermann 2002 and Zimmermann 2004a ‐ 6‐15 years) Settings: China (Chen Ke 2008), Ghana (Asibey‐Berko 2007), India (Andersson 2008; Haas 2014) and Morocco (Zimmermann 2002; Zimmermann 2004a) Intervention: Condiments/seasonings fortified with iron plus other micronutrients versus condiments/seasonings fortified with other micronutrients except iron. The condiments used were salt (Andersson 2008; Asibey‐Berko 2007; Haas 2014; Zimmermann 2002; Zimmermann 2004a) and seasoning powder (Chen Ke 2008). | ||||||
| Outcomes | Illustrative comparative risks* (95% CI) | Relative effect (95% CI) | No of Participants (studies) | Certainty of the evidence (GRADE) | Comments | |
| Assumed risk | Corresponding risk | |||||
| Control | Condiments/seasonings fortified with iron plus other micronutrients versus condiments/seasonings fortified with other micronutrients except iron | |||||
| Anaemia (defined as haemoglobin below WHO cut‐off for age and adjusted for altitude as appropriate) Follow‐up: mean 4 months | Study population | RR 0.59 (0.4 to 0.89) | 1007 (4 RCTs) | ⊕⊕⊝⊝ low1,2, | Included studies:Andersson 2008; Asibey‐Berko 2007; Haas 2014; Zimmermann 2004a | |
| 398 per 1000 | 235 per 1000 (159 to 354) | |||||
| Haemoglobin concentration (g/L) Follow‐up: mean 9 months | The mean hb concentration (g/l) in all age groups in the intervention groups was 6.22 higher (1.6 to 10.83 higher) | 1270 (5 RCTs) | ⊕⊝⊝⊝ very low1,3,4, | Included studies: Andersson 2008; Chen Ke 2008; Haas 2014; Zimmermann 2002; Zimmermann 2004a | ||
| Iron deficiency (as defined by the trialists based on a biomarker of iron status) Follow‐up: mean 10 months | Study population | RR 0.36 (0.19 to 0.69) | 1154 (4 RCTs) | ⊕⊕⊝⊝ low1,4 | Included studies: Andersson 2008; Haas 2014; Zimmermann 2002; Zimmermann 2004a | |
| 348 per 1000 | 125 per 1000 (66 to 240) | |||||
| Ferritin (µg/L) concentration Follow‐up: mean 9 months | The mean ferritin (µg/l) in all age groups in the intervention groups was 10.63 higher (2.4 to 18.85 higher) | 1251 (5 RCTs) | ⊕⊝⊝⊝ very low1,3, 4 | Included studies:Andersson 2008; Chen Ke 2008; Haas 2014; Zimmermann 2002; Zimmermann 2004a | ||
| Transferrin saturation | 0 (0) | No study reported on this outcome. | ||||
| Total iron binding capacity | The mean total iron binding capacity (age grouping if data available) in the intervention groups was 3.74 higher (2.94 to 4.54 higher) | 158 (1 RCT) | ⊕⊕⊝⊝ low5, 6 | Included study:Zimmermann 2004a | ||
| Adverse effects | 0 (0) | No study reported on this outcome. | ||||
| *The basis for the assumed risk (e.g. the median control group risk across studies) is provided in footnotes. The corresponding risk (and its 95% confidence interval) is based on the assumed risk in the comparison group and the relative effect of the intervention (and its 95% CI). CI: Confidence interval; RR: Risk ratio; | ||||||
|
GRADE Working Group grades of evidence High certainty: we are very confident that the true effect lies close to that of the estimate of the effect. Moderate certainty: we are moderately confident in the effect estimate; the true effect is likely to be close to the estimate of the effect, but there is a possibility that it is substantially different. Low certainty: our confidence in the effect estimate is limited; the true effect may be substantially different from the estimate of the effect. Very low certainty: we have very little confidence in the effect estimate; the true effect is likely to be substantially different from the estimate of effect. | ||||||
1 Downgraded one level for risk of bias. Among the included studies, all had a high overall risk of bias. 2 Downgraded one level for indirectness. Among the four included studies, two were conducted among children, one among women aged 18‐55 years and one study included mother‐child dyad. Also, there were different condiments/seasonings used in these studies. 3 Downgraded one level for inconsistency. Two trials (Zimmermann 2002 and Zimmermann 2004a) had higher reported effect estimates as compared to other included studies 4 Downgraded one level for indirectness. One study was conducted among women tea estate workers and the rest were among children. Because of the mixed population, the findings may not be generalized to the entire population. 5 Downgraded one level for risk of bias. The included study (Zimmermann 2004a) had a high overall risk of bias. 6 Downgraded one level for imprecision for fewer observations and participants than the optimal information size (OIS) of 400.
Background
Description of the condition
Vitamin and mineral deficiencies are prevalent throughout the world and contribute significantly to the global burden of disease (WHO 2009). Iron, vitamin A, and iodine deficiencies affect billions worldwide, with iron deficiency and anaemia being the most prevalent, affecting more than 30% and 15% of global population, respectively (Bailey 2015; WHO 2008; The Micronutrient Initiative 2009). As of 2019, about 1.8 billion people lived with anaemia and iron deficiency remains the leading cause of anaemia in all regions (Safiri 2021). Iron is present in a wide variety of plant‐ and animal‐based foods, but iron in plant‐based diets ‐ common in low‐ and middle‐income countries ‐ is often less well‐absorbed, hindered by dietary compounds such as phytates, tannins or phenols that are present in the same foods. Conversely, meat and meat by‐products are the best sources of bioavailable iron, but they may be inaccessible, culturally inappropriate, or unaffordable to many people.
Anaemia is a multifactorial condition. It is estimated by Safiri 2021 that about 66.1% and 56.8% of cases among males and females, respectively, are caused by dietary iron deficiency (known as iron deficiency anaemia ‐ IDA), although other estimates are lower (Petry 2016; WHO 2014) and vary across regions, age, sex, and the presence of other causes of anaemia. Other causes of anaemia include infectious diseases such as malaria, tuberculosis, HIV and parasitic infections; inherited disorders of haemoglobin structure; or other nutritional deficiencies such as that of folate, vitamin B12 and vitamin A (WHO 2022a). Those with IDA may have inadequate iron intake, inadequate iron absorption or transport within the body, and/or losses of iron associated with disease or life stage (Clark, 2008). In settings with excess burden of other diseases such as HIV, malaria, or hookworm infestations, the chances of anaemia occurrence and complications are increased.
Anaemia affects people in low‐, middle‐, and high‐income countries, causing significant disruption to health as well as social and economic development (WHO 2015), but there is an inverse association between income and iron deficiency and anaemia status and in general, low‐income countries have higher prevalences of anaemia (WHO 2008; Fall 2009). Currently, approximately 840 million women and children worldwide are anaemic, particularly in South‐East Asia, and African regions (Stevens 2022). In 2019 in the WHO regions of Africa and South East Asia the prevalence of anaemia in children aged 6 to 59 months was 60.2% and 49%, respectively, and 45.8% and 47.8% in pregnant women, respectively. In contrast, in Europe 20.3% of children 6 to 59 months and 23.5% of pregnant women have anaemia (WHO 2022a). This association between income and anaemia is also evident in high‐income countries where people of low socioeconomic status are especially susceptible to iron and other vitamin and mineral deficiencies (Allen 2009; Cole 2010).
Iron deficiency and anaemia have several consequences throughout the life cycle that can impair physical and cognitive development in children, school performance, and work productivity, affecting social and economic well‐being for individuals and families (WHO 2022a). The most vulnerable populations are children and women of reproductive age, particularly during pregnancy. Adverse effects of anaemia during pregnancy include increased perinatal mortality, low birth weight, impaired cognitive performance and poorer educational achievement (Chaparro 2019; Young 2018). During the first year of life, iron deficiency can result in permanent damage to an infant's central nervous system (Beard 2008); it affects growth, neurodevelopment and cognitive performance (Carter 2010; Lozoff 2006), and may increase susceptibility to infections (Oppenheimer 2001). In adults, iron deficiency and anaemia cause loss of healthy and productive lives due to their effects on work and physical capacity (Haas 2001). Pregnant women with iron deficiency are at higher risk of suboptimal pregnancy outcomes, including complications at delivery, perinatal mortality, low birth weight and preterm birth (INACG 2002; WHO 2009). Postpartum iron deficiency is also associated with fatigue and general malaise which may impair infant development by negatively affecting a healthy mother‐child interaction (Armony‐Sivan 2010; Murray‐Kolb 2009).
Anaemia and iron deficiency can only be diagnosed by laboratory tests. Anaemia is assessed by measuring haemoglobin concentration and is usually interpreted according to age, sex, pregnancy status, altitude and, if known, smoking status as these factors alter iron needs (WHO 2011a). Iron deficiency is assessed through several biochemical measurements including serum ferritin, serum iron, transferrin saturation, soluble transferrin receptor (sTfR), and erythrocyte protoporphyrin. Ferritin is the most used indicator to assess iron status and depletion, and there is a close relationship between the total amount of stored iron and the serum ferritin concentration in normal individuals, although this indicator is affected by inflammation (WHO 2011b). Assessing anaemia by measuring the haemoglobin concentration is a relatively inexpensive and feasible test, even in resource‐poor settings (WHO 2007). Global health actors have recognised addressing anaemia as a priority, and one of the global nutrition targets for 2025 is to reduce anaemia by 50% in women of reproductive age (WHO 2014).
Description of the intervention
Various strategies are employed to prevent and treat iron deficiency and anaemia in different populations. These include dietary diversification to improve iron intake and bioavailability; selective plant breeding or genetic engineering to increase the iron content or to reduce absorption inhibitors in dietary staple crops; oral iron supplementation with pharmacological doses; and fortification of industrially manufactured foods with iron (Hurrell 2010). Maintaining a varied diet that includes foods rich in bioavailable iron ‐ such as animal sources ‐ is often costly and difficult to obtain in resource‐poor settings, and may not be acceptable in vegetarian populations. Oral supplementation is probably the most used strategy, as it often improves micronutrient status quickly by providing the nutrient directly, in tablet, powder, or liquid form. However, despite potential effectiveness, such programmes face prevalent implementation challenges and may not be sustainable.
Fortification is the addition of micronutrients to foods during processing. Targeted fortification is often voluntary and means that the fortified food is commonly consumed by specific subpopulations, such as complementary foods for children (WHO/UNICEF 2003), or supplementary food for people living in emergency settings (WFP 2006). Market‐driven fortification is a type of voluntary fortification in which food manufacturers decide to fortify their product (e.g. breakfast cereals and infant formulas) for business reasons, while mass fortification involves fortifying staple foods that are consumed by the entire general population, such as corn and wheat flours, milk, salt, sugar and oils, and it often becomes mandated by a government (Allen 2006; Hurrell 2010). Among them, wheat and corn flours are some of the most frequently fortified staples, and more than 85 countries have mandatory fortification standards for iron in various vehicles such as flour, although other nutrients such as B vitamins or zinc might be also added (Global Fortification Data Exchange 2022).
Iron fortification aims to improve the nutritional status of populations at risk of iron deficiency and anaemia without causing harm to other age groups such as men and postmenopausal women, who may consume more iron than they actually require. Due to its relatively low cost and potential for wide distribution, it has been identified as one of the most cost‐effective of all health interventions (Hoddinott 2013; World Bank 1993). The use of fortified foods does not require changes in dietary patterns or individual decisions for adherence (Darnton‐Hill 2002) as people are consuming the same basic foods and condiments. However, it is possible that fortified foods do not reach the poorest segments of the general population, who are at the greatest risk of vitamin and mineral deficiencies, because of low purchasing power, underdeveloped product distribution channels, or because they produce their own food grown at home.
The World Health Organization (WHO) recommends the addition of vitamins and minerals including iron to wheat and maize flours, corn meal, and rice (WHO 2022b). Iron fortification of food has already proven to be effective in improving iron status and haemoglobin, thus significantly reducing anaemia in populations (Gera 2012). The most‐fortified food vehicles with iron are, in order: wheat flour, maize flour, and rice. India fortifies salt with iron as well (Global Fortification Data Exchange 2018). Iron fortification of condiments and seasonings, however, is a relatively new public health strategy (Zamora 2016), so generation of evidence now can help inform effective interventions and policies for helping ensure access to adequate iron in the diets of those vulnerable to deficiency.
How the intervention might work
The selection of the food for a fortification programme requires consideration of both dietary habits of the target population and the cost of the intervention. Condiments are, broadly, a variety of edible substances that are added in small amounts to other foods in order to enhance, intensify, or alter the flavour (Smith 2007). Seasoning refers to the process of adding salt, herbs, or spices to food primarily for the flavour that it imparts (Merriam‐Webster 2011). In some situations, fortification of condiments or seasonings (e.g. soy and fish sauces, or curry powder) may be a useful alternative if they are consumed consistently by most of the population, as is the case in many Asian and African countries. Fortification of condiments and seasonings, which are more specific to certain regions or ethnic groups, may also help target subpopulations that have different unmet dietary needs or risks, such as displaced people or those in emergency settings (Lamparelli 1987; Ballot 1989; Hess 2016).
Fortification of condiments and seasonings is a relatively new strategy that may have several benefits, including feasibility, cost‐effectiveness, sensory acceptability, targeting of subpopulations, and frequent and consistent use (Allen 2006; Das 2019). Its effect on subpopulations that are likely to consume in excess is, however, unknown. People in less advantaged groups tend to have little variety in their diet and a small number of foods account for most of the calories per day. In these cases, condiments and seasonings help overcome monotony in the diet and become staples, possibly reaching some people that cannot afford other fortified foods (Garcia‐Casal 2016a). In China, for example, soy sauce is almost ubiquitous; in 1999 it was estimated that 80% of the population consumed an average of 12.6 mg of soy sauce per day (World Bank Institute and GAIN, 2008). In Singapore, the National Mental Health Survey of the Elderly reported that 46% of the population often eats curry (Ng 2006). Fortified condiments such as iodised salt are also used in preparation of processed foods (Garcia‐Casal 2016a), and 88% of the world population consumes iodised salt (Zimmerman 2021).
In addition to selecting a widely consumed food vehicle for iron fortification, it is necessary to overcome the inhibitory effect on iron absorption of components such as phytic acid, phenolic compounds or calcium, that may be part of the food vehicle or consumed as part of the overall diet. It is also important to select the most appropriate iron‐fortifying compound (Hurrell 2010). Iron compounds commonly used for fortification include salts such as ferrous sulphate, ferrous fumarate and protected (or chelated) compounds such as sodium iron EDTA (also known as NaFeEDTA or sodium iron ethylene diamine tetra acetate) or encapsulated ferrous sulphate (PAHO 2002). Careful selection of the type of iron compound for fortification is important due to differences in the bioavailability of iron or the way it may react with the fortified food, modifying its final sensory characteristics and consequently consumers' acceptance (Hurrell 1997; Benjamin‐Bovell 1999; Hurrell 2021).
The majority of condiment and seasoning iron‐fortification research has been conducted by adding NaFeEDTA to soy and fish sauces in Southeast Asian countries. This iron compound has been selected because of its high absorption rate (that compensates for the small quantities of food ingested), as well as the fact that it does not precipitate and has minimal impact on the appearance and taste of the food vehicle. Other sources of iron, such as ferrous fumarate, have been suggested as suitable fortificants because they are equally stable and less expensive to produce (Allen 2006; Watanapaisantrakul 2006). Preliminary studies with iron‐fortified soy and fish sauces show promising results in preventing anaemia in populations at risk, and this strategy may be feasible to implement on a large scale (Huo 2002; Thuy 2003a; Chen 2005; Longfils 2008).
Despite the biological plausibility of this intervention to help prevent and control anaemia in some settings, its success as a public health intervention will likely be determined by several factors related to policies and legislation regulations; production and supply of the fortified condiments; the development of delivery systems; the development and implementation of external and internal food quality control systems; and the development and implementation of strategies for information, education and communication for behaviour change among consumers. A generic logic model for micronutrient interventions that depicts the programme theory and plausible relationships between inputs and expected changes in outcomes is presented in Figure 1 (WHO/CDC 2016).
1.
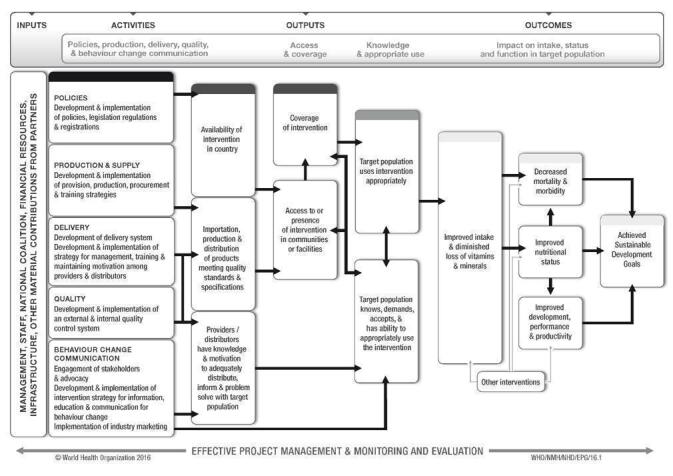
WHO/CDC logic model for micronutrient interventions in public health (with permission from WHO)
Why it is important to do this review
Iron deficiency and anaemia are important public health concerns worldwide. In regions where condiments are frequently consumed, countries are now considering their use as potential vehicles for improving micronutrient intake. As with all fortification programs, everyone in the population is exposed to increased levels of micronutrients in food, irrespective of whether or not they will benefit from fortification, and the risk of excessive intake and possible adverse effects should be monitored. Additionally, the provision of iron in malaria‐endemic areas has been a long‐standing controversy due to concerns that iron provision may exacerbate infections, in particular malaria, given that the parasite requires iron for growth (Oppenheimer 2001). However, evidence indicates that when supplementary iron is provided alongside strong malaria prevention or management programs, this is less of a concern (Neuberger 2016). And although the daily doses given through fortification are minimal and theoretically do not represent a risk for the population, this issue merits continued monitoring.
Condiments are an important part of daily cuisines worldwide, with sales growing steadily. The global market for spices and seasonings is estimated to reach a projected value of over $33 billion USD by 2030 (Research and Markets 2022). As an example, China consumes about five million metric tons of soy sauce per year (Garcia‐Casal 2016b). Although there are large differences in consumption patterns between and within countries, condiments or seasonings are a useful vehicle for fortification since they are consistently by most of the population in many Asian and African countries (Garcia‐Casal 2016a).
Some fortification of condiments and seasonings such as salt, soy sauce, and fish sauce is already happening at national or sub‐national levels in some countries (Bangladesh, Cambodia, China, India, Indonesia, Pakistan, the Philippines, Thailand, and Vietnam) (Zamora 2016). However, to date, there has been no systematic assessment of the safety and effectiveness of this intervention to inform policymaking. This systematic review complements the findings of other Cochrane systematic reviews exploring the effects of using iron to fortify wheat flour (Peña‐Rosas 2014; Field 2020), maize flour (Garcia‐Casal 2018), rice (Ashong 2012; Peña‐Rosas 2019) and salt (Baxter 2022) in public health programs.
Objectives
To determine the effects and safety of condiment and seasoning fortification with iron and micronutrients (vitamin A, zinc, folic acid, and others) on anaemia, iron status, and other health‐related outcomes in the general population.
Methods
Criteria for considering studies for this review
Types of studies
Fortification of condiments and seasonings is an intervention that aims to reach the entire population of a country, or large sections of the population, and is frequently delivered through the market system. We anticipated, therefore, that we would not be able to assess the benefits and risks of food fortification if we only included randomised trials; thus, in addition we examined data from other study designs.
In summary, we included the following study designs.
Randomised controlled trials (RCTs), with randomisation at either individual or cluster level.
-
Non‐randomised studies including:
non‐randomised controlled trials (nRCTs);
controlled before‐after studies (CBA) with a contemporaneous control group and with at least two intervention sites and two control sites;
interrupted time series studies (ITS) with at least three measure points both before and after intervention.
Although we have included both randomised and non‐randomised studies, we have not pooled results from randomised trials together with those from non‐randomised studies in the meta‐analysis. We did not include cross‐over trials. These study designs are not appropriate for fortification as an intervention, which can have a long‐lasting effect, potentially affecting subsequent periods of the trial (Higgins 2021).
Types of participants
Participants included the general population of all age groups (including pregnant women), from any country. We excluded studies of interventions targeted towards participants with a critical illness or severe co‐morbidities (for example, cancer, coronary artery disease, chronic kidney disease, any other illness requiring hospitalised care, etc). Whenever studies had a subset of eligible populations, if we were able to isolate the details of effects related to the population of interest, we included such studies.
Types of interventions
We included interventions in the review in which condiments or seasonings have been fortified with any combination of iron and other vitamins and minerals, irrespective of the fortification technology used, dose or duration of intervention. We included fortification of herbs, spices, seasonings and condiments (e.g. seasoning for instant noodles and bouillon cubes), sauces (soy sauce, fish sauce, Thai sauce), salt and its substitutes and any other substance intended to enhance the aroma and taste of food, including blends in powder or paste form (e.g. chilli seasoning, chilli paste, curry paste, curry roux and dry cures or rubs), onion salt, garlic salt, oriental seasoning mix (dashi), and topping to sprinkle on rice (furikake, dried seaweed flakes, sesame seeds and seasoning) (Codex 2011).
We included studies with co‐interventions (i.e. fortified condiment or seasoning with education), only if the comparison group also received the education component in addition to the unfortified condiment or seasoning.
Interventions were eligible for inclusion if the comparisons included the following.
1. Condiments or seasonings fortified with iron versus unfortified condiments or seasonings (see Effects of interventions, Comparison 1)
2. Condiments or seasonings fortified with iron plus other micronutrients versus condiments or seasonings fortified with other micronutrients except iron (see Effects of interventions, Comparison 2)
3. Condiments or seasonings fortified with iron versus no intervention (see Effects of interventions, Comparison 3).
We have not included comparisons of condiment or seasoning fortification versus other forms of micronutrient interventions (i.e. supplementation or dietary diversification).
We have not included fortification of sugar (which is classified as a sweetener), ketchup, mayonnaise, mustard or relishes, as these foodstuffs do not fulfil the definition of condiments provided in the Food Category System (Codex 2011). We excluded studies examining other types of interventions such as biofortification, home fortification with multiple micronutrient powders or supplementation, since these interventions are different from conventional fortification (i.e. addition of nutrients during processing of foods). There were no studies with mandatory intervention components (e.g. dose, frequency, or duration) which restricted study eligibility.
Types of outcome measures
We included studies that assessed any of the following primary or secondary outcomes.
Primary outcomes
Primary outcomes assessed by age groups are as specified below.
Anaemia (as defined by trialists, depending on the age and gender and adjusted for altitude and smoking as appropriate)
Haemoglobin concentration (g/L)
Iron deficiency (as defined by trialists, based on a biomarker of iron status; for example, ferritin less than 12 µg/L for preschool children and less than 15 µg/L for older populations)
Iron status (as reported: ferritin, transferrin saturation, soluble transferrin receptor, soluble transferrin receptor‐ferritin index, total iron binding capacity, serum iron)
Any adverse effects (including constipation, nausea and vomiting, heartburn and diarrhoea, as measured by trialists)
Secondary outcomes
Secondary outcomes of interest may differ by participant group and we have listed these accordingly.
Children (2 to 11.9 years of age)
Iron deficiency anaemia (as defined by trialists)
Cognitive development (as defined by trialists)
Motor skill development (as defined by trialists)
Growth: height‐for‐age Z scores
Growth: weight‐for‐height Z scores
Malaria severity (only for malaria settings)
Malaria incidence (only for malaria settings)
Adolescents (12 to 17.9 years of age)
Iron deficiency anaemia (as defined by trialists)
Malaria severity (only for malaria settings)
Malaria incidence (only for malaria settings)
Pregnant women
Iron deficiency anaemia (as defined by trialists)
Premature delivery (less than 37 weeks)
Very premature delivery (less than 34 weeks)
Low birth weight (less than 2500 g)
Any birth defects (neural tube defect, cleft lip, cleft palate, congenital cardiovascular defects and others as reported by trialists)
Malaria severity (only for malaria settings)
Malaria incidence (only for malaria settings)
Adults (male and females)
Iron deficiency anaemia (as defined by trialists)
Work capacity (as defined by trialists)
Risk of iron overload (ferritin more than 150 mg/L)
Malaria severity (only for malaria settings)
Malaria incidence (only for malaria settings)
All groups
If the reports presented combined data for all populations, we have also included them.
Search methods for identification of studies
We designed and piloted a structured search strategy. We carried out this search strategy in electronic databases and handsearched relevant journals and publications to identify relevant primary studies and, where necessary, we contacted authors for unpublished/ongoing studies. We consulted institutions, agencies, and experts in the fields regarding the results of our search and for any additional data (Dealing with missing data). Appendix 1 provides the full search strategy for MEDLINE. We adapted the search strategy syntax and terms to fit other databases.
Electronic searches
We searched the following international and regional sources. The original search was conducted in October 2014, with updated searches conducted in June 2017, December 2018, September 2020, October 2021 and January 2023.
International databases
Cochrane Central Register of Controlled Trials (CENTRAL) via Cochrane Register of Studies Online (CRSO) (searched 24 January 2023)
MEDLINE and MEDLINE in Progress (Ovid; till 24 January 2023)
EMBASE (OVID; 1947 to 24 January 2023)
CINAHL EBSCOhost (1982 to 24 January 2023)
Web of Science; Social Science Citation Index (SSCI) and Science Citation Index (SCI) (searched 24 January 2023)
POPLINE;(http://www.popline.org/; December 2018) ‐ Database no longer exists
AGRICOLA (http://search.nal.usda.gov/; 1970 to 24 January 2023)
BIOSIS (ISI; Previews to January 2023)
Food Science and Technology Abstracts (FSTA) 1969 to 2023 (searched 24 January 2023)
OpenGrey 1960 to present (searched 24 January 2023)
Trials Register of Promoting Health Interventions (TRoPHI) (searched 24 January 2023)
ClinicalTrials.gov (searched 24 January 2023)
The International Clinical Trials Registry Platform (ICTRP; apps.who.int/trialsearch; searched 24 January 2023), and we also contacted relevant organisations for the identification of ongoing and unpublished studies.
Regional databases
Índice Bibliográfico Español en Ciencias de la Salud (IBECS);ibecs.isciii.es; searched 24 January 2023
Scientific Electronic Library Online (SciELO); www.scielo.br; searched 24 January 2023
Global Index Medicus ‐ WHO African Region (AFRO) (includes African Index Medicus (AIM); www.globalhealthlibrary.net/php/index.php?lang=en); WHO Eastern Mediterranean Region (EMRO) (includes Index Medicus for the Eastern Mediterranean Region (IMEMR); www.globalhealthlibrary.net/php/index.php?lang=en); searched 24 January 2023
LILACS (Latin American and Caribbean Health Sciences Literature); lilacs.bvsalud.org/en; searched 24 January 2023
WHO Pan American Health Organization (PAHO) Library; www1.paho.org/english/DD/IKM/LI/library.htm; searched 24 January 2023
WHO Library and Information Networks for Knowledge online catalogue (WHOLIS (WHO Library); dosei.who.int/); searched 24 January 2023
WPRIM (Western Pacific Region Index Medicus; www.wprim.org/); searched 24 January 2023
Index Medicus for South‐East Asia Region (IMSEAR;imsear.hellis.org); searched 24 January 2023
IndMED, Indian medical journals; http://indmed.nic.in/imvw/; searched to 24 January 2023
Native Health Research Database; http://hsc.unm.edu/library/nhd (https://nativehealthdatabase.net); searched to 24 January 2023
For theses or dissertations, we searched WorldCat, Networked Digital Library of Theses and Dissertations, DART‐Europe E‐theses Portal, Australasian Digital Theses Program, Theses Canada Portal, and ProQuest‐Dissertations and Theses. The search used keywords and controlled vocabulary (when available), using the search terms in Appendix 1 and adapted them as appropriate for each database. We searched the International Clinical Trials Registry Platform (ICTRP) for any ongoing or planned trials, and contacted authors of such studies to obtain further information or eligible data if available.
We did not apply any language restrictions. As condiment fortification is a relatively recent development we limited the search from 1980 to present for all databases.
One article that we found was translated into English. We contacted authors to request articles and necessary data not available online.
Searching other resources
For assistance in identifying ongoing or unpublished studies, we contacted the Department of Nutrition for Health and Development and the regional offices of the World Health Organization (WHO) as well as the nutrition section of the Centers for Disease Control and Prevention (CDC), the United Nations Children's Fund (UNICEF), the World Food Programme (WFP), Nutrition International(NI), Global Alliance for Improved Nutrition (GAIN), Hellen Keller International and Flour Fortification Initiative (FFI).
Data collection and analysis
Selection of studies
We stored all the references identified by the search in Reference Manager software to prepare for importing them into Review Manager software (Review Manager 2020). Two review authors (VP and PM) independently screened the titles and abstracts of articles retrieved by each search to assess eligibility, as determined by the inclusion and exclusion criteria listed above. For those studies that were selected as potentially eligible for inclusion, we retrieved full‐text copies, and all review authors were involved in assessing whether studies met the review's inclusion criteria; two review authors (CJ and LMDR) independently assessed each full‐text report. We have kept records of all eligibility decisions and have stored eligibility assessment forms (with brief details of study design, participants, and interventions, along with the final eligibility decision) with each study report.
For studies published only as abstracts, or if study reports contained little information on methods, participants, or interventions, we attempted to contact the authors to obtain further information. However, we did not receive any reply from the study authors. We resolved disagreements at any stage of the eligibility assessment process through discussion and consultation with a third review author (CJ) where necessary. We excluded studies that did not meet the eligibility criteria and documented the reasons for their exclusion in the Characteristics of excluded studies section.
Data extraction and management
Two review authors (CJ and PM) extracted data independently using data extraction forms based on those from the Cochrane Public Health Group (Cochrane PHG 2010) and the Cochrane Effective Practice and Organisation of Care (EPOC) Group (Cochrane EPOC Group 2017).
Review authors piloted the form using a subset of articles to enhance consistency amongst reviewers and based on this, modified the form as necessary. We collected information on study design, study setting, and participants (number and characteristics), and have provided a full description of the interventions examined. We extracted details of outcomes measured (including a description of how and when outcomes were measured), and results.
We designed the form so that we were able to record results for our prespecified outcomes and for other (non‐prespecified) outcomes (although such outcomes do not underpin any of our conclusions). We extracted additional items relating to study recruitment and the implementation of the intervention; these include the number of sites for an intervention, whether recruitment was similar in different places, whether there were protocol deviations, and levels of compliance/use of condiments in different sites within studies.
We used the PROGRESS‐Plus (place, race/ethnicity/culture/language, occupation, gender/sex, religion, education, socioeconomic status, social capital plus disability, age, and sexual orientation) checklist to record whether outcome data were reported by socio‐demographic characteristics known to be important from an equity perspective. We also recorded whether studies included specific strategies to address diversity or disadvantage.
One review author (CJ) entered data into Review Manager software (Review Manager 2020) and two review authors (VP and PM) carried out checks for accuracy. We resolved any discrepancies through discussion. When information regarding any aspect of study design or results was unclear, we attempted to contact the authors of the original reports asking them to provide further details.
Assessment of risk of bias in included studies
We used the EPOC risk of bias tool for studies with a separate control group to assess the risk of bias of all studies for primary outcomes. Hence, we used this tool for both randomised and non‐randomised studies with a control group. The tool includes five domains of bias: selection, performance, attrition, detection, and reporting, as well as an 'other' bias category to capture other potential threats to validity.
Two review authors independently assessed risk of bias for each study and resolved any disagreement by discussion or by involving an additional review team member.
Assessment of risk of bias in randomised trials
(1) Sequence generation (checking for possible selection bias)
We assessed studies as:
low risk of bias if there is a random component in the sequence generation process (any truly random process, e.g. random number table; computer random number generator);
high risk of bias if a non‐random approach has been used (any non‐random process, e.g. odd or even date of birth; hospital or clinic record number);
unclear.
(2) Allocation concealment (checking for possible selection bias)
We assessed studies as:
low risk of bias if participants and investigators enroling participants could not foresee assignment because an appropriate method was used to conceal allocation (e.g. telephone or central randomisation; consecutively numbered sealed opaque envelopes). This rating was given to studies where the unit of allocation was by institution and allocation was performed on all units at the start of the study;
high risk of bias if participants and investigators enroling participants could possibly foresee assignments and potentially introduce selection bias (e.g. open random allocation; unsealed or non‐opaque envelopes);
unclear.
(3) Similarity of baseline outcome measurements (checking for confounding, a potential consequence of selection bias)
We assessed studies as:
low risk of bias if outcomes were measured prior to the intervention, and no important differences were present across intervention groups;
high risk of bias if important differences in outcomes between groups were present prior to intervention and were not adjusted for in analysis;
unclear risk of bias if there was no baseline measure of outcome (note: if 'high' or 'unclear' but there was sufficient information to do an adjusted analysis, the assessment was 'low').
(4) Similarity of baseline characteristics (checking for confounding, a potential consequence of selection bias)
We assessed studies as:
low risk of bias if baseline characteristics are reported and similar across intervention groups;
high risk of bias if baseline characteristics are not reported or if there are differences across groups;
unclear risk of bias if it is not clear (e.g. characteristics mentioned in text but no data presented).
5) Incomplete outcome data (checking for possible attrition bias through withdrawals, dropouts and protocol deviations)
We assessed outcomes in each included study as:
low risk of bias due to incomplete outcome data (this could be either that there were no missing outcome data, or that the missing outcome data were unlikely to bias the results based on the following considerations: study authors provided transparent documentation of participant flow throughout the study; the proportion of missing data was similar in the intervention and control groups; the reasons for missing data were provided and balanced across intervention and control groups; the reasons for missing data were not likely to bias the results (e.g. moving house));
high risk of bias if missing outcome data were likely to bias the results. Studies also received this rating if an 'as‐treated (per protocol)' analysis was performed with substantial differences between the intervention received and that assigned at randomisation, or if potentially inappropriate methods for imputation have been used;
unclear risk of bias.
(6) Blinding (checking for possible performance and detection bias)
We assessed the risk of performance bias associated with blinding as:
low, high or unclear risk of bias for participants;
low, high or unclear risk of bias for personnel.
We assessed the risk of detection bias associated with blinding as:
low, high or unclear risk of bias for outcome assessors.
Whilst assessed separately, we combined the results into a single evaluation of risk of bias associated with blinding as:
low risk of bias if there was blinding of participants and key study personnel, and it was unlikely to have been broken, or the outcomes are objective; we also gave this rating to studies where either participants or key study personnel were not blinded, but outcome assessment was blinded and the non‐blinding of others was unlikely to introduce bias;
high risk of bias if there was no blinding or incomplete blinding, or if there was blinding that was likely to have been broken, and the outcome or outcome assessment was likely to be influenced by a lack of blinding;
unclear risk of bias.
(7) Contamination (checking for possible performance bias)
We assessed studies as:
low risk of bias if allocation was by community, institution, or practice, and it is unlikely that the control group received the intervention;
high risk of bias if it is likely that the control group received the intervention;
unclear risk of bias if it is possible that contamination occurred, but the risk of this happening is not clear.
(8) Selective reporting bias
We described for each included study how we investigated the possibility of selective outcome reporting bias and what we found. We assessed studies for this domain as:
low risk of bias (where it is clear that all the study’s pre‐specified outcomes and all expected outcomes of interest to the review have been reported);
high risk of bias (where not all the study’s pre‐specified outcomes have been reported; one or more reported primary outcomes were not pre‐specified; outcomes of interest were reported incompletely and so cannot be used; study fails to include results of a key outcome that would have been expected to have been reported); or
risk of bias unclear.
(9) Other sources of bias
We have described other possible sources of bias for each included study and given a rating of low, high, or unclear risk of bias for this item.
We used the EPOC 'Risk of bias' tool for any included ITS study designs which includes items (5), (6), (8), and (9) from the EPOC 'Risk of bias' tool above, as well as the following additional items:
-
Was the intervention independent of other changes?
Low risk of bias if there are compelling arguments that the intervention occurred independently of other changes over time and the outcome was not influenced by other confounding variables/historic events during the study period.
High risk of bias if it is reported or if there are grounds to suspect that the intervention was not independent of other changes over the time period of the study.
Unclear risk of bias.
-
Was the shape of the intervention effect pre‐specified?
Low risk of bias if the point of analysis is the point of intervention or a rational explanation for the shape of the intervention effect was provided.
HIgh risk of bias if it was clear that these conditions were not met.
Unclear risk of bias.
-
Was the intervention unlikely to affect data collection?
Low risk of bias if it is reported that the intervention itself was unlikely to affect data collection (e.g. sources and methods of data collection were the same before and after the intervention).
High risk of bias if the intervention itself was likely to affect data collection.
Unclear risk of bias.
In addition to the above criteria, we also assessed cluster‐RCTs with the following criteria and these changes made have been described in Differences between protocol and review section
(1) Recruitment bias
We assessed studies as:
low risk of bias if individuals were recruited to the study before the clusters were randomised;
high risk of bias if individuals were recruited to the study after the clusters were randomised;
unclear risk of bias.
(2) Baseline imbalance
We assessed studies as:
low risk of bias if baseline characteristics were reported and were similar across clusters or if study authors used stratified or pair‐matched randomisation of clusters;
high risk of bias if baseline characteristics were not reported or if there were differences across clusters;
unclear risk of bias.
(3) Loss of clusters
We assessed studies as:
low risk of bias if no complete clusters were lost or omitted from the analysis;
high risk of bias if complete clusters were lost or omitted from the analysis;
unclear risk of bias.
(4) Incorrect analysis
We assessed studies as:
low risk of bias if study authors appropriately accounted for clusters in the analysis or provided enough information for review authors to account for clusters in the meta‐analysis;
high risk of bias if study authors did not appropriately account for clusters in the analysis or did not provide enough information for review authors to account for clusters in the meta‐analysis;
unclear risk of bias.
(5) Compatibility with individual randomised controlled trials (RCTs)
We assessed studies as:
low risk of bias if the effects of the intervention were likely not altered by the unit of randomisation;
high risk of bias if the effects of the intervention were likely altered by the unit of randomisation;
unclear risk of bias.
Overall risk of bias
For all included studies, we summarised the overall risk of bias by primary outcome within each study. Studies at high risk of bias are those with high or unclear risk of bias in the following domains: allocation concealment, similarity of baseline outcome measurements, and completeness of outcome data. Judgements also take into account the likely magnitude and direction of bias and whether it is likely to impact the findings of the study. If there was insufficient information in study reports for us to be able to assess risk of bias, we graded it unclear.
Measures of treatment effect
Dichotomous data
For dichotomous data, we present proportions and, for two‐group comparisons, results as average risk ratio (RR) or odds ratio (OR) with 95% confidence intervals (CIs).
Continuous data
We report results for continuous outcomes as the mean difference (MD)with 95% CIs if outcomes are measured in the same way between trials. Where some studies have reported endpoint data and others have reported change from baseline data (with errors), we have combined these in the meta‐analysis if the outcomes have been reported using the same scale. We have used standardised mean difference (SMD) with 95% CIs to combine trials that measure the same outcome (e.g. haemoglobin) but use different methods.
For outcomes where not enough studies reported data so that results could not be pooled, we attempted to summarise results in a narrative form and by summarising effect estimates (McKenzie 2021).
Unit of analysis issues
Cluster‐randomised trials
We combined results from both cluster‐ and individually‐randomised studies if there was little heterogeneity between the studies. If the authors of cluster‐randomised trials (CRTs) have conducted their analyses at a different level to that of allocation and they have not appropriately accounted for the cluster design in their analyses, we calculated trials' effective sample size to account for the effect of clustering in data. We utilised the intra cluster correlation coefficient (ICC) derived from the trial (if available), or from another source (Gulliford 1999; Adams 2004) as recommended by Cochrane Handbook for Systematic Reviews of Interventions, based on the cluster size, adjusted for baseline characteristics, at 75th centile and then calculated the design effect with the formula provided in the Cochrane Handbook for Systematic Reviews of Interventions (Higgins 2019). We have undertaken sensitivity analysis to investigate the effect of variations in ICC (see Table 3).
1. Sensitivity analysis of the cluster RCTs with different ICCs.
| Outcome (all studies included in the analysis) | Study (ICC) | RR (95% CI) | Tau² | Chi² | P value | I² (%) |
| Anaemia ‐ Comparison 1 (Chen 2005 (C); Huo 2002; Thuy 2003a; Thuy 2005 (C)) (RR 0.34, 95% CI 0.18 to 0.65; 2328 participants; 4 studies; Tau² = 0.35; Chi² = 48.82, df = 3 (P < 0.00001); I² = 94%) |
Chen 2005 (C) (0) | 0.36 [0.21, 0.64] | 0.25 | 44.59 | P < 0.00001 | 93% |
|
Chen 2005 (C) (0.001) |
0.36 [0.21, 0.64] | 0.26 | 44.81 | P < 0.00001 | 93% | |
|
Chen 2005 (C) (0.002) |
0.36 [0.20, 0.64] | 0.26 | 45.07 | P < 0.00001 | 93% | |
| Chen 2005 (C) (0.005) | 0.36 [0.20, 0.64] | 0.28 | 45.77 | P < 0.00001 | 93% | |
| Chen 2005 (C) (0.01) | 0.35 [0.19, 0.64] | 0.30 | 46.85 | P < 0.00001 | 94% | |
| Chen 2005 (C) (0.02) | 0.34 [0.18, 0.65] | 0.35 | 48.82 | P < 0.00001 | 94% | |
| Chen 2005 (C) (0.1) | 0.30 [0.12, 0.74] | 0.73 | 57.77 | P < 0.00001 | 95% | |
| Thuy 2005 (C) (0) | 0.34 [0.18, 0.64] | 0.35 | 49.55 | P < 0.00001 | 94% | |
| Thuy 2005 (C) (0.001) | 0.34 [0.18, 0.65] | 0.34 | 49.23 | P < 0.00001 | 94% | |
| Thuy 2005 (C) (0.002) | 0.34 [0.18, 0.64] | 0.35 | 49.69 | P < 0.00001 | 94% | |
| Thuy 2005 (C) (0.005) | 0.34 [0.18, 0.64] | 0.35 | 49.44 | P < 0.00001 | 94% | |
| Thuy 2005 (C) (0.01) | 0.34 [0.18, 0.65] | 0.35 | 48.95 | P < 0.00001 | 94% | |
| Thuy 2005 (C) (0.02) | 0.34 [0.18, 0.65] | 0.35 | 48.82 | P < 0.00001 | 94% | |
| Thuy 2005 (C) (0.1) | 0.32 [0.16, 0.64] | 0.38 | 49.09 | P < 0.00001 | 94% | |
| Iron Deficiency ‐ Comparison 1 (Thuy 2003a; Thuy 2005 (C)) (RR 0.33, 95% CI 0.11 to 1.01; 391 participants; 2 studies, Tau² = 0.50; Chi² = 4.88, df = 1 (P = 0.03); I² = 80%) |
Thuy 2005 (C) (0) | 0.33 [0.12, 0.95] | 0.49 | 6.51 | 0.01 | 85% |
| Thuy 2005 (C) (0.001) | 0.34 [0.12, 0.93] | 0.46 | 6.17 | 0.01 | 84% | |
| Thuy 2005 (C) (0.002) | 0.34 [0.12, 0.92] | 0.44 | 5.89 | 0.02 | 83% | |
| Thuy 2005 (C) (0.005) | 0.33 [0.11, 0.96] | 0.49 | 6.00 | 0.01 | 83% | |
| Thuy 2005 (C) (0.01) | 0.33 [0.11, 0.99] | 0.54 | 5.82 | 0.02 | 83% | |
| Thuy 2005 (C) (0.02) | 0.33 [0.11, 1.01] | 0.50 | 4.88 | 0.03 | 80% | |
| Thuy 2005 (C) (0.10) | 0.37 [0.13, 1.06] | 0.37 | 2.28 | 0.13 | 56% | |
| Outcome (all studies included in the analysis) | Study (ICC) | Mean Difference (95% CI) | Tau² | Chi² | P value | I² (%) |
| Haemoglobin concentration ‐ Comparison 1 (Ballot 1989a (C); Chen 2005 (C); Huo 2002; Longfils 2008; Thuy 2005 (C)) (MD 6.40, 95% CI ‐0.62 to 13.41; 2808 participants; 5 studies; Tau² = 62.55; Chi² = 269.77, df = 4 (P < 0.00001); I² = 99%) |
Ballot 1989a (C) (0) | 6.39 [‐0.60, 13.39] | 62.19 | 270.82 | < 0.00001 | 99% |
| Ballot 1989a (C) (0.001) | 6.40 [‐0.60, 13.39] | 62.22 | 270.74 | < 0.00001 | 99% | |
| Ballot 1989a (C) (0.002) | 6.40 [‐0.60, 13.39] | 62.22 | 270.74 | < 0.00001 | 99% | |
| Ballot 1989a (C) (0.005) | 6.40 [‐0.60, 13.39] | 62.27 | 270.58 | < 0.00001 | 99% | |
| Ballot 1989a (C) (0.01) | 6.40 [‐0.61, 13.40] | 62.38 | 270.26 | < 0.00001 | 99% | |
| Ballot 1989a (C) (0.02) | 6.40 [‐0.62, 13.41] | 62.55 | 269.77 | < 0.00001 | 99% | |
| Ballot 1989a (C) (0.1) | 6.40 [‐0.68, 13.48] | 63.74 | 266.41 | < 0.00001 | 98% | |
| Chen 2005 (C) (0) | 6.40 [‐0.36, 13.15] | 57.96 | 288.54 | < 0.00001 | 99% | |
| Chen 2005 (C) (0.001) | 6.40 [‐0.38, 13.17] | 58.22 | 287.34 | < 0.00001 | 99% | |
| Chen 2005 (C) (0.002) | 6.40 [‐0.39, 13.18] | 58.47 | 286.17 | < 0.00001 | 99% | |
| Chen 2005 (C) (0.005) | 6.40 [‐0.43, 13.23] | 59.21 | 282.87 | < 0.00001 | 99% | |
| Chen 2005 (C) (0.01) | 6.40 [‐0.50, 13.29] | 60.39 | 277.93 | < 0.00001 | 99% | |
| Chen 2005 (C) (0.02) | 6.40 [‐0.62, 13.41] | 62.55 | 269.77 | < 0.00001 | 99% | |
| Chen 2005 (C) (0.1) | 6.40 [‐1.22, 14.01] | 73.90 | 239.64 | < 0.00001 | 98% | |
| Thuy 2005 (C) (0) | 6.39 [‐0.33, 13.12] | 57.51 | 273.42 | < 0.00001 | 99% | |
| Thuy 2005 (C) (0.001) | 6.39 [‐0.35, 13.14] | 57.84 | 273.16 | < 0.00001 | 99% | |
|
Thuy 2005 (C) (0.002) |
6.39 [‐0.37, 13.16] | 58.14 | 272.92 | < 0.00001 | 99% | |
| Thuy 2005 (C) (0.005) | 6.39 [‐0.42, 13.21] | 59.05 | 272.23 | < 0.00001 | 99% | |
| Thuy 2005 (C) (0.01) | 6.39 [‐0.50, 13.29] | 60.35 | 271.27 | < 0.00001 | 99% | |
| Thuy 2005 (C)(0.02) | 6.40 [‐0.62, 13.41] | 62.55 | 269.77 | < 0.00001 | 99% | |
| Thuy 2005 (C) (0.1) | 6.41 [‐1.05, 13.86] | 70.50 | 265.22 | < 0.00001 | 98% |
We extracted these parameters from the CRT articles: type of outcome (haemoglobin, anaemia, and iron deficiency (ID)); number of control and intervention participants as well as sample size; mean and standard deviation (SD) (for continuous variables) or number of events and prevalence (dichotomous variables); description of methods used and study design; description of the clusters including average cluster size (M). The following assumption was made: the ICC for the outcome 'anaemia' was taken as the ICC for the outcome 'haemoglobin' (in the absence of a specific haemoglobin ICC). Finally, we corrected all quantities affected by the effective sample size (number of control and intervention samples, sample size etc.) due to cluster‐randomisation by dividing the corresponding quantity by the design effect. The details of adjustments for the design effect related to each of the included CRTs are given in Characteristics of included studies.
The Chen 2005 (C) study used villages as clusters, but for the measurements, the trialists sampled the individuals through schools and reached the target population. They did not report the ICC and mean cluster size. We incorporated the mean cluster size from Gulliford 1999 for the variable "haemoglobin" and the ICC of 0.02 from Adams 2004, which was adjusted for baseline characteristics and 75th centile. We have provided the details of adjustments done for design effects related to each of included CRTs in Characteristics of included studies. We have described this difference to the protocol in Differences between protocol and review section.
Studies with more than two treatment groups
For studies with more than two intervention groups (multi‐arm studies), where possible we combined groups to create a single pair‐wise comparison or used the methods set out in the Cochrane Handbook to avoid double‐counting study participants (Higgins 2021a). For the subgroup analyses, when the control group is shared by two or more study arms, we divided the control group (events and total population) over the number of relevant subgroups to avoid double counting the participants.
Dealing with missing data
We tried to contact the authors if outcome data were missing, unclear, or not fully reported. We captured the missing data in the data extraction form and reported it in the risk of bias tables.
For all outcomes, we carried out analysis, as far as possible, on an intention‐to‐treat basis. For randomised trials, we attempted to include all participants randomised to each group in the analyses. The denominator for each outcome in each trial is the number randomised, minus any participants whose outcomes are known to be missing. For non‐randomised studies, where possible, we analysed data according to initial group allocation irrespective of whether participants received or complied with the planned intervention.
When assessing adverse events, adhering to the principle of "Intention‐to‐treat" may be misleading, we related the results to the treatment received ('per protocol' or 'as observed'). This means that for side effects, we based the analyses on the participants who actually received treatment and the number of adverse events that were reported in the studies.
Assessment of heterogeneity
We examined the forest plots from meta‐analyses to visually assess the level of heterogeneity (in terms of the size or direction of treatment effect) among studies. We used the I² and Tau2 statistics, and the Chi2 statistic to quantify the level of heterogeneity among the trials in each analysis. We defined considerable heterogeneity as T2 > 0 and either I2 > 30% (30% to 60% ‐ moderate and 50% to 90% ‐ substantial heterogeneity) or a low P value (< 0.10) in the Chi2 test (Higgins 2021). If we identified moderate or substantial heterogeneity, we explored it by pre‐specified subgroup effects analysis. Caution was taken in the interpretation of those results with high levels of unexplained heterogeneity.
Assessment of reporting biases
Where we suspected reporting bias (see 'Selective reporting bias' above), we attempted to contact study authors asking them to provide missing outcome data. Where this was not possible, and the missing data were thought to introduce serious bias, we explored the impact of including such studies in the overall assessment of results by a sensitivity analysis.
Insufficient studies contributed data for any particular outcome to allow us to examine possible publication bias; if in future updates, more than 10 studies report the same outcome, we will generate funnel plots in Review Manager 2020 and visually examine them for asymmetry. Where we have pooled studies in meta‐analysis we ordered studies in terms of weight so that a visual examination of forest plots may allow us to assess whether the results from smaller and larger studies are similar, or if there are any apparent differences (i.e. we checked that the effect size is similar in smaller and larger studies).
Data synthesis
We carried out a meta‐analysis to provide an overall estimate of treatment effect when more than one study examined the same intervention, provided that studies used similar methods, and measured the same outcome in similar ways in similar populations. We have not combined results from randomised and non‐randomised trials together in the meta‐analysis, nor have we presented pooled estimates for non‐randomised studies with different types of study designs. Where there was evidence on a particular outcome from both randomised trials and non‐randomised studies, we have used the evidence from randomised trials.
Where we identified evidence from randomised trials, we carried out statistical analysis using the Review Manager software (Review Manager 2020). We used a random‐effects meta‐analysis (Borenstein 2009) for combining data, as we anticipated natural heterogeneity between studies attributable to the different doses, durations, populations, and implementation/delivery strategies. For continuous variables, we used the inverse variance method, while for dichotomous variables we used the one proposed by Mantel‐Haenszel (Mantel‐Haenszel 1959).
For non‐randomised studies, where results have been adjusted to take account of possible confounding factors, we planned to use the generic inverse variance method in Review Manager 2020 to carry out any meta‐analysis (if both adjusted and non‐adjusted figures were provided, we intended to carry out a sensitivity analysis using the unadjusted figures to examine any possible impact on the estimate of treatment effect).
We also used narrative synthesis, guided by the data extraction form in terms of the ways in which studies may be grouped and summarised, in this review to describe the outcomes, explore intervention processes, and describe the impact of interventions by socio‐demographic characteristics known to be important from an equity perspective based on the PROGRESS framework (Oliver 2008), where this information was available.
Subgroup analysis and investigation of heterogeneity
Where data were available we carried out the following subgroup analyses:
by baseline prevalence of anaemia among trial participants: less than 20%; 20% to 39%, 40% or higher;
by sex: males, females, mixed/unknown;
by type of condiment (as reported by trialists);
by type or iron compound (as reported by trialists);
by malaria endemicity at the time that the trial was conducted malaria setting versus a non/unknown malaria setting;
by length of the intervention: less than six months, six months to one year, more than one year;
by daily dose of iron (amount of fortificant per 100 g of product), reported as low (less than 10 mg/day), intermediate (10 to 20 mg/day), or high daily dose (more than 20 mg/day)
We have only used the primary outcomes in subgroup analysis. We limited this analysis to those outcomes for which three or more trials contributed data to the subgroup (MECIR 2020)
We examined differences between subgroups by visual inspection of the subgroups’ confidence intervals; non‐overlapping confidence intervals suggested a statistically significant difference in treatment effect between the subgroups. We also used Borenstein 2009's approach to formally investigate differences between two or more subgroups. We conducted analyses in Review Manager (Review Manager 2020).
Sensitivity analysis
We carried out sensitivity analyses to:
examine the effects of removing studies at high risk of bias (those with high or unclear risk of bias for allocation concealment, lack of similarity of baseline outcome measurements, plus high attrition) from the meta‐analysis.
for cluster trials (CRCTs), we have carried out sensitivity analysis using a range of intra‐cluster correlation (ICC) values. We have presented the details of effect estimates with different values of ICC for the CRCTs (for outcomes anaemia, haemoglobin concentration, and iron deficiency (ID)) in Table 3. We have described this difference from the protocol in the Differences between protocol and review section.
Summary of findings and assessment of the certainty of the evidence
We used GRADE approach (GRADEpro GDT 2020; Balshem 2011) to assess the certainty of the evidence for the outcomes as per the guidelines laid down in Chapter 14 of the Cochrane Handbook for Systematic Reviews of Interventions (Schünemann 2021). The GRADE approach included the overall risk of bias, directness of evidence, inconsistency, precision of effect estimates, and risk of publication bias across the included studies. We have set out the main findings for primary outcomes in each comparison in the summary of findings tables (Table 1; Table 2), with relative effects along with the number of participants and studies contributing data for those outcomes. For iron status, we included ferritin concentration, transferrin saturation, and total iron binding capacity. For each individual outcome, two review authors (PM, CJ) independently assessed the certainty of the evidence. We used the GRADEprofiler software (GRADEpro GDT 2020) to import data from Review Manager 2020 to create the summary of findings tables.
We expressed the results as one of four levels of certainty (high, moderate, low, or very low). We downgraded the certainty of evidence on the basis of the following factors: quality of the study (risk of bias ‐ reporting bias and overall risk of bias), inconsistency (heterogeneity (I²)), overlapping 95% CIs between studies, and large between‐study variance (tau²), indirectness, and precision of results. Three criteria were considered for possible upgrading of results: strong or very strong associations between intervention and outcome; large or very large dose‐response effects; and where all plausible confounders would have reduced the effect.
Results
Description of studies
We included randomised controlled trials (RCTs), cluster randomised trials (CRCTs), non‐randomised controlled trials (nRCTs), and controlled before‐after (CBA) study designs in the search evaluating the effectiveness of condiments fortified with iron alone or in combination with other micronutrients in comparison to unfortified condiments or condiments fortified with the same micronutrients except iron; without any restriction on the settings and geographical region.
Results of the search
We identified a total of 21,687 records from database searches and after the removal of duplicates, there were 15,902 records for screening. After screening the title and abstracts and excluding 15,836 records, we considered 66 records (from 59 studies) eligible for possible inclusion in this review. After screening the full‐text articles we included 16 studies (from 20 records) (Andersson 2008; Asibey‐Berko 2007; Ballot 1989a (C); Chen 2005 (C); Chen Ke 2008; Haas 2014; Huo 2002; Longfils 2008; Nadiger 1980; Thuy 2003a; Thuy 2005 (C); Vinodkumar 2007; Wegmuller 2006; Working Group 1982; Zimmermann 2002; Zimmermann 2004a). Of these 16 studies, 12 studies (from 16 records) contributed to meta‐analysis. We excluded 43 records (from 43 studies). We have described the study selection process in Figure 2, as a PRISMA flowchart, including reasons for exclusion.
2.
Study flow diagram.
Included studies
All 16 included studies were published in the English language. We have presented the descriptions of included studies (participants, interventions, outcomes, source of funding) in the Characteristics of included studies. These studies were published between the years 1980 and 2014.
Study design
Among the 16 included studies, 12 were: randomised controlled trials (RCTs) (Andersson 2008; Asibey‐Berko 2007; Ballot 1989a (C); Chen 2005 (C); Chen Ke 2008; Haas 2014; Huo 2002; Longfils 2008; Thuy 2003a; Thuy 2005 (C); Zimmermann 2002; Zimmermann 2004a). Among these 12 RCTs, three studies followed a cluster RCT design(CRT) (Ballot 1989a (C); Chen 2005 (C); Thuy 2005 (C)). The CRTs are denoted with a "(C)" in their reference names. Of the three CRTs, one was randomised at the household level (Ballot 1989a (C)), and two were randomised at the village level (Chen 2005 (C); Thuy 2005 (C)).
Three of the included studies followed a controlled before‐after (CBA) study design (Nadiger 1980; Wegmuller 2006; Working Group 1982). One study was a non‐randomised control trial (nRCT) (Vinodkumar 2007).
Overall, out of 16 studies, 11 included studies had two arms (Ballot 1989a (C); Chen 2005 (C); Haas 2014; Nadiger 1980; Thuy 2003a; Thuy 2005 (C); Vinodkumar 2007; Wegmuller 2006; Working Group 1982; Zimmermann 2002; Zimmermann 2004a). Five studies had three arms (Andersson 2008; Asibey‐Berko 2007; Chen Ke 2008; Huo 2002; Longfils 2008).
Settings
Based on the World Bank 2019's list of economies, all studies took place in either upper‐middle or lower‐middle income economies in East Asia (three studies ‐ Chen 2005 (C); Chen Ke 2008; Huo 2002), South Asia (five studies ‐ Andersson 2008; Haas 2014; Nadiger 1980; Vinodkumar 2007; Working Group 1982), Southeast Asia (three studies‐Longfils 2008; Thuy 2003a; Thuy 2005 (C)), North Africa (two studies ‐ Zimmermann 2002; Zimmermann 2004a), West Africa (one study ‐ Wegmuller 2006), and Sub‐Saharan Africa (two studies ‐ Asibey‐Berko 2007; Ballot 1989a (C)). The studies were carried out in these countries: Cambodia (Longfils 2008), China (Chen 2005 (C); Chen Ke 2008; Huo 2002), Côte d’Ivoire (Wegmuller 2006), Ghana (Asibey‐Berko 2007), India (Andersson 2008; Haas 2014; Nadiger 1980; Vinodkumar 2007; Working Group 1982), Morocco (Zimmermann 2002; Zimmermann 2004a), South Africa (Ballot 1989a (C)), and Vietnam (Thuy 2003a; Thuy 2005 (C)). Overall, these studies were carried out in Africa and Asia. Within these two continents, there is a wide regional difference and, as reported in the included studies, the dietary pattern had variations. The PROGRESS‐Plus equity parameters are given in Table 4 for all the included studies, describing their parameters of equity and their study settings.
2. PROGRESS‐Plus equity checklist of included studies.
| Study | Place | Race/Ethnicity | Occupation | Gender/sex | Religion/ culture/ education | Socio‐economic status | Social capital | Others/ disability/ age/ sexual orientation | Overall PROGRESS Plus |
| Andersson 2008 | Six schools in 18 villages of Anekal Taluk in the Bangalore Urban District, Karnataka State of India. 900m above sea level. 5 primary schools and 1 high school. | Not reported | (children) | Boys and girls | Likely Hindu predominant | Subsistence farmer families | Not reported | Age: 5‐15 years (12.3% anaemic) | This study was conducted among children and adolescents in schools of a rural area of a lower‐middle income country in South Asia. |
| Asibey‐Berko 2007 | Sekyere West District of Ashanti region of Ghana. Mountainou;s 1400 feet above see level. Peak rain around June followed by a smaller peak in October each year. High rate of IDD and anaemia. | Not reported | Not reported | Children of both sexes and women | Not reported | Not reported | Not reported | Age: Women 15–45 years and children 1–5 years ( Women: 34.4% anaemic in DFS group and 19% in IS group; Children: 56.5% anaemic in DFS group and 54.2% in IS group) |
Mother‐child pairs living in a rural area of a lower‐middle income Sub‐Saharan African country were selected for this study. |
| Ballot 1989a (C) | Sub‐economic housing area in Chatsworth, near Durban, South Africa. | Indian descents | Not reported | Both sexes | Likely Hindu predominant | Sub‐economic housing area | Not reported | Age ranging from 10 to adults of unspecified age (22% IDA) | This study included families of Indian descent shown to have a high prevalence of iron deficiency living in subeconomic housing area in South Africa. |
| Chen 2005 (C) | Nine villages in the Haizijie Town of Bijie City, Guizhou Province, China | Not reported | Adults were predominantly farmers | Both sexes | Not reported | Not reported | Not reported | Ages 3 years and older | Residents above 3 years of age living in farming villages in an upper‐middle income Eastern Asian country were included in this study. |
| Chen Ke 2008 | Banan District which is a suburb of Chongqing, China. Previously investigated for child nutrition supported by the Sight and Life International vitamin A Research Foundation (Holland) | Not reported | (pre‐school children) | Both sexes | Likely Buddhist predominant | Middle‐class (as defined by investigators) | Not reported | Ages 2‐6 years (23.9% anaemic) | This study was conducted among preschool children from middle‐class suburban families in an upper‐middle income country in East Asia. |
| Haas 2014 | Panighatta Tea Estate, Darjeeling District, Northern part of West Bengal State, India. Flat plain. 150m above sea level. Temperature ranges between 17 and 28 C. Mean annual precipitation: 3266 mm. Heavy monsoon rains between May and October. | Nepali or Adivasi ethnic groups | Full time experienced tea pickers. Working 6 d/wk for a total of 6 h/d divided equally between morning and afternoon with a lunch break | Female | Likely Hindu predominant | Not reported | Not reported | Ages 18–55 years (mean age 39.5 years, 53% anaemia) | This study was conducted in a tea estate among full‐time tea‐picking women in a rural area of a lower‐middle income country in South Asia. |
| Huo 2002 | Three middle schools from Wancheng District, Nanyang City, Henan Province, China | Not reported | Students | Both sexes | Likely Buddhist predominant / Middle‐school education | Not reported | Not reported | Ages 11–17 years (all anaemic) | MIddleschool boarding students with anaemia living in an urban setting in an upper‐middle income Eastern Asian country were the subjects of this study. |
| Longfils 2008 | Two schools (a high school and a primary school) in the Chhuk district (Kampot Province) of Cambodia. | Not reported | Students | Both sexes | Primary and high school education | SES of participants was unclear, although it was stated that only wealthy families were able to afford to send their daughters to high school, so female high school pupils may have been of higher socio‐economic status. | Not reported | Ages 6–21 years (57% anaemic) | This study was conducted among iron‐deficient primary‐ and high‐school students in a lower‐middle income country in East Asia. |
| Nadiger 1980 | Residential schools in Hyderabad, India | Not reported | Students | Both sexes | Not reported | Inmates of the girls’ residential schools came from households that were slightly better‐off socio‐economically than the comparison ‘certified school’ | Not reported | Ages 5‐15 years | Subjects of this study were children and adolescents in residential schools in an urban setting in a lower‐middle income South Asian country. |
| Thuy 2003a | Hai Duong and Hung Yen provinces, which are located in the Red River delta of northern Vietnam. The area lacked any intervention to control IDA. | Not reported | Factory workers | Female | Not reported | Not reported | Not reported | Ages 17–49 years (all anaemic women) | This study was conducted among anaemic female factory workers in a densly‐populated area of a lower‐middle income country in East Asia. |
| Thuy 2005 (C) | Two communes of the Vu Ban district in Nam Dinh province, in the Red River Delta region of Vietnam where prevalence of anaemia was ~20% | Not reported | Not reported | Female | Likely Buddhist predominant | Not reported | Not reported | Ages 16‐49 | This study was conducted in a densely‐populated area of a lower‐middle income East Asian country among nonpregnant females of reproductive age. |
| Vinodkumar 2007 | India: Tumkur has a dry and hot climate, Uttar Kanada is mountainous and cold, Dharwad is in the warm plains, Gonda and Pratapgarh lie in the Gangetic plains, and Pratapgarh has scorching summers. Surat and Bharuch lie in the Narmada basin which is also warm. |
Not reported | Not reported | Both sexes | Likely Hindu predominant | Not reported | Not reported | Ages 10‐65 | This study was conducted in a lower‐middle income South Asian country among families in villages of various size. |
| Wegmuller 2006 | Rural village in the Dabou district of Cote d’Ivoire, 10 km from the southern coast. The climate is tropical, During the 6‐month rainy season, the village experiences daily drenching rains. Most of the foods consumed are produced locally, and the staple food is cassava. Plantain, rice, yams and dried, smoked fish are eaten regularly. |
Not reported | (Primary school students) | Both sexes | Not reported | Not reported | Not reported | Ages 5–15 years (anaemia 42% in DFS group and 62% in IS group, both 100% with iron deficiency) | This study was conducted in rural settings of a lower‐middle income Sub‐Saharan African country, involving iron‐deficient school children. |
| Working Group 1982 | Rural and urban areas in four centres located in different parts of India | Not reported. | General population | Both sexes | Not reported | Lower middle and poor income groups | Not reported | Highly variable baseline prevalence of anaemia | Study population included individuals aged 1 year and above. |
| Zimmermann 2002 | Northern Morocco. Brikcha Rural Commune, an area of endemic goiter in the Rif mountains. The region is 400–800 m above sea level, and the climate is temperate, with an 8‐mo dry season (22–34 degrees C, mean rainfall 23 cm/mo) and a 4‐mo damp season). This region is isolated from commercial routes, and most foods consumed are produced locally. More than 95% of the population is rural, and they work on small farms. |
Mixed Berber and Arab descent. | Students | Both sexes | Likely Muslim predominant | Primary school education | Not reported | Ages 6–16 years (64% anaemic in DFS group and 66% in IS group) | School children in a rural isolated area of a lower‐middle income North African country were involved in this study |
| Zimmermann 2004a | Brikcha Rural Commune (400–800 m above sea level) in northern Morocco. Temperate climate (8‐mo dry season) (22–34 °C, mean rainfall: 23 cm/mo) and (4‐mo damp season) (10–22 °C, mean rainfall: 77 cm/mo). Isolated from commercial routes, 95% rural, and most available food is produced locally on small farms. | Mixed Berber and Arab descent. | Students | Both sexes | Likely Muslim predominant | Primary school education | Not reported | Ages 6‐15 years (60% anaemia in DFS group, 55% in IS group) | This study was conducted in a rural area of a lower‐middle income North African country among school children. |
Six studies took place in schools (Huo 2002; Longfils 2008; Nadiger 1980; Wegmuller 2006; Zimmermann 2002; Zimmermann 2004a), six in communities (Asibey‐Berko 2007; Ballot 1989a (C); Chen 2005 (C); Thuy 2005 (C); Vinodkumar 2007; Working Group 1982), one in a nursery/kindergarten (Chen Ke 2008), one in a tea estate (Haas 2014), one in a factory (Thuy 2003a), and one in schools with follow‐up at the household level (Andersson 2008).
Nine studies took place in rural settings (Andersson 2008; Asibey‐Berko 2007; Ballot 1989a (C); Chen 2005 (C); Chen Ke 2008; Haas 2014; Thuy 2005 (C); Zimmermann 2002; Zimmermann 2004a), six in urban settings (Huo 2002; Longfils 2008; Nadiger 1980; Thuy 2003a; Vinodkumar 2007; Wegmuller 2006), and one in both rural and urban settings (Working Group 1982).
Malaria prevalence
Eight of the included studies were conducted in areas where malaria is not endemic (Andersson 2008, Ballot 1989a (C), Chen 2005 (C), Thuy 2003aThuy 2005 (C); Vinodkumar 2007Zimmermann 2002; Zimmermann 2004a). Five studies did not state whether malaria was present in intervention sites (Huo 2002, Haas 2014, Longfils 2008; Nadiger 1980; Chen Ke 2008). One study reported malaria endemicity with a 55% prevalence (Wegmuller 2006) and the Asibey‐Berko 2007 study had a low prevalence of 0.6% to8.2%.
Prevalence of anaemia at baseline
Three studies reported the baseline prevalence of anaemia as less than 20% (Andersson 2008 12.3%; Thuy 2003a; 9.4% Longfils 2008 7% to 13% among the eligible study population). Four studies had baseline prevalence of anaemia between 20% and 39% (Asibey‐Berko 2007 19% to 35%; Chen Ke 2008 23.5%; Nadiger 1980 37.9%; Thuy 2005 (C) >20%). Three studies reported baseline anaemia prevalence of 40% or higher (Haas 2014 53%; Zimmermann 2002 65%; Zimmermann 2004a 55% to 60%). Chen 2005 (C) reported a range of prevalence of baseline anaemia in their population as 27.8% to 66.3%, and Huo 2002 reported 11% to 22.6% prevalence of anaemia among participants in three schools. The Working Group 1982 study reported varied prevalence of anaemia across different age groups and across gender; ranging from 0% to 96.3%. Three studies did not report the baseline prevalence of anaemia in their study population (Ballot 1989a (C); Vinodkumar 2007; Wegmuller 2006).
Participants
A total of 20,512 participants were included in the 16 studies (18,410 participants after adjusting the sample size for clustering effects in Ballot 1989a (C); Chen 2005 (C); Thuy 2005 (C) CRTs). Sample sizes ranged from 69 to 14,398. Three studies involved only participants who were anaemic (Huo 2002; Longfils 2008; Thuy 2003a), one study included children who were iron‐deficient (Wegmuller 2006), and one studied children who were iodine‐deficient (Zimmermann 2004a).
Age and number of participants
The Andersson 2008 trial included 401 children between 5 and 18 years of age. Participants in Asibey‐Berko 2007 study were non‐pregnant, non‐lactating mothers (n = 184) with mean average age 29.6 years (SD: 5.4) (computed using the weighted average of reported baseline mean ages of three groups) and 82 children with mean age of three years (SD: 1). The Ballot 1989a (C) study included 672 people aged 10 years and above; Chen 2005 (C) had 3677 individuals aged >3 years; Chen Ke 2008 included 226 preschool children aged between two and six years; Haas 2014 included 212 women in the age group of 18 to 55 years; Huo 2002 included 240 children aged 11 to 17 years; 137 individuals aged 6 to 21 years in Longfils 2008 study; Nadiger 1980 included 546 children aged 5 to 15 years; Thuy 2003a trial included 136 women aged 17 to 49 years; Thuy 2005 (C) included 389 women in the age group of 16 to 49 years; Vinodkumar 2007 had 829 individuals aged 10 to 65 years; Wegmuller 2006 included 123 children between 5 and 15 years of age; Working Group 1982 covered 14,398 participants aged one year and above in both genders; Zimmermann 2002 studied 367 children and Zimmermann 2004a 158 children of age 6 to 15 years.
Sex
Three studies involved only women (Haas 2014; Thuy 2003a; Thuy 2005 (C)), one study involved both women and their children (Asibey‐Berko 2007), and all other studies focused on children and/or adolescents of both sex (Andersson 2008; Ballot 1989a (C); Chen 2005 (C); Chen Ke 2008; Huo 2002; Longfils 2008; Nadiger 1980; Vinodkumar 2007; Wegmuller 2006; Working Group 1982; Zimmermann 2002; Zimmermann 2004a).
Interventions
Eight studies compared iron‐fortified condiments versus the unfortified condiment (Ballot 1989a (C); Chen 2005 (C); Huo 2002; Longfils 2008; Nadiger 1980; Thuy 2003a; Thuy 2005 (C); Working Group 1982). Eight studies compared iron fortification in combination with other micronutrients versus the same condiment with other micronutrient(s), but no added iron (Andersson 2008; Asibey‐Berko 2007; Chen Ke 2008; Haas 2014; Vinodkumar 2007; Wegmuller 2006; Zimmermann 2002; Zimmermann 2004a). No study compared iron‐fortified condiments versus no intervention. The fortification profiles per 100 g of condiment in these studies are given in Table 5.
3. Fortification profile of included studies per 100 grams of the condiment.
| Study | Condiment | Fortification used (iron compound or unfortified condiment) | Elemental iron (mg) | Vitamin A (Retinol Equivalent)$ | Zinc (mg) | Folic acid (µg) | Vitamin B1 (thiamin) (mg) | Vitamin B2 (riboflavin) (mg) | Vitamin B3 (niacin) (mg) | Iodine (µg) | Calcium |
| Comparison 1 (condiments/seasonings fortified with iron alone versus unfortified condiments/seasonings) | |||||||||||
| Ballot 1989a (C) | Masala (curry powder) | NaFeEDTA | 140¥ | ‐‐ | ‐‐ | ‐‐ | ‐‐ | ‐‐ | ‐‐ | ‐‐ | ‐‐ |
| unfortified masala | ‐‐ | ‐‐ | ‐‐ | ‐‐ | ‐‐ | ‐‐ | ‐‐ | ‐‐ | ‐‐ | ||
| Chen 2005 (C) | soy sauce # | NaFeEDTA | 26.4 | ‐‐ | ‐‐ | ‐‐ | ‐‐ | ‐‐ | ‐‐ | ‐‐ | ‐‐ |
| unfortified soy sauce | ‐‐ | ‐‐ | ‐‐ | ‐‐ | ‐‐ | ‐‐ | ‐‐ | ‐‐ | ‐‐ | ||
| Huo 2002 | soy sauce # | unfortified soy sauce | ‐‐ | ‐‐ | ‐‐ | ‐‐ | ‐‐ | ‐‐ | ‐‐ | ‐‐ | ‐‐ |
| low‐NaFeEDTA | 112 | ‐‐ | ‐‐ | ‐‐ | ‐‐ | ‐‐ | ‐‐ | ‐‐ | ‐‐ | ||
| high‐NaFeEDTA | 448 | ‐‐ | ‐‐ | ‐‐ | ‐‐ | ‐‐ | ‐‐ | ‐‐ | ‐‐ | ||
| Longfils 2008 | fish sauce§ | NaFe‐EDTA | 81.9 | ‐‐ | ‐‐ | ‐‐ | ‐‐ | ‐‐ | ‐‐ | ‐‐ | ‐‐ |
| FeSO4+citrate | 81.9 | ‐‐ | ‐‐ | ‐‐ | ‐‐ | ‐‐ | ‐‐ | ‐‐ | ‐‐ | ||
| Unfortified fish sauce | ‐‐ | ‐‐ | ‐‐ | ‐‐ | ‐‐ | ‐‐ | ‐‐ | ‐‐ | ‐‐ | ||
| Thuy 2003a | fish sauce§ | NaFeEDTA | 81.9 | ‐‐ | ‐‐ | ‐‐ | ‐‐ | ‐‐ | ‐‐ | ‐‐ | ‐‐ |
| unfortified fish sauce | ‐‐ | ‐‐ | ‐‐ | ‐‐ | ‐‐ | ‐‐ | ‐‐ | ‐‐ | ‐‐ | ||
| Thuy 2005 (C) | fish sauce§ | NaFeEDTA | 41 | ‐‐ | ‐‐ | ‐‐ | ‐‐ | ‐‐ | ‐‐ | ‐‐ | ‐‐ |
| unfortified fish sauce | ‐‐ | ‐‐ | ‐‐ | ‐‐ | ‐‐ | ‐‐ | ‐‐ | ‐‐ | ‐‐ | ||
| Comparison 2 (condiments/seasonings fortified with iron with other micronutrients versus condiments/seasonings fortified with same micronutrients without iron) | |||||||||||
| Andersson 2008 | salt | micronized ground ferric pyrophosphate (MGFePP) | 200 | ‐‐ | ‐‐ | ‐‐ | ‐‐ | ‐‐ | ‐‐ | 3000 | ‐‐ |
| encapsulated ferrous fumarate (EFF) as EFF mix (EFF, soy stearine, titanium dioxide, hydroxypropyl methylcellulose + sodium hexa metaphosphate) | 200 | ‐‐ | ‐‐ | ‐‐ | ‐‐ | ‐‐ | ‐‐ | 3000 | ‐‐ | ||
| unfortified salt | ‐‐ | ‐‐ | ‐‐ | ‐‐ | ‐‐ | ‐‐ | ‐‐ | 3000 | ‐‐ | ||
| Asibey‐Berko 2007 | salt | ferrous fumarate + weekly placebo | 100 | ‐‐ | ‐‐ | ‐‐ | ‐‐ | ‐‐ | ‐‐ | 5000 | ‐‐ |
| ferrous fumarate + weekly 70mg iron supplement | 100 | ‐‐ | ‐‐ | ‐‐ | ‐‐ | ‐‐ | ‐‐ | 5000 | ‐‐ | ||
| unfortified salt + weekly placebo | ‐‐ | ‐‐ | ‐‐ | ‐‐ | ‐‐ | ‐‐ | ‐‐ | 5000 | ‐‐ | ||
| Chen Ke 2008 | seasoning powder (as 2.5 g pouches) | unfortified seasoning powder | ‐‐ | 17440 | ‐‐ | ‐‐ | ‐‐ | ‐‐ | ‐‐ | ‐‐ | ‐‐ |
| ferric sodium edentate | 480 | 17440 | ‐‐ | ‐‐ | ‐‐ | ‐‐ | ‐‐ | ‐‐ | ‐‐ | ||
| ferric sodium edentate | 480 | 17440 | 480 | 8000 | 2.8 | 2.8 | 2.8 | ‐‐ | 32000 (calcium carbonate) | ||
| Haas 2014 | salt | microencapsulated ferrous fumarate + Iodate | 110 | ‐‐ | ‐‐ | ‐‐ | ‐‐ | ‐‐ | ‐‐ | 4700 (iodate) | ‐‐ |
| Potassium iodate | ‐‐ | ‐‐ | ‐‐ | ‐‐ | ‐‐ | ‐‐ | ‐‐ | 4700 (iodate) | ‐‐ | ||
| Zimmermann 2002 | salt | microencapsulated ferrous sulphate with partially hydrogenated vegetable oil | 100 | ‐‐ | ‐‐ | ‐‐ | ‐‐ | ‐‐ | ‐‐ | 2500 | ‐‐ |
| Potassium iodide (KI) | ‐‐ | ‐‐ | ‐‐ | ‐‐ | ‐‐ | ‐‐ | 2500 | ‐‐ | |||
| Zimmermann 2004a | salt | micronised ferric pyrophosphate + Potassium iodate | 200 | ‐‐ | ‐‐ | ‐‐ | ‐‐ | ‐‐ | ‐‐ | 2500 | ‐‐ |
| Potassium iodate | ‐‐ | ‐‐ | ‐‐ | ‐‐ | ‐‐ | ‐‐ | 2500 | ‐‐ | |||
| Non‐randomised studies | |||||||||||
| Nadiger 1980 | salt | ferric orthophosphate + sodium hydrogen sulphate |
100 | ‐‐ | ‐‐ | ‐‐ | ‐‐ | ‐‐ | ‐‐ | ‐‐ | ‐‐ |
| unfortified salt | ‐‐ | ‐‐ | ‐‐ | ‐‐ | ‐‐ | ‐‐ | ‐‐ | ‐‐ | ‐‐ | ||
| Vinodkumar 2007 | salt | ferrous sulfate (chelated with malic acid and sodium hexa metaphosphate) and Potassium iodate | 100 | ‐‐ | ‐‐ | ‐‐ | ‐‐ | ‐‐ | ‐‐ | 4000 | ‐‐ |
| Potassium iodate | ‐‐ | ‐‐ | ‐‐ | ‐‐ | ‐‐ | ‐‐ | ‐‐ | 4000 | ‐‐ | ||
| Wegmuller 2006 | Salt | micronized ground ferric pyrophosphate (FePP) | 300 | ‐‐ | ‐‐ | ‐‐ | ‐‐ | ‐‐ | ‐‐ | ‐‐ | ‐‐ |
| Potassium iodate | ‐‐ | ‐‐ | ‐‐ | ‐‐ | ‐‐ | ‐‐ | ‐‐ | ‐‐ | ‐‐ | ||
| Working Group 1982 | salt | FePO4 withNaHSO4 | 100 | ‐‐ | ‐‐ | ‐‐ | ‐‐ | ‐‐ | ‐‐ | ‐‐ | |
| unfortified salt | ‐‐ | ‐‐ | ‐‐ | ‐‐ | ‐‐ | ‐‐ | ‐‐ | ‐‐ | |||
$ One international unit (IU) vitamin A is equivalent to 0.0003 mg of retinol, 0.0006 mg of beta‐carotene and 0.0012 mg of other pro‐vitamin A carotenoids. ¥ Equivalent to 25 umol of iron per gram of masala. # 100 ml of soy sauce is equivalent to 112 gram of soy sauce.§ 100 ml of fish sauce is equivalent to 122 grams of fish sauce
The Andersson 2008 trial compared the efficacy of double fortified salt (DFS) made by using two formulae (micronised ground ferric pyrophosphate (MGFePP) and encapsulated ferrous fumarate (EFF)) with iodised salt. Asibey‐Berko 2007 compared iodised salt plus placebo, iodised salt plus iron supplement (ferrous fumarate), and DFS (salt with ferrous fumarate + potassium iodate) plus placebo for women and children in dyad.
In the Ballot 1989a (C) trial, effects of iron‐EDTA (NaFeEDTA) fortified masala were compared with unfortified masala. The trialists in Chen 2005 (C) study used NaFeEDTA‐fortified soy sauce and unfortified soy sauce. Haas 2014 used DFS with ferrous fumarate and potassium iodate with iodised salt alone. The Nadiger 1980 study compared ferric orthophosphate and sodium hydrogen sulphate fortified salt with unfortified salt. Similarly, Working Group 1982 compared salt fortified with ferric phosphate (FePO4) with unfortified salt. Two trials (Thuy 2003a; Thuy 2005 (C)) reported fish sauce fortified with NaFeEDTA compared with unfortified fish sauce. Another trial that used DFS (Vinodkumar 2007) had ferrous sulphate monohydrate and potassium iodate fortified salt; which was compared with iodised salt. The study by Wegmuller 2006 compared the efficacy of iodine and micronised ground ferric pyrophosphate (FePP) fortified salt with iodised salt. Also, Zimmermann 2002 trial tested the efficacy of iodised salt and dual‐fortified salt (iodine + ferrous sulphate microencapsulated with partially hydrogenated vegetable oil) and Zimmermann 2004a used DFS containing potassium iodate and micronised FePP versus iodised salt.
Another trial (Chen Ke 2008), had three different fortified‐diet groups which used fortified seasoning powder with maltodextrin directly added to meals. Group I was fortified with vitamin A; group II was fortified with vitamin A plus iron as ferric sodium EDTA, and group III was fortified with vitamin A plus iron, thiamine, riboflavin, folic acid, niacinamide, zinc, and calcium, respectively. It should be noted that it is a possibility that the presence of one or more of these other nutrients affected the absorption of iron (for example, calcium and/or zinc may have inhibited iron absorption). The Huo 2002 study compared the efficacy of soy sauce fortified with low‐NaFeEDTA group (with 5 mg Fe/day), high‐NaFeEDTA group (with 20 mg Fe/day) and non‐fortified soy sauce. The Longfils 2008 trial used Khmer fish sauce with either NaFe‐EDTA, ferrous sulphate + citrate or without any fortification.
No study compared iron‐fortified condiments versus no intervention.
Type of condiment/seasoning fortified
Nine studies used salt as the vehicle for iron fortification (Andersson 2008; Asibey‐Berko 2007; Haas 2014; Nadiger 1980; Vinodkumar 2007; Wegmuller 2006; Working Group 1982; Zimmermann 2002; Zimmermann 2004a), three used fish sauce (Longfils 2008; Thuy 2003a; Thuy 2005 (C)), two used soy sauce (Chen 2005 (C); Huo 2002), one used curry powder (Ballot 1989a (C)), and one trial used "seasoning powder" (Chen Ke 2008).
Type and dose of iron used
Type of iron
Various compounds of iron were used: NaFeEDTA (Ballot 1989a (C); Chen 2005 (C); Chen Ke 2008; Huo 2002; Longfils 2008; Thuy 2003a; Thuy 2005 (C)), ferrous sulphate (Longfils 2008; Vinodkumar 2007; Zimmermann 2002), ferric pyrophosphate (Andersson 2008; Zimmermann 2004a), ferrous fumarate (Andersson 2008; Asibey‐Berko 2007; Haas 2014), and ferric orthophosphate (Nadiger 1980; Wegmuller 2006; Working Group 1982).
Amount of iron in condiments
See Table 5 for the fortification profile of condiments across studies. In the Andersson 2008 study, the trialists used iodised salt (which used potassium iodate) at a level of 30 µg of Iodine/g of salt at the factory. Both fortified groups received DFS fortified at a level of 2 mg Fe/g salt with either the MGFePP (25% Fe) or encapsulated ferrous fumarate (EFF with 15% Fe). Asibey‐Berko 2007 used iodised salt with ferrous fumarate 70 mg, DFS (salt with ferrous fumarate 1 g per kg salt + potassium iodide 50 mg per kg salt). In another trial that used DFS compared with iodised salt (Haas 2014), DFS was fortified with 3.3 mg ferrous fumarate (〜1.1 mg elemental iron) per kg of salt and iodine, with the control group receiving salt containing only iodine (47 mg/kg potassium iodate), and both these salts were given to families of participants at 0.5 kg/month for every two household members. In the Nadiger 1980 study, the fortification group received common salt fortified with ferric orthophosphate (3,500 mg/kg) and sodium hydrogen sulphate (5,000 mg/kg) to provide an additional 1 mg elemental Fe per gram of common salt consumed; while the control group received unfortified salt. The experimental group in Vinodkumar 2007 used DFS with 1 mg of iron and 40 μg of iodine as potassium iodate per gram of salt and the control group used iodised salt. With an anticipated per capita salt consumption of an average 10 g/day, it was aimed to provide 10 mg of chelated iron and 400 μg of iodine per day.
The DFS was compared with iodised salt in Wegmuller 2006 study with 3 mg iron per g of salt. The Working Group 1982 study used 100 mg of elemental iron per 100 g of salt, and it was compared with unfortified salt. The Zimmermann 2002 trial had co‐fortification of iodised salt with Fe (25 μg iodine/g salt) or dual‐fortified salt with iodine (25 μg iodine/g salt) and Fe (1 mg Fe per gram salt, as ferrous sulphate microencapsulated with partially hydrogenated vegetable oil); whereas in the Zimmermann 2004a trial, fortified local salt with 25 μg iodine (as potassium iodate) per gram salt and 2 mg iron (as micronised ferric pyrophosphate) per g salt was used.
Among the two trials that used soy sauce as the condiment, Chen 2005 (C) study used NaFeEDTA fortified soy sauce (29.6 mg Fe per 100 mL) as fortificant and compared with unfortified soy sauce. The quantity of consumption of the fortified sauce was 16.4 mL per person (4.9 mg of iron from NaFeEDTA). The Huo 2002 study had low‐NaFeEDTA group (consuming fortified soy sauce, providing 5 mg Fe/day) and high‐NaFeEDTA group (consuming fortified soy sauce, providing 20 mg Fe/day) being compared to the control group who consumed non‐fortified soy sauce.
Among the three trials which used fish sauce as the condiment, Longfils 2008 had two intervention groups with iron added as NaFeEDTA or as anhydrous FeSO4 plus 3.5 g per litre citric acid at a concentration of 1 mg Fe per mL, and both these interventions were compared with unfortified fish sauce. Each treatment group participant consumed 10 mL of fish sauce. The Thuy 2003a trial used 10 mL fish sauce containing 10 mg Fe as NaFeEDTA (iron‐fortified group) and Thuy 2005 (C) trial, added NaFeEDTA (9 mmol (500 mg) Fe/L to fish sauce in their respective intervention arms.
Ballot 1989a (C) used masala fortified with NaFeEDTA (10 mg/g = 25 µmol iron per gram masala). The Chen Ke 2008 trial used seasoning powder with vitamin A (500 μg of dry vitamin A acetate) supplements (group 1), vitamin A and iron (12 mg as ferric sodium edentate) (group 2), and supplements of vitamin A, iron, thiamine (0.7 mg as thiamine mononitrate), riboflavin (0.7 mg), folic acid (0.2 mg), niacinamide (7 mg), zinc (12 mg as zinc oxide) and calcium (800 mg as calcium carbonate) (group 3).
Daily dose of iron
Four studies reported a low daily dose of iron (less than 10 mg/day) (Chen 2005 (C); Huo 2002; Thuy 2005 (C); Zimmermann 2002), 10 studies reported intermediate daily doses (10 mg/day to 20 mg/day) (Andersson 2008; Asibey‐Berko 2007; Chen Ke 2008; Haas 2014; Huo 2002; Longfils 2008; Nadiger 1980; Thuy 2003a; Vinodkumar 2007; Wegmuller 2006), and two studies reported high daily dose (more than 20mg/day) (Ballot 1989a (C); Zimmermann 2004a). The Huo 2002 trial had both low and intermediate daily dosages of iron in the intervention arms.
The dose of iron received by participants ranged from 4.4 mg/day to 55 mg/day across the included studies: Chen 2005 (C) was 4.4 mg/day, Andersson 2008 and Asibey‐Berko 2007 was 10 mg/day, Haas 2014 was 11 mg/day, Chen Ke 2008 was 12 mg/day, Ballot 1989a (C) was 55 mg/day; Huo 2002 was 5 mg/day and 20 mg/day, Longfils 2008 was 10 mg/day in each arm; Nadiger 1980 was 15 mg/day in each arm, Thuy 2003a was 10 mg/day, Thuy 2005 (C) was 7.54 mg/day, Vinodkumar 2007 was 10 mg/day, Wegmuller 2006 was 10.5 mg/day, Zimmermann 2002 was 7 mg/day to 12 mg/day and Zimmermann 2004a was 24 mg/day.
Trial duration
Trial duration ranged from three months to 24 months, with a median duration of 10 months: Huo 2002 was three months, Longfils 2008 was five months, Chen Ke 2008; Thuy 2003a; Wegmuller 2006 were six months, Asibey‐Berko 2007 was eight months, Haas 2014 and Zimmermann 2002 were nine months, Andersson 2008 and Zimmermann 2004a were 10 months, Nadiger 1980; Vinodkumar 2007 and Working Group 1982 were 12 months, Chen 2005 (C) and Thuy 2005 (C) were 18 months, and Ballot 1989a (C) was 24 months.
Outcomes
Primary outcomes
Eleven studies reported anaemia (Andersson 2008; Asibey‐Berko 2007; Chen 2005 (C); Haas 2014; Huo 2002; Nadiger 1980; Thuy 2003a; Thuy 2005 (C); Wegmuller 2006; Working Group 1982; Zimmermann 2004a).
Anaemia was defined as haemoglobin concentration less than 12 g/dL in women and <11 g/dL in children in Asibey‐Berko 2007 study and <120 g/L in school children in Nadiger 1980 study. Other studies followed the WHO guidelines (less than 12 g/dL in children aged 12 years and above and less than 11.5 g/dL in children aged 5 to 11 years (Andersson 2008), < 110 g/L for children aged 3 to 6 years, < 120 g/L haemoglobin for children between 7 and 12 years, < 130 g/L for males ≥13 years and < 120 g/L for females ≥13 years (Chen 2005 (C)), <120 g/L in women (Haas 2014; Thuy 2003a; Thuy 2005 (C)), boys or girls younger than 15 years with < 120 g/L; girls ≥ 15 years with < 120 g/L, and boys aged ≥ 15 years with < 130 g/L (Huo 2002), <120 g/L in children aged >12 years, <115 g/L in children aged 5 to 12 years (Wegmuller 2006), Children ‐ six months to six years < 11 mg/dL, 6 to 14 years < 12 mg/dL, adult males < 13 mg/dL, adult females ‐ nonpregnant < 12 mg/dL, adult females, pregnant ‐ <11 mg/dL (Working Group 1982) and <130 g/L in boys aged >15 years, < 120 g/L in children aged >12 years and in girls >15 years, < 115 g/L in children aged 5 to 11 years (Zimmermann 2004a)).
Fifteen studies measured haemoglobin concentration (g/L) (Andersson 2008; Ballot 1989a (C); Chen 2005 (C); Chen Ke 2008; Haas 2014; Huo 2002; Longfils 2008; Nadiger 1980; Thuy 2003a; Thuy 2005 (C); Vinodkumar 2007; Wegmuller 2006; Working Group 1982; Zimmermann 2002; Zimmermann 2004a).
Seven studies reported iron deficiency (Andersson 2008; Haas 2014; Thuy 2003a; Thuy 2005 (C); Wegmuller 2006; Zimmermann 2002; Zimmermann 2004a). The following studies reported body iron status: Andersson 2008; Ballot 1989a (C); Chen 2005 (C); Chen Ke 2008; Haas 2014; Huo 2002; Longfils 2008; Thuy 2003a; Thuy 2005 (C). Zimmermann 2002 and Zimmermann 2004a reported on ferritin concentration. Other iron status indicators reported were transferrin saturation (Huo 2002; Zimmermann 2004a), body iron stores (Andersson 2008; Ballot 1989a (C); Haas 2014), total iron binding capability (TIBC) (Huo 2002; Zimmermann 2004a)
No studies reported adverse effects.
Secondary outcomes
The secondary outcome reported was iron deficiency anaemia, reported by Andersson 2008; Ballot 1989a (C); Longfils 2008; Nadiger 1980; Wegmuller 2006; Zimmermann 2002; Zimmermann 2004a.
Details of the outcomes in the included studies are provided in the Characteristics of included studies table.
Funding
Most included studies were funded by academic institutions or independent non‐government organisations. One study was funded by an industry foundation (Zimmermann 2002). The funding details were not clear in three trials (Huo 2002; Nadiger 1980; Vinodkumar 2007).
Excluded studies
We excluded 43 studies from this review. Some trials assessed multiple micronutrient fortification without teasing out the effect of iron (Chavasit 2003; Fidler 2003; Kumar 2007; Kumar 2008; Manger 2008; Vinodkumar 2009a; Vinodkumar 2009b; Winichagoon 2006; Zimmermann 2004b); others were neither intervention trials, nor did they have a control group and follow‐up component (Foy 1976; Horton 2011; Scrimshaw 2005; Watanapaisantrakul 2006; Working Group 1983). Some used a food vehicle that did not meet our definition of condiments or seasonings (Andersson 2010; Huo 2001; Huo 2011; Karl 2010; Nadeau 1987; van Stuijvenberg 1997); eight studies were iron absorption studies (Baynes 1990; Dai 1983; Huo 2001; Huo 2007; Lamparelli 1987; Sattarzadeh 1999; Tuntipopipat 2006; Walczyk 2005); and one study (Nair 1998) reported the findings of two other studies which were carried out previously and have been included in this review. Others did not meet our study design criteria (Ballot 1989a (C); Lopez 2018; Mannar 2019; Prieto‐Patron 2020; Ranganathan 1996; Tuntipopipat 2006); three studies (Wang 2009; Wang 2011; Sun 1991) examined social marketing techniques for iron‐fortified condiments. Six studies were only available as abstracts and no response was received from the study authors despite repeated requests (Jain 1987; Madan 1998; Thuy 2002; Thuy 2003b; Tuntawiroon 1980; Van T 2009). For details on excluded studies see Characteristics of excluded studies.
Risk of bias in included studies
The Characteristics of included studies section presents the risk of bias for each of the included trials and Figure 3 and Figure 4 provide the details of judgment and the overall summary of the risk of bias. Overall, no studies were assessed as having a low risk of bias and all the included studies were assessed to be at a high overall risk of bias, with the most concerns being around allocation concealment, blinding, and random sequence generation.
3.
Risk of bias graph: review authors' judgements about each risk of bias item presented as percentages across all included studies.
4.
Risk of bias summary: review authors' judgements about each risk of bias item for each included study.
Allocation
Random sequence generation
We graded one study at low risk of bias (Ballot 1989a (C)), which used computer‐generated random numbers to divide the participants into intervention and control groups. Ten studies were at unclear risk of bias (Andersson 2008; Asibey‐Berko 2007; Chen Ke 2008; Haas 2014; Huo 2002; Longfils 2008; Thuy 2003a; Thuy 2005 (C); Zimmermann 2002; Zimmermann 2004a). These studies either did not specify the sequence generation process or reported the words "random assignment" without further detail, and we therefore judged them to be at unclear risk of bias. Five studies were at high risk of bias (Chen 2005 (C); Nadiger 1980; Vinodkumar 2007; Wegmuller 2006; Working Group 1982). Among them, one study used a small road to divide groups of villages (Chen 2005 (C)), four studies used purposive selection or similar techniques to divide the study participants into groups (Nadiger 1980; Vinodkumar 2007; Wegmuller 2006; Working Group 1982).
Allocation concealment Six studies did not report the allocation concealment methods; hence, we assessed them to be at unclear risk of bias (Andersson 2008; Asibey‐Berko 2007; Ballot 1989a (C); Haas 2014; Longfils 2008; Zimmermann 2002). Among them, one study used different colour codes for the interventions (Andersson 2008), and one study mentioned the use of numerical codes (Ballot 1989a (C)), but the technique of concealment was not clear. Other studies did not specify the technique of allocation concealment. Ten studies were graded to be at high risk of bias (Chen 2005 (C); Chen Ke 2008; Huo 2002; Nadiger 1980; Thuy 2003a; Thuy 2005 (C); Vinodkumar 2007; Wegmuller 2006; Working Group 1982; Zimmermann 2004a). Among them, four studies were non‐randomised studies (Nadiger 1980; Vinodkumar 2007; Wegmuller 2006; Working Group 1982). The other six trials had a high probability of non‐concealment of allocations.
Similarity of baseline outcome
Fourteen studies were graded to be at low risk of bias (Andersson 2008; Asibey‐Berko 2007; Ballot 1989a (C); Chen 2005 (C); Chen Ke 2008; Haas 2014; Huo 2002; Longfils 2008; Thuy 2003a; Thuy 2005 (C); Vinodkumar 2007; Wegmuller 2006; Zimmermann 2002; Zimmermann 2004a). These studies described either similar levels or non‐significant differences in the baseline outcome measurements across the intervention arms. Two studies were assessed to be at high risk of bias (Nadiger 1980; Working Group 1982).
Similarity of baseline characteristics
We graded 11 studies at low risk of bias (Andersson 2008; Ballot 1989a (C); Chen Ke 2008; Haas 2014; Longfils 2008; Thuy 2003a; Thuy 2005 (C); Wegmuller 2006; Working Group 1982; Zimmermann 2002; Zimmermann 2004a). These studies reported the baseline characteristics of study populations to be similar. Four studies have an unclear risk of bias (Asibey‐Berko 2007; Chen 2005 (C); Huo 2002; Vinodkumar 2007). Among them, Asibey‐Berko 2007 and Chen 2005 (C) reported only age as a baseline characteristic. The Huo 2002 study reported similar living standards and dietary patterns (without specific quantitative details); Vinodkumar 2007 did not report baseline characteristics. One study reported a difference in terms of socio‐economic characteristics between the groups and hence we graded it to be at high risk of bias (Nadiger 1980).
Blinding
Blinding
Participants in six studies were blinded (Andersson 2008; Asibey‐Berko 2007; Ballot 1989a (C); Haas 2014; Wegmuller 2006; Zimmermann 2004a) and we assessed these studies to be at low risk of bias. The risk of bias was unclear in four studies (Chen 2005 (C); Longfils 2008; Thuy 2005 (C); Zimmermann 2002) and blinding was inadequate or non‐existent in six studies (Chen Ke 2008; Huo 2002; Nadiger 1980; Thuy 2003a; Vinodkumar 2007; Working Group 1982), which were graded to be at high risk of bias.
Contamination
We graded 11 studies at low risk of bias (Andersson 2008; Ballot 1989a (C); Chen Ke 2008; Haas 2014; Nadiger 1980; Thuy 2003a; Thuy 2005 (C); Wegmuller 2006; Working Group 1982; Zimmermann 2002; Zimmermann 2004a) and five studies were at unclear risk of bias (Asibey‐Berko 2007; Chen 2005 (C); Huo 2002; Longfils 2008; Vinodkumar 2007).
Incomplete outcome data
Ten studies (Andersson 2008; Chen 2005 (C); Chen Ke 2008; Haas 2014; Longfils 2008; Thuy 2003a; Wegmuller 2006; Working Group 1982; Zimmermann 2002; Zimmermann 2004a) had low losses to follow‐up, and we graded them to be at low risk of bias. Two studies had higher rates of attrition (Asibey‐Berko 2007; Vinodkumar 2007) and were graded to be at high risk of bias.
In Asibey‐Berko 2007, reasons for dropout were reported, however, any differential dropout characteristics were not mentioned. Nadiger 1980 provided no information on why 66.8% of students were chosen for follow‐up, and characteristics of the dropouts were not mentioned. In Vinodkumar 2007 it appears that only those having all the time point measurements were included in the analysis, villages varied in size, and there was no adjustment for clustering.
Four trials (Ballot 1989a (C); Huo 2002; Nadiger 1980; Thuy 2005 (C)) did not mention the attrition; so it was unclear whether the lack of data was due to losses to follow‐up or incomplete reporting and these studies were assessed to be at unclear risk of bias.
Selective reporting
Fourteen studies (Andersson 2008; Asibey‐Berko 2007; Chen 2005 (C); Chen Ke 2008; Haas 2014; Huo 2002; Longfils 2008; Thuy 2003a; Thuy 2005 (C); Vinodkumar 2007; Wegmuller 2006; Working Group 1982; Zimmermann 2002; Zimmermann 2004a) showed no signs of selective reporting and hence we graded them to be at low risk of bias.
We graded one study to be at high risk of bias (Nadiger 1980). This study did not report the Packed Cell Volume (PCV) values. Also, there was no information on the reason for a further 6‐month follow‐up of part of the study population.
One study (Ballot 1989a (C)) had insufficient information to determine reporting bias, and we graded it as unclear risk of reporting bias.
Other potential sources of bias
Three trials appeared to be free from other sources of bias (Haas 2014; Longfils 2008; Thuy 2005 (C)).
We graded three studies (Huo 2002; Nadiger 1980; Vinodkumar 2007) to be at high risk of bias. The Huo 2002 study reported on participants’ diets but did not account for other factors that might have changed the outcome. There was also no mention of the source of funding. In Nadiger 1980 study, considering the nature of the study population, inherent differences other than baseline demographic characteristics were not taken into account which were likely to influence the results; the Vinodkumar 2007 study did not provide information on the influence of diet or other factors that may change the outcome and there was no clear mention of the source of funding.
Ten studies (Andersson 2008; Asibey‐Berko 2007; Ballot 1989a (C); Chen 2005 (C); Chen Ke 2008; Thuy 2003a; Wegmuller 2006; Working Group 1982; Zimmermann 2002; Zimmermann 2004a) had unclear risk of other biases, although present no reason to believe that their interventions affected data collection.
Among the CRCTs, all three of the studies (Ballot 1989a (C); Chen 2005 (C); Thuy 2005 (C)) had a low risk of recruitment bias and baseline imbalance. Thuy 2005 (C) was graded to be at low risk of bias and Ballot 1989a (C) and Chen 2005 (C) were at unclear risk for loss of clusters. All three CRCTs (Ballot 1989a (C); Chen 2005 (C); Thuy 2005 (C)) were at high risk of bias for incorrect analysis for the clusters. Two studies were at unclear risk of bias for compatibility with individual RCTs (Chen 2005 (C); Thuy 2005 (C)) and one CRCT was at high risk of bias (Ballot 1989a (C)).
No studies had a low risk of bias for all three domains ‐ allocation concealment, similarity of baseline outcome measurements, and incomplete outcome data; hence we graded them to be at a high overall risk of bias. See Figure 3 and Figure 4 for further details on the quality of the included studies. Details on the risk of bias for each included study are presented in the Characteristics of included studies table.
Effects of interventions
See Table 1: Condiments/seasonings fortified with iron versus unfortified condiments/seasonings for preventing anaemia and improving health and Table 2: Condiments/seasonings fortified with iron plus other micronutrients versus condiments/seasonings fortified with other micronutrients except iron for preventing anaemia and improving health.
Sixteen studies were included in this review and among them, 12 contributed data for meta analysis. The results are highlighted in the summary of findings tables. Six trials (Ballot 1989a (C); Chen 2005 (C); Huo 2002; Longfils 2008; Thuy 2003a; Thuy 2005 (C)) compared iron‐fortified condiments versus the unfortified condiment (Comparison 1, Table 1). Six trials (Andersson 2008; Asibey‐Berko 2007; Chen Ke 2008; Haas 2014; Zimmermann 2002; Zimmermann 2004a) compared iron fortification in combination with other micronutrients versus the same condiment with other micronutrient(s), but no added iron (Comparison 2, Table 2). There were no studies comparing condiments/seasonings fortified with iron versus no intervention (Comparison 3). We carried out sensitivity analyses for three cluster‐randomised trials (CRTs) (Ballot 1989a (C); Chen 2005 (C); Thuy 2005 (C)), with different intra cluster correlation coefficient (ICC) values and examined their effect on risk ratio (RR) for anaemia, mean difference (MD) for haemoglobin concentrations and RR for iron deficiency. We observed that change in ICC did not change the direction of the effects of interventions for these outcomes. We have reported the details of sensitivity analyses in Table 3.
Comparisons
1. Condiments/seasonings fortified with iron versus unfortified condiments/seasonings
Data from six trials (Ballot 1989a (C); Chen 2005 (C); Huo 2002; Longfils 2008; Thuy 2003a; Thuy 2005 (C)) contributed to this comparison involving 5065 participants (2984 participants after adjusting for cluster effects) consuming iron‐fortified condiments in comparison with unfortified condiments. Condiments used were curry powder (Ballot 1989a (C)), soy sauce (Chen 2005 (C); Huo 2002) and fish sauce (Longfils 2008; Thuy 2003a; Thuy 2005 (C)).
Anaemia (as defined by trialists, depending on the age and gender and adjusted for altitude and smoking as appropriate)
Four trials (Chen 2005 (C); Huo 2002; Thuy 2003a; Thuy 2005 (C)) with a total of 2328 participants reported on anaemia in assessing the effects of condiments fortified with iron on the prevalence of anaemia (see Table 1). We are uncertain about whether consuming condiments fortified with iron reduces anaemia at the end of intervention as the certainty of evidence has been assessed as very low (RR 0.34, 95% confidence interval (CI) 0.18 to 0.65; 2328 participants; 4 studies; I2 = 94%, very low‐certainty evidence). Heterogeneity was high (Tau² = 0.35; Chi² = 48.82, df = 3 (P < 0.00001). Details of the analysis are given in Analysis 1.1. Different values of ICC for cluster RCTs (Chen 2005 (C); Thuy 2005 (C)) did not alter the overall effect estimates and heterogeneity (Table 3). We did not carry out subgroup analyses for anaemia due to an insufficient number of studies in each of the subgroups.
1.1. Analysis.
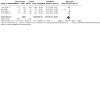
Comparison 1: Condiments/seasonings fortified with iron versus unfortified condiments/seasonings, Outcome 1: Anaemia (defined as haemoglobin below WHO cut‐off for age and adjusted for altitude as appropriate)
Haemoglobin concentration (g/L)
Five trials (Ballot 1989a (C); Chen 2005 (C); Huo 2002; Longfils 2008; Thuy 2005 (C)) with a total of 2808 participants examined haemoglobin concentration. We are uncertain about whether consuming iron‐fortified condiments/seasonings increases haemoglobin concentration (MD 6.40 g/dL, 95%C) ‐0.62 to 13.41; 2808 participants; 5 studies; very low‐certainty evidence), as the certainty of the evidence has been assessed as very low. Heterogeneity was high (Tau² = 62.55; Chi² = 269.77, df = 4 (P< 0.00001), I2 = 99%). See Analysis 1.2 for details. We did not carry out subgroup analyses for haemoglobin concentration due to insufficient numbers of studies in each of the subgroups.
1.2. Analysis.
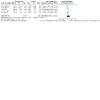
Comparison 1: Condiments/seasonings fortified with iron versus unfortified condiments/seasonings, Outcome 2: Haemoglobin concentration (g/L)
Iron deficiency (as defined by trialists, based on a biomarker of iron status)
Two trials (Thuy 2003a; Thuy 2005 (C)) with a total of 391 participants reported iron deficiency. Consumption of condiments/seasonings fortified with iron likely results in reduced iron deficiency as compared to unfortified condiments (RR 0.33, 95% CI 0.11 to 1.01; 391 participants; 2 studies; I2 = 81%; moderate‐certainty evidence). Heterogeneity was high. See Analysis 1.3 for details.
1.3. Analysis.
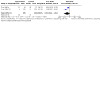
Comparison 1: Condiments/seasonings fortified with iron versus unfortified condiments/seasonings, Outcome 3: Iron deficiency (as defined by the trialists based on a biomarker of iron status)
Iron status (as reported)
Ferritin concentration (µg/L)
Six trials (Ballot 1989a (C); Chen 2005 (C); Huo 2002; Longfils 2008; Thuy 2003a; Thuy 2005 (C)) with a total of 4459 participants reported ferritin concentration. Details of the analysis are given in Analysis 1.4. We are uncertain about whether fortification of condiments with iron improves ferritin concentration in comparison to unfortified condiments (MD 14.81 µg/L, 95% CI 5.14 to 24.48; 4459 participants; 6 studies; I2 = 100%; very low‐certainty evidence). Heterogeneity was high (Tau² = 145.03; Chi² = 7102.28, df = 5 (P < 0.00001)) and the results should be interpreted with caution, especially considering that as an acute‐phase protein, ferritin is affected by inflammation. Since each of the subgroups had insufficient numbers of studies, we did not carry out subgroup analyses for ferritin concentration.
1.4. Analysis.
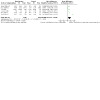
Comparison 1: Condiments/seasonings fortified with iron versus unfortified condiments/seasonings, Outcome 4: Ferritin concentration (µg/L)
Transferrin saturation
One trial (Huo 2002) contributed data for transferrin saturation. Fortification of condiments with iron may improve transferrin saturation (MD ‐20.54, 95% CI ‐34.26 to ‐6.82; 240 participants; 1 study; low‐certainty evidence).
Soluble transferrin receptor
Two trials (Andersson 2008; Thuy 2003a) reported soluble transferrin receptor concentration. There was no clear benefit of fortification of condiments with iron as compared to unfortified condiments towards improving the soluble transferrin receptor concentration (MD ‐0.36, 95% CI ‐3.19 to 2.47; 537 participants; 2 studies). Heterogeneity was high (Tau² = 4.15; Chi² = 151.59, df = 1 (P<0.00001)). Details of the analysis are given in Analysis 1.5.
1.5. Analysis.
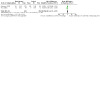
Comparison 1: Condiments/seasonings fortified with iron versus unfortified condiments/seasonings, Outcome 5: Soluble transferrin receptor
Soluble transferrin receptor‐ferritin index
One trial (Thuy 2003a) reported on soluble transferrin receptor‐ferritin index. Fortification of condiments with iron reduces the mean soluble transferrin receptor‐ferritin index by 381 (MD ‐381.00, 95% CI ‐383.81 to ‐378.19; 136 participants; 1 study).
Total iron binding capacity
One trial (Huo 2002) contributed data for total iron binding capacity. Fortification of condiments with iron may make little or no difference to total iron binding capacity (MD 0.01, 95% CI ‐0.01 to 0.03; 240 participants; 1 study; low‐certainty evidence).
Serum iron
No studies were found that assessed adverse effects.
Adverse effects (as measured by the trialists)
No studies were found that assessed adverse effects.
Secondary Outcomes
Iron deficiency anaemia (as defined by trialists) (IDA)
Children (2 to 11.9 years of age)
No studies were found that assessed IDA among children.
Adolescents (12 to 17.9 years of age)
No studies were found that assessed IDA among adolescents.
Pregnant women
No studies were found that assessed IDA among pregnant women.
Adults (male and females)
One secondary outcome was reported in one study (Thuy 2003a, n = 136 anaemic women) which found a 0.35 Risk Ratio for iron deficiency anaemia among those consuming NaFeEDTA‐fortified fish sauce for six months compared with those consuming unfortified version (95% CI 0.21 to 0.59).
No studies were found that assessed the following outcomes.
Cognitive Development ‐ Children (2 to 11.9 years of age)
Motor skill development ‐ Children (2 to 11.9 years of age)
Growth: height‐for‐age Z scores ‐ Children (2 to 11.9 years of age)
Growth: weight‐for‐height Z scores ‐ Children (2 to 11.9 years of age)
Malaria severity (only for malaria settings) ‐ Children (2 to 11.9 years of age), Adolescents (12 to 17.9 years of age), Pregnant women, Adults (male and females)
Malaria incidence (only for malaria settings) ‐ Children (2 to 11.9 years of age), Adolescents (12 to 17.9 years of age), Pregnant women, Adults (male and females)
Premature delivery (less than 37 weeks) ‐ Pregnant women
Very premature delivery (less than 34 weeks)
Low birth weight (less than 2500 g)
Any birth defects (neural tube defect, cleft lip, cleft palate, congenital cardiovascular defects and others as reported by trialists)
Work capacity (as defined by trialists) ‐ Adults (male and females)
Risk of iron overload (ferritin more than 150 mg/L) ‐ Adults (male and females)
2. Condiments/seasonings fortified with iron plus other micronutrients versus condiments/seasonings fortified with other micronutrients except iron
Six studies were included in this comparison (Andersson 2008; Asibey‐Berko 2007; Chen Ke 2008; Haas 2014; Zimmermann 2002; Zimmermann 2004a) involving 1252 participants. The condiments used were salt (Andersson 2008; Asibey‐Berko 2007; Haas 2014; Zimmermann 2002; Zimmermann 2004a). and seasoning powder (Chen Ke 2008).
Anaemia (as defined by trialists, depending on the age and gender and adjusted for altitude and smoking as appropriate)
Four trials (Andersson 2008; Asibey‐Berko 2007; Haas 2014; Zimmermann 2004a) with 1007 participants contributed data for the outcome anaemia in comparison 2 (see Table 2). Salt fortified with iron plus other micronutrients may reduce anaemia in the population aged two years and above in comparison to condiments/seasonings fortified with other micronutrients except iron (RR 0.59, 95% CI 0.40 to 0.89; 1007 participants; 4 studies; low‐certainty evidence). Heterogeneity was high (Tau² = 0.12; Chi² = 11.51, df = 3 (P = 0.009); I² = 74%), hence the results should be interpreted with caution. The details of the analyses are given in Analysis 2.1. We did not carry out subgroup analyses for anaemia due to an insufficient number of studies in each of the subgroups.
2.1. Analysis.
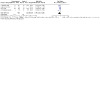
Comparison 2: Condiments/seasonings fortified with iron plus other micronutrients versus condiments/seasonings fortified with other micronutrients except iron, Outcome 1: Anaemia (defined as haemoglobin below WHO cut‐off for age and adjusted for altitude as appropriate)
Haemoglobin concentration (g/L)
Five trials with 1270 participants contributed data for this comparison (Andersson 2008; Chen Ke 2008; Haas 2014; Zimmermann 2002; Zimmermann 2004a). We are uncertain about whether consuming condiments/seasonings fortified with iron plus other micronutrients increases the haemoglobin concentration ( MD 6.22 g/dL, (95% CI 1.60 to 10.83; 1270 participants; 5 studies; very low‐certainty evidence) since the certainty of the evidence was very low. Heterogeneity was high (Tau² = 26.04; Chi² = 94.90, df = 4 (P<0.00001); I2 = 96%). Details of the analysis are given in Analysis 2.2. We did not carry out subgroup analyses for haemoglobin concentration due to insufficient numbers of studies in each of the subgroups.
2.2. Analysis.
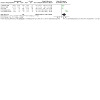
Comparison 2: Condiments/seasonings fortified with iron plus other micronutrients versus condiments/seasonings fortified with other micronutrients except iron, Outcome 2: Haemoglobin concentration (g/L)
Iron deficiency (as defined by trialists, based on a biomarker of iron status)
Four trials with 1154 participants provided data for this comparison (Andersson 2008; Haas 2014; Zimmermann 2002; Zimmermann 2004a). Fortification of salt with iron plus other micronutrients may improve iron deficiency as compared to condiments/seasonings fortified with the same micronutrients except iron (RR 0.36, 95% CI 0.19 to 0.69; 1154 participants; 4 studies; low‐certainty evidence). Heterogeneity was high (Tau² = 0.33; Chi² = 14.89, df = 3 (P = 0.002); I² = 80%). Details of the analysis are given in Analysis 2.3. We did not carry out subgroup analyses for iron deficiency due to insufficient numbers of studies in each of the subgroups.
2.3. Analysis.
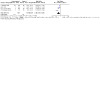
Comparison 2: Condiments/seasonings fortified with iron plus other micronutrients versus condiments/seasonings fortified with other micronutrients except iron, Outcome 3: Iron deficiency
Iron status (as reported)
Ferritin concentration (µg/L)
Five trials with 1251 participants contributed data for this comparison (Andersson 2008; Chen Ke 2008; Haas 2014; Zimmermann 2002; Zimmermann 2004a). We are uncertain about whether fortification of condiments/seasonings with iron plus other micronutrients increases ferritin concentration (MD10.63 µg/L) since the certainty of evidence was very low (95% CI 2.40 to 18.85; 1251 participants; 5 studies; very low‐certainty evidence). Heterogeneity was high (Tau² = 83.78; Chi² = 1206.22, df = 4 (P<0.00001); I2 = 100%). Details of the analyses are given in Analysis 2.4. We did not carry out subgroup analyses for ferritin concentration due to insufficient numbers of studies in each of the subgroups.
2.4. Analysis.

Comparison 2: Condiments/seasonings fortified with iron plus other micronutrients versus condiments/seasonings fortified with other micronutrients except iron, Outcome 4: Ferritin concentration (µg/L)
Transferrin saturation
No studies were found that assessed transferrin saturation.
Soluble transferrin receptor
Four trials contributed data to this outcome (Andersson 2008; Haas 2014; Zimmermann 2002; Zimmermann 2004a). The fortification of condiments/seasonings with iron and other micronutrients may or may not improve soluble transferrin receptor concentration (MD ‐7.09, 95% CI ‐17.10 to 2.91; participants = 1138; studies = 4; I2 = 100%). See Analysis 2.5 for details.
2.5. Analysis.
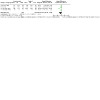
Comparison 2: Condiments/seasonings fortified with iron plus other micronutrients versus condiments/seasonings fortified with other micronutrients except iron, Outcome 5: Soluble transferrin receptor
Soluble transferrin receptor‐ferritin index
No studies were found that assessed transferrin receptor‐ferritin index.
Total iron binding capacity
One trial (Zimmermann 2004a) with 158 participants contributed data for total iron binding capacity. Salt fortified with iron plus other micronutrients may improve total iron binding capacity in comparison to condiments/seasonings fortified with other micronutrients except iron (MD 3.74, 95% CI 2.94 to 4.54; participants = 158; 1 study; low‐certainty evidence).
Serum iron
Two studies contributed data to this outcome (Andersson 2008; Haas 2014). Fortification of condiments/seasonings with iron plus other micronutrients may or may not improve serum iron concentration (MD 1.48, 95% CI 0.73 to 2.22; participants = 594; studies = 2; I2 = 57%). See Analysis 2.6 for details.
2.6. Analysis.
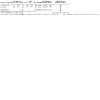
Comparison 2: Condiments/seasonings fortified with iron plus other micronutrients versus condiments/seasonings fortified with other micronutrients except iron, Outcome 6: Body iron
Adverse effects (as measured by the trialists)
No studies were found that looked at adverse effects.
Secondary Outcomes
Iron deficiency anaemia (as defined by trialists) ‐ Children (2 to 11.9 years of age)
Two trials assessed (Andersson 2008; Zimmermann 2002) iron deficiency anaemia among children aged 2 to 11.9 years. Fortification of condiments/seasonings with iron plus other micronutrients may reduce iron deficiency anaemia among children as compared to the condiments/seasonings fortified with micronutrients except iron (RR 0.30, 95% CI 0.20 to 0.45; participants = 777; studies = 2; I2 = 0%). See Analysis 2.7 for details.
2.7. Analysis.
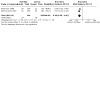
Comparison 2: Condiments/seasonings fortified with iron plus other micronutrients versus condiments/seasonings fortified with other micronutrients except iron, Outcome 7: Iron deficiency anaemia in children 2 to 11.9 years
Growth: weight‐for‐height Z scores ‐ Children (2 to 11.9 years of age)
One study (Chen Ke 2008, n=132) reported weight‐for‐height and height‐for‐age z‐scores and showed the mean differences were 0.2 (95% CI 0.1 to 0.39) and 0.4, (95% (CI 0.19 to 0.61), respectively.
No studies were found that looked at the following outcomes.
Iron deficiency anaemia (as defined by trialists) ‐ Adolescents (12 to 17.9 years of age), Pregnant women, Adults (male and females)
Cognitive Development ‐ Children (2 to 11.9 years of age)
Motor skill development ‐ Children (2 to 11.9 years of age)
Growth: height‐for‐age Z scores ‐ Children (2 to 11.9 years of age)
Malaria severity (only for malaria settings) ‐ Children (2 to 11.9 years of age), Adolescents (12 to 17.9 years of age), Pregnant women, Adults (male and females)
Malaria incidence (only for malaria settings) ‐ Children (2 to 11.9 years of age), Adolescents (12 to 17.9 years of age), Pregnant women, Adults (male and females)
Premature delivery (less than 37 weeks) ‐ Pregnant women
Very premature delivery (less than 34 weeks)
Low birth weight (less than 2500 g)
Any birth defects (neural tube defect, cleft lip, cleft palate, congenital cardiovascular defects and others as reported by trialists)
Work capacity (as defined by trialists) ‐ Adults (male and females)
Risk of iron overload (ferritin more than 150 mg/L) ‐ Adults (male and females
3. Condiments/seasonings fortified with iron versus no intervention
No trial reported data on this comparison.
Summary of Non‐randomised studies
Among the four non‐randomised studies included in this review (Nadiger 1980; Vinodkumar 2007; Wegmuller 2006; Working Group 1982), all of them used salt for fortification. The non‐randomised studies reported a significant increase in haemoglobin (Nadiger 1980; Vinodkumar 2007; Wegmuller 2006; Working Group 1982) and a reduction in anaemia (Nadiger 1980; Working Group 1982) after consumption of iron‐fortified salt. Details of the effects of fortification of non‐randomised studies are given in Table 6.
4. Summary of Non‐randomised studies.
| Study | Design | Summary | Conclusions |
| Nadiger 1980 | Controlled before‐after study | The fortified salt (Ferric orthophosphate + sodium hydrogen sulphate) was used as intervention which provided a total intake of 2 mg of elemental Fe/g and was compared with iodised salt. Out of 1080 boys and 565 girls (aged 5–15 years) registered from four residential schools in Hyderabad, India, 222 boys and 161 girls in the experimental schools and 92 boys and 71 girls in the control schools were followed up for a period of one year. Ninety‐seven boys in the experimental school and 54 in the control school were followed up for a further period of 6 months. At 12 months in both boys and girls Hb levels had significantly increased in the experimental groups (121 g/L (SD 1.0) to 134 (SD 1.0) in boys and 137 g/L (SD 1.5) to 148 (SD 1.1) in girls. In boys of the control group there was a small decrease (by 3.9 g/L). At 18 months, experimental group had an increase of 15 g/L and control group had a decrease of 0.5 g/L. The reason for decline in control group in both situations were unclear. Also, the increase in Hb was highest among the participants who had baseline Hb levels < I20 g/L and this difference was statistically significant. |
Use of fortified salt for a period of 1 year resulted in a significant increase in the haemoglobin level of children. There was also significant reduction in the prevalence of anaemia. |
| Vinodkumar 2007 | Non‐randomised controlled trial | This study used double fortified salt with ferrous sulfate mono‐hydrate and potassium iodate, among individuals aged 10 years and above (63 to 90 people per cluster per arm). The DFS contained 1 mg/g of iron and 40 µg/g of iodine. The trial was carried out in seven clusters in three states of India: Karnataka (three clusters), Gujarat (two clusters), and Uttar Pradesh (two clusters). Each participant consumed about 10 g of salt per day. After 6 months of intervention, the mean Hb in the experimental group was 11.30 ± 2.21 g/dL, and after 1 year it was 12.32 ± 1.93 g/dL. (p< .05). In the control group, the mean Hb was 10.61 ± 2.47g/dL after 6 months, and it was 11.06 ± 2.59 g/dL after 1 year. The increase of 1.98 g/dL in the experimental group was higher (p< .05) the increase of 0.77 g/dL in the control group. |
Trialists reported significant improvement in hemoglobin status in the group using DFS among all age groups and among both males and females. |
| Wegmuller 2006 | Controlled before‐after study | The study was carried out among 5–15 years old children from 4 primary schools in a rural village in the Dabou district of Coˆte d’Ivoire, and it assessed the effect of DFS (with fortification level of 3 mg Fe/g salt with micronized ground FePP) with per capita intake of 3.5 g/d. The two groups did not differ in terms of haematological parameters, except that Hb was higher in the DFS group than in the iodised salt (IS) group (P < 0.05). The Hb concentration did not change in either group over 6 months. Both SF and serum TfR concentrations were greater than at baseline in the DFS group at 6 months; these concentrations did not change in the IS group. There was a significant increase in total body iron in the DFS group (P, 0.001), with no change in the IS group. Body iron concentration increased in the DFS group from 4.662 to 5.962 mg/kg (P,0.001), whereas it did not change in the IS group (5.562 vs. 5.663). The prevalence of anaemia did not change significantly (0% change in the IS group and 5% in the DFS group at 6 months). In the DFS group, the prevalence of iron deficiency anaemia (42 to 23%) and iron deficiency without anaemia (58 to 28%) decreased. In the IS group, iron deficiency anaemia (62 to 38%) and iron deficiency without anaemia (38 to 25%) decreased. The decrease was higher in DFS group. | Study authors reported that DFS with FePP can increase body iron stores in children. There was no increase in haemoglobin. Their findings also suggested that iron fortification programs may not be successful in reducing anaemia without control of endemic parasitoses. |
| Working Group 1982 | Controlled before‐after study | The study was carried out in rural areas adjacent to Hyderabad, Kolkata (formerly Calcutta), Delhi and urban areas of Chennai (formerly Madras) in India, among individuals aged 1 year and above. These four areas had different dietary backgrounds and other environmental conditions. It covered 14,398 individuals in total. This study used iron‐fortified salt with formula ‐ salt: 1000 g; (FePO4.2H2O): 3.5 g (1000 mg Fe); (NaHSO4.2H2O): 5.0 g. (Also, in Kolkata centre, salt fortified according to an alternate formula was tested in a subsample in the control area at the end of 12 months). At the end of 12 to 18 months of consumption of iron‐fortified salt, showed significant improvement in the Hb‐levels and a significant reduction in the incidence of anaemia was observed in all the test areas. The findings were similar even in the areas with high levels of hookworm infestations. Simultaneous deworming marginally enhanced the beneficial effects.There were no untoward effects attributable to the consumption of fortified salt during the study period. Both formulae used were effective in increasing the Hb concentration. | Consumption of iron fortified salt showed significant improvement in Hb concentration and reduction in the prevalence of anaemia in the community. Authors reported that this salt formulation, could be an economical alternative to regular high cost fortified salt. |
Discussion
Summary of main results
We included 12 randomised controlled trials (RCTs), three before‐after comparison studies (CBAs) with control, and one non‐randomised trial in this review. Six trials compared iron‐fortified condiments versus the unfortified condiment (Comparison 1). Six trials compared condiments fortified with iron in combination with other micronutrients versus condiments fortified with the same micronutrients except iron (Comparison 2).
One comparison revealed that while condiments/seasonings fortified with iron alone have uncertain effects on anaemia, iron given in combination with other micronutrients as a fortificant through condiments may reduce anaemia in the population aged two years and above.
Condiments/seasonings fortified with iron alone may slightly reduce iron deficiency and improve iron status compared with unfortified condiments/seasonings.
There was a high degree of heterogeneity across the included studies with respect to all primary outcome variables, especially anaemia, haemoglobin concentration and iron deficiency, making the effect estimation difficult. None of the included trials reported any adverse side effects. The effects of this intervention on other health outcomes are unclear.
All the non‐randomised studies reported an increase in haematological parameters after the interventions to varying degrees.
More studies are needed to determine the effect of fortified condiments/seasonings on health and any potential adverse effects.
Overall completeness and applicability of evidence
We conducted this review and synthesised the data based on three comparisons. However, the included studies contributed data (qualitative and quantitative) to just two comparisons.
No studies reported on adverse events, and several other outcomes related to serum iron were not reported in included studies.
All studies included in this review were conducted in middle‐income countries (whether lower‐ or upper‐middle), which are relevant settings of interest for condiment fortification, but there is a lack of data from low‐income countries on this intervention. There was representation from community settings as well as more controlled settings such as schools.
Condiments/seasoning fortification did not result in a meaningful decrease in anaemia in the population. This could be because the evidence generated through this synthesis is influenced by the different types of iron used across studies, the small numbers of studies representing each type of iron used as fortificant, or other factors.
Not all included studies reported measures taken for adherence to interventions. Adherence is reported indirectly in terms of loss to follow‐up (attrition), and one study noted that there were complaints reported by the participants about the appearance of the product and difficulties receiving the intervention (Nadiger 1980). The studies that were carried out in schools such as the Huo 2002 study had an opportunity to monitor the children while consuming the fortified condiment/seasoning. Other studies did not have any reported active mechanism to ensure adherence to interventions by the study participants.
The duration of intervention in the included studies varied between three months to two years, which is another limiting factor for the applicability of the evidence. The extent of iron intake varies with the duration of the intervention, and this in turn affects the overall haematological outcomes. Trials with longer durations will have frequent compliance and dropout issues, further making the interpretation of generated evidence complex.
Also, it is known that the coverage and utilisation of fortified food are complex in food fortification studies (Neufeld 2017) and greatly affect the impact of fortification interventions.
Quality of the evidence
We assessed the certainty of evidence using the GRADE methodology (GRADEpro GDT 2020). Overall, the certainty of the evidence was very low (anaemia, ferritin, haemoglobin for comparison 1 and ferritin, haemoglobin for comparison 2), low (transferrin saturation and total iron binding capacity for comparison 1 and anaemia, iron deficiency, and total iron binding capacity for comparison 2), and moderate (iron deficiency for comparison 1). The downgrading of certainty of the evidence was largely due to limitations in the study design or execution, or to indirectness or imprecision.
Potential biases in the review process
The review authors were aware of the potential for bias throughout each step of this review. In an effort to reduce this bias, two review authors (PM and VP) were involved in database searches. CJ and LMDR independently assessed the eligibility of studies for inclusion, followed by data extraction using standardised data extraction file, and assessment of the risk of bias (following the Cochrane Manual; Assessing risk of bias in included studies) of all studies included in the literature search until 2014. Two review authors (PM and VP) independently repeated the same assessment on studies included until January 2023. When the review authors had a disagreement about the risk of bias categorisation, issues were settled through discussion and consensus. We did not limit the search by language; however, all included studies were in English.
Agreements and disagreements with other studies or reviews
We have identified several reviews on the effect of fortification on iron status. A 2013 systematic review and meta‐analysis (Athe 2013) involving 5142 participants aged >10 years showed that consumption of iron‐fortified foods significantly increases the haemoglobin concentration (net pooled effect 4.74 g/L (95% confidence interval (CI) 3.08, 6.40)). In the same year, another systematic review about fortification was published (Das 2013), containing studies on iron fortification in children. Of the food vehicles studied, iron fortification of condiments showed a significant impact on serum ferritin level (standardised mean difference (SMD) of 2.80 (95% CI: 2.43, 3.17)), but this was data from just one study, and no significant impacts on haemoglobin levels or anaemia were seen (three and two studies, respectively).
Several reviews focus specifically on iron fortification of condiments. A systematic review and meta‐analysis of RCTs testing the effect of NaFeEDTA‐fortified soy sauce on anaemia among Chinese children showed significantly increased haemoglobin concentration (12 studies, mean difference (MD) 8.81 g/L (95% CI 5.96 to 11.67)) and decreased anaemia rates (16 studies, odds ratio (OR) 0.25 (95% CI 0.19‐0.35)) compared with non‐fortified soy sauce control groups (Huo 2015).
A 2016 literature review and meta‐analysis of RCTs (Hess 2016) investigated evidence on the impact of fortified condiments and noodles among children and adults and found that fortification of condiments increased haemoglobin concentrations by 0.74 g/dL (95% CI 0.56 to 0.93, 12 studies) and that different types of iron preparations showed no effect differences. 3.0; I2 = 86). The mean ferritin increase with fortified fish or soy sauce was 1.94 μg/L (95% CI 0.9 to 3.0). A 2018 systematic review and meta‐analysis (Ramírez‐Luzuriaga 2018) showed that in low‐ and middle‐jncome countries (LMICs), double‐fortified salt (DFS) containing iron and iodine is efficacious in increasing haemoglobin concentrations[(SMD 0.28; 95% CI: 0.11 to 0.44; P < 0.001) and reducing the risk of anaemia (RR: 0.59; 95% CI: 0.46 to 0.77; P < 0.001), and IDA (RR 0.37; 95% CI: 0.25 to 0.54; P < 0.001). In effectiveness studies, the effect size for haemoglobin was smaller, but also significant. Baseline characteristics such as haemoglobin concentration, anaemia prevalence, and deworming were not associated with effect sizes, and neither were the sample sizes nor study duration.
Our review differs from the above reviews in that it included all condiment/seasoning vehicles, and all age groups, while focusing only on the effect of iron as a fortificant. However, it is possible that the variety of fortification vehicles included in this systematic review (contributing to high heterogeneity of the studies) led to our review not showing strong or consistent findings of iron fortification on the examined primary and secondary outcomes.
There are also ongoing studies assessing the effect of DFS compared to iodised salt on measures of iron and iodine status across the life course (Baxter 2019). A Cochrane Review (Das 2019) on multiple micronutrients (MMN) fortification of various food items and vehicles examined 43 studies. One of the food vehicles included in that review was salt. The review authors reported low to very low certainty evidence in all haematological parameters. They reported that the MMN fortification of food vehicles may reduce anaemia, iron deficiency anaemia and micronutrient deficiencies (iron, vitamin A, vitamin B2 and vitamin B6). They were uncertain of the effect of MMN fortification on anthropometric measures (height for age/length for age, weight for age, and weight for height/weight for length).
Another systematic review (Waller 2020) looked at the performance factors affecting the efficacy of condiment fortification trials. Studies were ranked as low or high performing, based on whether or not they significantly improved iron‐deficiency outcomes (haemoglobin, anaemia prevalence, and ferritin levels). The review included 23 studies, of which, nine performed poorly, eight performed highly, and six were classified as neither. The review reported that unsuccessful trials did not consider environmental factors (like parasitic infections), nutritional factors (like micronutrient deficiencies other than iron), consumer acceptability of the product, or experimental factors. It stressed the appropriate implementation of the condiment fortification program at the population level.
A 2021 systematic review (Larson 2021) evaluated the effects of DFS on "nutritional status, cognition, work productivity, development, and morbidity" in the population. Authors reviewed 22 studies and reported a significant overall positive effect on haemoglobin concentration, ferritin, anaemia and iron deficiency anaemia. Effects on other outcomes were mixed. The authors also noted the programmatic challenges reported in included studies and stressed the need for robust distribution and evaluation systems for fortified salt in the population.
Another systematic review evaluated the regional perspectives of Indonesia in terms of food fortification (Dewi 2021). The review authors screened 15 studies into the review out of 517 probable studies which were published between 2000 and 2020. They reported that fortification of food with iron and other micronutrients can increase the haemoglobin and serum ferritin concentrations among young and school‐aged children. However, overall the effect on long‐term growth was found to be unclear.
An overview of systematic reviews (Lopes K 2021) reported the findings from 75 systematic reviews that evaluated the effects of nutrition‐specific interventions including fortification of condiments/seasonings. The systematic reviews included in their overview showed varying effects on haemoglobin concentration, anaemia, iron deficiency and ferritin concentration.
A 2022 systematic review by Baxter and colleagues assessed the effects of DFS compared with iodised salt on measures of iron status. The review included 18 studies involving over 8000 participants from five countries and showed that DFS may have small beneficial impacts on haemoglobin concentration and anaemia compared to iodised salt (Baxter 2022).
Authors' conclusions
Implications for practice.
Despite the availability of randomised controlled trials (RCTs) assessing various types of condiments and seasonings fortification on anaemia, haemoglobin and other parameters, there is very low‐ to moderate‐certainty evidence of the effect. There is uncertainty on whether there are any differences in the haemoglobin concentrations (a biomarker of anaemia) among those who received iron‐fortified condiments compared to those who did not consume iron‐fortified condiments. It is also uncertain whether fortification of condiments with iron and other vitamins and minerals in comparison to condiments fortified with other micronutrients reduces the risk of iron deficiency. There was also a high degree of heterogeneity across the included studies with respect to all primary outcome variables, especially anaemia, haemoglobin concentration and iron deficiency, making the effect estimation difficult.
These results may be useful for practitioners in guiding program and policy design. The effects of condiment/seasoning fortification should continue to be monitored in population surveys.
Implications for research.
We propose the following areas for further research.
Investigation into whether iron fortification of condiments or seasonings is associated with adverse effects. Similarly, the role of inflammatory markers in assessing overall effectiveness of the fortification needs to be examined.
Estimating the effect of co‐interventions and building a mechanism to isolate those effects from that of fortification.
Improved clarification of the aetiology of anaemia affecting the outcomes of iron fortification interventions, as well as how deficiencies in (and replacement of) other micronutrients such as vitamin B12 affect iron status.
More closely examine regional and geographic differences in condiment/seasoning consumption patterns based on customs and availability.
Investigate through well‐planned randomised controlled trials (RCTs)the effect of fortification of condiments with iron on the growth and development (cognitive and motor) of children.
History
Protocol first published: Issue 2, 2012
Acknowledgements
We would like to thank Amy Allison, Woodruff Health Sciences Library, Emory University and Christy Cechman, US Centers for Disease Control and Prevention, for their help in devising the search strategy.
We would like to thank Therese Dowswell, Mary Serdula and Julie Self for their contributions to the original protocol. Therese Dowswell helped develop the methods of the protocol. Mary and Julie provided feedback on the protocol and contributed to screening titles and abstracts to assess eligibility in the early phases of the review.
Sincere appreciation to Sarah Young, Cornell University for updating the search in 2014 and Sejla Isanovic, University of South Carolina for updating the search in September 2020 with supports from Prof. Edward Frongillo.
We thank Kasturba Medical College, Mangalore, Manipal Academy of Higher Education, Manipal, India, for all the support rendered to Prasanna Mithra in carrying out this review.
We also acknowledge and thank those reviewers who provided feedback on the review draft at various stages of development ‐ Valerie Wells, Sam McCrabb, Solange Durao, George Moschonis and Jamiu Aderonmu.
Appendices
Appendix 1. Search Strategy
Cochrane Central Register of Controlled Trials (CENTRAL)
#1 MeSH descriptor Food, Fortified explode all trees #2 MeSH descriptor Condiments explode all trees #3 MeSH descriptor Sodium Chloride, Dietary, this term only #4 MeSH descriptor Flavoring Agents, this term only #5 ((fortif* or enrich* or enhance*) Near/3 (food* or iron*)) #6 (salt or sodium NEXT chloride) NEXT (diet* or table or common) #7 MeSH descriptor Iron explode all trees #8 fortif* #9 (#7 AND #8) #10 NaFeEDTA #11 (achar or anise or basil or caper* or pepper* or cardamom or cinnamon or chilli* or chive* or clove*) #12 (coriander or cumin or Curcuma NEXT longa or cubeb or curry) #13 (dill or fennel or fenugreek or garlic or ginger) #14 (ma*joram or masala or mint or nutmeg or oregano) #15 (paprika or parsley or rosemary or sage or savory or sesame or sorrel) #16 (tarragon or thyme or tu*meric or vanilla or wasabi or vinegar*) #17 (monosodium glutamate or MSG) #18 ((condiment* or herb* or flavo*r* or sauce* or seasoning* or spice*) Near/3 (fortif* or enrich* or enhance*)) #19 (flake* or powder* or blend* or granule*) #20 (stock NEXT cube* or gravy NEXT cube* or bouillon* or instant NEXT noodle*) #21 (#1 OR #2 OR #3 OR #4 OR #5 OR #6 OR #9 OR #10 OR #11 OR #12 OR #13 OR #14 OR #15 OR #16 OR #17 OR #18 OR #19 OR #20) #22 MeSH descriptor Anemia, Iron‐Deficiency, this term only #23 MeSH descriptor Ferritins explode all trees #24 (anemi* or anaemi* or (iron NEXT deficien*) OR nonanemic or nonanaemic or (hemoglobin NEXT free NEXT erythrocyte*) or haemoglobin* or hemoglobin* or (serum NEXT ferritin)) #25 MeSH descriptor Hemoglobins explode all trees #26 MeSH descriptor Iron, this term only #27 (#22 OR #23 OR #24 OR #25 OR #26) #28 (#21 AND #27) MEDLINE and Medline in Progress (OVID)
1. exp Food, Fortified/
2. exp Condiments/
3. exp Spices/
4. exp Sodium Chloride, Dietary/
5. exp Flavoring agents/
6. ((fortif* or enrich or enhance*) adj3 (food* or iron)).ab,ti.
7. ((salt or sodium chloride) adj (diet* or table or common)).ab,ti.
8. exp Iron/ andfortif*.ab, ti.
9. NaFeEDTA NaFeEDTA.ab,ti.
10. (achar or anise or basil or caper or pepper or cardamom or cinnamon orchilli or chives or clove*).ab,ti.
11. (coriander or cumin or Curcuma longa or cuceb cubeb or curry).ab,.ti.
12. (dill or fennel or fenugreek or garlic or ginger).ab,ti.
13. (marjoram or masala or mint or nutmeg or oregano).ab,ti.
14. (paprika or parsley or rosemary or sage or savory or sesame or sorrel).ab,ti.
15. (tarragon or thyme or turmeric or vanilla or wasabi or vinegar*).ab,ti.
16. (MSG or monosodium glutamate).ab,ti.
17. ((condiment* or seasoning* or flavo?r* or sauce* or spice* or herb*) adj3 (fortif* or enrich* or enhance*)).ab,ti.
18. (flake* or powder* or blend* or granule*).ab,ti.
19. (Stock cube* or gravy cube* or bouillon* or instant noodle).ab,ti.
20. or/1‐19
21. exp Ferritins/bl, df [Blood Deficiency]
22. exp Anemia, Iron‐Deficiency/
23. (an?emi* or iron deficien* or nonan?emic or h?emoglobin‐free erythrocyte* or haemoglobin or h?emoglobin or serum ferritin).ab,ti.
24. exp Hemoglobins/
25. Iron/bl [Blood Deficiency] OR blood deficiency.ab,ti.
26. 21 or 22 or 23 or 24 or 25
27. 20 and 26
28. exp animals/ not humans.sh.
29. 27 not 28
EMBASE (OVID)
1. diet supplementation/ 2. exp condiment/ 3. exp flavoring agent/ 4. salt intake/ 5. iron intake/ 6. sodium chloride/ and fortif$.ti,ab. 7. ((fortif$ or enrich$ or enhance$) adj3 (food$ or iron$)).ti,ab. 8. ((salt or sodium chloride) adj (diet$ or table or common)).ti,ab. 9. Iron/ and fortif$.ti,ab. 10. NaFeEDTA.ti,ab. 11. (achar or anise or basil or caper$ or cardamom or cinnamon or chilli$ or chive$ or clove$).ti,ab. 12. (coriander or cumin or Curcuma longa or cubeb or curry).ti,ab. 13. (dill or fennel or fenugreek or garlic or ginger).ti,ab. 14. (ma?joram or masala or mint or nutmeg or oregano).ti,ab. 15. (paprika or parsley or pepper$ or rosemary or sage or savory or sesame or sorrel).ti,ab. 16. (tarragon or thyme or tu?meric or vanilla or wasabi or vinegar$).ti,ab. 17. (monosodium glutamate or MSG).ti,ab. 18. ((condiment$ or herb$ or flavo?r$ or sauce$ or seasoning$ or spice$) adj3 (fortif$ or enrich$ or enhance$)).ti,ab. 19. (flake$ or powder$ or blend$ or granule$).ti,ab. 20. (stock cube$ or gravy cube$ or bouillon$ or instant noodle).ti,ab. 21. or/1‐20 22. iron deficiency anemia/ 23. iron deficiency/ 24. ferritin/ 25. ferritin blood level/ 26. (an?emi$ or iron deficien$ or nonan?emic or h?emoglobin‐free erythrocyte$ or h?emoglobin or serum ferritin$).ti,ab. 27. hemoglobin/ 28. hemoglobin blood level/ 29. iron/ec 30. or/22‐29 31. 21 and 30 32. exp animal/ not human.sh. 33. 31 not 32
CINAHL Plus (EBSCOhost)
S27 S20 and S26 S26 S20 or S21 or S22 or S23 or S24 or S25 S25 (anemi* or anaemi* or iron deficien* or nonan#emic or h#emoglobin free erythrocyte* or h#emoglobin or serum ferritin*) S24 (MH "Iron") S23 (MH "Hemoglobins+") S22 (MH "Ferritin") S21 (MH "Anemia, Iron Deficiency") S20 S1 or S2 or S3 or S4 or S5 or S8 or S9 or S10 or S11 or S12 or S13 or S14 or S15 or S16 or S17 or S18 or S19 S19 (stock cube* or gravy cube* or bouillon* or instant noodle*) S18 (flake* or powder* or blend* or granule*) S17 ((condiment* or herb* or flavo#r* or sauce* or seasoning* or spice*) N3 (fortif* or enrich* or enhance*)) S16 (monosodium glutamate or MSG) S15 (tarragon or thyme or tu#meric or vanilla or wasabi or vinegar*) S14 (paprika or parsley or rosemary or sage or savory or sesame or sorrel) S13 (ma#joram or masala or mint or nutmeg or oregano) S12 (dill or fennel or fenugreek or garlic or ginger) S11 (coriander or cumin or Curcuma longa or cubeb or curry) S10 (achar or anise or basil or caper* or pepper* or cardamom or cinnamon or chilli* or chive* or clove*) S9 NaFeEDTA S8 S6 and S7 S7 fortif* S6 (MH "Iron") S5 ((salt or sodium chloride) N1 (diet* or table or common)) S4 ((fortif* or enrich* or enhance*) N3 (food* or iron*)) S3 (MH "Flavoring Agents") S2 (MH "Condiments+") S1 (MH "Food, Fortified")
Science Citation Index Expanded (SCI‐Exp), also run in Social Science Citation Index SSCI (via Web of Science) # 20 #19 AND #4 # 19 #18 OR #17 OR #16 OR #15 OR #14 OR #13 OR #12 OR #11 OR #10 OR #9 OR #8 OR #7 OR #6 OR #5 # 18 TS=("stock cube*" or "gravy cube*" or bouillon* or "instant noodle*") Databases=SCI‐EXPANDED Timespan=1980‐2020 # 17 TS=(flake* or powder* or blend* or granule*) Databases=SCI‐EXPANDED Timespan=1980‐2020 # 16 TS= ((condiment* or herb* or flavo*r* or sauce* or seasoning* or spice*) Near/3 (fortif* or enrich* or enhance*)) Databases=SCI‐EXPANDED Timespan=1980‐2020 # 15 TS=(monosodium glutamate or MSG) Databases=SCI‐EXPANDED Timespan=1980‐2020 # 14 TS=(tarragon or thyme or tu*meric or vanilla or wasabi or vinegar*) Databases=SCI‐EXPANDED Timespan=1980‐2020 # 13 TS=(paprika or parsley or pepper* or rosemary or sage or savory or sesame or sorrel) Databases=SCI‐EXPANDED Timespan=1980‐2020 # 12 TS=(ma*joram or masala or mint or nutmeg or oregano) Databases=SCI‐EXPANDED Timespan=1980‐2020 # 11 TS=(dill or fennel or fenugreek or garlic or ginger) Databases=SCI‐EXPANDED Timespan=1980‐2020 # 10 TS =(coriander or cumin or Curcuma longa or cubeb or curry) Databases=SCI‐EXPANDED Timespan=1980‐2020 # 9 TS=(achar or anise or basil or caper* or cardamom or cinnamon or chilli* or chive* or clove*) Databases=SCI‐EXPANDED Timespan=1980‐2020 # 8 TS=("NaFeEDTA") Databases=SCI‐EXPANDED Timespan=1980‐2020 # 7 TS= ((salt or "sodium chloride") Near/1 (diet* or table or common)) Databases=SCI‐EXPANDED Timespan=1980‐2020 # 6 TS=((condiment* or herb* or flavo*r* or sauce* or seasoning* or spice*) Near/3 (fortif* or enrich* or enhance*)) Databases=SCI‐EXPANDED Timespan=1980‐2020 # 5 TS=((fortif* or enrich* or enhance*) Near/3 (food* or iron*)) Databases=SCI‐EXPANDED Timespan=1980‐2020 # 4 #3 OR #2 OR #1 Databases=SCI‐EXPANDED Timespan=1980‐2020 # 3 TS=("iron deficien*") Databases=SCI‐EXPANDED Timespan=1980‐2020 # 2 TS= (" hemoglobin‐free erythrocyte*" or haemoglobin* or hemoglobin* or ferritin* ) Databases=SCI‐EXPANDED Timespan=1980‐2020 # 1 TS=(anemi* or anaemi* OR nonanemic or nonanaemic) Databases=SCI‐EXPANDED
POPLINE
(fortif* w3 iron*/ food* w3 enrich* / food* w3 enhance*/ food w3 fortif* / (achar / anise / basil / caper* / cardamom / cinnamon / chilli* / chive* / clove* / coriander / cumin / Curcuma longa / cubeb / curry / dill / fennel / fenugreek / garlic / ginger / marjoram / masala / mint / nutmeg / oregano paprika / parsley / pepper* / rosemary / sage / savory / sesame / sorrel / tarragon / thyme / turmeric / vanilla / wasabi / vinegar* / monosodium glutamate / MSG) / (salt* /sodium chloride) / NaFeEDTA / stock cube* / gravy cube* / bouillon* / instant noodle* / flake* / powder* / blend* / granule* / condiment* w3 fortif* / flavor* w3 fortif* / flavour* w3 fortif* /sauce* w3 fortif* / seasoning* w3 fortif* / spice* w3 fortif* /condiment* w3 enhanc* / flavor* w3 enhanc* / flavour* w3 enhanc* / sauce* w3 enhanc* / seasoning* w3 enhanc* / spice* w3 enhanc* /condiment* w3 enrich* / flavor* w3 enrich* / flavour* w3 enrich* /sauce* w3 enrich* / seasoning* w3 enrich* / spice* w3 enrich* ) & ( iron* deficien* / " hemoglobin‐free erythrocyte*" / haemoglobin* / hemoglobin* / ferritin* / anemi* / anaemi* / nonanemic / nonanaemic )
IBECS, PAHO, WHOLIS and LILACS ((MH:"Food, Fortified" OR NaFeEDTA OR monosodium OR MSG OR flake$ OR powder$ OR blend$ OR granule$ OR stock$ OR gravy$ OR bouillon$ OR noodle$ OR achar OR anise OR basil OR caper$ OR pepper$ OR cardamom OR cinnamon OR chilli$ OR chive$ OR clove$ OR coriander OR cumin OR Curcuma$ OR cubeb OR curry OR dill OR fennel OR fenugreek OR garlic OR ginger OR marjoram OR masala OR mint OR nutmeg OR oregano OR paprika OR parsley OR rosemary OR sage OR savory OR sesame OR sorrel OR tarragon OR thyme OR turmeric OR vanilla OR wasabi OR vinegar$ or ((condiment$ OR herb$ OR flavour$ OR flavor$ OR seasoning$ OR sauce$ OR spice$ OR salt$ OR food$ OR iron$ ) AND (fortif$ OR enhanc$ OR enrich$) ) ) AND (iron$ OR anemi$ OR anaem$ OR ferritin$ OR haemoglob$ OR hemoglob$ OR MH:"Anemia, Iron‐Deficiency"))
SciELO
(((condiment$ OR herb$ OR flavour$ OR flavor$ OR seasoning$ OR sauce$ OR spice$ OR salt$ OR food$ OR iron$ ) AND (fortif$ OR enhanc$ OR enrich$) ) [All indexes] or (NaFeEDTA OR monosodium OR MSG OR flake$ OR powder$ OR blend$ OR granule$ OR stock$ OR gravy$ OR bouillon$ OR noodle$ OR achar OR anise OR basil OR caper$ OR pepper$ OR cardamom OR cinnamon OR chilli$ OR chive$ OR clove$ OR coriander OR cumin OR Curcuma$ OR cubeb OR curry OR dill OR fennel OR fenugreek OR garlic OR ginger OR marjoram OR masala OR mint OR nutmeg OR oregano OR paprika OR parsley OR rosemary OR sage OR savory OR sesame OR sorrel OR tarragon OR thyme OR turmeric OR vanilla OR wasabi OR vinegar$)) [All indexes] and (anemi$ OR anaemi$ OR iron$ OR haemoglobin$ OR hemoglobin$ OR ferritin$ ) [All indexes]
WPRO, IMSEAR, AFRO and EMRO (GLOBAL INDEX MEDICUS)
29 #28 and #23
28 #27 or #26 or #25 or #24
27 Default:anemi% or anaemi% or iron deficien% or nonanaemic or nonanemic or haemoglobin‐free erythrocyte% or hemoglobin‐free erythrocyte% or haemoglobin% or hemoglobin% or ferritin%
26 MeSH Heading:Iron/All Categories/BL/DF
25 MeSH Heading:Ferritins/All Categories/BL/DF
24 MeSH Heading:Anemia, Iron‐Deficiency/All Categories/All Subheadings
23 #22 or #21 or #20 or #19 or #18 or #17 or #16 or #15 or #13 or #12 or #9 or #6 or #5 or #4 or #3 or #1
22 Default:stock cube% or gravy cube% or bouillon% or instant noodle
21 Default:flake% or powder% or blend% or granule%
20 Default:monosodium glutamate or MSG
19 Default:tarragon or thyme or turmeric or vanilla or wasabi or vinegar%
18 Default:paprika or parsley or rosemary or sage or savory or sesame or sorrel
17 Default:marjoram or masala or mint or nutmeg or oregano
16 Default:dill or fennel or fenugreek or garlic or ginger
15 #14 and #8
14 Default:condiment% or herb% or flavor% or flavour% or sauce% or seasoning% or spice%
13 Default:NaFeEDTA
12 (#11 and #10)
11 Default:fortif%
10 MeSH Heading:Iron/All Categories/All Subheadings
9 #8 and #7
8 Default:fortif% or enrich% or enhanc%
7 Default:food% or iron% or salt%
6 MeSH Heading:Flavoring Agents/All Categories/All Subheadings
5 MeSH Heading:Sodium Chloride, Dietary/All Categories/All Subheadings
4 MeSH Heading:Spices/All Categories/All Subheadings
3 MeSH Heading:Condiments/All Categories/All Subheadings
2 Default:Condiments
1 MeSH Heading:Food, Fortified/All Categories/All Subheadings
IndMED
( ((fortif$ or enrich$ or enhance$ ) AND (food$ or iron$ condiment$ or herb$ or flavo$ or sauce$ or seasoning$ or spice$ or salt$))) or ( ((fortif$ or enrich$ or enhance$ ) AND (achar or anise or basil or caper$ or cardamom or cinnamon or chilli$ or chive$ or clove$ or coriander or cumin or Curcuma$ or cubeb or curry or dill or fennel or fenugreek or garlic or ginger or marjoram or masala))) or ( ((fortif$ or enrich$ or enhance$ ) and (mint or nutmeg or oregano or paprika or parsley or pepper$ or rosemary or sage or savory or sesame or sorrel or tarragon or thyme or turmeric or vanilla or wasabi or vinegar$ or monosodium or MSG)))
Native Health Database
fortif*+ food* +iron*
clinicaltrials.gov
(iron and fortification)
International Clinical Trials Registry Platform
(iron and fortification)
Food Science and Technology Abstracts (FSTA)
1. DE=(FOOD ENRICHMENT)
2. DE=(FLAVOURINGS)
3. TS=((fortif* OR enrich or enhance*) NEAR/3 (food* OR iron))
4. TS=((salt OR "sodium chloride") NEAR (diet* OR table OR common))
5. DE=(IRON) and TS=fortif*
6. TS=NaFeEDTA
7. TS=(achar OR anise OR basil OR caper OR pepper OR cardamom OR cinnamon OR chilli OR chives OR clove* OR coriander OR cumin OR "Curcuma longa" OR cubeb OR curry OR dill OR fennel OR fenugreek OR garlic OR ginger OR marjoram OR masala OR mint OR nutmeg OR oregano OR paprika OR parsley OR rosemary OR sage OR savory OR sesame OR sorrel OR tarragon OR thyme OR turmeric OR vanilla OR wasabi OR vinegar* OR MSG OR "monosodium glutamate")
8. TS=((condiment* OR seasoning* OR flavo$r* OR sauce* OR spice* OR herb*) NEAR/3 (fortif* OR enrich* OR enhance*))
9. TS=(flake* OR powder* OR blend* OR granule*)
10. TS=("Stock cube*" OR "gravy cube*" OR bouillon* OR "instant noodle")
11. #1 OR #2 OR #3 OR #4 OR #5 OR #6 OR #7 OR #8 OR #9 OR #10
12. TS=(an$emi* OR “iron deficien*” OR nonan$emic OR “h$emoglobin‐free erythrocyte*” OR haemoglobin OR h$emoglobin OR ferritin*)
13. 11 AND 12
Data and analyses
Comparison 1. Condiments/seasonings fortified with iron versus unfortified condiments/seasonings.
| Outcome or subgroup title | No. of studies | No. of participants | Statistical method | Effect size |
|---|---|---|---|---|
| 1.1 Anaemia (defined as haemoglobin below WHO cut‐off for age and adjusted for altitude as appropriate) | 4 | 2328 | Risk Ratio (M‐H, Random, 95% CI) | 0.34 [0.18, 0.65] |
| 1.2 Haemoglobin concentration (g/L) | 5 | 2808 | Mean Difference (IV, Random, 95% CI) | 6.40 [‐0.62, 13.41] |
| 1.3 Iron deficiency (as defined by the trialists based on a biomarker of iron status) | 2 | 391 | Risk Ratio (M‐H, Random, 95% CI) | 0.33 [0.11, 1.01] |
| 1.4 Ferritin concentration (µg/L) | 6 | 4459 | Mean Difference (IV, Random, 95% CI) | 14.81 [5.14, 24.48] |
| 1.5 Soluble transferrin receptor | 2 | 537 | Mean Difference (IV, Random, 95% CI) | ‐0.36 [‐3.19, 2.47] |
Comparison 2. Condiments/seasonings fortified with iron plus other micronutrients versus condiments/seasonings fortified with other micronutrients except iron.
| Outcome or subgroup title | No. of studies | No. of participants | Statistical method | Effect size |
|---|---|---|---|---|
| 2.1 Anaemia (defined as haemoglobin below WHO cut‐off for age and adjusted for altitude as appropriate) | 4 | 1007 | Risk Ratio (M‐H, Random, 95% CI) | 0.59 [0.40, 0.89] |
| 2.2 Haemoglobin concentration (g/L) | 5 | 1270 | Mean Difference (IV, Random, 95% CI) | 6.22 [1.60, 10.83] |
| 2.3 Iron deficiency | 4 | 1154 | Risk Ratio (M‐H, Random, 95% CI) | 0.36 [0.19, 0.69] |
| 2.4 Ferritin concentration (µg/L) | 5 | 1251 | Mean Difference (IV, Random, 95% CI) | 10.63 [2.40, 18.85] |
| 2.5 Soluble transferrin receptor | 4 | 1138 | Mean Difference (IV, Random, 95% CI) | ‐7.09 [‐17.10, 2.91] |
| 2.6 Body iron | 2 | 594 | Mean Difference (IV, Random, 95% CI) | 1.48 [0.73, 2.22] |
| 2.7 Iron deficiency anaemia in children 2 to 11.9 years | 2 | 777 | Risk Ratio (M‐H, Random, 95% CI) | 0.30 [0.20, 0.45] |
Characteristics of studies
Characteristics of included studies [ordered by study ID]
Andersson 2008.
| Study characteristics | ||
| Methods | RCT with three arms and households randomised. | |
| Participants | The trialists included 458 children in the age group of 5‐18 years from 6 schools in 18 villages. After their inclusion into the trial, the trialists followed them up in 364 households. Those households were located in a predominant agrarian population, in Anekal Taluk, Bangalore Urban District, Karnataka State, India. | |
| Interventions | The intervention included salt as condiment. Salt added to family meals of intervention groups which included 151 children who received iron as micronized ground ferric pyrophosphate along with iodine as KIO3, 3 0 ug I / g salt), 155 children who received iron in the form of encapsulated, agglomerated ferrous fumarate along with iodine as KIO3, 30 ug I / g salt and 152 children who received the iodised salt (with KIO3 (30 ug I / g salt)) only in their family meals for 12 months. | |
| Outcomes | Anaemia, iron deficiency and iron deficiency anaemia, haemoglobin, serum ferritin, Zn protoporphyrin, transferrin receptor, CRP, and urinary iodine at 5 months and 10 months. | |
| Notes | When baseline comparisons were significant (SF and body iron), baseline values were used as co‐variates in other analyses.
Source of funding: The Micronutrient Initiative (Ottawa), the Swiss Federal Institute of Technology (Zurich), and St. John's National Academy of Health Sciences. The MGFePP (iron fortification compound) was provided by Paul Lohmann GmbH KG (Emmerthal, Germany), and the encapsulated ferrous fumarate (EFF) was donated by the Micronutrient Initiative. |
|
| Risk of bias | ||
| Bias | Authors' judgement | Support for judgement |
| Random sequence generation (selection bias) | Unclear risk | No report on random sequence generation although the participant were randomly assigned by households to either of the groups. |
| Allocation concealment (selection bias) | Unclear risk | Not described. However, three types of salts were randomly assigned 3 different colour codes and kept by an investigator who was not involved in the study |
| Similarity of baseline outcome assessment (Selection bias) | Low risk | Significant difference between groups in SF and body iron status. These differences in baseline was adjusted by adding them as co‐variates in the analyses. No between‐group difference in all other outcomes. |
| Similarity of baseline characteristics (selection bias) All outcomes | Low risk | No significant difference between groups. |
| Incomplete outcome data (attrition bias) All outcomes | Low risk | 12.5% children dropped out of the study by the end of 10 month. Of the participants randomised to a group, the following percentages completed follow up: Iodized salt only = 86.8%, MGFePP = 83.9%, EFF = 92.1%. Attrition was primarily due to migration, school dropout and final school examinations |
| Blinding (performance bias and detection bias) All outcomes | Low risk | Both investigators and households were blinded. However, there is no report on blinding of providers. |
| Contamination (possible performance bias) | Low risk | No significant change in colour, taste, or odour as impetus for households to switch between interventions. Two field workers were based in the villages to ensure supply. |
| Selective reporting (reporting bias) | Low risk | Study reported on all participants (except 12.5% attrition) and on all relevant indicators. CRP was not reported, but they do report that there was no difference in prevalence of elevated CRP values between the 3 intervention groups at any time point. |
| Other bias | Unclear risk | There was no information on diet or other factors that may change outcome. |
Asibey‐Berko 2007.
| Study characteristics | ||
| Methods | Double‐blind randomised control trial (randomisation at individual level) | |
| Participants | The trialists included dyads of women aged 15‐45 years who were non‐pregnant, and non‐lactating, along with their children aged 1‐5 years in the Sekyere West District of Ghana. | |
| Interventions | The study included two intervention groups with Iodized salt plus 70 mg Fe supplement and double‐fortified salt (DFS) plus placebo and a control group which received iodised salt plus placebo. | |
| Outcomes | Anaemia, iodine deficiency, haemoglobin, urinary iodine concentration at 8 months | |
| Notes |
Source of funding: The Micronutrient Initiative, Ottawa, Canada |
|
| Risk of bias | ||
| Bias | Authors' judgement | Support for judgement |
| Random sequence generation (selection bias) | Unclear risk | No report on generation of random sequence although the participants were randomly assigned to either of the groups |
| Allocation concealment (selection bias) | Unclear risk | Allocation process is not clearly reported. Color code was used however. |
| Similarity of baseline outcome assessment (Selection bias) | Low risk | No significant difference between groups |
| Similarity of baseline characteristics (selection bias) All outcomes | Unclear risk | Not clearly specified what baseline characteristics data were collected. Only age was reported which was similar in both groups |
| Incomplete outcome data (attrition bias) All outcomes | High risk | High attrition. Women: 39% in DFS group and 42% in IS. Children: 44% in DFS and 56% in IS. |
| Blinding (performance bias and detection bias) All outcomes | Low risk | All subjects, providers, technicians and data analysts were blinded to the group assignment. Not specifically mentioned if the investigators were blinded. |
| Contamination (possible performance bias) | Unclear risk | Well supervised study but not enough information provided to exclude contamination. No report on the organoleptic, and physical characteristics, which if different between groups, might have caused switching between intervention. |
| Selective reporting (reporting bias) | Low risk | There is no report on whether there were differential dropout characteristics. All intended outcomes were reported. Does not report on how much blood was collected and whether or not biochemical indicators other than Hb was tested for although did test for malarial parasite and sickle cells. |
| Other bias | Unclear risk | There was no information on diet or other factors that might have changed outcomes. Random assignment may have controlled for that. No change in pre‐specified effect size. No apparent reason to believe that the intervention affected data collection. |
Ballot 1989a (C).
| Study characteristics | ||
| Methods | Cluster‐randomised trial (families randomised and double‐blinded). | |
| Participants | This trial included 264 families with 984 individuals, from Indian descent in Chatsworth, near Durban, South Africa. The trialists excluded children aged less than 10 years for feasibility reasons and they included those individuals aged 10 years and above. | |
| Interventions | Intervention group included 135 families, who received NaFeEDTA‐fortified curry powder (masala) for addition to family meals and control group consisted of 129 families, who received placebo (unfortified) masala for addition to family meals. | |
| Outcomes | Transferrin % Saturation, Haemoglobin (Hb), and serum ferritin (SF), body Fe stores, serum zinc concentration at 1 and 2 years. | |
| Notes | We made adjustment for design effect for this CRT and presented the outcomes; anaemia, haemoglobin concentration and iron deficiency. The trial included 984 individuals from 264 families; which gave the mean cluster size of 3.7. Trial did not report an ICC; we computed the design effect as 1.054, considering ICC = 0.02 from Adams 2004 study, for the variable "haemoglobin", adjusted for baseline characteristics. Based on this design effect we calculated the effective sample size. For reporting haemoglobin concentration, only the total number of participants was adjusted to 241 (from n = 254) in the intervention arm and to 238 (from n = 251) in the control arm.
Source of funding: Joint University/MRC Iron and Red Cell Metabolism Unit, Department of Medicine, University of Witwatersand Medical School (Johannesburg) and the Department of Medicine, University of Natal, Durban, South Africa |
|
| Risk of bias | ||
| Bias | Authors' judgement | Support for judgement |
| Random sequence generation (selection bias) | Low risk | Computer‐generated random numbers into fortified (135 families) and control (129 families) groups. |
| Allocation concealment (selection bias) | Unclear risk | Number coded packages of masala were distributed. Packaging was done by the manufacturer. Not specified if the distribution was done by allocation concealment |
| Similarity of baseline outcome assessment (Selection bias) | Low risk | Used t‐tests to find similarity. No significant difference between groups found in any of the indicators except serum ferritin in males. |
| Similarity of baseline characteristics (selection bias) All outcomes | Low risk | The fortified and unfortified groups were matched for age, parity, duration of menstruation, income, alcohol consumption, and initial Fe status |
| Incomplete outcome data (attrition bias) All outcomes | Unclear risk | Dropout after 2 years was 28% (267 out of 672). Reasons for dropout: 129 moved away, 115 refused to participate and 23 died. No report on why 115 refused to participate. 264 families were randomised. |
| Blinding (performance bias and detection bias) All outcomes | Low risk | Both investigators and households were blinded. Providers were likely blinded although not specifically mentioned. The coded bags came from the manufacturers. Not specified who distributed the masala. |
| Contamination (possible performance bias) | Low risk | Both groups taken from the same area. However, monitoring of masala quality was done regularly. Eight of the fortified families and four of the unfortified families were found in single episodes to be using the incorrect form of masala. |
| Selective reporting (reporting bias) | Unclear risk | Out of the 672 participants who were reported to remain have remained till the end of the study, 598 had iron deficiency data at baseline and 505 had both baseline and endline. No information on the ‘n’ for other variables (Iron status indicator) has been given explicitly. |
| Other bias | Unclear risk | To monitor errors in distribution, random samples (0.5 mL) of masala were taken from both the manufacturer and individual households at regular intervals and checked for their Fe content. There was no information on diet or other factors that may have changed outcome. Random assignment may have controlled that factor. No change in pre‐specified effect size ~1 mmol Fe. No apparent reason to believe that the intervention affected data collection. |
| Recruitment bias | Low risk | The cluster were recruited into the trial and then they were randomised to receive the respective interventions. |
| Baseline imbalance | Low risk | Both groups were taken from the same area to minimize iron level variation due to geographical locations. Baseline levels of iron deficiency anaemia were comparable across the intervention and control groups. |
| Loss of clusters | Unclear risk | Authors report "after 2 y of fortification, 672 subjects remained in the study. A total of 267 subjects dropped out of the study: 129 moved away from the area, 115 refused to participate further, and 23 died. There were no significant differences in the number or category of dropouts between the fortified and unfortified groups" |
| Incorrect analysis | High risk | The cluster effects were not taken into account at the analysis stage. |
| Compatibility with individual RCT | High risk | The unit of randomisation could have effects on the results of intervention and the trial has not accounted for the same. |
Chen 2005 (C).
| Study characteristics | ||
| Methods | RCT with randomisation at village level and double‐blinded. | |
| Participants | The trialists randomly assigned nine villages in the Haizijie Region, China to two groups: one received iron fortified soy sauce and the control group received unfortified soy sauce. Study participants were all individuals aged 3 years and above. There were close to 14,000 people aged 3 years and above living in 3,000 households in the study villages. Trialists divided the population to keep the number of individuals in two groups similar. Four villages with 6,332 residents were assigned to control group and five villages with 7684 residents was assigned to intervention group. Final sampling unit was schools and through selected children the trialists reached out the family to meet the required sample size. | |
| Interventions | The fortified group was provided with NaFeEDTA‐fortified soy sauce and the control group with unfortified soy sauce. The fortification was done at a level of 29.6 mg of iron per 100 mL as NaFeEDTA. | |
| Outcomes | Dietary iron intake, weight‐for‐age, weight‐for‐height, height‐for‐age, prevalence of anaemia, haemoglobin concentration, plasma ferritin, plasma retinol at 6, 12, and 18 months | |
| Notes | We made adjustment for design effect for this CRT and presented the outcomes; anaemia, haemoglobin concentration and iron deficiency.The trial included a total of 9 villages; however sampling was done at school level. Since there was no mean cluster size or ICC reported, we computed the effective sample size using the ICC as 0.02 from Adams 2004 study, for the variable "haemoglobin", adjusted for baseline characteristics. Mean cluster size was taken as 59 from Gulliford 1999. Based on these we calculated the design effect as 2.16. For anaemia, in the intervention arm receiving the fortified soy‐sauce, sample size adjust was made to 147 (from n = 347) out of 853 (from n=1842) and in the control arm, effective sample size was estimated to be 283 (from n=611) 844 (from n=1824) participants. For anaemia among males, the effective sample size was 67 (from n=144) out of 403 (from n=870) in the intervention arm and 125 (from n=269) out of 422 (from n = 911) in the control arm. For females, it was calculated to be 80 (from n=173) out of 449 participants (from n=972) in the intervention arm and 158 (from n = 342) out of 423 (from n = 913) participants in the control arm. For haemoglobin concentration, the total number of participants was adjusted in both the arms and mean (SD) values as reported by the trialists were used in the analyses. The total number of participants in fortification group was adjusted to 853 from 1842 and in control arm, it was 844 from 1824 participants.
Source of funding: The Micronutrient Initiative, Ottawa, Canada. |
|
| Risk of bias | ||
| Bias | Authors' judgement | Support for judgement |
| Random sequence generation (selection bias) | High risk | Not reported about generation of random sequence. Randomization process is not very clear. No sampling frame was created. Method states, 'The two groups of villages were evenly distributed on either side of a small road’, which gives rise to bias in random assignment also. |
| Allocation concealment (selection bias) | High risk | Not reported. However, the statement ‘The two groups of villages were evenly distributed on either side of a small road’ is contradictory to the allocation concealment. |
| Similarity of baseline outcome assessment (Selection bias) | Low risk | No significant difference between groups |
| Similarity of baseline characteristics (selection bias) All outcomes | Unclear risk | Not reported |
| Incomplete outcome data (attrition bias) All outcomes | Low risk | 6‐14% drop out rate over the course of 18 months. |
| Blinding (performance bias and detection bias) All outcomes | Unclear risk | Study claims ‘double‐blinded’. However, no report on in the method or elsewhere as to who was blinded and how blinding was done. |
| Contamination (possible performance bias) | Unclear risk | Insufficient information to conclude if there was any contamination. |
| Selective reporting (reporting bias) | Low risk | Study reported on all participants (except 6‐14% attrition) and on all relevant indicators. |
| Other bias | Unclear risk | No information on diet or other factors that may have changed outcome. No apparent reasons to believe that the intervention affected data collection. |
| Recruitment bias | Low risk | The trialists identified the villages and after recruiting them, the clusters in the form of villages were assigned respective interventions. |
| Baseline imbalance | Low risk | The sampling units (schools in the selected villages) and population covered by them were similar. |
| Loss of clusters | Unclear risk | The trialists quote "The numbers of subjects in the various subgroups were reduced slightly during the subsequent follow‐up. For example, the dropout rate for haemoglobin assays was 14% in the fortified group as a whole and 6% in the control group during the 18 months of intervention. The main reasons for dropping out were that some subjects were not available at the time of follow‐up examinations or were working out of town." |
| Incorrect analysis | High risk | The effect of clusters on overall analysis was not taken into account at the analysis stage. |
| Compatibility with individual RCT | Unclear risk | The sampling unit is the school in the study village; however once sampling was done, individuals belonging to selected child's family were included and the further analyses were carried out at individual level. |
Chen Ke 2008.
| Study characteristics | ||
| Methods | Double‐blind RCT. | |
| Participants | This RCT was conducted among 226 preschool children aged 2 to 6 years in three randomly selected nurseries in Banan District, a suburb of Chongqing, China. The children were eligible if they were apparently healthy, Hb concentration 60 g/L or more,C‐reaction protein (CRP) less than 10 mg/L, parental or guardian approval of full participation in all aspects of the study and parental/guardian agreeing to avoid the additional use of vitamin and mineral supplements during the trial. Children with recent, acute or chronic illnesses with or without Hb less than 60 g/L were excluded. | |
| Interventions | The trialists divided the study population into 3 intervention groups: 1: diet fortified with vitamin A plus iron; 2: diet fortified with vitamin A plus iron, thiamine, riboflavin, folic acid, niacinamide, zinc, and calcium and 3: Control group, who received diet fortified with vitamin A | |
| Outcomes | Haemoglobin, serum ferritin, height‐for‐age and weight‐for‐age, adverse effects (diarrhoea, vomiting and nausea), serum retinol, retinol‐binding protein at 6 months | |
| Notes |
Source of funding: Sight and Life Rearch Institute, a humanitarian initiative of DSM. |
|
| Risk of bias | ||
| Bias | Authors' judgement | Support for judgement |
| Random sequence generation (selection bias) | Unclear risk | Not reported about generation of random sequence although the participants were randomly assigned to either of the groups |
| Allocation concealment (selection bias) | High risk | No concealment. Participants and caregivers also knew which groups the belonged to. |
| Similarity of baseline outcome assessment (Selection bias) | Low risk | No significant difference between groups in outcome assessment at baseline. |
| Similarity of baseline characteristics (selection bias) All outcomes | Low risk | No significant difference between groups in socio‐demographic characteristics except age. |
| Incomplete outcome data (attrition bias) All outcomes | Low risk | The study reported on their main outcomes. Dropout rate was 19% (56 out of 282). |
| Blinding (performance bias and detection bias) All outcomes | High risk | Study reported, “The investigators, food preparers, teachers, outcome assessors, and children were not made aware of the intervention assignment for the duration of the study”. |
| Contamination (possible performance bias) | Low risk | Given the chef knew about which group received which seasoning and the caregivers and supervisors knew which group they belonged to, it is likely that there might have been impetus for switching between interventions. No report on change in colour, taste, or acceptability of food which could be a factor for contamination. However, close monitoring of the feeding may have prevented contamination. “Distribution and consumption of the package took place under close supervision; children were not allowed to leave the classroom or return to their original seats before they had finished eating their package. Information on the acceptability of the seasoning powder was obtained by a short questionnaire administered at the 6‐mo assessment.” |
| Selective reporting (reporting bias) | Low risk | Study reported on all participants (except 19% attrition) and on all relevant indicators. |
| Other bias | Unclear risk | Clustered design but not clustering effect not accounted for in the sample size calculation. No report on dietary behavior at the household level. |
Haas 2014.
| Study characteristics | ||
| Methods | RCT with randomisation at individual level | |
| Participants | The trial included 281 adult female residents of the Panighatta tea estate in Darjeeling District of India (in northern part of Indian State of West Bengal). Following the baseline analysis, 36 participants were excluded; 245 women continued in the study. The included women in this trial belonged to age group of 18 and 55 years, healthy, and not pregnant. They belonged to either Nepali or Adivasi ethnic group. | |
| Interventions | The trial included two groups; 1. Intervention group: Double fortified salt (with iron and iodine) ‐ DFS containing 47 mg/kg of potassium iodate and 3.3 mg of microencapsulated ferrous fumarate (1.1‐mg elemental iron) per gram of salt and 2. Control group received salt fortified with iodine only | |
| Outcomes | Anaemia, haemoglobin concentration, Iron deficiency, serum ferritin, Soluble transferrin receptor, body iron, MCV, serum vitamin B‐12, serum folate, CRP, AGP, urinary iodine at end line | |
| Notes |
Source of funding: The Micronutrient Initiative, Ottawa, Canada |
|
| Risk of bias | ||
| Bias | Authors' judgement | Support for judgement |
| Random sequence generation (selection bias) | Unclear risk | Not reported on generation of random sequence. However, the participants were randomly assigned to either of the groups |
| Allocation concealment (selection bias) | Unclear risk | Trialists reported that four colour codes used for 2 intervention to conceal allocation. |
| Similarity of baseline outcome assessment (Selection bias) | Low risk | No significant difference observed between groups |
| Similarity of baseline characteristics (selection bias) All outcomes | Low risk | No difference between groups in mean age, height, BMI, and MUAC. |
| Incomplete outcome data (attrition bias) All outcomes | Low risk | 13% (n=33 out of 245) lost to follow up which is less than the predicted attrition rate of 25%. Distribution of losses between groups is not specified. |
| Blinding (performance bias and detection bias) All outcomes | Low risk | Both investigators and households were blinded. Color coding also blinded the providers. However, there is no report on blinding of providers or outcome assessors |
| Contamination (possible performance bias) | Low risk | Providers and households were blinded. Also, no other salt was sold on the tea estate during the study period. Less chance for households to switch between interventions |
| Selective reporting (reporting bias) | Low risk | Study reported on all participants and all relevant outcome indicators. |
| Other bias | Low risk | Regression models were used to account for the confounders, such as diet (vegetarian vs. non‐vegetarian), ethnicity (Adivasi vs. Nepali), BMI, MUAC, and socioeconomic indicators. No change in pre‐specified effect size. No apparent reason to believe that the intervention affected data collection. |
Huo 2002.
| Study characteristics | ||
| Methods | Described as a randomised study, but it appeared that all children in the same school received the same intervention. 3 arms, 1 school in each arm. | |
| Participants | 304 children attending 3 residential schools aged 11 to 17 years. Only students with diagnosed anaemia were included in the study. Setting: Wancheng District, Nanyang City, Henan Province, China. Anaemia: all children recruited to the study were anaemic at baseline. Background prevalence of anaemia: 11% to 22.6% in the three schools. Malaria prevalence: not reported. |
|
| Interventions | Fortified soy sauce added to school meals (supervised) and the trialists included three intervention groups: 1. 102 pupils (39 boys and 63 girls) NaFeEDTA fortified soy sauce (lower dose 5 mg Fe per day/ 1mg Fe per mL sauce) 5 mg Fe per day as part of soy sauce. 2. 100 (61 boys, 39 girls) NaFeEDTA fortified soy sauce (higher dose 20 mg Fe per day/ 4 mg Fe per mL sauce) 20 mg Fe per day as part of soy sauce, and 3. Control group, with 102 (55 boys, 47 girls) children receiving unfortified soy sauce. |
|
| Outcomes | Anaemia, mean haemoglobin, serum iron, serum ferritin, transferrin, free erythrocytic porphyrin, and total iron binding capacity at 1, 2, and 3 months. | |
| Notes | The three schools included in this study appear to be different at baseline. The sex composition of the sample in each group was very different at baseline.
Source of funding: not stated |
|
| Risk of bias | ||
| Bias | Authors' judgement | Support for judgement |
| Random sequence generation (selection bias) | Unclear risk | Not reported on generation of random sequence although the participants were randomly assigned to either of the three groups |
| Allocation concealment (selection bias) | High risk | No information about concealing allocation by any mean. |
| Similarity of baseline outcome assessment (Selection bias) | Low risk | As reported by the trialists, there was no significant difference in the anaemia levels between groups (control 13.5%, low dose iron group 22.6% and higher dose iron 11% anaemic and reported p>0.05). |
| Similarity of baseline characteristics (selection bias) All outcomes | Unclear risk | Study reports ‘The subjects had similar living standards and dietary patterns’ but provides no evidence of similarity of living standard. |
| Incomplete outcome data (attrition bias) All outcomes | Unclear risk | In three month, 21% dropped out of the study without any reasons for dropout. All relevant information reported. |
| Blinding (performance bias and detection bias) All outcomes | High risk | Not blinded |
| Contamination (possible performance bias) | Unclear risk | No monitoring of the intervention reported. Insufficient information to conclude if there was any contamination. Given the study was not blinded, and that the products/allocation was not concealed, there may have been contamination. The study did not report on changes in colour, taste, or acceptability as impetus for households to switch between interventions. |
| Selective reporting (reporting bias) | Low risk | Study reported on all participants (except 21% attrition) and on all relevant indicators. No report on the reasons for dropout. |
| Other bias | High risk | Study reported on participant’s diet, but not other factors that might have changed outcome. The trialists have not declared the source of funding. The producer of Soy sauce is mentioned (Beijing Huwang Wadakan® Food Company) |
Longfils 2008.
| Study characteristics | ||
| Methods | RCT, 3 arms with individual randomisation | |
| Participants | School aged children and young adults attending primary and high schools aged between 6‐21 years (62 male and 78 female students). Socio‐economic status of participants was unclear, although it was stated that only wealthy families were able to afford to send their daughters to high school, so female high school pupils may have been of higher socio‐economic status. Setting: Two schools (a high school and a primary school) in the Chhuk district (Kampot Province) of Cambodia. 140 participants were included in the study. Of them, 137 remained (placebo ‐unfortified fish sauce = 44; FeSo4+citrate fortified fish sauce = 47; NaFe‐EDTA fortified fish sauce = 46) Anaemia prevalence: all children enroled in the study had iron deficiency anaemia (7% of high school and 13% of primary school children screened). (Background prevalence of anaemia reported in children 57%). Malaria prevalence: not stated |
|
| Interventions | Endogenous iron content of all fish sauce was 86±8 mg/L. Trialists divided the study population into the following Intervention groups. Group 1:Fortified fish sauce. FESO4+citrate fortified sauce (10 mg Fe/day to 10mL of sauce added to meal). Group 2:Fortified fish sauce. NaFe‐EDTA fortified sauce (10 mg Fe/day to 10mL of sauce added to meal) Control: Placebo fish sauce with no fortification The interventions were given for a duration of 21 calendar weeks for 6 days per week (114 dosing days). |
|
| Outcomes | Main outcomes: haemoglobin and serum ferritin concentrations; secondary outcomes: CRP concentration, anthropometric status; morbidity [monitoring of adverse effects]: acute respiratory infection [ARI], vomiting and diarrhoea (as rates per 1000) after 10.5 and 21 weeks. | |
| Notes |
Source of funding: FSNPSP‐GTZ in collaboration with ILSI and RACHA. |
|
| Risk of bias | ||
| Bias | Authors' judgement | Support for judgement |
| Random sequence generation (selection bias) | Unclear risk | Random assignment was done but the process of random assignment not reported |
| Allocation concealment (selection bias) | Unclear risk | No information on allocation concealment. No information on colour coding or any other coding. |
| Similarity of baseline outcome assessment (Selection bias) | Low risk | No difference in baseline haemoglobin between control and experimental groups. |
| Similarity of baseline characteristics (selection bias) All outcomes | Low risk | Not reported. However, children of the same schools were randomly assigned to 3 different groups. Therefore, all groups were likely to be of similar SES. |
| Incomplete outcome data (attrition bias) All outcomes | Low risk | Only 3 females (2.2%) dropped out of the study. Outcome measures available from all remaining students. |
| Blinding (performance bias and detection bias) All outcomes | Unclear risk | The study is reported to be double‐blinded. However, it is not clear how blinding was done, who was blinded or at what level. |
| Contamination (possible performance bias) | Unclear risk | Compliance was monitored closely. Therefore contamination was less likely. However, there is no information about how the participants and the providers were blinded. No report on change in colour, taste, or acceptability which would as impetus for households to switch between interventions |
| Selective reporting (reporting bias) | Low risk | Study reported on all participants (except 2% attrition) and on all relevant indicators. |
| Other bias | Low risk | Schools were not residential. However, the study recorded weekly consumption by participants at households. Compliance with intervention was monitored. Insufficient information to determine if the intervention affected data collection. Pre‐specified effect size changed. |
Nadiger 1980.
| Study characteristics | ||
| Methods | Controlled before‐after study. | |
| Participants | A total of 546 children aged 5 to 15 years from four residential schools (two boys' and two girls' schools) were the participants in this study, in Hyderabad, India. Two boys' schools (one a school for juvenile offenders as an intervention school and the other an orphanage as control) and two girls' schools (one a school for juvenile offenders as control and the other a residential school as an intervention school) included 222 boys and 161 girls in the experimental group and 92 boys and 71 girls in the control group. They were followed up for 12 months and 97 boys in the intervention group and 54 boys in the control group were followed up for a further 6 months. |
|
| Interventions | Schools were supplied with fortified salt (Ferric orthophosphate + sodium hydrogen sulphate) for cooking (these were residential schools, so children ate only foods provided by the schools). Intervention group: Iron‐fortified salt used in cooking. Approximately 15 mg Fe daily. Control group: unfortified salt. Duration: 12 to 18 months. |
|
| Outcomes | Haemoglobin (mean, distribution); anaemia (Hb < 120 g/L) (Packed cell volume [PCV] was measured, but values not presented) after 1 year. | |
| Notes |
Source of funding: Not reported |
|
| Risk of bias | ||
| Bias | Authors' judgement | Support for judgement |
| Random sequence generation (selection bias) | High risk | Not applicable as the study was not an RCT. Schools were purposively selected. All children selected from each school received the same intervention. No information on how these children were selected. |
| Allocation concealment (selection bias) | High risk | No concealment of allocation as the schools were purposively selected. |
| Similarity of baseline outcome assessment (Selection bias) | High risk | Significant difference between groups in girls but not in boys. Prevalence of anaemia in girls was significantly different. No report on controlling for baseline values during analysis. |
| Similarity of baseline characteristics (selection bias) All outcomes | High risk | The comparison schools were different from the experimental schools. Boys: ‘Certified school’ for reforming juvenile criminals vs. orphanage. Girls: ‘Certified school’ vs. residential school. The inmates of the residential school came from families with a slightly better socio‐economic background. In Boys, the ‘certified school’ was chosen as experimental and the orphanage as the control. On the other hand, in girls, the residential school was chosen as experimental and the ‘certified school’ as control. No other baseline characteristics reported |
| Incomplete outcome data (attrition bias) All outcomes | Unclear risk | As reported by the trialists, 1080 boys and 565 girls were registered for the study. No information provided on how the study had 314 boys and 232 girls (33.2% attrition) for follow up. |
| Blinding (performance bias and detection bias) All outcomes | High risk | Participants are not reported to be blinded. Outcome providers are not reported to be blinded. Outcome assessors are not reported to be blinded |
| Contamination (possible performance bias) | Low risk | Interventions were school specific and inmates were not allowed eat outside. Not likely to have contamination although unethically, the study did take measured to control contamination |
| Selective reporting (reporting bias) | High risk | No information on why 66.8% of students were chosen to be followed up. It appears that they are the ones who had both measures (it would have been surprising to have no dropouts among 546 subjects over a period of one year). Characteristics of dropouts not mentioned. The PCV values were not reported. |
| Other bias | High risk | Though, the dietary patterns of the study participants were assessed, inherent differences other than demographic characteristics reported in the study across the participants were likely to influence the results. The trialists have reported the supports received in carrying out the study. Specific sources of funding is not mentioned. |
Thuy 2003a.
| Study characteristics | ||
| Methods | RCT with double blinding | |
| Participants | Female factory workers aged between 1 to ‐49 years from Hai Duong and Hung Yen provinces, located in the Red River delta of northern Vietnam were recruited in this study. | |
| Interventions | Only anaemic women who met the inclusion criteria were randomly divided into 2 groups: Intervention group: received daily 10 mL of fish sauce fortified with 10 mg Fe, control group received daily 10 mL of unfortified fish sauce. | |
| Outcomes | Anaemia, haemoglobin concentration, iron deficiency, serum ferritin, soluble transferrin saturation, soluble transferrin receptor, ferritin index, and IDA after 3 and 6 months | |
| Notes |
Source of funding: The Nippon Foundation through the support of Project IDEA (Iron Deficiency Elimination Action) of the International Life Scienes Institute Centre for Health Promotion |
|
| Risk of bias | ||
| Bias | Authors' judgement | Support for judgement |
| Random sequence generation (selection bias) | Unclear risk | Not reported how random sequence was generated. The trialists mentioned that women meeting inclusion critera were 'randomly' divided into two intervention groups. |
| Allocation concealment (selection bias) | High risk | Insufficient evidence to conclude if allocation was concealed |
| Similarity of baseline outcome assessment (Selection bias) | Low risk | No significant difference between groups in any of the outcome indicators |
| Similarity of baseline characteristics (selection bias) All outcomes | Low risk | No significant difference between groups |
| Incomplete outcome data (attrition bias) All outcomes | Low risk | 8 Children out of 72 dropped in the iron fortified group. Reasons for dropout not reported |
| Blinding (performance bias and detection bias) All outcomes | High risk | Study claims to be a double‐blinded one. However no information on blinding is provided |
| Contamination (possible performance bias) | Low risk | Contamination was unlikely as the compliance was strictly monitored. |
| Selective reporting (reporting bias) | Low risk | Study reported on all participants (except 8 dropouts) and outcomes. |
| Other bias | Unclear risk | Compliance was monitored periodically. A 24‐hr recall survey was administered at baseline and endline. No change in pre‐specified effect size. Dropouts only occurred in the intervention group. There may have been change in color, taste, or acceptability which could have led to the dropouts. No apparent reason to believe that the intervention affected data collection. |
Thuy 2005 (C).
| Study characteristics | ||
| Methods | Double‐blind cluster‐RCT (randomised at the level of 21 villages). | |
| Participants | Women of child bearing age (n = 576) from 21 villages were the study participants. The study was conducted over 18 months (2001‐3) Setting: 21 villages in 2 communes in the Nam Dinhprovince in the Red River Delta region of Vietnam. Villages were randomised, but outcome data were collected on women of childbearing age (16 to 49 years). Anaemia prevalence: approximately 25% at baseline. ID at baseline in women of childbearing age was approximately 22%. Malaria prevalence: not stated (high rates of parasitic infection). Villages were randomised, but outcome data were collected only for women of childbearing age (16 to 49 years). |
|
| Interventions | Intervention group: 11 villages, 288 women. NaFeEDTA fortified fish sauce (15 mL (7.5 mg iron) daily for each person in household, (500 mg Fe per litre) in family meals. Control group: 10 villages, 288 women of childbearing age received a placebo of unfortified fish sauce provided free. | |
| Outcomes | Anaemia prevalence, haemoglobin concentration, iron deficiency prevalence, serum retinol, parasitic infection, serum ferritin, and at 6, 12 and 18 months. | |
| Notes | We calculated effective sample size using the design effect for this CRT and presented the outcomes; anaemia, haemoglobin concentration and iron deficiency.The trial included a total of 21 villages with 596 women of reproductive age group; with the mean cluster size of 27. The trialists did not report ICC; we computed the design effect using the ICC as 0.02 from Adams 2004 study, for the variable "haemoglobin", adjusted for baseline characteristics and mean cluster size of 27; as 1.52. For reporting anaemia, in the intervention arm receiving the fortified fish sauce, sample size adjustment was made to 11 (from n=16) out of 124 participants (from n=189) and in the control arm, effective sample size was estimated to be 28 (from n=42) out of 131 (from n=199) participants. For haemoglobin concentration, only the total number of participants was adjusted in both the arms and mean (SD) values as reported by the trialists were used in the analyses. The total number of participants in fortification group was adjusted to 124 from 189 and in control arm, it was 131 from 199 participants. For reporting iron deficiency, we calculated the number as 5 (from n=8) in the intervention arm and 29 (from n=44) in the control arm.
Source of funding: The Nippon Foundation through the support of Project IDEA (Iron Deficiency Elimination Action) of the International Life Scienes Institute Centre for Health Promotion (ILSI RF/CHP) |
|
| Risk of bias | ||
| Bias | Authors' judgement | Support for judgement |
| Random sequence generation (selection bias) | Unclear risk | The trialists report that this was randomised at village level. In the methodology section, they mention that participants were "randomly" assigned to either of the groups. No report on how the random sequence was generated. |
| Allocation concealment (selection bias) | High risk | Allocation concealment not described in the study. No indication of whether or not the bottles or colour of sauce differed. |
| Similarity of baseline outcome assessment (Selection bias) | Low risk | No significant difference between groups |
| Similarity of baseline characteristics (selection bias) All outcomes | Low risk | No significant difference between groups in age, height, weight, BMI or dietary intake. |
| Incomplete outcome data (attrition bias) All outcomes | Unclear risk | A total of 188 (33%) women (Group C: 99 and Group F: 89) were lost to follow‐up mostly because they were not available. Unavailability was due to participating in rice harvest labor force or working in local cities. This group could have been characteristically different from the rest. Values for some variables were missing due to laboratory error. |
| Blinding (performance bias and detection bias) All outcomes | Unclear risk | The study claims to be double blinded. However, there is no indication of who was blinded and how. Also, there was no report on allocation concealment |
| Contamination (possible performance bias) | Low risk | Contamination was unlikely as the compliance was strictly monitored. “Local and National Institute of Nutrition staff members monitored fish sauce consumption at weekly intervals by visiting these households to ensure that the fish sauce supply remained appropriate for the number of family members sharing the meals” |
| Selective reporting (reporting bias) | Low risk | Study reported on all relevant outcomes as described in the methodology and all participants (except 33% attrition). |
| Other bias | Low risk | Groups appeared similar at baseline and results were adjusted for cluster design effect. Details of how the sauce was distributed and the distance between villages, and the likelihood of contamination were not discussed. Analysis was by intention to treat. Other bias not apparent. Close supervision/monitoring of the intervention was performed. No difference in dietary data at T0 and T10 . No change in pre‐specified effect size. No apparent reason to believe that the intervention affected data collection. |
| Recruitment bias | Low risk | The clusters were allotted to the interventions after they were recruited into the trial. |
| Baseline imbalance | Low risk | All villages in the selected communes had >20% prevalence of anaemia. |
| Loss of clusters | Low risk | There is no reported loss of clusters because the level of allocation was at village level and "random" selection of women from the villages allocated to each intervention. |
| Incorrect analysis | High risk | The effect of cluster was not taken into account and not reported. |
| Compatibility with individual RCT | Unclear risk | The allocation was at the level of villages followed by random selection of women in child bearing age. Remaining part of the trial was conducted at the individual level. |
Vinodkumar 2007.
| Study characteristics | ||
| Methods | Non‐ randomised controlled trial | |
| Participants | Overall, trialists included 7 areas each with an experimental and control area (14 areas) with data for 829 individuals. Setting: districts in India with varying characteristics in terms of geography, and climate. The study was carried out via villages and the intervention was distributed via community groups. Children under 10 years of age excluded. |
|
| Interventions | Salt added to family cooking. Co‐intervention with iodine, albendazole for deworming, education about anaemia. Intervention group: 7 areas, data for 393 individuals. Double fortified salt. (iron and iodine). Fortified with ferrous sulphate monohydrate (chelated). Control group: 7 areas, data for 436 individuals. Iodised salt (potassium iodate). |
|
| Outcomes | Haemoglobin, urinary iodine concentration, at baseline, at 6 months and 1 year. | |
| Notes | Participants: males and females over 10 years. Anaemia prevalence: Not clear, mean Hb at baseline 10.34, but this varied in different areas.
Source of funding: Not stated. The DFS was provided by the Sundar Serendipity Foundation. The trialists quote "The clusters are administrative units for implementing the Transfer of Technologies for Sustainable Development project, which was funded by the European Union." |
|
| Risk of bias | ||
| Bias | Authors' judgement | Support for judgement |
| Random sequence generation (selection bias) | High risk | Participants were not randomly assigned. The intervention was at village level. The steps or the method of random sequence generation is not described. |
| Allocation concealment (selection bias) | High risk | Within areas villages were "randomly selected" but it was not clear how villages were allocated to experimental or control. The description of the methods used to carry out randomisation were brief and it was not clear how allocation was performed. |
| Similarity of baseline outcome assessment (Selection bias) | Low risk | No significant difference |
| Similarity of baseline characteristics (selection bias) All outcomes | Unclear risk | Adjoining villages were selected as experimental and control; but it was not clear whether these were similar. However, trialists stated that all the areas were similar in terms of socio‐economic characteristics. |
| Incomplete outcome data (attrition bias) All outcomes | High risk | It appears that only those having all measures (baseline, 6 months and 12 months were included in the analysis. The villages varied in size and there was no adjustment for clustering. |
| Blinding (performance bias and detection bias) All outcomes | High risk | Only the participants were blinded. Given the outcome assessors, providers, and investigators were not blinded there are reasons to believe that the data collection was affected. |
| Contamination (possible performance bias) | Unclear risk | Adjacent villages were selected for DFS and IS groups. No monitoring of consumption reported. No significant change in color but there was change in taste when the food is left for about 6 hours. |
| Selective reporting (reporting bias) | Low risk | Both the pre‐specified outcomes were reported (haemoglobin and urinary iodine concentration). |
| Other bias | High risk | No information on influence of diet or other factors that may change outcome. However, the trialists reported the dietary factors varied across the groups despite being from the similar backgrounds. Information on source of funding is not clear; based on the information provided. Support of European Union, Bharatiya Agro Industries Foundation (BAIF), Sundar Serendipity Foundation is mentioned |
Wegmuller 2006.
| Study characteristics | ||
| Methods | Controlled before and after study. | |
| Participants | A total of 123 children from 4 schools (two in each arm) ages 5‐15 who had ID (23% of those screened). Children attending primary schools, in a village in the Dabou district of Côte d'Ivoire. | |
| Interventions | Salt as part of family meals to provide an average of approximately 10mg of iron per day (DFS). Intervention group: Children from 2 schools at one end of the village received the Double Fortified Salt (n = 60). Control group: all children from 2 schools at one end of the village received the Iodized Salt (n = 63) | |
| Outcomes | Anaemia, haemoglobin concentration, serum ferritin, transferrin receptor, iron deficiency and iron deficiency anaemia, urinary iodine concentration at baseline and at 6 months. | |
| Notes | It appeared that children in the intervention schools were less likely to be anaemic at baseline.(42% in the intervention group and 62% in the control group at baseline).
Source of funding: ETH Zurich and the Walter Hochstrasser Foundation in Zurich, Switzerland and Dr. Paul Lohmann GmbH KG, Emmerthal, Germany. |
|
| Risk of bias | ||
| Bias | Authors' judgement | Support for judgement |
| Random sequence generation (selection bias) | High risk | This was a controlled before after study. Purposively divided four villages into two groups |
| Allocation concealment (selection bias) | High risk | Authors quote “Both the investigators and schools were unaware of the group assignment” |
| Similarity of baseline outcome assessment (Selection bias) | Low risk | No significant difference between groups in SD, TfR, or body iron concentration |
| Similarity of baseline characteristics (selection bias) All outcomes | Low risk | No significant difference between groups in age, weight, height. |
| Incomplete outcome data (attrition bias) All outcomes | Low risk | Data presented on all children enrolled in the study. In case of ferritin children with normal CRP values were analyzed only (46 DFS and 49 IS children) |
| Blinding (performance bias and detection bias) All outcomes | Low risk | Both investigators and households were blinded. |
| Contamination (possible performance bias) | Low risk | Contamination was unlikely as the schools were randomized. Compliance was monitored. Also, there was no significant change in color, taste, or acceptability as impetus for households to switch between interventions. |
| Selective reporting (reporting bias) | Low risk | Study reported on all participants and relevant outcomes. |
| Other bias | Unclear risk | Compliance was monitored periodically. 3‐day weighted food record survey was administered on a subsample of 24 families. No change in pre‐specified effect size. No apparent reason to believe that the intervention affected data collection. Area reported to have high prevalence of ID and Malaria but statistical analysis does not mention about controlling for malaria. Clustering effect not factored in in the sample size calculation. Children in the intervention schools had much higher mean Hb levels (117) than control (112) at baseline, which makes Hb results at follow up very difficult to interpret. It was not controlled for in the analysis |
Working Group 1982.
| Study characteristics | ||
| Methods | Controlled before‐after study | |
| Participants | A total of 14,398 participants were included into this field based large scale experimental study. They included all individuals aged 1 year and above. The participants belonged to rural areas in Kolkata (formerly Calcutta), Hyderabad and Delhi cities of India, while the fourth study area was an urban area in Chennai (formerly Madras) city. Most of the households in the study belonged to lower middle and poor income strata. Village was considered as functional unit. | |
| Interventions | Salt was fortified with ferric phosphate with the composition: 1000 g; (FePO4.2H2O): 3.5 g (1000 mg Fe); (NaHSO4.2H2O): 5.0 g. This was compared with unfortified salt at 6 and 12 months after intervention. At Hyderabad centre, the salt was sold in all the shops in the locality and in other areas, the salt was distributed free of cost on a house‐to‐house basis. | |
| Outcomes | Salt fortified with iron was acceptable to the population. The study authors reported that consumption of iron‐fortified salt showed significant improvement in the Hb‐ levels and reduction in anemia. Even in an area with high incidence of hookworm infestation, the iron‐fortified salt showed significant impact on Hb levels. | |
| Notes | This study inlcuded participants from the age of 1 year onwards. In addition, the baseline levels of anaemia had great variation. It varied from 0% among men aged 25 to 44 years to 96.3% in children aged 1 to 5 years.
Source of funding: not reported. |
|
| Risk of bias | ||
| Bias | Authors' judgement | Support for judgement |
| Random sequence generation (selection bias) | High risk | Authors do not describe randomisation in this study. They report "The village was considered as the functional unit and assigned to either the control or experimental group. This was done in such a way that both the mean Hb level and prevalence of anemia in various physiological groups were essentially similar. The experimental and control areas were geographically separate which ensured that salt supplied to one area did not enter the other area." |
| Allocation concealment (selection bias) | High risk | The experimental and control groups were selecled in such a way that they were physically apart in each of the 5 centres. No statement in the study to reflect this. |
| Similarity of baseline outcome assessment (Selection bias) | High risk | The level of anaemia varied across the age groups, centres and intervention arms. The variation is between 0% to 96.3%. |
| Similarity of baseline characteristics (selection bias) All outcomes | Low risk | Authors report "Most of the households in both the urban and rural centers belonged to lower middle and poor income groups". |
| Incomplete outcome data (attrition bias) All outcomes | Low risk | Over 12 months, 361 people covered in the study areas were lost to follow up from the basline of 14398 (2.5%) |
| Blinding (performance bias and detection bias) All outcomes | High risk | Blinding was not done in this study. |
| Contamination (possible performance bias) | Low risk | The study participants were chosen in such a way that they were located apart. |
| Selective reporting (reporting bias) | Low risk | Authors have reported on all the outcomes they intended to measure. |
| Other bias | Unclear risk | Study measured the outcomes at the end of 12 months. However, only one centre provided data for 18 months follow up. The study covered larger number of people; but outcome measurements were done on 75% select individuals. Authors report "Infants, the sick, and unwilling subjects were excluded. The popula‐tion coverage for Hb estimation was around 75%." Also, Kolkata centre had an alternate formula fortified salt being introduced. |
Zimmermann 2002.
| Study characteristics | ||
| Methods | RCT with double blinding and randomisation at household level. | |
| Participants | The trialists included 377 children from two neighbouring schools and then randomised them into an intervention group (n = 183) and a control group (n =184), in Brikcha Rural Commune in a mountainous area in northern Morocco. The study area is endemic to goitre and high levels of iron deficiency anaemia with a population of mixed Berber and Arab descent. The participants children were in the age group 6‐ to 5 years. The families of children recruited to the study were mainly rural farm‐workers. | |
| Interventions | Salt was added to family meals to provide approximately 150 to 250 micrograms of iodine (in both groups) and 7 to 12 mg of iron (in the intervention group with double fortified salt) per day based on average salt consumption by children. The intervention group received DFS (with ferrous sulphate hydrate microencapsulated with partially hydrogenated vegetable oil + potassium iodide) and the control group received Iodised salt (potassium iodide). |
|
| Outcomes | Haemoglobin g/L, prevalence of iron deficiency anaemia, serum thyroxine, urinary iodine, serum ferritin, transferrin receptor and zinc protoporphyrin concentrations at 20 and 40 weeks. | |
| Notes |
Source of funding: The Nestlé Foundation (Lausanne, Switzerland) and the Swiss Federal Institute of Technology (Zurich, Switzerland) |
|
| Risk of bias | ||
| Bias | Authors' judgement | Support for judgement |
| Random sequence generation (selection bias) | Unclear risk | Not described. Children were randomised at the household level. |
| Allocation concealment (selection bias) | Unclear risk | Not described. |
| Similarity of baseline outcome assessment (Selection bias) | Low risk | No significant difference in any outcome |
| Similarity of baseline characteristics (selection bias) All outcomes | Low risk | No significant difference in any baseline parameters |
| Incomplete outcome data (attrition bias) All outcomes | Low risk | Study reported on all participants 377 children randomised and 367 completed the study and the relevant outcomes |
| Blinding (performance bias and detection bias) All outcomes | Unclear risk | Households were blinded but not specified whether the providers or outcome assessors were blinded. But since both investigators and households were blinded the providers were likely blinded. |
| Contamination (possible performance bias) | Low risk | Less possibility of contamination as there was no color, acceptability, or organoleptic difference which could motivate participants of either of the group to switch intervention. However there was no supervision of consumption. |
| Selective reporting (reporting bias) | Low risk | All outcomes appear to have been reported. No apparent selective reporting as per the information provided by the article. |
| Other bias | Unclear risk | No supervision strategy or record of compliance reported. Randomization was done at the household level. Individuals were unit analyses. However, it is not clear how many children were included in the study who came from the households that more than one child participating in the study. |
Zimmermann 2004a.
| Study characteristics | ||
| Methods | Double‐blind RCT with children randomised at household level. | |
| Participants | Children of both sex between 6 to 15 years were included in the trial carried out in Brikcha Rural Commune in northern Morocco. Isolated from commercial routes, 95% rural, and most available food is produced locally on small farms. The population consisted of mixed Berber and Arab descent by ethnicity. | |
| Interventions | 2 kg salt provided to each household per month. Intervention group: Double fortified salt with iron and iodine (n = 77) Control group: iodised salt (n = 86) for 10 months |
|
| Outcomes | Anaemia, haemoglobin concentration, iron deficiency, serum ferritin, transferrin receptor, zinc protoporphyrin, and body iron at 5 months and | |
| Notes |
Source of funding: The Thrasher Research Fund (Salt Lake City, UT), the Foundation for Micronutrients in Medicine (Rapperswil, Dwitzerland), and the Swiss Federal Institute of Technology (Zurich, Switzerland). The iron compounds were supplied by Paul Lohmann AG (Emmenthal, Germany) |
|
| Risk of bias | ||
| Bias | Authors' judgement | Support for judgement |
| Random sequence generation (selection bias) | Unclear risk | Not reported about generation of random sequence although the participants were randomly assigned to either of the groups |
| Allocation concealment (selection bias) | High risk | Not reported |
| Similarity of baseline outcome assessment (Selection bias) | Low risk | No significant difference between groups |
| Similarity of baseline characteristics (selection bias) All outcomes | Low risk | No significant difference between groups |
| Incomplete outcome data (attrition bias) All outcomes | Low risk | Only 3% (5 out of 163) dropped out of the study. |
| Blinding (performance bias and detection bias) All outcomes | Low risk | Both investigators and households were blinded. However, there is no report on blinding of providers or outcome assessors |
| Contamination (possible performance bias) | Low risk | There is no information about blinding providers. However, the study reported no significant change in color, taste, or acceptability as impetus for households to switch between interventions |
| Selective reporting (reporting bias) | Low risk | Study reported on all participants (except 3% attrition) and on all relevant indicators. |
| Other bias | Unclear risk | There was no information on diet or other factors that may change outcome. Random assignment may have controlled that factor. No change in pre‐specified effect size. No apparent reason to believe that the intervention affected data collection. Clustered study but no mention of how the sample size was calculated or if the clustering effect was taken into account. |
CRT: vcluster‐randomised trial; DFS: double fortified salt; EFF: encapsulated ferrous fumarat; Fe: iron; Hb: haemoglobin; ICC: intra cluster correlation coefficient MCV: mean cell volume; RCT: randomised controlled trial; SD: standard deviation;
Characteristics of excluded studies [ordered by study ID]
| Study | Reason for exclusion |
|---|---|
| Andersson 2010 | The intervention was not within the scope of the review because margarine was used as the food vehicle which does not meet our definition of condiment or seasoning. |
| Ballot 1989b | This is a prevalence survey which does not meet our criteria for study designs and hence excluded from this review. |
| Baynes 1990 | This is an iron absorption study with traditionally fermented Japanese soy sauce added to soy and rice. The assessments were done related to iron absorption and influencing factors. Hence this study was excluded from this review. |
| Chavasit 2003 | The effect of fortification with iron could not have been determined given that the co interventions were not similar. |
| Dai 1983 | This is an iron absorption study using iron‐fortified soy sauce; which was beyond the scope of this review. So this study was excluded. |
| Fidler 2003 | This is an iron absorption study which did not assess the effect of fortified soy and fish sauce in improving iron status. |
| Foy 1976 | This is a letter which does not report any original data. It describes findings from two repeat surveys from Mauritius looking at salt fortification. Since the study design did not match the inclusion criteria, it was excluded from this review. |
| Horton 2011 | This is a cost‐analysis study using data from several intervention trials |
| Huo 2001 | The intervention was outside the scope of this review because the fortification vehicle was flour (not considered a condiment). |
| Huo 2007 | This is an iron absorption study in which health effects were not measured (i.e., did not measure any of our prespecified outcomes). |
| Huo 2011 | This is a flour fortification with multiple micronutrients (the fortification vehicle is not considered a condiment); hence excluded from this review. |
| Jain 1987 | This was an abstract only. This abstract has an effect analysis without a control group and hence it is beyond the scope of this review. Author contacted for full text but no response received. |
| Karl 2010 | The fortification vehicle used in this study was a sports bar, which is not considered a condiment or seasoning. Hence this study was excluded from the review. |
| Kumar 2007 | Salt fortified with multiple micronutrient was compared with a control, so the effect of iron could not be determined (i.e., did not fall into any of our prespecified comparisons). |
| Kumar 2008 | A multiple micronutrient food supplement was compared with a control, which is outside the sope of the types of interventions included in this review. |
| Lamparelli 1987 | This is an iron absorption study which assessed the effect of curry powder in improving iron absorption from other foods; our prespecified health outcomes were not measured. |
| Lopez 2018 | This study included coconut spiced vinegar (SV) and its physicochemical characterisation and evaluation of consumer acceptability of SV fortified with ferrous sulfate (FS), ferrous fumarate (FF), or sodium iron ethylenediaminetetraacetate (NaFeEDTA). A nonfortified SV was used as a control. Hence this study was beyond the perview of inclusion into this review. |
| Madan 1998 | This was an abstract only. Author contacted multiple times for full text but no response received. However, there is no published or unpublished manuscript from this study other than the conference abstract. |
| Manger 2008 | This intervention was outside the scope of our review because iron was combined with other micronutrients in the fortified seasoning and the effect of iron could not be determined. |
| Mannar 2019 | This study aimed to develop a stable fortified salt to meet the requirement of organoleptically stable, bioavailable and acceptable to consumers. The researchers used quadruple fortified salt (QFS) formulation with iodine,vitamin B12, iron and folic acid. Since this was an exploratory analysis on the feasibility of fortified salt, it was excluded from this review. |
| Nadeau 1987 | The intervention did not meet the criteria for our review because wheat flake cereal was the vehicle fortified with iron (does not meet the definition of a condiment or seasoning). |
| Nair 1998 | This study reports the results of two community based interventions related to iron fortification of salt on haemoglobin concentration and anaemia. Hence this study was excluded. We have included both the studies being reported in this paper (Nadiger 1980; Working Group 1982) |
| Prieto‐Patron 2020 | This study was a review of health economic model to quantify the burden of IDA, and effects of nationwide mandatory iron fortification of wheat flour and voluntary iron fortification of condiments on IDA. The analysis included data from published reviews and publicly available data sets. Since this was not a primary study on the effectiveness of condiment fortification, we excluded this study from the review. |
| Ranganathan 1996 | This trial assessed physical properties and acceptability of fortified salt; no health outcomes were measured |
| Sattarzadeh 1999 | This is an iron absorption study in which DFS was tested in two different meals (iron‐enhancing and iron‐inhibiting); there was no control meal. |
| Scrimshaw 2005 | This is a commentary only, not an intervention. |
| Sun 1991 | This paper examined social marketing techniques to improve women's knowledge and attitudes towards iron‐fortified soy sauce, but did not measure health outcomes. This study does not contribute data to the review but findings have been considered in the discussion. |
| Thuy 2002 | This was an abstract only. Author contacted for full text but no response received. |
| Thuy 2003b | This was an abstract only. Author contacted for full text but no response received. Abstract: (Article is in Vietnamese) A double‐blind randomised study was conducted from December 2001 to December 2002 in 2 communes of Vu Ban district, Nam Dinh province, on 433 women aged 16‐45 divided into 2 groups. Group 1 received fish sauce without fortified iron (15 mL of fish sauce/person/daily). Group 2 received iron fortified fish sauce 7.5 mg iron under the form of NaFeEDTA (15mg fish sauce/person/daily). Iron fortified sauce improved significantly the anaemia and iron deficit status in women with a reduce rate of 8.3% (from 24.7% to 16.4%) reaching 33.6% of efficacy of the target of programme. The rate of exhaustly iron deficit reduced by 15% (from 20.6% to 5.6%) reaching 72.8% of efficacy. Body iron store enhanced with statistical significant in group 2 versus group 1 (P < 0.0001) |
| Tuntawiroon 1980 | Full article not available. Contacted journal but no response received. |
| Tuntipopipat 2006 | This study examined whether chili and tumeric have any effect on iron absorption; there was no examination of the effect of fortification of condiments with iron. |
| van Stuijvenberg 1997 | This study did not examine fortification of a condiment, rather it looked at the effect of vitamin A status on children receiving an iron fortified soup. |
| Van T 2009 | This was an abstract only. Author contacted for full text but no response received. |
| Vinodkumar 2009a | This intervention did not fit our criteria because salt was fortified with multiple micronutrients was compared with a control; the effect of iron could not be determined. |
| Vinodkumar 2009b | Salt fortified with multiple micronutrient was compared with a control; the effect of iron could not be determined. |
| Walczyk 2005 | This is an iron absorption study which compared absorption of different types of iron compounds in fish sauce. Health outcomes relevant to this review were not measured. |
| Wang 2009 | This study assessed the effect of social marketing of fortified salt on knowledge, attitudes, and practices; no health outcomes were measured. |
| Wang 2011 | The intervention, a social mobilization and social marketing strategy, is outside the scope of this review. |
| Watanapaisantrakul 2006 | This study tested the iron sources for their feasibility for fortification of soy sauce. This being a feasibility study, was excluded from this review. |
| Winichagoon 2006 | Iron was combined with other micronutrients in the fortified seasoning, so the effect of iron could not be determined. |
| Working Group 1980 | This is a review article which discussed about the feasibility and effects salt fortification on micronutrient status in the populations as reported by other trials (Nadiger 1980; Working Group 1982). |
| Working Group 1983 | Similar to the 'Working group 1980', this paper does not report any original results rather it reports findings from other studies included in the review. |
| Zimmermann 2004b | This study compared triple‐fortified (iron, iodine, and vitamin A) salt with iodized salt. The effect of iron fortificant could not be determined as the co intervention was not similar in both arms. |
DFS: double fortified salt; FF: ferrous fumarate ; FS: ferrous sulfat; IDA: iron deficiency anaemia; SV: spiced vinegar.
Differences between protocol and review
In the objectives, we have revised the target population from "population at risk" to "general population", since the evidence synthesised in this review covers the entire population with respect to the specified outcomes.
In the types of studies: we have excluded before‐after comparison studies without control and cohort studies; since they do not add any significance to the available evidence, and we have already identified high‐quality data without including these study designs.
Types of interventions: we did not include the following 2 comparisons: condiments or seasonings fortified with iron versus no intervention, condiments or seasonings fortified with iron plus other micronutrients versus no intervention.
We did not include motor skill development as a secondary outcome.
The cut‐off for the age of adolescents in outcomes was revised to 12 to 17.9 years.
We did not include pregnant women as a participant group category.
We used additional criteria to assess the risk of bias in the included cluster randomised control trials.
We have added PROGRESS plus checklist in the review, which would capture any potential factors influencing the equity and social capital.
Cochrane Public Health Group specialised register (CPH) was no longer searched.
Contributions of authors
Chowdhury SB Jalal, Vanessa Pike, and Prasanna Mithra screened all the references and extracted the data from included studies in the initial searches. Luz Maria De‐Regil wrote the initial description of the studies. Prasanna Mithra and Vanessa Pike did the screening and eligibility of the updated search. All authors provided input and contributed to drafting the final version of this review.
Disclaimer: Luz Maria De‐Regil is a full‐time staff member of the World Health Organization.
The authors alone are responsible for the views expressed in this publication and they do not necessarily represent the official position, decisions, policy, or views of these organisations.
Sources of support
Internal sources
-
Nutrition International, Global Technical Services, Canada
The Global Technical Services unit of Nutrition International supported Dr. Chowdhury Jalal and Vanessa Pike through staff time and also provided partial financial support to Dr. Prasanna Mithra.
External sources
-
Goverment of Luxembourg, Luxembourg
WHO acknowledges the Government of Luxembourg for their financial support to the Micronutrients Unit for conducting systematic reviews on micronutrient interventions.
-
National Health and Medical Research Council, Australia
This Cochrane review was supported by the National Health and Medical Research Council, via Cochrane infrastructure funding to the Cochrane Public Health editorial group.
-
Bill and Melinda Gates Foundation, USA
Bill and Melinda Gates Foundation provided the financial support to make this review open access
Declarations of interest
CJ: Chowdhury Jalal is an employee of Nutrition International, a non‐profit organization that supports the government and NGOs on the large‐scale fortification of other vehicles with different micronutrients. The organization is not engaged in condiment fortification currently, nor does it have any future plan to do so.
LMD: Luz Maria De‐Regil was a staff of Nutrition International between 2013 and 2018 and a Board Member of the Iodine Global Network between 2014 and 2017. Both organizations are not‐for‐profit and among their activities promote the use of fortified salt as a means to eliminate deficiencies, particularly iron and iodine. Nutrition International, specifically, also received grants from the government of Canada for this purpose.
VP: Vanessa Pike was a consultant to Nutrition International during the preparation of this manuscript, and was subsequently an employee. Nutrition International is a non‐profit organization that supports government and NGOs on large‐scale fortification of other vehicles with different micronutrients. The organization is not engaged in condiment fortification currently, nor does it have any future plan to do so.
PM: Prasanna Mithra declares receiving partial funding from Nutrition International for activity on this review.
New
References
References to studies included in this review
Andersson 2008 {published data only}
- Andersson M, Thankachan P, Muthayya S, Goud RB, Kurpad AV, Hurrell R F, et al. Dual fortification of salt with iodine and iron: a randomized, double-blind, controlled trial of micronized ferric pyrophosphate and encapsulated ferrous fumarate in southern India. American Journal of Clinical Nutrition 2008;88(5):1378-87. [DOI] [PubMed] [Google Scholar]
Asibey‐Berko 2007 {published data only}
- Asibey-Berko E, Zlotkin SH, Yeung GS, Nti-Nimako W, Ahunu B. Dual fortification of salt with iron and iodine in women and children in rural Ghana. East African Medical Journal 2007;84(10):473-81. [DOI] [PubMed] [Google Scholar]
Ballot 1989a (C) {published data only}
- Ballot DE, MacPhail AP, Bothwell T H, Gillooly M, Mayet FG. Fortification of curry powder with NaFe(111)EDTA in an iron-deficient population: report of a controlled iron-fortification trial [x]. American Journal of Clinical Nutrition 1989;49(1):162-9. [DOI] [PubMed] [Google Scholar]
Chen 2005 (C) {published data only}
- Chen J, Zhao X, Zhang X, Yin S, Piao J. Studies on the effectiveness of NaFeEDTA-fortified soy sauce in controlling iron deficiency: a population based intervention trial. Food and Nutrition Bulletin 2005;26(2):177-86. [DOI] [PubMed] [Google Scholar]
- Zhao X, Lu Q, Wang S, Yin S. Efficiency of NaFeEDTA fortified soy sauce on anaemia prevention. [Chinese]. Wei Sheng Yan Jiu 2004;33(2):202-4. [PubMed] [Google Scholar]
Chen Ke 2008 {published data only}
- Chen K, Li TY, Chen L, Qu P, Liu YX. Effects of vitamin A, vitamin A plus iron and multiple micronutrient-fortified seasoning powder on preschool children in a suburb of Chongqing, China. Journal of Nutritional Science and Vitaminology 2008;54(6):440-7. [DOI] [PubMed] [Google Scholar]
- Chen K, Zhang X, Li T Y, Chen L, Wei X P. Effect of vitamin A, vitamin A plus iron and multiple micronutrient-fortified seasoning powder on infectious morbidity of preschool children. Journal of Nutrition 2011;27(4):428-34. [DOI] [PubMed] [Google Scholar]
Haas 2014 {published data only}
- Haas JD, Rahn M, Venkatramanan S, Marquis GS, Wenger MJ, Murray-Kolb LE, et al. Double-fortified salt is efficacious in improving indicators of iron deficiency in female Indian tea pickers. Journal of Nutrition 2014;144(6):957-64. [DOI] [PMC free article] [PubMed] [Google Scholar]
- Haas JD, VenkatramananS, Marquis G, Murray-Kolb L, Wenger M, Wesley AS, et al. Double-fortified salt improves iron status of female Indian tea pluckers. FASEB Journal 2011;25 (Meeting Abstract Supplement)(S1):236.3. [DOI: ] [Google Scholar]
Huo 2002 {published data only}
- Huo J S, Sun J, Miao H, Yu B, Yang T, Liu Z P, et al. Therapeutic effects of NaFeEDTA-fortified soy sauce in anaemic children in China. Asia Pacific Journal of Clinical Nutrition 2002;11(2):123-7. [DOI] [PubMed] [Google Scholar]
Longfils 2008 {published data only}
- Longfils P, Monchy D, Weinheimer H, Chavasit V, NakanishY, Schumann K. A comparative intervention trial on fish sauce fortified with NaFe-EDTA and FeSO4+citrate in iron deficiency anemic school children in Kampot, Cambodia. Asia Pacific Journal of Clinical Nutrition 2008;17(2):250-7. [PubMed] [Google Scholar]
Nadiger 1980 {published data only}
- Nadiger HA, Krishnamachari KA, Naidu AN, Rao BS, Srikantia SG. The use of common salt (sodium chloride) fortified with iron to control anaemia: results of a preliminary study. British Journal of Nutrition 1980;43(1):45-51. [DOI] [PubMed] [Google Scholar]
Thuy 2003a {published data only}
- Thuy PV, Berger J, Davidsson L, Khan NC, Lam NT, Cook JD, et al. Regular consumption of NaFeEDTA-fortified fish sauce improves iron status and reduces the prevalence of anaemia in anemic Vietnamese women. American Journal of Clinical Nutrition 2003;78(2):284-90. [DOI] [PubMed] [Google Scholar]
Thuy 2005 (C) {published data only}
- Van Thuy P, Berger J, Nakanishi Y, Khan N C, Lynch S, Dixon P. The use of NaFeEDTA-fortified fish sauce is an effective tool for controlling iron deficiency in women of childbearing age in rural Vietnam. Journal of Nutrition 2005;135(11):2596-601. [DOI] [PubMed] [Google Scholar]
Vinodkumar 2007 {published data only}
- Vinodkumar M, Rajagopalan S, Bhagwat IP, Singh S, Parmar BS, Mishra OP, et al. A multicenter community study on the efficacy of double-fortified salt. Food and Nutrition Bulletin 2007;28(1):100-8. [DOI] [PubMed] [Google Scholar]
Wegmuller 2006 {published data only}
- Wegmuller R, Camara F, Zimmermann M B, Adou P, Hurrell R F. Salt dual-fortified with iodine and micronized ground ferric pyrophosphate affects iron status but not haemoglobin in children in Cote d'Ivoire. Journal of Nutrition 2006;136(7):1814-20. [DOI] [PubMed] [Google Scholar]
Working Group 1982 {published data only}
- No authors listed. Use of common salt fortified with iron in the control and prevention of anaemia--a collaborative study. The American Journal of Clinical Nutrition 1982;35(6):1442-51. [DOI: doi: 10.1093/ajcn/35.6.1442] [DOI] [PubMed] [Google Scholar]
Zimmermann 2002 {published data only}
- Zimmermann MB, Zeder C, Chaouki N, Saad A, Torresani T. Dual fortification of salt with iodine and microencapsulated iron: a randomized, double-blind, controlled trial in Moroccan schoolchildren. American Journal of Clinical Nutrition 2003;77(2):425-32. [DOI] [PubMed] [Google Scholar]
- Zimmermann MB, Zeder C, Chaouki N, Torresani T, Saad A, Hurrell F. Addition of microencapsulated iron to iodized salt improves the efficacy of iodine in goitrous, iron-deficient children: a randomized, double-blind, controlled trial. European Journal of Endocrinology 2002;147(6):747-53. [DOI] [PubMed] [Google Scholar]
Zimmermann 2004a {published data only}
- Zimmermann MB, Wegmueller R, Zeder C, Chaouki N, Rohner F, Saissi M, et al. Dual fortification of salt with iodine and micronized ferric pyrophosphate: a randomized, double-blind, controlled trial. American Journal of Clinical Nutrition 2004;80(4):952-9. [DOI] [PubMed] [Google Scholar]
References to studies excluded from this review
Andersson 2010 {published data only}
- Andersson M, Theis W, Zimmermann MB, Foman JT, Jakel M, Duchateau GSMJE, Frenken LGJ, and Hurrell RF. Random serial sampling to evaluate efficacy of iron fortification:a randomized controlled trial of margarine fortification with ferric pyrophosphate or sodium iron edetate. American Journal of Clinical Nutrition 2010;92:1094-104. [DOI] [PubMed] [Google Scholar]
Ballot 1989b {published data only}
- Ballot DE, MacPhail AP, Bothwell TH, Gillooly M, Mayet FG. Fortification of curry powder with NaFe(111)EDTA in an iron deficient population: initial survey of iron status. American Journal of Clinical Nutrition 1989;49:156-61. [DOI] [PubMed] [Google Scholar]
Baynes 1990 {published data only}
- Baynes RD, Macfarlane BJ, Bothwell TH, Siegenberg D, Bezwoda WR, Schmidt U, et al. The promotive effect of soy sauce on iron absorption in human subjects. European Journal of Clinical Nutrition 1990;44(6):419-24. [PMID: ] [PubMed] [Google Scholar]
Chavasit 2003 {published data only}
- Chavasit V, Nopburabutr P, Kongkachuichai R. Combating iodine and iron deficiencies through the double fortification of fish sauce, mixed fish sauce, and salt brine. Food and Nutrition Bulletin 2003;24(2):200-7. [PMID: ] [DOI] [PubMed] [Google Scholar]
Dai 1983 {published data only}
- Dai Yau-tian. Iron fortification of Chinese soy sauce. United Nations University Feb 1983;5(1):35-42 ill , charts. [https://archive.unu.edu/unupress/food/8F051e/8F051E08.htm] [Google Scholar]
Fidler 2003 {published data only}
- Fidler M C, Davidsson L, Walczyk T, Hurrell R F. Iron absorption from fish sauce and soy sauce fortified with sodium iron EDTA. American Journal of Clinical Nutrition 2003;78(2):274-8. [DOI] [PubMed] [Google Scholar]
Foy 1976 {published data only}
- Foy H. Letter: Fortification of salt with iron. American Journal of Clinical Nutrition 1976;29(9):935-6. [PMID: ] [DOI] [PubMed] [Google Scholar]
Horton 2011 {published data only}
- Horton S, Wesley A, Mannar MG. Double-fortified salt reduces anaemia, benefit:cost ratio is modestly favorable. Food Policy 2011;36(5):581-7. [Google Scholar]
Huo 2001 {published data only}
- Huo J, Sun J, Miao H, Yu B. Effect of NaFeEDTA fortified soy sauce on iron deficiency anaemia in students. [Chinese]. Wei Sheng Yan Jiu 2001;30(5):296-8. [PubMed] [Google Scholar]
Huo 2007 {published data only}
- Huo JS, Yang XG, Piao JH, Gao J Q, Miao H, Yu B, et al. NaFeEDTA fortified soy sauce showed higher iron absorption rate in Chinese females. Biomedical and Environmental Sciences 2007;20(2):126-30. [PubMed] [Google Scholar]
Huo 2011 {published data only}
- Huo, J, et al. The effectiveness of fortified flour on micro-nutrient status in rural female adults in China. Asian Pacific Journal of Clinical Nutrition 2011;20(1):118-24. [PubMed] [Google Scholar]
Jain 1987 {published data only}
- Jain M, Bhat CM, Kaur AP. Effect of consumption of iron-fortified salt on iron status in young girls. Human Nutrition. Appiedl Nutrition 1987;41(3):174-9. [PubMed] [Google Scholar]
Karl 2010 {published data only}
- Karl JP, Lieberman HR, Cable SJ, Williams KW, Young AJ, McClung JP. Randomized, double-blind, placebo-controlled trial of an iron-fortified food product in female soldiers during military training: relations between iron status, serum hepcidin, and inflammation. American Journal of Clinical Nutrition 2010;92(1):93-100. [DOI] [PubMed] [Google Scholar]
Kumar 2007 {published data only}
- Kumar M V, Rajagopalan S. Multiple micronutrient fortification of salt and its effect on cognition in Chennai school children. Asian Pacific Journal of Clin Nutrition 2007;16(3):505-11. [PubMed] [Google Scholar]
Kumar 2008 {published data only}
- Kumar MV, Rajagopalan S. Trial umultiple micronutrientfFood dupplement and its effect on cognition. Indian Journal of Pediatrics 2008;75(7):671-8. [DOI: 10.1007/s12098-008-0127-1] [DOI] [PubMed] [Google Scholar]
Lamparelli 1987 {published data only}
- Lamparelli RD, McPhail AP, Bothwell TH, Ballot D, Danilewitz MD, Macfarlane BJ, et al. Curry powder as a vehicle for iron fortification: effects on iron absorption. American Journal of Clinical Nutrition 1987;46(2):335-40. [DOI] [PubMed] [Google Scholar]
Lopez 2018 {published data only}
- Lopez Barrera EC, Gaur S, Andrade JE, Engeseth NJ, Nielsen C, Helferich WG. Iron Fortification of Spiced Vinegar in the Philippines. Journal of Food Science 2018;83(10):2602-11. [PMID: ] [DOI] [PubMed] [Google Scholar]
Madan 1998 {published data only}
- Madan N, Rusia U, Sood S K, Sikka M, Sharma S. Effectiveness of iron-fortified salt on prevalence of anaemia in children with a wheat-based diet. British Journal of Haematology 1998;102(1):41. [Google Scholar]
Manger 2008 {published data only}
- Manger MS, McKenzie JE, Winichagoon P, Gray A, Chavasit V, Pongcharoen T, et al. A micronutrient-fortified seasoning powder reduces morbidity andimproves short-term cognitive function, but has no effect onanthropometric measures in primary school children in northeast Thailand: a randomized controlled trial. American Journal of Clinical Nutrition 2008;87:1715-22. [DOI] [PubMed] [Google Scholar]
Mannar 2019 {published data only}
- Mannar V, Diosady L. Quadruple fortification of salt with iodine, iron, vitamins B9 and B12 to reduce maternal and neonatal mortality by reducing anemia and nutritional deficiency prevalence (P24-041-19). Current Developments in Nutrition 2019;3(Suppl 1):/nzz044.P24-041-19.
Nadeau 1987 {published data only}
- Nadeau DB, Clydesdale FM. Effect of sucrose, fructose and aspartame on fortificant iron solubility in a wheat flake cereal. Journal of Food Protection 1987;50 (1):21-4. [DOI] [PubMed] [Google Scholar]
Nair 1998 {published data only}
- Nair K M, Brahmam GN, Ranganathan S, Vijayaraghavan K, Sivakumar B, Krishnaswamy K. Impact evaluation of iron & iodine fortified salt. Indian Journal of Medical Research 1998;108:203-11. [PubMed] [Google Scholar]
Prieto‐Patron 2020 {published data only}
- Prieto-Patron A, V Hutton Z, Fattore G, Sabatier M, Detzel P. Reducing the burden of iron deficiency anemia in Cote D'Ivoire through fortification. Journal of Health, Population, and Nutrition 2020;39(1):1. [PMID: ] [DOI] [PMC free article] [PubMed] [Google Scholar]
Ranganathan 1996 {published data only}
- Ranganathan S, Lakshmi K V, Reddy V. Trial of ferrous glycine sulphate in the fortification of common salt with iron. Food Chemistry 1996;57(2):311-5. [Google Scholar]
Sattarzadeh 1999 {published data only}
- Sattarzadeh M, Zlotkin SH. Iron is well absorbed by healthy adults after ingestion of double-fortified (iron and dextran-coated iodine) table salt and urinary iodine excretion is unaffected. Journal of Nutrition 1999;129(1):117-21. [DOI] [PubMed] [Google Scholar]
Scrimshaw 2005 {published data only}
- Scrimshaw NS, Gleason GR. Commentary on "Studies on the effectiveness of NaFeEDTA-fortified soy sauce in controlling iron deficiency: A population-based intervention trial". Food and Nutrition Bulliten 2005;26(2):187-9. [DOI] [PubMed] [Google Scholar]
Sun 1991 {published data only}
- Sun X, Guo Y, Wang S, Sun J. Predicting iron-fortified soy sauce consumption intention: application of the theory of planned behavior and health belief model. Journal of Nutrition Education Behavior 2006;38(5):276-85. [DOI] [PubMed] [Google Scholar]
- Sun X, Guo Y, Wang S, Sun J. Social marketing improved the consumption of iron-fortified soy sauce among women in China. Journal of Nutrition Education Behavior 2007;39(6):302-10. [DOI] [PubMed] [Google Scholar]
- Sun X, Guo Y, Wang S. Influencing factors of NaFeEDTA fortified soy sauce consumption intention among women in Guizhou [贵州妇女铁强化酱油购买意向的影响因素]. Chinese Mental Health Journal 1991;0(02):---. [Google Scholar]
Thuy 2002 {published data only}
- Thuy Van Pham. Efficacy of improvement of iron status in women with anaemia by using the iron complemented sauce. Journal of Practical Medicine 2002;435(11):8-12. [Google Scholar]
Thuy 2003b {published data only}
- Pham Van Thuy. Improvement of body iron store in women at reproductive age by using fortified fish sauce. Journal of Vietnamese Medicine 2003;288(9):107-14. [Google Scholar]
Tuntawiroon 1980 {published data only}
- Tuntawiroon M, Suwanik R, Pleehachinda R, Punyaprateep B, Pattanachak S, Pattanapanyasat K. Haemoglobin and serum-ferritin in the Thai population: levels in rural villagers before and after receiving iron-fortified foodstuffs. Journal of Medical Association of Thailand 1980;63(6):330-8. [PubMed] [Google Scholar]
Tuntipopipat 2006 {published data only}
- Tuntipopipat S, Judprasong K, Zeder C, Wasantwisut E, Winichagoon P, Charoenkiatkul S, et al. Chili, but not turmeric, inhibits iron absorption in young women from an iron-fortified composite meal. Journal of Nutrition 2006;136(12):2970-4. [DOI] [PubMed] [Google Scholar]
van Stuijvenberg 1997 {published data only}
- Stuijvenberg ME, Kruger M, Badenhorst CJ, Mansvelt EP, Laubscher JA. Response to an iron fortification programme in relation to vitamin A status in 6-12-year-old school children. International Journal of Food Sciences and Nutrition 1997;48(1):41-9. [DOI] [PubMed] [Google Scholar]
Van T 2009 {published data only}
- Van TP. Long-term effectiveness of iron fortified fish sauce in controlling iron deficiency anemia in Vietnam. Annals of Nutrition and Metabolism 2009;55:371. [Google Scholar]
Vinodkumar 2009a {published data only}
- Vinodkumar M, Rajagopalan S. Multiple micronutrient fortification of salt. European Journal of Clinical Nutrition 2009;63:437-45. [DOI] [PubMed] [Google Scholar]
Vinodkumar 2009b {published data only}
- Vinodkumar M, Erhardt JG, Rajagopalan S. Impact of a multiple-micronutrient fortified salt on the nutritional status and memory of schoolchildren. International Journal for Vitamin and Nutrition Research 2009;79(5):348-61. [DOI] [PubMed] [Google Scholar]
Walczyk 2005 {published data only}
- Walczyk T, Tuntipopipat S, Zeder C, Sirichakwal P, Wasantwisut E, Hurrell RF. Iron absorption by human subjects from different iron fortification compounds added to Thai fish sauce. European Journal of Clinical Nutrition 2005;59(5):668-74. [DOI] [PubMed] [Google Scholar]
Wang 2009 {published data only}
- Wang B, Zhan S, Sun J, Lee L. Social mobilization and social marketing to promote NaFeEDTA-fortified soya sauce in an iron-deficient population through a public-private partnership. Public Health Nutrition 2009;12(10):1751-9. [DOI] [PubMed] [Google Scholar]
Wang 2011 {published data only}
- Wang Bo, Chen Junshi, Zhan Siyan, Sun Jing, Li Liming. [Effectiveness of social mobilization and social marketing in promoting NaFeEDTA-fortified soya sauce in adult women]. Wei Sheng Yan Jiu (Journal of Hygiene Research) 2011;40(3):334-7. [PubMed] [Google Scholar]
Watanapaisantrakul 2006 {published data only}
- Watanapaisantrakul R, Chavasit V, Kongkachuichai R. Fortification of soy sauce using various iron sources: sensory acceptability and shelf stability. Food and Nutrition Bulletin 2006;27(1):19-25. [DOI] [PubMed] [Google Scholar]
Winichagoon 2006 {published data only}
- Manger MS, McKenzie JE, Winichagoon P, Gray A, Chavasit V, Pongcharoen T, et al. A micronutrient-fortified seasoning powder reduces morbidity and improves short-term cognitive function, but has no effect on anthropometric measures in primary school children in northeast Thailand: a randomized controlled trial. American Journal of Clinical Nutrition 2008;87(6):1715-22. [DOI] [PubMed] [Google Scholar]
- Winichagoon P, McKenzie JE, Chavasit V, Pongcharoen T, Gowachirapant S. A multimicronutrient-fortified seasoning powder enhances the haemoglobin, zinc, and iodine status of primary school children in north east Thailand: a randomized controlled trial of efficacy. Journal of Nutrition 2006;136(6):1617-23. [DOI] [PubMed] [Google Scholar]
Working Group 1980 {published data only}
- No authors listed. Iron-fortified salt to combat anaemia. Nutrition Reviews 1980;38(9):308-9. [DOI: ] [The incidence of anemia among children of residential schools and rural communities could be reduced significantly by introducing salt fortified with iron in their diets] [Google Scholar]
Working Group 1983 {published data only}
- No authors listed. Use of iron-fortified salt to combat anaemia: the Indian experience. Nutrition Reviews 1983;41(10):302-4. [The incidence of anemia in rural and urban communities of India was reduced by the introduction of salt fortified with iron.] [DOI] [PubMed] [Google Scholar]
Zimmermann 2004b {published data only}
- Zimmermann MB, Wegmueller R, Zeder C, Chaouki N, Biebinger R, Hurrell RF, et al. Triple fortification of salt with microcapsules of iodine, iron, and vitamin A. American Journal of Clinical Nutrition 2004;80(5):1283-90. [DOI] [PubMed] [Google Scholar]
Additional references
Adams 2004
- Adams G, Gulliford MC, Ukoumunne OC, Eldridge S, Chinn S, Campbell MJ. Patterns of intra-cluster correlation from primary care research to inform study design and analysis. Journal of Clinical Epidemiology 2004;57(8):785-94. [PMID: ] [DOI] [PubMed] [Google Scholar]
Allen 2006
- Allen L, De Benoist B, Dary O, Hurrell R. Guidelines on Food Fortification with Micronutrients. Geneva: World Health Organization and Food and Agriculture Organization of the United Nations, 2006. [Google Scholar]
Allen 2009
- Allen LH, Peerson JM, Olney DK. Provision of multiple rather than two or fewer micronutrients more effectively improves growth and other outcomes in micronutrient-deficient children and adults. Journal of Nutrition 2009;139(5):1022-30. [DOI] [PubMed] [Google Scholar]
Armony‐Sivan 2010
- Armony-Sivan R, Kaplan-Estrin M, Jacobson SW, Lozoff B. Iron-deficiency anaemia in infancy and mother-infant interaction during feeding. Journal of Developmental and Behavioural Pediatrics 2010;31(4):326-32. [DOI] [PMC free article] [PubMed] [Google Scholar]
Ashong 2012
- Ashong J, Muthayya S, De-Regil LM, Laillou A, Guyondet C, Moench-Pfanner R, et al. Fortification of rice with vitamins and minerals for addressing micronutrient malnutrition. Cochrane Database of Systematic Reviews 13 June 2012, Issue 6. Art. No: CD009902. [DOI: 10.1002/14651858.CD009902] [DOI] [PMC free article] [PubMed] [Google Scholar]
Athe 2013
- Athe R, Rao MVV, and Nair KM. Impact of iron-fortified foods on Hb concentration in children(,10 years): a systematic review and meta-analysis of randomized controlled trials. Public Health Nutrition 2013;17(3):579–86. [DOI] [PMC free article] [PubMed] [Google Scholar]
Bailey 2015
- Bailey RL, West KP Jr, Black RE. The Epidemiology of Global Micronutrient Deficiencies. Annals of Nutrition & Metabolism 2015;66 (suppl 2):22-33. [DOI] [PubMed] [Google Scholar]
Ballot 1989
- Ballot DE, MacPhail AP, Bothwell TH, Gillooly M, Mayet FG. Fortification of curry powder with NaFe(111)EDTA in an iron-deficient population: initial survey of iron status. American Journal of Clinical Nutrition 1989;49:156-61. [DOI] [PubMed] [Google Scholar]
Balshem 2011
- Balshem H, Helfand M, Schünemann HJ, Oxman AD, Kunz R, Brozek J et al. GRADE guidelines: Rating the quality of evidence. Journal of Clinical Epidemiology 2011;64(4):401-6. [DOI] [PubMed] [Google Scholar]
Baxter 2019
- Baxter JAB, Kamali M, Gaffey MF, Zlotkin SH, Bhutta ZA. Fortification of salt with iron and iodine versus fortification of salt with iodine for improving iron and iodine status. Cochrane Database of Systematic Reviews 2019, Issue 10. Art. No: CD013463. [DOI: 10.1002/14651858.CD013463] [DOI] [PMC free article] [PubMed] [Google Scholar]
Baxter 2022
- Baxter J-AB, Carducci B, Kamali M, Zlotkin SH, Bhutta ZA. Fortification of salt with iron and iodine versus fortification of salt with iodine alone for improving iron and iodine status.. Cochrane Database of Systematic Reviews 2022, Issue Issue 4. Art. No.: CD013463. Art. No: CD013463. [DOI: 10.1002/14651858.CD013463.pub2] [DOI] [PMC free article] [PubMed] [Google Scholar]
Beard 2008
- Beard JL. Why iron deficiency is important in infant development. Journal of Nutrition 2008;138(12):2534-6. [DOI] [PMC free article] [PubMed] [Google Scholar]
Benjamin‐Bovell 1999
- Bovell-Benjamin AC, Frankel EN, Allen LH, Guinard J-X. Sensory quality and lipid oxidation of maize porridge as affected by iron amino acid chelates and EDTA. Journal of Food Science 1999;64(2):371-6. [Google Scholar]
Borenstein 2009
- Borenstein M, Hedges LV, Higgins JP, Rothstein HR. Introduction to Meta-Analysis (Statistics in Practice). Chichester (UK): John Wiley & Sons, 2009. [DOI: ] [Google Scholar]
Carter 2010
- Carter RC, Jacobson JL, Burden MJ, Armony-Sivan R, Dodge NC, Angelilli ML, et al. Iron deficiency anaemia and cognitive function in infancy. Pediatrics 2010;126(2):e427-34. [DOI] [PMC free article] [PubMed] [Google Scholar]
Chaparro 2019
- Chaparro Camila M, Suchdev Parminder S. Anemia epidemiology, pathophysiology, and etiology in low- and middle-income countries. Annals of the New York Academy of Sciences 2019;1450(1):15-31. [DOI] [PMC free article] [PubMed] [Google Scholar]
Chen 2005
- Chen J, Zhao X, Zhang X, Yin S, Piao J, Huo J, et al. Studies on the effectiveness of NaFeEDTA-fortified soy sauce in controlling iron deficiency: a population-based intervention trial. Food and Nutrition Bulletin 2005;26(2):177-86. [DOI] [PubMed] [Google Scholar]
Clark, 2008
- Clark SF. Iron deficiency anemia. Nutrition in Clinical Practice 2008;23(2):128-41. [DOI: 10.1177/0884533608314536] [DOI] [PubMed] [Google Scholar]
Cochrane EPOC Group 2017
- Cochrane Effective Practice and Organisation of Care (EPOC). EPOC Resources for review authors, 2017. epoc.cochrane.org/resources/epoc-resources-review-authors (accessed 30 November 2020) 2017.
Cochrane PHG 2010
- Cochrane Public Health Group. Guide for developing a Cochrane Protocol. Vol. Version 2. The Cochrane Collaboration. Public Health Group, 2010. [Google Scholar]
Codex 2011
- Codex Alimentarius. Codex General Standard for Food Additives. Codex STAN 192-1995. Available at: http://www.jism.gov.jo/english/ORDERING%20PUBLICATIONS/forms/Directives/CXS_192e.pdf http://www.codexalimentarius.net/web/index_en.jsp.
Cole 2010
- Cole CR, Grant FK, Swaby-Ellis ED, Smith JL, Jacques A, Northrop-Clewes CA, et al. Zinc and iron deficiency and their interrelations in low-income African American and Hispanic children in Atlanta. American Journal of Clinical Nutrition 2010;91(4):1027-34. [DOI] [PMC free article] [PubMed] [Google Scholar]
Darnton‐Hill 2002
- Darnton-Hill I, Nalubola R. Fortification strategies to meet micronutrient needs: successes and failures. Proceedings of the Nutrition Society 2002;61:231-41. [DOI] [PubMed] [Google Scholar]
Das 2013
- Das JK, Salam RA, Kumar R, Bhutta ZA. Micronutrient fortification of food and its impact on woman and child health: a systematic review. Systematic Reviews 2013;2(67):1-24. [DOI: ] [DOI] [PMC free article] [PubMed] [Google Scholar]
Das 2019
- Das JK, Salam RA, Mahmood SB, Moin A, Kumar R, Mukhtar K, et al. Food fortification with multiple micronutrients: impact on health outcomes in general population. Cochrane Database of Systematic Reviews 2019, Issue 12. Art. No: CD011400. [DOI: 10.1002/14651858.CD011400.pub2] [DOI] [PMC free article] [PubMed] [Google Scholar]
Dewi 2021
- Dewi NU, Mahmudiono T. Effectiveness of food fortification in improving nutritional status of mothers and children in Indonesia. International Journal of Environmental Research and Public Health 2021;18(4):2133. [DOI: ] [DOI] [PMC free article] [PubMed] [Google Scholar]
Fall 2009
- Fall CH, Fisher DJ, Osmond C, Margetts BM, Maternal Micronutrient SupplementationStudy Group. Multiple micronutrient supplementation during pregnancy in low-income countries: a meta-analysis of effects on birth size and length of gestation. Food Nutrition Bulletin 2009;30((4 Suppl)):S533-46. [DOI] [PMC free article] [PubMed] [Google Scholar]
Field 2020
- Field MS, Mithra P, Estevez D, Peña-Rosas JP. Wheat flour fortification with iron for reducing anaemia and improving iron status in populations. Cochrane Database of Systematic Reviews 2020, Issue 7. Art. No: CD011302. [DOI: 10.1002/14651858.CD011302.pub2] [DOI] [PMC free article] [PubMed] [Google Scholar]
Garcia‐Casal 2016a
- Garcia-Casal MN, Pena-Rosas JP, Gomez-Malave H. Sauces, spices, and condiments: definitions, potential benefits, consumption patterns, and global markets. Annals of the New York Academy of Sciences 2016;1379:3-16. [DOI] [PubMed] [Google Scholar]
Garcia‐Casal 2016b
- Garcia-Casal MN, Pena-Rosas JP, Mclean M, De-Regil LM, Zamora G, and consultation working groups. Fortification of condiments with micronutrients in public health: from proof of concept to scaling up. Annals of the New York Academy of Sciences 2016;1379:38-47. [DOI] [PubMed] [Google Scholar]
Garcia‐Casal 2018
- Garcia Casal MN, Pena Rosas JP, De Regil LM, Gwirtz JA, Pasricha SR. Fortification of maize flour with iron for controlling anaemia and iron deficiency in populations. Cochrane Database of Systematic Reviews 2018, Issue 12. Art. No: CD010187. [DOI: 10.1002/14651858.CD010187.pub2] [CD010187] [DOI] [PMC free article] [PubMed] [Google Scholar]
Gera 2012
- Gera T, Sachdev HS, and Boy E. Effect of iron-fortified foods on hematologic and biological outcomes: systematic review of randomized controlled trials. American Journal of Clinical Nutrition 2012;96:309–24. [DOI] [PubMed] [Google Scholar]
Global Fortification Data Exchange 2018
- Global Fortification Data Exchange.. http://www.fortificationdata.org [Accessed 22/11/2018].
Global Fortification Data Exchange 2022
- Total number of nutrients in food vehicles, according to a country's fortification standard. https://fortificationdata.org/map-number-of-nutrients/ 2022.
GRADEpro GDT 2020 [Computer program]
- GRADEpro Guideline Development Tool [Software]. McMaster University, 2020 (developed by Evidence Prime, Inc.). [GRADEpro Guideline Development Tool [Software]. McMaster University, 2020 (developed by Evidence Prime, Inc.).]. Jan Brozek, Andrew Oxman, Holger Schünemann. Grading of Recommendations Assessment, Development and Evaluation (GRADE) Working Group, 2020. [gradepro.org]
Gulliford 1999
- Gulliford MC, Ukoumunne OC, Chinn S. Components of variance and intraclass correlations for the design of community-based surveys and intervention studies: data from the health survey for england. American Journal of Epidemiology 1999;149(9):876-83. [DOI] [PubMed] [Google Scholar]
Haas 2001
- Haas JD, Brownlie T 4th. Iron deficiency and reduced work capacity: a critical review of the research to determine a causal relationship. Journal of Nutrition 2001;131(2S-2):676S-688S; discussion 688S-690S. [DOI: 10.1093/jn/131.2.676S.] [DOI] [PubMed] [Google Scholar]
Hess 2016
- Hess S, Tecklenburg L, and Eichler K. Micronutrient Fortified Condiments and Noodles to Reduce Anaemia in Children and Adults—A Literature Review and Meta-Analysis. Nutrients 2016;8(2):88. [DOI] [PMC free article] [PubMed] [Google Scholar]
Higgins 2019
- Higgins JP, Thomas J, Chandler J, Cumpston M, Li T, Page MJ, et al. Cochrane Handbook for Systematic Reviews of Interventions. 2nd Edition. Chichester (UK): John Wiley & Sons, 2019. [Google Scholar]
Higgins 2021
- Higgins JPT Thomas J, Chandler J, Cumpston M, Li T, Page MJ, Welch VA (editors). Cochrane Handbook for Systematic Reviews of Interventions version 6.2 (updated February 2021). www.training.cochrane.org/handbook. February 2021.
Higgins 2021a
- Higgins JP TDeeks JJ (editors). Chapter 23: Including variants on randomized trials. In Higgins JP Thomas J, Chandler J, Cumpston M, Li T, Page MJ, Welch VA (editors. Cochrane Handbook for Systematic Reviews of Interventions Version 6.2 [updated February 2021]. Cochrane 2021. Available from www.training.cochrane.org/handbook. 2021.
Hoddinott 2013
- Hoddinott J, Rosegrant M, Torero M. Investments to Reduce Hunger and Undernutrition. Copenhagen Consensus Center; Copenhagen, Denmark. 2013:1-68.
Huo 2015
- Huo JS, Yin JY, Sun J, Huang J, Lu ZX, Regina MP, et al. Effect of NaFeEDTA-Fortified Soy Sauce on anaemia prevalence in China: a systematic review and meta-analysis of randomized controlled trials. Biomedical and Environmental Sciences : BES 2015;28(11):788-98. [PMID: ] [DOI] [PubMed] [Google Scholar]
Hurrell 1997
- Hurrell RF. Preventing iron deficiency through food fortification. Nutrition Reviews 1997;55(6):210-22. [DOI] [PubMed] [Google Scholar]
Hurrell 2010
- Hurrell R, Ranum P, De Pee S, Biebinger R, Hulthen L, Johnson Q, et al. Revised recommendations for iron fortification of wheat flour and an evaluation of the expected impact of current national wheat flour fortification programs. Food and Nutrition Bulletin 2010;31(1 Suppl):S7-21. [DOI] [PubMed] [Google Scholar]
Hurrell 2021
- Hurrell RF. Iron fortification practices and implications for iron addition to salt. Journal of Nutrition. 2021 ;15(151(Suppl 1)):3S-14S. [DOI: doi: 10.1093/jn/nxaa175] [PMID: ] [DOI] [PMC free article] [PubMed] [Google Scholar]
INACG 2002
- International Anaemia Consultative Group (INACG). Anaemia, Iron deficiency and iron deficiency anaemia. INACG 2002.
Lamparelli 1987
- Lamparelli RD, MacPhail AP, Bothwell TH, Ballot D, Danilewitz MD, Macfarlane BJ, et al. Curry powder as a vehicle for iron fortification: effects on iron absorption. American Journal of Clinical Nutrition 1987;46:335-40. [DOI] [PubMed] [Google Scholar]
Larson 2021
- Larson LM, Cyriac S, Djimeu EW, Mbuya MN, Neufeld LM. Can double fortification of salt with iron and iodine reduce anemia, iron deficiency anemia, iron deficiency, iodine deficiency, and functional outcomes? Evidence of efficacy, effectiveness, and safety. Journal of Nutrition 2021;151(Suppl 1):15S-28S. [PMID: ] [DOI] [PMC free article] [PubMed] [Google Scholar]
Lopes K 2021
- da Silva Lopes K, Yamaji N, Rahman MO, Suto M, Takemoto Y, Garcia-Casal MN, et al. Nutrition specific interventions for preventing and controlling anaemia throughout the life cycle: an overview of systematic reviews. Cochrane Database of Systematic Reviews 2021, Issue 9. Art. No: CD013092. [DOI: 10.1002/14651858.CD013092.pub2] [CD013092] [DOI] [PMC free article] [PubMed] [Google Scholar]
Lozoff 2006
- Lozoff B, Georgieff MK. Iron deficiency and brain development. Seminars in Pediatric Neurology 2006;13(3):158-65. [DOI] [PubMed] [Google Scholar]
Mantel‐Haenszel 1959
- Mantel N, Haenszel W. Statistical aspects of the analysis of data from retrospective studies of disease.. Journal of the NationalCancer Institute. 1959.;22(4):719-48.. [PubMed] [Google Scholar]
McKenzie 2021
- McKenzie JE, Brennan SE. Chapter 12: Synthesizing and presenting findings using other methods.. In: Higgins JPT, Thomas J, Chandler J, Cumpston M, Li T, Page MJ, Welch VA (editors), editors(s). Cochrane Handbook for Systematic Reviews of Interventions version 6.2. Cochrane, 2021. Available from www.training.cochrane.org/handbook, updated February 2021. [Google Scholar]
MECIR 2020
- Higgins JP, Lasserson T, Chandler J, Tovey D, Thomas J, EllaFlemyng, et al. https://methods.cochrane.org/methodological-expectations-cochrane-intervention-reviews. London: Cochrane, 2020 March. [Google Scholar]
Merriam‐Webster 2011
- Merriam-Webster Online Dictionary 2011. http://www.merriam-webster.com.
Murray‐Kolb 2009
- Murray-Kolb LE, Beard JL. Iron deficiency and child and maternal health. American Journal of Clinical Nutrition 2009;89(3):946S-950S. [DOI] [PubMed] [Google Scholar]
Neuberger 2016
- Neuberger A, Okebe J, Yahav D, Paul M. Oral iron supplements for children in malaria‐endemic areas. Cochrane Database of Systematic Reviews 2016, Issue 2. Art. No: CD006589. [DOI: 10.1002/14651858.CD006589.pub2] [DOI] [PMC free article] [PubMed] [Google Scholar]
Neufeld 2017
- Neufeld LM, Baker S, Garrett GS, Haddad L. Coverage and utilization in foodfFortification programs: critical and neglected areas ofeEvaluation. Journal of Nutrition 2017;147(5):1015S-9S. [PMID: ] [DOI] [PMC free article] [PubMed] [Google Scholar]
Ng 2006
- Ng TP, Chiam PC, Lee T, Chua HC, Lim L, Kua EH. Curry consumption and cognitive function in the elderly. American Journal of Epidemiology 2006;164(9):898-906. [DOI] [PubMed] [Google Scholar]
Oliver 2008
- Oliver S, Kavanagh J, Caird J, Lorenc T, Oliver K, Harden A, et al. Health promotion, inequalities and young people’s health: a systematic review of research. https://eppi.ioe.ac.uk/cms/LinkClick.aspx?fileticket=mVu6mYHcwbc%3D&tabid=2410 2008.
Oppenheimer 2001
- Oppenheimer SJ. Iron and its relation to immunity and infectious disease. Journal of Nutrition 2001;131(2S-2):616S-633S. [DOI] [PubMed] [Google Scholar]
PAHO 2002
- Pan American Health Organization (PAHO). Iron compounds for food fortification: guidelines for Latin America and the Caribbean 2002. Nutrition Reviews 2002;60(7):S50-S61. [DOI] [PubMed] [Google Scholar]
Petry 2016
- Petry N, Olofin I, Hurrell RF, Boy E, Wirth JP, Moursi M, et al. The proportion of anemia associated with iron deficiency in low, medium, and high human development index countries: a Systematic Analysis of National Surveys. Nutrients 2016;8(11):693. [DOI: 10.3390/nu8110693] [DOI] [PMC free article] [PubMed] [Google Scholar]
Peña‐Rosas 2019
- Peña-Rosas JP, Mithra P, Unnikrishnan B, Kumar N, De-Regil LM, Nair NS, et al. Fortification of rice with vitamins and minerals for addressing micronutrient malnutrition. Cochrane Database of Systematic Reviews 2019, Issue 10. Art. No: CD009902. [DOI: 10.1002/14651858.CD009902.pub2] [DOI] [PMC free article] [PubMed] [Google Scholar]
Peña‐Rosas 2014
- Peña‐Rosas JP, Field MS, Burford BJ, De‐Regil LM. Wheat flour fortification with iron for reducing anaemia and improving iron status in populations. Cochrane Database of Systematic Reviews 19 December 2020, Issue 9. Art. No: CD011302. [DOI: 10.1002/14651858.CD011302] [DOI] [PMC free article] [PubMed] [Google Scholar]
Ramírez‐Luzuriaga 2018
- Ramírez-Luzuriaga MJ, Larson LM, Mannar V, Martorel R. Impact of double-fortified salt with iron andiodine on hemoglobin, anaemia, and iron deficiency anaemia: a systematic review and meta-analysis. Advances in Nutrition 2018;9:207-18. [DOI] [PMC free article] [PubMed] [Google Scholar]
Research and Markets 2022
- Spices and seasonings market by type, by end-use, by nature, and by region forecast to 2030. Research and Markets 2022.
Review Manager 2020 [Computer program]
- Review Manager (RevMan). Version 5.4. Copenhagen, The Nordic Cochrane Centre: The Cochrane Collaboration, 2020.
Safiri 2021
- Safiri S, Kolahi AA, Noori M, Nejadghaderi SA, Karamzad N, Bragazzi NL, et al. Burden of anemia and its underlying causes in 204 countries and territories, 1990–2019: results from the Global Burden of Disease Study 2019. Journal of Hematology and Oncology 2021;14(1):185. [DOI: 10.1186/s13045-021-01202-2] [DOI] [PMC free article] [PubMed] [Google Scholar]
Schünemann 2021
- Schünemann HJ, Higgins JP, Vist GE, Glasziou P, Akl EA, Skoetz N, et al. Chapter 14: Completing ‘Summary of findings’tables and grading the certainty of the evidence.. In: HigginsJPT, homas J, Chandler J, Cumpston M, Li T, Page MJ, WelchVA, editor(s), editors(s). Cochrane Handbook for Systematic Reviews ofInterventions Version 6.2. Cochrane,2021. Available from training.cochrane.org/handbook, updated February 2021. [Google Scholar]
Smith 2007
- Smith AF. The Oxford Companion to American Food and Drink. New York: Oxford University Press, Inc., 2007. [Google Scholar]
Stevens 2022
- Stevens GA, Paciorek CJ, Flores-Urrutia MC, Borghi E, Namaste S, Wirth JP, et al. National, regional, and global estimates of anaemia by severity in women and children for 2000–19: a pooled analysis of population-representative data. Lancet Global Health 2022;10(5):E627-E639. [DOI: ] [DOI] [PMC free article] [PubMed] [Google Scholar]
The Micronutrient Initiative 2009
- The Micronutrients Initiative (MI), Flour Fortification Initiative, USAID, GAIN, WHO, The World Bank, UNICEF. Investing in the Future: A United Call to Action on Vitamin and Mineral Deficiencies: Global Report 2009. Ottawa: The Micronutrient Initiative, 2009. [ISBN: 978-1-894217-31-6] [Google Scholar]
Waller 2020
- Waller AW, Andrade JE, Mejia LA. Performance factors influencing efficacy and effectiveness of iron fortification programs of condiments for improving anaemia prevalence and iron status in populations: a systematic review. Nutrients 2020;12(2):275. [DOI: 10.3390/nu12020275] [PMID: ] [DOI] [PMC free article] [PubMed] [Google Scholar]
WFP 2006
- Nutrition Service of the World Food Program. Nutrition in emergencies: WFP experiences and challenges. Food and Nutrition Bulletin 2006;27(1):57-66. [DOI] [PubMed] [Google Scholar]
WHO 2007
- WHO. Assessing the iron status of populations: including literature reviews: report of a Joint World Health Organization/Centers for Disease Control and Prevention Technical Consultation on the Assessment of Iron Status at the Population Level, Geneva, Switzerland, 6-8 April 2004. Second edition. Geneva: World Health Organization, 2007. [Google Scholar]
WHO 2008
- WHO. Worldwide prevalence of anaemia 1993–2005: WHO global database on anaemia. Geneva: World Health Organization, 2008. [Google Scholar]
WHO 2009
- World Health Organization. Global Health Risks: mortality and burden of disease attributable to selected major risks. Geneva: World Health Organization, 2009. [Google Scholar]
WHO 2011a
- WHO. Haemoglobin Concentrations for the Diagnosis of Anaemia and Assessment of Severity. Vitamin and Mineral Nutrition Information System. Geneva: World Health Organization, 2011. [Google Scholar]
WHO 2011b
- WHO. Serum Ferritin Concentrations for the Assessment of Iron Status and Iron Deficiency in Populations. Vitamin and Mineral Nutrition Information System. Geneva: World Health Organization, 2011. [Google Scholar]
WHO 2014
- WHO. Global nutrition targets 2025: anaemia policy brief. Geneva: World Health Organization; 2014 (WHO/NMH/NHD/14.4). http://apps.who.int/iris/bitstream/handle/10665/148556/WHO_NMH_NHD_14.4_eng.pdf;jsessionid=4EAF9C32669A1190289DCDEDE6D73CD3?sequence=1, accessed 6 December, 2018.
WHO 2015
- World Health Organization ( (WHO). The global prevalence of anaemia in 2011. Geneva: World Health Organization 2015.
WHO 2022a
- World Health Organization (WHO). Anaemia. https://www.who.int/health-topics/anaemia#tab=tab_1.
WHO 2022b
- World Health Organization (WHO). Food fortification. https://www.who.int/health-topics/food-fortification#tab=tab_2 2022.
WHO/CDC 2016
- World Health Organization, Centers for Disease Control and Prevention. Logic model for micronutrient interventions in public health. WHO/CDC. Logic model for micronutrient interventions in public health. Vitamin and Mineral Nutrition Information System. Geneva, World Health Organization, 2016 (WHO/NMH/NHD/EPG/16.1) (http://apps.who.int/iris/bitstream/10665/250746/3/WHO-NMH-NHD-EPG-16.1-colour-eng.pdf, accessed 19 November 2018). 2016.
WHO/UNICEF 2003
- WHO, UNICEF. Global strategy for infant and young child feeding. Geneva: World Health Organization, 2003. [Google Scholar]
World Bank 1993
- World Bank. Investing in Health: World Development Report. New York: Oxford University Press, 1993. [Google Scholar]
World Bank 2019
- The World Bank Group. World Bank Country and Lending Groups. https://datahelpdesk.worldbank.org/knowledgebase/articles/906519:(accessed November 2020).. [https://datahelpdesk.worldbank.org/knowledgebase/articles/906519-world-bank-country-and-lending-groups]
World Bank Institute and GAIN, 2008
- World Bank Institute and Global Alliance for Improved Nutrition. Two Wheels Turning: Partnership in China’s Soy Sauce Fortification Program. Business Innovation to Combat Malnutrition Case Study Series 2008.
Young 2018
- Young MF. Maternal anaemia and risk of mortality: a call for action. Lancet Global Health 2018;6(5):e479-80. [DOI: 10.1016/S2214-109X(18)30185-2] [DOI] [PubMed] [Google Scholar]
Zamora 2016
- Zamora G, Flores-Urrutia MC, and Mayen A-L. Large-scale fortification of condiments and seasoningsas a public health strategy: equity considerations for implementation. ANNALS OF THE NEW YORK ACADEMY OF SCIENCES 2016;1379:17-27. [DOI] [PubMed] [Google Scholar]
Zimmerman 2021
- Zimmermann MB and ndersson M. GLobal Endocrinology: Global perspectives in endocrinology: coverage of iodized salt programs and iodine status in 2020. European Journal of Endocrinology 2021;185(1):R13-R21. [DOI] [PMC free article] [PubMed] [Google Scholar]
References to other published versions of this review
Self 2012
- Self JL, Serdula M, Dowswell T, De‐Regil LM. Fortification of condiments and seasonings with iron for preventing anaemia and improving health. Cochrane Database of Systematic Reviews 2012, Issue 2. Art. No: CD009604. [DOI: 10.1002/14651858.CD009604] [DOI] [PMC free article] [PubMed] [Google Scholar]