

Abstract
Background
The Angioedema Control Test (AECT) is a patient‐reported outcome measure developed and validated for the assessment of disease control in patients with recurrent angioedema. Its sensitivity to change and minimal clinically important difference (MCID) have hitherto not been established.
Methods
Patients with recurrent angioedema due to chronic spontaneous urticaria, hereditary angioedema, or acquired C1‐inhibitor deficiency were repeatedly asked to complete the AECT along with the Angioedema Quality of Life Questionnaire (AE‐QoL), Dermatology Life Quality Index (DLQI), and anchors for disease control and whether treatment was sufficient during routine care visits. The sensitivity to the change of the AECT was determined by correlating changes in its scores over time with changes in the applied anchors. The MCID was determined using anchor‐based and distributional criterion‐based approaches.
Results
Eighty‐six cases were used for this analysis. Changes in AECT scores correlated well with AE‐QoL changes (but less with changes in the DLQI) as well as other applied anchors, demonstrating its sensitivity to change. The MCID was found to be three points for improvement of angioedema control. The available number of cases with meaningful deterioration in our dataset was too low to reach a definite conclusion on the MCID for deterioration of angioedema control.
Conclusion
The AECT is a valuable tool to assess changes in disease control in patients with recurrent angioedema over time. The lowest AECT score change that reflects a meaningful improvement of disease control to patients (MCID) is three points.
Keywords: angioedema, disease control, minimal clinically important difference (MCID)7, patient‐reported outcome measures (PROMs), sensitivity to change
1. INTRODUCTION
Angioedema is defined by a localised and self‐limiting swelling of the subcutaneous and/or submucosal tissue due to a temporary increase of vascular permeability. In recurrent angioedema, swellings occur episodically and can affect several locations of the body, that is, the tongue, extremities, abdomen or upper respiratory tract. 1 Most cases of recurrent angioedema are either mast cell‐mediated (e.g. in patients with chronic urticaria) or bradykinin‐mediated (e.g. in patients with hereditary angioedema due to C1‐inhibitor deficiency [HAE‐C1INH] or acquired C1‐inhibitor deficiency [AAE‐C1INH]).
The high burden of recurrent angioedema is caused by its unpredictable, painful, disfiguring, disabling, and sometimes even life‐threatening clinical manifestation. Angioedema attacks affect daily activities, social relations, and cause high rates of absenteeism and presenteeism. 2 , 3 , 4 Several prophylactic and acute treatment options are available for most types of recurrent angioedema. They differ in efficacy, administration route, and side effects but are all aimed at improving disease control, since curation is (currently) not possible. 5 , 6 Complete disease control is the treatment goal in mast cell‐mediated and bradykinin‐mediated recurrent angioedema. 6 , 7 , 8 , 9
Given the unpredictability and day‐to‐day fluctuation of symptoms, 10 it is difficult to establish disease activity, disease burden, and treatment response based on clinical signs and symptoms during routine care visits. 11 To effectively treat patients with recurrent angioedema, it is important to have valid and reliable tools to capture the actual disease status. 12 , 13 Therefore, several patient‐reported outcome measures (PROMs) have been developed for patients with recurrent angioedema, 14 , 15 , 16 including the Angioedema Control Test (AECT). 6 , 8 The AECT has been developed and validated to assess disease control in patients with recurrent angioedema. 17 , 18 Previous studies have shown that it is well suited for routine practice, 19 , 20 clinical research, 21 , 22 , 23 , 24 , 25 and therapeutic trials 26 given its retrospective approach, brevity, and simple scoring. The AECT has excellent internal consistency and test‐retest reliability, as well as high convergent validity and good known‐groups validity. 18 , 27 The cut‐off scores for identifying patients with well‐controlled disease and poorly controlled disease have been established at ≥10 and <10, respectively. 18 , 27
For both clinical practice and trials, it is imperative to know the ability of the AECT to determine changes over time, for example, before and after treatment adjustment. However, as of yet, this property of the AECT has not been investigated. Apart from dichotomising AECT scores in poor or good angioedema control, the interpretation of AECT score changes is difficult because it is currently unclear which score changes are meaningful to patients. In other words, the minimal clinically important difference (MCID), that is, the smallest change that patients would identify as a noticeable and meaningful improvement, of the AECT is unknown. To address these gaps of knowledge, the current study aimed to determine the sensitivity to change and MCID of the AECT.
2. METHODS
2.1. Patient population
Consecutive German‐speaking patients with recurrent angioedema aged 12 years or older treated at the Angioedema Center of Reference and Excellence (ACARE, https://acare‐network.com) 28 of the Institute of Allergology of the Charité—Universitätsmedizin Berlin were invited to participate. Informed consent was obtained from all individual participants included in the study. The participants were asked to complete the German version of the AECT along with other PROMs during several successive routine care visits. This study was approved by the ethics committee of the Charité—Universitätsmedizin Berlin (EA4/020/20).
2.2. Patient‐reported outcome measures
2.2.1. Angioedema control test
The AECT is an angioedema‐specific, valid, and reliable questionnaire that assesses disease control. It can be used in all patients with recurrent angioedema, that is, mast cell‐mediated (e.g. chronic spontaneous urticaria) and bradykinin‐mediated (e.g. HAE‐C1INH) angioedema. Two separate versions, with a recall period of 4 weeks and 3 months are available. The present study used the version with a 4 week recall period. 17 The AECT consists of four questions with five answer options each (scored with 0–4 points). Accordingly, AECT scores range from 0 to 16 points, with 16 points indicating complete disease control. Cut‐off scores for well versus poorly controlled disease have been established at ≥10 and <10, respectively. 18 , 27 Participants were asked to answer the AECT at baseline and at a follow‐up visit.
2.2.2. Patients' self‐assessment of global disease control, change in global disease control, and treatment sufficiency
Along with the AECT, all patients were asked to self‐rate their global angioedema control during the past 4 weeks on a 5‐point Likert scale (Pat‐GA‐control, answer options: ‘completely controlled’, ‘well controlled’, ‘moderately controlled’, ‘hardly controlled’, ‘not at all controlled’). In addition, they indicated if their angioedema treatment in the past 4 weeks was ‘sufficient’ or ‘not sufficient’. At the follow‐up visit, patients were also asked to self‐rate the global change in angioedema control in comparison to the last time they filled out the AECT on a 7‐point Likert scale (Pat‐GA‐control‐change, answer options: ‘improvement to complete control’, ‘clearly better controlled’, ‘slightly better controlled’, ‘no change in control’, ‘slightly worse controlled’, ‘clearly worse controlled’, ‘deterioration to complete lack of control’). The treating physicians of the patients were asked to fill out these questions from their perspective as well (Phy‐GA‐control and Phy‐GA‐control‐change).
2.2.3. Quality of life measures
The Angioedema Quality of Life Questionnaire (AE‐QoL) is an angioedema‐specific, validated health‐related quality of life (QoL) measure with a recall period of 4 weeks. It contains 17 questions from which a total score on a 0–100 scale can be computed. 15 , 29 The Dermatology Life Quality Index (DLQI) is a health‐related QoL measure for dermatological disorders with a recall period of 7 days. It contains 10 questions from which a sum score on a 0–30 scale can be computed. 30 Higher scores for the AE‐QoL and DLQI are both indicative of a higher QoL impairment. The patients filled out both questionnaires along with the AECT at both visits. Figure 1 shows the study flow diagram including the information obtained and anchors used at the baseline and follow‐up visits. Patients who visited the out‐patient clinic more than two times during the course of this study could fill‐out additional follow‐up visit questionnaires.
FIGURE 1.
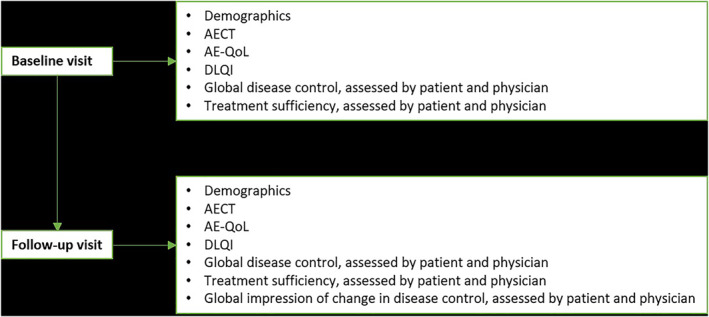
Study flow chart. At the baseline and follow‐up visit demographics, the AECT and several anchors were obtained. AECT, Angioedema Control Test; AE‐QoL, Angioedema Quality of Life Questionnaire; DLQI, Dermatology Life Quality Index.
2.3. Data analysis
2.3.1. Sensitivity to change
Sensitivity to change is the ability of a PROM to detect change over time in the patient's disease status, regardless of whether this change is clinically relevant or meaningful. To assess the sensitivity to the change of the AECT, we computed the rank correlation coefficient (Spearman's rho) for AECT total and individual question score changes between two different time points with changes in the AE‐QoL, DLQI, Pat‐GA‐control, Phy‐GA‐control and treatment sufficiency. The rank correlation coefficient was also calculated for the AECT score changes with the patients' and physicians' global impression of change in disease control, that is, the Pat‐GA‐control‐change and Phy‐GA‐control‐change, respectively, at the follow‐up visit.
2.3.2. Responsiveness
Responsiveness is the ability of an instrument to determine meaningful changes in the patient's disease status over time. It is commonly reported through the minimal clinically important difference (MCID). A change equal to or higher than the MCID can be considered a meaningful change. To determine the MCID of the AECT, we applied anchor‐based and distributional criterion‐based approaches, as described previously. 31 , 32 The anchor‐based approaches were applied by computing the mean intra‐individual differences of AECT total and individual question scores between assessments with different Pat‐GA‐control ratings (defined as a change of one step, e.g. from no at all controlled to hardly controlled, or from well controlled to moderately controlled) and AE‐QoL change (defined as a change of one step. A one‐step change was defined as an AE‐QoL change of 6 to <12 points as the MCID of the AE‐QoL is 6 points. 29 A two‐step change was defined as an AE‐QoL change of 12 to <18 points). In addition, the intra‐individual variation of AECT total and individual question scores in case of stable disease (unchanged PAT‐GA‐control or AE‐QoL) were analysed. For the use of Pat‐GA‐control and AE‐QoL for these responsiveness analyses, the correlation (Spearman's rho) of their changes and AECT score changes should be 0.5 or higher. Finally, the Pat‐GA‐control was used to perform a receiver operating characteristic (ROC) curve analysis to identify the best cut‐off point for clinically meaningful changes in the AECT total score. For this analysis, patients were categorised as subjects with a change in angioedema control (defined as at least one‐step change in their global angioedema control rating) and subjects without a change in angioedema control. Likewise, ROC curve analysis was performed with patients divided into groups based on change in AE‐QoL scores (e.g. at least one‐step change, which was defined as an AE‐QoL change of at least 6 points). The ROC cut‐off point was chosen by getting the smallest sum of percentages of false positive and false negative classifications ([1‐sensitivity] + [1‐specificity]). 33 The distributional criterion approach to calculate the MCID indirectly is based on the finding that one‐half of the standard deviation (SD) of an instrument's results may represent a good approximation of its MCID. 32 Accordingly, the SD of all baseline AECT total scores was computed and subsequently divided by two. Another distribution‐based approach is one standard error of the mean (SEM), as this may represent an approximation of the MCID as well. 34
2.3.3. Sensitivity analysis
If patients filled out more than two rounds of questionnaires, these additional cases were included in the analyses. As a sensitivity analysis, all analyses were repeated with one pair of questionnaires from unique individuals.
2.3.4. Statistical analysis
All statistical analyses were conducted in R version 4.0.3. 35 The statistical methods applied are described in the respective methods and/or results sections of this manuscript. p ≤ 0.05 was considered statistically significant. Missing data were not imputed. Data from eight cases concerning patients' assessment of global angioedema control and whether or not treatment was sufficient were removed due to implausibility.
3. RESULTS
3.1. Demographics
In total, 86 cases (66 individual patients, average number of AECTs completed per patient: 2.5) were included, with a mean ± SD age of 50.5 ± 17.1 years (Table 1). Of the 66 participants, 39 (59%) had bradykinin‐mediated angioedema and 24 (36%) had mast cell‐mediated angioedema. HAE‐C1INH was the most frequent diagnosis (41%), and 73% of all cases were women. The median AECT score (interquartile range) at baseline was 10 (6–13) and 13 (7–16) at follow‐up.
TABLE 1.
Patient characteristics.
| Type of angioedema | All | Chronic urticaria with angioedema | Isolated angioedema | HAE type 1 or 2 | HAE‐nC1INH | AAE‐C1INH | Unknown |
|---|---|---|---|---|---|---|---|
| n | 66 | 9 | 15 | 27 | 1 | 11 | 3 |
| Sex (%) | |||||||
| Female | 48 (72.7) | 6 (66.7) | 9 (60.0) | 21 (77.8) | 1 (100.0) | 8 (72.7) | 3 (100.0) |
| Male | 18 (27.3) | 3 (33.3) | 6 (40.0) | 6 (22.2) | 0 (0.0) | 3 (27.3) | 0 (0.0) |
| Baseline | |||||||
| Age (mean (SD)) | 50.50 (17.11) | 48.78 (19.72) | 54.13 (17.33) | 44.78 (15.57) | 46.00 (NA) | 71.91 (9.69) | 63.33 (5.77) |
| Antihistamine (%) | 10 (15.2) | 5 (55.6) | 5 (53.3) | 0 (0.0) | 0 (0.0) | 0 (0.0) | 0 (0.0) |
| Steroids (%) | 6 (9.1) | 1 (11.1) | 5 (33.3) | 0 (0.0) | 0 (0.0) | 0 (0.0) | 0 (0.0) |
| Omalizumab (%) | 6 (9.1) | 2 (22.2) | 2 (13.3) | 0 (0.0) | 0 (0.0) | 0 (0.0) | 2 (66.7) |
| Icatibant (%) | 22 (33.3) | 0 (0.0) | 2 (13.3) | 12 (44.4) | 1 (100.0) | 7 (63.6) | 0 (0.0) |
| C1‐inhibitor on demand (%) | 10 (15.2) | 0 (0.0) | 0 (0.0) | 8 (29.6) | 0 (0.0) | 2 (18.2) | 0 (0.0) |
| C1‐inhibitor prophylactic (%) | 5 (7.6) | 0 (0.0) | 0 (0.0) | 5 (18.5) | 0 (0.0) | 0 (0.0) | 0 (0.0) |
| Lanadelumab (%) | 13 (19.7) | 0 (0.0) | 0 (0.0) | 10 (37.0) | 0 (0.0) | 3 (27.3) | 0 (0.0) |
| Other (%) | 3 (4.5) | 2 (22.2) | 1 (6.7) | 0 (0.0) | 0 (0.0) | 0 (0.0) | 0 (0.0) |
| No treatment (%) | 7 (10.6) | 2 (22.2) | 3 (20.0) | 0 (0.0) | 0 (0.0) | 1 (9.1) | 1 (33.3) |
| Unknown treatment (%) | 1 (1.2) | 0 (0.0) | 0 (0.0) | 0 (0.0) | 0 (0.0) | 1 (9.1) | 0 (0.0) |
| Follow‐up | |||||||
| Antihistamine (%) | 15 (22.7) | 6 (75.0) | 8 (53.3) | 0 (0.0) | 0 (0.0) | 1 (9.1) | 0 (0.0) |
| Steroids (%) | 5 (7.6) | 0 (0.0) | 3 (20.0) | 0 (0.0) | 0 (0.0) | 0 (0.0) | 2 (66.7) |
| Omalizumab (%) | 12 (18.2) | 5 (55.6) | 5 (33.3) | 0 (0.0) | 0 (0.0) | 0 (0.0) | 2 (66.7) |
| Icatibant (%) | 21 (31.8) | 0 (0.0) | 1 (6.7) | 12 (44.4) | 1 (100.0) | 7 (63.6) | 0 (0.0) |
| C1‐inhibitor on demand (%) | 10 (15.5) | 0 (0.0) | 0 (0.0) | 8 (29.6) | 0 (0.0) | 2 (18.2) | 0 (0.0) |
| C1‐inhibitor prophylactic (%) | 5 (7.6) | 0 (0.0) | 0 (0.0) | 4 (14.8) | 0 (0.0) | 1 (8.3) | 0 (0.0) |
| Lanadelumab (%) | 16 (24.2) | 0 (0.0) | 0 (0.0) | 12 (44.4) | 0 (0.0) | 4 (36.4) | 0 (0.0) |
| Other (%) | 3 (4.5) | 1 (11.1) | 1 (6.7) | 0 (0.0) | 0 (0.0) | 1 (9.1) | 0 (0.0) |
| No treatment (%) | 12 (18.2) | 1 (11.1) | 3 (20.0) | 5 (18.5) | 0 (0.0) | 3 (27.3) | 0 (0.0) |
| Unknown treatment (%) | 0 (0.0) | 0 (0.0) | 0 (0.0) | 0 (0.0) | 0 (0.0) | 0 (0.0) | 0 (0.0) |
Abbreviations: AAE‐C1INH, acquired angioedema with C1‐inhibitor deficiency; HAE, hereditary angioedema; HAE‐nC1INH, hereditary angioedema with normal C1‐inhibitor; SD, standard deviation.
3.2. The AECT shows high sensitivity to change
The AECT total score change over time correlated significantly with the patients' and physicians' global impression of change in disease control, assessed by Pat‐GA‐control‐change and Phy‐GA‐control‐change, respectively. AECT changes were also correlated with those of the Pat‐GA‐control, Phy‐GA‐control, AE‐QoL, and DLQI scores as well as with treatment sufficiency (Table 2). The strength of the correlation of AECT changes and anchor results was high (r > 0.5), except for the DLQI (r = 0.3) and Pat‐GA‐control‐change (r = 0.3).
TABLE 2.
Correlations of changes in patients' and physicians' assessed global disease control, AE‐QoL, DLQI, and treatment sufficiency with AECT total and individual scores.
| AECT total score change | AECT Q1 change | AECT Q2 change | AECT Q3 change | AECT Q4 change | |
|---|---|---|---|---|---|
| Global disease control change, assessed by patient (change in pat‐GA‐control) a (95% CI) | 0.82 (0.73 to 0.91) | 0.64 (0.48 to 0.80) | 0.79 (0.68 to 0.90) | 0.61 (0.46 to 0.76) | 0.86 (0.78 to 0.95) |
| p < 0.001 | p < 0.001 | p < 0.001 | p < 0.001 | p < 0.001 | |
| AE‐QoL change b (95% CI) | −0.60 (−0.78 to −0.43) | −0.54 (−0.73 to −0.35) | −0.61 (−0.78 to −0.43) | −0.51 (−0.71 to −0.31) | −0.51 (−0.72 to −0.31) |
| p < 0.001 | p < 0.001 | p < 0.001 | p < 0.001 | p < 0.001 | |
| DLQI change c (95% CI) | −0.27 (−0.52 to −0.01) | −0.31 (−0.55 to −0.06) | −0.30 (−0.54 to −0.06) | −0.27 (−0.49 to −0.04) | −0.17 (−0.43 to −0.08) |
| p = 0.019 | p = 0.006 | p = 0.007 | p = 0.019 | p = 0.127 | |
| Treatment sufficiency change, assessed by patient d (95% CI) | 0.63 (0.41 to 0.84) | 0.55 (0.31 to 0.79) | 0.59 (0.37 to 0.82) | 0.38 (0.12 to 0.64) | 0.71 (0.57 to 0.85) |
| p < 0.001 | p < 0.001 | p < 0.001 | p = 0.001 | p < 0.001 | |
| Global impression of change in disease control at follow‐up, assessed by patient (pat‐GA‐control‐change) e (95% CI) | −0.33 (−0.53 to −0.12) | −0.37 (−0.57 to −0.17) | −0.34 (−0.55 to −0.13) | −0.10 (−0.34 to 0.13) | −0.33 (−0.53 to −0.12) |
| p = 0.004 | p = 0.001 | p = 0.003 | p = 0.384 | p = 0.005 | |
| Global disease control change, assessed by physician (change in phy‐GA‐control) f (95% CI) | 0.73 (0.52 to 0.93) | 0.74 (0.55 to 0.94) | 0.68 (0.45 to 0.91) | 0.48 (0.18 to 0.76) | 0.51 (0.21 to 0.80) |
| p < 0.001 | p < 0.001 | p < 0.001 | p = 0.003 | p = 0.001 | |
| Treatment sufficiency change, assessed by physician g (95% CI) | 0.64 (0.40 to 0.88) | 0.64 (0.45 to 0.84) | 0.64 (0.39 to 0.89) | 0.50 (0.21 to 0.79) | 0.38 (−0.05 to 0.80) |
| p < 0.001 | p < 0.001 | p < 0.001 | p = 0.002 | p = 0.024 | |
| Global impression of change in disease control at follow‐up, assessed by physician (phy‐GA‐control‐change) h (95% CI) | −0.52 (−0.74 to −0.29) | −0.48 (−0.71 to −0.24) | −0.50 (−0.73 to −0.27) | −0.27 (−0.57 to 0.02) | −0.42 (−0.68 to −0.15) |
| p < 0.001 | p = 0.001 | p < 0.001 | p = 0.073 | p = 0.005 |
Note: Presented are the results of rank correlation with the correlation coefficient Spearman's rho. A coefficient of 0.1–0.3 is considered a weak correlation, 0.3–0.5 a moderate correlation and >0.5 a high correlation. The correlation coefficient is negative in terms of the correlation of changes in the AECT with changes in AE‐QoL and DLQI, because higher AECT scores represent higher degree of disease control, whereas higher AE‐QoL and DLQI scores represent more impact on quality of life. Likewise, the Pat‐GA‐control‐change and Phy‐GA‐control‐change have negative correlation coefficients because positive scores represent improvement of disease control, which correlates with negative delta AECT scores (i.e. AECT score change = AECT at baseline—AECT at follow‐up). The first anchor was assessed by asking patients to self‐rate their global angioedema control during the past 4 weeks on a 5‐point Likert scale (answer options: ‘completely controlled’, ‘well controlled’, ‘moderately controlled’, ‘hardly controlled’, ‘not at all controlled’).
Abbreviations: AECT, Angioedema Control Test; AE‐QoL, Angioedema Quality of Life Questionnaire; CI, confidence interval; DLQI, Dermatology Life Quality Index; Q1‐4, Questions 1‐4 of the AECT.
n = 72.
n = 80.
n = 78.
n = 69.
n = 74.
n = 37.
n = 36.
n = 44.
For 18 cases, treatment changed from insufficient to sufficient, which was associated with a mean improvement in the AECT total score of 6.0 points. For three cases, treatment changed from sufficient to insufficient, which was associated with a mean deterioration in the AECT total score of 6.3 points. Treatment was and remained insufficient for 10 cases, associated with a mean change of 0.0 points in the AECT total score. Treatment was and remained sufficient for 37 cases, associated with a mean improvement of 1.0 point in the AECT total score.
3.3. The MCID of the AECT is three points
Four anchor‐based approaches were used to determine the MCID of the AECT. First (Table 3), for cases who reported relevant improvement of disease control, that is, one step in the Pat‐GA‐control, the mean (±SD) change in the AECT value was 4.5 ± 2.6 (median: 4.5 points, IQR: 2.8–6.0 points). Second, cases with a pertinent improvement in quality of life, that is, a one‐step (6–11 points) improvement in the AE‐QoL, showed a change in AECT of 2.9 ± 2.9 points (median: 3.0 points, IQR: 2.0–4.0 points). Third, by ROC curve analysis, the cut‐off point for AECT improvement with the best balance of sensitivity (86%) and specificity (91%) was found to be three points, based on the change in Pat‐GA‐control (Table 4, Figure 2A). Fourth, the change in AE‐QoL score, by ROC analysis, also supported an MCID of three points (Table 4, sensitivity: 73% and specificity: 86%, Figure 2B).
TABLE 3.
Magnitude of AECT total and individual question score changes (mean ± SD) during improved or deteriorated angioedema control assessed by patients (e.g. one‐step change in global control means from not at all controlled to hardly controlled, completely controlled to well controlled, etc.) and improved or deteriorated AE‐QoL (one‐step = 6 to <12 points, two steps = 12 to <18 points).
| AECT total score change | AECT Q1 change | AECT Q2 change | AECT Q3 change | AECT Q4 change | |
|---|---|---|---|---|---|
| Global control | |||||
| Improved global control by two steps | −6.222 ± 3.930 | −1.556 ± 1.509 | −1.556 ± 1.130 | −1.111 ± 1.167 | −2.000 ± 0.866 |
| Median: −6.000 n = 9 | Median: −2.000 n = 9 | Median: −1.000 n = 9 | Median: −1.000 n = 9 | Median: −2.000 n = 9 | |
| Improved global control by one step | −4.500 ± 2.646 | −1.583 ± 1.443 | −1.167 ± 0.577 | −0.833 ± 0.937 | −0.917 ± 0.515 |
| Median: −4.500 n = 12 | Median: −1.000 n = 12 | Median: −1.000 n = 12 | Median: −0.500 n = 12 | Median: −1.000 n = 12 | |
| Unchanged global control | −0.167 ± 2.091 | −0.139 ± 0.899 | 0.056 ± 0.893 | −0.056 ± 0.754 | −0.028 ± 0.654 |
| Median: 0.000 n = 36 | Median: 0.000 n = 36 | Median: 0.000 n = 36 | Median: 0.000 n = 36 | Median: 0.000 n = 36 | |
| Deteriorated global control by one step | 5.400 ± 1.673 | 1.600 ± 0.545 | 1.400 ± 0.545 | 1.200 ± 0.837 | 1.200 ± 0.447 |
| Median: 5.000 n = 5 | Median: 2.000 n = 5 | Median: 1.000 n = 5 | Median: 1.000 n = 5 | Median: 1.000 n = 5 | |
| Quality of life | |||||
| AE‐QoL improved with 12–18 points | −5.778 ± 2.386 | −1.667 ± 1.118 | −1.333 ± 0.707 | −1.222 ± 0.667 | −1.156 ± 1.509 |
| Median: −6.000 n = 9 | Median: −2.000 n = 9 | Median: −1.000 n = 9 | Median: −1.000 n = 9 | Median: −1.000 n = 9 | |
| AE‐QoL improved with 6–11 points | −2.923 ± 2.871 | −0.923 ± 1.256 | −0.846 ± 0.555 | −0.308 ± 0.855 | −0.846 ± 1.573 |
| Median: −3.000 n = 13 | Median: −1.000 n = 13 | Median: −1.000 n = 13 | Median: 0.000 n = 13 | Median: −1.000 n = 13 | |
| Unchanged AE‐QoL | −0.706 ± 3.030 | −0.177 ± 0.999 | −0.177 ± 0.936 | −0.147 ± 0.744 | −0.206 ± 0.770 |
| Median: 0.000 n = 34 | Median: 0.000 n = 34 | Median: 0.000 n = 34 | Median: 0.000 n = 34 | Median: 0.000 n = 34 | |
| AE‐QoL deteriorated with 6–11 points | 1.667 ± 2.733 | 0.167 ± 0.753 | 0.167 ± 0.753 | 0.333 ± 1.033 | 1.000 ± 1.789 |
| Median: 1.500 n = 6 | Median: 0.000 n = 6 | Median: 0.000 n = 6 | Median: 0.000 n = 6 | Median: 0.500 n = 6 | |
| AE‐QoL deteriorated with 12–17 points | −0.167 ± 5.672 | −0.333 ± 1.751 | 0.333 ± 1.633 | 0.667 ± 1.211 | −0.833 ± 1.722 |
| Median: −1.000 n = 6 | Median: −0.500 n = 6 | Median: 0.500 n = 6 | Median: 0.500 n = 6 | Median: 0.000 n = 6 | |
Note: The AE‐QoL score ranges were based on the MCID of the AE‐QoL, that is, 6 points.
Abbreviations: AECT, Angioedema Control Test; AE‐QoL, Angioedema Quality of Life questionnaire; SD, standard deviation; Q1‐4, Questions 1‐4 of the AECT.
TABLE 4.
Performance of the AECT at various cut‐off values in screening for a meaningful improvement in global angioedema control and AE‐QoL (6 or more points).
| Global control | Quality of life | |||||
|---|---|---|---|---|---|---|
| AECT score improvement (cut‐off value) | Sensitivity (patients correctly classified as global control improved) (%) | Specificity (patients correctly classified as global control not improved) (%) | Cohen's kappa | Sensitivity (patients correctly classified as improved AE‐QoL) (%) | Specificity (patients correctly classified as not improved AE‐QoL) (%) | Cohen's kappa |
| 0 | 29/29 (100.0) | 14/43 (32.6) | 0.28 | 28/30 (93.3) | 16/50 (32.0) | 0.21 |
| 1 | 27/29 (93.1) | 28/43 (65.1) | 0.54 | 26/30 (86.7) | 31/50 (62.0) | 0.44 |
| 2 | 27/29 (93.1) | 35/43 (81.4) | 0.72 | 25/30 (83.3) | 39/50 (78.0) | 0.59 |
| 3 | 25/29 (86.2) | 39/43 (90.7) | 0.77 | 22/30 (73.3) | 43/50 (86.0) | 0.60 |
| 4 | 23/29 (79.3) | 41/43 (95.3) | 0.76 | 20/30 (66.7) | 45/50 (90.0) | 0.59 |
| 5 | 20/29 (67.0) | 43/43 (100.0) | 0.73 | 16/30 (53.3) | 45/50 (90.0) | 0.46 |
| 6 | 18/29 (62.1) | 43/43 (100.0) | 0.66 | 13/30 (43.3) | 45/50 (90.0) | 0.36 |
| 7 | 11/29 (37.9) | 43/43 (100.0) | 0.42 | 7/30 (23.3) | 46/50 (92.0) | 0.18 |
| 8 | 8/29 (27.6) | 43/43 (100.0) | 0.31 | 6/30 (20.0) | 48/50 (96.0) | 0.19 |
| 9 | 7/29 (24.1) | 43/43 (100.0) | 0.28 | 5/30 (16.7) | 48/50 (96.0) | 0.15 |
| 10 | 1/29 (3.4) | 43/43 (100.0) | 0.04 | 1/30 (3.3) | 50/50 (100.0) | 0.04 |
| 11 | 1/29 (3.4) | 43/43 (100.0) | 0.04 | 1/30 (3.3) | 50/50 (100.0) | 0.04 |
| 12 | 1/29 (3.4) | 43/43 (100.0) | 0.04 | 1/30 (3.3) | 50/50 (100.0) | 0.04 |
| 13 | 1/29 (3.4) | 43/43 (100.0) | 0.04 | 1/30 (3.3) | 50/50 (100.0) | 0.04 |
| 14 | 1/29 (3.4) | 43/43 (100.0) | 0.04 | 1/30 (3.3) | 50/50 (100.0) | 0.04 |
| 15 | 1/29 (3.4) | 43/43 (100.0) | 0.04 | 1/30 (3.3) | 50/50 (100.0) | 0.04 |
| 16 | 0/29 (0.0) | 43/43 (100.0) | 0.00 | 0/30 (0.0) | 50/50 (100.0) | 0.00 |
Abbreviations: AECT, Angioedema Control Test; AE‐QoL, Angioedema Quality of Life questionnaire.
FIGURE 2.
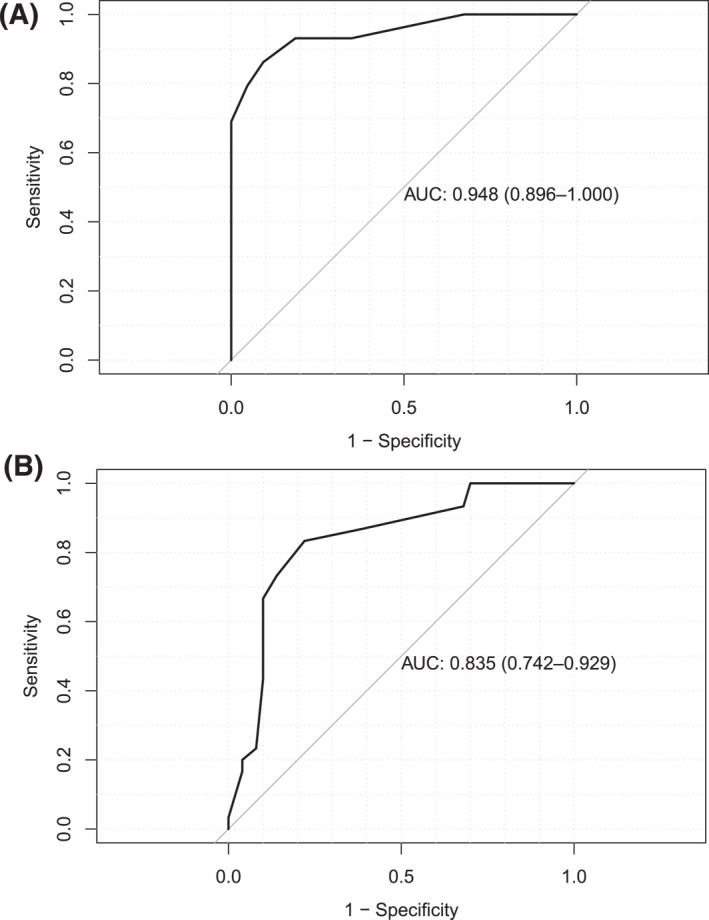
ROC curves. (A) Area under the ROC curve for AECT changes related to improvement versus non‐improvement in patients' self‐rated global angioedema control = 0.95 (95% confidence interval: 0.90–1.00). (B) Area under the ROC curve for AECT changes related to improvement versus non‐improvement in patients' self‐rated angioedema‐related quality of life = 0.96 (95% confidence interval: 0.89–1.00). AECT, Angioedema Control Test; ROC, receiver operating characteristic.
In addition, we calculated the MCID of the AECT by the use of two distributional criterion approaches. First, we divided the SD of all baseline AECT total score values (4.9) by two, which resulted in an MCID of 2.5 points. Second, the calculation of the SEM yielded an AECT MCID of 0.5 points.
3.4. Sensitivity analyses
Repeating the analyses described above using only data from unique individuals (n = 66) resulted in comparable correlation coefficients and MCID estimates (data not shown).
4. DISCUSSION
Here we report, for the first time, sensitivity to change and responsiveness of the AECT as well as its MCID. The AECT is an easy to use and validated PROM developed to assess disease control in patients with recurrent angioedema. 18 It is available in many languages 36 and widely used in clinical trials and routine practice as recommended by current international guidelines. 6 , 8
We found that changes in the AECT correlate well with anchor instruments that measure changes in angioedema control, health‐related QoL, and treatment sufficiency. However, the correlation of a change in the total AECT score with a patients' global impression of change in angioedema control assessed at the follow‐up visit was lower than expected. We believe this is due to recall bias, an assumption strengthened by the observation that, in contrast, a good correlation between changes in the AECT score and changes in the patients' assessed global angioedema control was found.
The availability of an MCID is critical for the interpretation of results obtained by a PROM. By applying anchor‐based and distributional criterion‐based approaches, we found the MCID of the AECT to be between 2.5 and 4.5 points. We clearly favour the mean‐change and ROC curve analysis anchor‐based approaches over the distributional‐based approaches, since they represent more direct and patient‐centred methods and are generally accepted to have higher clinical relevance. Therefore, we recommend three points to be used as the MCID for the AECT score for improvement in angioedema control. In other words, an increase in the AECT score by three points or more can be regarded as a meaningful change to the patient.
A limitation of our study is the low number of cases experiencing deteriorating disease control in our sample. Thus, the available data do not allow for the computation of the MCID for deterioration. The MCID for improvement (three points) cannot simply be applied to deterioration, since it is known that these often differ. A meta‐analysis of 118 prospective cohort studies showed that generally smaller estimates for improvement compared with deterioration are found. 37 Furthermore, the cause of recurrent angioedema was unknown in three patients included in this study. Still, they did experience recurrent angioedema and the AECT was thus an applicable tool to measure their disease control, even if the underlying pathophysiology was not fully clarified at the time the patients took part and completed the questionnaires. Another limitation of this study is the scarcity of available data needed for stratification based on baseline angioedema control (i.e. dichotomisation in patients with poorly and well‐controlled angioedema) or type of angioedema. We cannot fully exclude that the MCID of the AECT may differ based on how well the disease is controlled when the AECT is filled‐out for the first time. Likewise, we cannot fully exclude that the MCID differs for patients with HAE‐C1INH as compared to patients with mast cell‐mediated angioedema. More than half (59%) of the participants had bradykinin‐mediated angioedema, with HAE‐C1INH as the most frequent diagnosis (41%). Therefore, our results may translate better to patients with bradykinin‐mediated than mast cell‐mediated angioedema. Further studies including more participants are required to provide definite answers.
In conclusion, the AECT is a valuable tool to measure levels and changes of angioedema control in patients with recurrent angioedema, and is thus a suitable tool for assessing treatment responses. The knowledge of the MCID of three points for improvement increases the interpretability of AECT results and further recommends its use in clinical trials and routine patient care.
AUTHOR CONTRIBUTIONS
All authors made substantial contributions to (i) conception and design of or acquisition of data or analysis and interpretation of data, to (ii) drafting the article or revising it critically for important intellectual content and to (iii) final approval of the version to be published.
CONFLICT OF INTEREST STATEMENT
KW, MM and MM are advisors for Moxie. All other authors have no conflict of interest regarding this manuscript.
ACKNOWLEDGEMENTS
We thank all patients who supported this work. This project did not receive specific funding. LF is supported by a grant from Dr. Catharine van Tussenbroek Fonds. This work has benefitted from the global network of angioedema centres of reference and excellence (ACARE; https://acare‐network.com).
Fijen LM, Vera C, Buttgereit T, et al. Sensitivity to change and minimal clinically important difference of the angioedema control test. Clin Transl Allergy. 2023;e12295. 10.1002/clt2.12295
DATA AVAILABILITY STATEMENT
The data that support the findings of this study are available from the corresponding author upon reasonable request.
REFERENCES
- 1. Maurer M, Magerl M. Differences and similarities in the mechanisms and clinical expression of bradykinin‐mediated vs. mast cell‐mediated angioedema. Clin Rev Allergy Immunol. 2021;61(1):40‐49. 10.1007/s12016-021-08841-w [DOI] [PMC free article] [PubMed] [Google Scholar]
- 2. Caballero T, Aygören‐Pürsün E, Bygum A, et al. The humanistic burden of hereditary angioedema: results from the Burden of Illness Study in Europe. Allergy Asthma Proc. 2014;35(1):47‐53. 10.2500/aap.2013.34.3685 [DOI] [PubMed] [Google Scholar]
- 3. Banerji A, Davis KH, Brown TM, et al. Patient‐reported burden of hereditary angioedema: findings from a patient survey in the United States. Ann Allergy Asthma Immunol. 2020;124(6):600‐607. 10.1016/j.anai.2020.02.018 [DOI] [PubMed] [Google Scholar]
- 4. Lacour JP, Khemis A, Giordano‐Labadie F, et al. The burden of chronic spontaneous urticaria: unsatisfactory treatment and healthcare resource utilization in France (the ASSURE‐CSU study). Eur J Dermatol. 2018;28(6):795‐802. [DOI] [PubMed] [Google Scholar]
- 5. Fijen LM, Bork K, Cohn DM. Current and prospective targets of pharmacologic treatment of hereditary angioedema types 1 and 2. Clin Rev Allergy Immunol. 2021;61(1):66‐76. 10.1007/s12016-021-08832-x [DOI] [PMC free article] [PubMed] [Google Scholar]
- 6. Zuberbier T, Abdul Latiff AH, Abuzakouk M, et al. The international EAACI/GA2LEN/EuroGuiDerm/APAAACI guideline for the definition, classification, diagnosis, and management of urticaria. Allergy. 2022;77(3):734‐766. 10.1111/all.15090 [DOI] [PubMed] [Google Scholar]
- 7. Maurer M, Aygören‐Pürsün E, Banerji A, et al. Consensus on treatment goals in hereditary angioedema: a global Delphi initiative. J allergy Clin Immunol. 2021;148(6):1526‐2532. 10.1016/j.jaci.2021.05.016 [DOI] [PubMed] [Google Scholar]
- 8. Maurer M, Magerl M, Betschel S, et al. The international WAO/EAACI guideline for the management of hereditary angioedema ‐ the 2021 revision and update. Allergy. 2022;15(3):100627. 10.1016/j.waojou.2022.100627 [DOI] [PMC free article] [PubMed] [Google Scholar]
- 9. Türk M, Yılmaz İ, Şahiner Ü M, et al. Experience‐based advice on stepping up and stepping down the therapeutic management of chronic spontaneous urticaria: where is the guidance? Allergy. 2022;77(5):1626‐1630. 10.1111/all.15227 [DOI] [PubMed] [Google Scholar]
- 10. Maurer M, Caballero T, Aberer W, et al. Variability of disease activity in patients with hereditary angioedema type 1/2: longitudinal data from the Icatibant Outcome Survey. J Eur Acad Dermatol Venereol. 2021;35(12):2421‐2430. 10.1111/jdv.17654 [DOI] [PubMed] [Google Scholar]
- 11. Can PK, Degi Rmentepe EN, Etikan P, et al. Assessment of disease activity and quality of life in patients with recurrent bradykinin‐mediated versus mast cell‐mediated angioedema. World Allergy Organ J. 2021;14(7):100554. 10.1016/j.waojou.2021.100554 [DOI] [PMC free article] [PubMed] [Google Scholar]
- 12. Bygum A, Busse P, Caballero T, Maurer M. Disease severity, activity, impact, and control and how to assess them in patients with hereditary angioedema. Front Med. 2017;4:212. 10.3389/fmed.2017.00212 [DOI] [PMC free article] [PubMed] [Google Scholar]
- 13. Brix ATH, Boysen HB, Weller K, Caballero T, Bygum A. Patient‐reported outcome measures for angioedema: a literature review. Acta Derm Venereol. 2021;101(5):adv00456. 10.2340/00015555-3807 [DOI] [PMC free article] [PubMed] [Google Scholar]
- 14. Weller K, Groffik A, Magerl M, et al. Development, validation, and initial results of the angioedema activity score. Allergy. 2013;68(9):1185‐1192. 10.1111/all.12209 [DOI] [PubMed] [Google Scholar]
- 15. Weller K, Groffik A, Magerl M, et al. Development and construct validation of the angioedema quality of life questionnaire. Allergy. 2012;67(10):1289‐1298. 10.1111/all.12007 [DOI] [PubMed] [Google Scholar]
- 16. Prior N, Remor E, Gómez‐Traseira C, et al. Development of a disease‐specific quality of life questionnaire for adult patients with hereditary angioedema due to C1 inhibitor deficiency (HAE‐QoL): Spanish multi‐centre research project. Health Qual Life Outcomes. 2012;10(1):82. 10.1186/1477-7525-10-82 [DOI] [PMC free article] [PubMed] [Google Scholar]
- 17. Weller K, Donoso T, Magerl M, et al. Development of the angioedema control test‐A patient‐reported outcome measure that assesses disease control in patients with recurrent angioedema. Allergy. 2020;75(5):1165‐1177. 10.1111/all.14144 [DOI] [PubMed] [Google Scholar]
- 18. Weller K, Donoso T, Magerl M, et al. Validation of the angioedema control test (AECT)‐A patient‐reported outcome instrument for assessing angioedema control. J Allergy Clin Immunol Pract. 2020;8(6):2050‐2057.e4. 10.1016/j.jaip.2020.02.038 [DOI] [PubMed] [Google Scholar]
- 19. Buttgereit T, Vera C, Weller K, et al. Lanadelumab efficacy, safety, and injection interval extension in HAE: a real‐life study. J Allergy Clin Immunol Pract. 2021;9(10):3744‐3751. 10.1016/j.jaip.2021.04.072 [DOI] [PubMed] [Google Scholar]
- 20. Andarawewa S, Aygören‐Pürsün E. Individual approach to long‐term therapy in patients with hereditary angioedema (HAE‐C1‐INH): a case series. Front Allergy. 2022;3:949387. 10.3389/falgy.2022.949387 [DOI] [PMC free article] [PubMed] [Google Scholar]
- 21. Mormile I, Gigliotti MC, Petraroli A, et al. Immunogenicity and safety of anti‐SARS‐CoV‐2 mRNA vaccines in a cohort of patients with hereditary angioedema. Vaccines. 2023;11(2):215. 10.3390/vaccines11020215 [DOI] [PMC free article] [PubMed] [Google Scholar]
- 22. Zarnowski J, Rabe M, Kage P, Simon JC, Treudler R. Prophylactic treatment in hereditary angioedema is associated with reduced anxiety in patients in Leipzig, Germany. Int Arch Allergy Immunol. 2021;182(9):819‐826. 10.1159/000514973 [DOI] [PMC free article] [PubMed] [Google Scholar]
- 23. Mendivil J, Murphy R, de la Cruz M, et al. Clinical characteristics and burden of illness in patients with hereditary angioedema: findings from a multinational patient survey. Orphanet J Rare Dis. 2021;16(1):94. 10.1186/s13023-021-01717-4 [DOI] [PMC free article] [PubMed] [Google Scholar]
- 24. Fijen LM, Klein PCG, Cohn DM, Kanters TA. The disease burden and societal costs of hereditary angioedema. J Allergy Clin Immunol Pract. 2023;11(8):2468‐2475.e2. 10.1016/j.jaip.2023.03.032 [DOI] [PubMed] [Google Scholar]
- 25. Fijen LM, Levi M, Cohn DM. COVID‐19 vaccination and the risk of swellings in patients with hereditary angioedema. J Allergy Clin Immunol Pract. 2021;9(11):4156‐4158. 10.1016/j.jaip.2021.08.039 [DOI] [PMC free article] [PubMed] [Google Scholar]
- 26. Lumry WR, Maurer M, Weller K, et al. Long‐term lanadelumab treatment improves health‐related quality of life in patients with hereditary angioedema. Ann Allergy Asthma Immunol. 2023;131(1):101‐108.e3. 10.1016/j.anai.2023.03.028 [DOI] [PubMed] [Google Scholar]
- 27. Chularojanamontri L, Kulthanan K, Tuchinda P, et al. The validity and reliability of a Thai version of the angioedema control test: which recall period is preferable? Asian Pac J Allergy Immunol. 2023. [DOI] [PubMed] [Google Scholar]
- 28. Maurer M, Aberer W, Agondi R, et al. Definition, aims, and implementation of GA2LEN/HAEi angioedema centers of reference and excellence. Allergy. 2020;75(8):2115‐2123. 10.1111/all.14293 [DOI] [PubMed] [Google Scholar]
- 29. Weller K, Magerl M, Peveling‐Oberhag A, Martus P, Staubach P, Maurer M. The Angioedema Quality of Life Questionnaire (AE‐QoL) ‐ assessment of sensitivity to change and minimal clinically important difference. Allergy. 2016;71(8):1203‐1209. 10.1111/all.12900 [DOI] [PubMed] [Google Scholar]
- 30. Finlay AY, Khan GK. Dermatology Life Quality Index (DLQI)‐‐a simple practical measure for routine clinical use. Clin Exp Dermatol. 1994;19(3):210‐216. 10.1111/j.1365-2230.1994.tb01167.x [DOI] [PubMed] [Google Scholar]
- 31. Shikiar R, Harding G, Leahy M, Lennox RD. Minimal important difference (MID) of the Dermatology Life Quality Index (DLQI): results from patients with chronic idiopathic urticaria. Health Qual Life Outcomes. 2005;3(1):36. 10.1186/1477-7525-3-36 [DOI] [PMC free article] [PubMed] [Google Scholar]
- 32. Norman GR, Sloan JA, Wyrwich KW. Interpretation of changes in health‐related quality of life: the remarkable universality of half a standard deviation. Med Care. 2003;41(5):582‐592. 10.1097/01.mlr.0000062554.74615.4c [DOI] [PubMed] [Google Scholar]
- 33. de Vet HC, Ostelo RW, Terwee CB, et al. Minimally important change determined by a visual method integrating an anchor‐based and a distribution‐based approach. Qual Life Res. 2007;16(1):131‐142. 10.1007/s11136-006-9109-9 [DOI] [PMC free article] [PubMed] [Google Scholar]
- 34. Revicki D, Hays RD, Cella D, Sloan J. Recommended methods for determining responsiveness and minimally important differences for patient‐reported outcomes. J Clin Epidemiol. 2008;61(2):102‐109. 10.1016/j.jclinepi.2007.03.012 [DOI] [PubMed] [Google Scholar]
- 35. R Development Core Team . A Language and Environment for Statistical Computing. R Foundation for Statistical Computing; 2010. http://www.R‐project.org [Google Scholar]
- 36.Accessed October 7, 2022. https://moxie‐gmbh.de/our‐products/
- 37. Cocks K, King MT, Velikova G, et al. Evidence‐based guidelines for interpreting change scores for the European organisation for the research and treatment of cancer quality of life questionnaire core 30. Eur J Cancer. 2012;48(11):1713‐1721. 10.1016/j.ejca.2012.02.059 [DOI] [PubMed] [Google Scholar]
Associated Data
This section collects any data citations, data availability statements, or supplementary materials included in this article.
Data Availability Statement
The data that support the findings of this study are available from the corresponding author upon reasonable request.