

Abstract
BACKGROUND:
Although chronic respiratory diseases are prevalent in Saudi Arabia, there are limited data on the patient burden and associated factors. The aim of this study is to identify the chronic respiratory diseases frequently admitted to pulmonary services and to determine the patient’s characteristics, associated comorbidities readmission rate, and reason for a more extended stay in hospital.
METHODS:
A prospective study was conducted over a 5-year period at King Abdulaziz Medical City-Riyadh, Saudi Arabia, in the Pulmonary Division, between March 2015 and December 2019. Data on demographics, comorbidities, and chronic respiratory diseases were collected.
RESULTS:
Total patients admitted were 1315 patients, female 54.2%, the mean age was 62.4 (SD±17.6), and the ages ranged from 14 to 98 years. Overall, chronic obstructive pulmonary disease was the most common respiratory disease requiring admission (17.9%), followed by interstitial lung disease (15.8%), bronchiectasis (11.9%), and obesity hypoventilation syndrome (10.8%). The most common comorbidities were obesity (42.5%), diabetes 49.1%, and hypertension 54.9%. Only 135 (10.3%) were readmitted within 30 days posthospital discharge. Among the patients who were readmitted, 103 (76.3%) were readmitted due to issues related to previous admission diagnosis, noncompliance 75 (55.5%), social reasons, and premature discharges in 51 (37.8%) and 29 (21.5%) of the cases, respectively. The respiratory disease varied significantly by gender, age, obesity status, comorbidities, length of stay (LOS), and admissions.
CONCLUSION:
Chronic respiratory diseases are prevalent in our population and are mainly influenced by gender, age, obesity status, comorbidities, LOS, and admissions. Policymakers and health professionals need to recognize the burden of chronic respiratory diseases on patients and health systems and implement effective prevention programs.
Keywords: Burden, chronic respiratory diseases, comorbidities, length of stay
Chronic respiratory conditions impose an enormous social and health-care burden on the Kingdom of Saudi Arabia (KSA). Chronic respiratory disease among adults is generally divided into obstructive and restrictive conditions, with the obstructive conditions being further divided into reversible and irreversible diseases.[1]
Respiratory diseases are among the leading causes of death worldwide. For example, globally lower respiratory infections account for 3.5 million (6.1%), chronic obstructive pulmonary disease (COPD) 3.3 million (5.8%), lung cancer 1.4 million (2.4%), and tuberculosis (TB) 1.3 million (2.4%).[2] The same four diseases accounted for one-tenth of the disability-adjusted life-years lost worldwide in 2008.[2]
According to the 2016 World Health Organization World Health Report, the top global causes of death include four respiratory diseases: COPD (third cause), lower respiratory tract infection (fourth), lung cancer (sixth), and TB tenth.[3] Approximately 7% of all hospital admissions are due to lung disease, almost half of respiratory admissions are due to lower respiratory infection, and more than one-quarter of admissions are due to lung cancer and COPD.[2]
Epidemiological studies about the prevalence of chronic respiratory disease in Middle Eastern countries, including the KSA, are scanty. The prevalence of COPD in the KSA is reported at between 2.4% and 14.3%,[4,5,6] while the prevalence of bronchial asthma among adults is reported from 4.05% to 19%.[7,8] A study of the management of COPD-related respiratory symptoms in ten countries in the Middle East and North Africa Region reported 20.4% of COPD patients required hospitalization, with a mean of 2.3 ± 3.7 hospitalizations per year.[9]
There is very limited knowledge about patients’ characteristics and the prevalence and type of common respiratory conditions that require admission in the KSA. King Abdulaziz Medical City (KAMC) is the largest tertiary care hospital in the Middle East with a capacity of over 1800 beds. Pulmonary service was established in the year 2000, with a capacity of 20 inpatient beds. This study aims to assess prospectively and over 5 years the common chronic respiratory diseases frequently admitted to pulmonary services, the patients’ characteristics, associated comorbidities, readmission rate, and the reasons for a longer stay in hospital.
Methods
This is a cross-section study conducted at KAMC-R, the Pulmonary Division, between March 2015 and December 2019. The study obtained ethical approval from the Ministry of National Guard-Health Affairs, Institution of Research Board (IRB) registered under number Ref No: IRBC/0997/20.
Pulmonary services consist of 10 full-time consultants, inpatient services, ventilator weaning unit, consultation service, outpatients’ clinics, sleep disorder center, pulmonary rehabilitation center, and pulmonary physiology laboratory. Outpatients service compose of multiple subspecialty clinics, including TB, pulmonary vascular disease, interstitial lung diseases (ILD), lung cancer, sleep disorders clinics, bronchiectasis, and severe asthma.
As a clinical performance improvement project, we prospectively collected data about demographics, including age, gender, and comorbidities. We also documented the discharge diagnosis by treating team, length of stay (LOS), and the reason for LOS if more than 5 days. The reason for LOS of more than 5 days was clarified by the team: Whether it is related to acute illness, comorbidities, social reasons, investigations, procedures, or waiting for biopsy results. We include all diffuse parenchymal diseases including all subclassifications of interstitial pulmonary disease under one category: ILD. Obesity hypoventilation syndrome (OHS) was defined as a combination of obesity (body mass index [BMI] ≥30 kg/m2) and daytime hypercapnia (arterial carbon dioxide tension ≥45 mmHg) after ruling out other disorders that may cause alveolar hypoventilation.[10] Some of the cases with irreversible obstructive airway disease in the absence of smoking history and hypercapnia, with or without obesity (overlaps syndrome), were included under COPD. We also collected information about whether the admission was a new admission or readmission (defined as within 30 days from discharge).[11] The reasons for readmission were clarified by the treating team whether it was due to new medical issues not related to the previous diagnosis or related to the previous admission diagnosis. If it was related to the previous diagnosis it was listed as because of premature discharge, social reasons, or noncompliance. All the data were collected daily by our division coordinator and tabulated by month and year from March 2015 to December 2019. All the gathered information was clarified and confirmed by one of our pulmonary staff and a consultant. We did not include patients with respiratory conditions admitted under other medical services or those followed by our consultation team.
Data analysis
Data analysis was performed in IBM SPSS 25 (Chicago, Il, USA) and Excel. Descriptive data analysis was performed by reporting frequency (n) and percent (%) [Table 1]. A Chi-squared test was used to assess the association between the year of reporting the diseases and gender, obesity, admission type, diabetes mellitus (DM), hypertension (HTN), comorbidities, acute illness, and year [Table 1]. ANOVA was used for comparisons of age and LOS in days by medical conditions [Table 2]. The distribution of medical conditions was reported by bar and error charts.
Table 1.
Demographic and medical characteristics (n=1315)
| Levels | n (%) |
|---|---|
| Gender | |
| Male | 602 (45.8) |
| Female | 713 (54.2) |
| Comorbidities | |
| Obese | |
| Yes | 559 (42.5) |
| No | 757 (57.5) |
| DM | |
| Yes | 645 (49.1) |
| No | 669 (50.9) |
| HTN | |
| Yes | 723 (54.9) |
| No | 593 (45.1) |
| Admission type | |
| Readmission | |
| Yes | 135 (10.3) |
| New admission | |
| Yes | 1180 (89.7) |
| Reason for readmission | |
| Related to previous admission | |
| Yes | 103 (76.3) |
| No | 32 (23.7) |
| Social reasons | |
| Yes | 51 (37.8) |
| No | 84 (62.2) |
| Noncompliance | |
| Yes | 75 (55.5) |
| No | 60 (44.5) |
| Premature discharge | |
| Yes | 29 (21.5) |
| No | 106 (78.5) |
| Reasons for LOS of >5 days | |
| Acute illness | |
| Yes | 949 (72.1) |
| No | 367 (27.9) |
| Comorbidities | |
| Yes | 210 (16.0) |
| No | 1106 (84.0) |
| Waiting for biopsy results | |
| Yes | 194 (14.7) |
| No | 1122 (85.3) |
| Waiting for equipment | |
| Yes | 17 (1.3) |
| No | 1299 (98.7) |
| Waiting for tests results | |
| Yes | 50 (3.8) |
| No | 1266 (96.2) |
| Lack of social support | |
| Yes | 43 (3.3) |
| No | 1273 (96.7) |
| Number of admissions per year | |
| 2015 | 227 (17.3) |
| 2016 | 316 (24.0) |
| 2017 | 274 (20.8) |
| 2018 | 263 (20.0) |
| 2019 | 235 (17.9) |
DM=Diabetes mellitus, HTN=Hypertension, LOS=Length of stay
Table 2.
Association between medical conditions and clinical characteristics
| Levels | ILD (%) | Asthma (%) | Bronchiectasis (%) | COPD (%) | Lung mass (%) | OHS (%) | PHT (%) | Pleural effusion (%) | Pneumonia (%) | TB (%) | Other | P |
|---|---|---|---|---|---|---|---|---|---|---|---|---|
| Gender | ||||||||||||
| Male | 43.3 | 35.3 | 47.4 | 39.8 | 63.6 | 28.2 | 12.3 | 62.5 | 50.0 | 64.4 | 66.7 | 0.001 |
| Female | 56.7 | 64.7 | 52.6 | 60.2 | 36.4 | 71.8 | 87.7 | 37.5 | 50.0 | 35.6 | 33.3 | |
| Age | ||||||||||||
| Mean±SD | 66±15 | 56±18 | 61±15 | 70±11 | 68±15 | 62±17 | 50±20 | 59±20 | 58±20 | 52±21 | 60±19 | 0.001 |
| Obese BMI >30 | ||||||||||||
| Yes | 37.5 | 41.2 | 24.4 | 54.2 | 27.3 | 100 | 36.8 | 45.0 | 38.6 | 24.8 | 46.7 | 0.001 |
| No | 62.5 | 58.8 | 75.6 | 45.8 | 72.7 | 00 | 63.2 | 55.0 | 61.4 | 75.2 | 53.3 | |
| DM | ||||||||||||
| Yes | 43.0 | 56.9 | 45.5 | 61.4 | 45.8 | 56.3 | 42.1 | 42.5 | 47.9 | 39.0 | 45.0 | 0.001 |
| No | 57.0 | 43.1 | 54.5 | 38.6 | 54.2 | 43.7 | 57.9 | 57.5 | 52.1 | 61.0 | 55.0 | |
| HTN | ||||||||||||
| Yes | 54.8 | 41.2 | 48.7 | 69.1 | 55.4 | 67.6 | 57.9 | 52.5 | 47.1 | 34.3 | 50.0 | 0.001 |
| No | 45.2 | 58.8 | 51.3 | 30.9 | 44.6 | 32.4 | 42.1 | 47.5 | 52.9 | 65.7 | 50.0 | |
| LOS (days) | ||||||||||||
| Mean±SD | 11±9 | 10±6 | 10±6 | 12±13 | 14±10 | 16±19 | 14±11 | 22±17 | 17±15 | 17±14 | 11±10 | 0.001 |
| Admission | ||||||||||||
| Readmission | 8.7 | 9.8 | 17.3 | 11.4 | 0.8 | 17.6 | 12.3 | 2.5 | 5.7 | 10.5 | 8.3 | 0.001 |
| New admission | 91.3 | 90.2 | 82.7 | 88.6 | 99.2 | 82.4 | 87.7 | 97.5 | 94.3 | 89.5 | 91.7 | |
| Reasons for readmission | ||||||||||||
| Social | 50.0 | 20.0 | 45.8 | 43.8 | 0.0 | 56.5 | 0.0 | 0.0 | 0.0 | 14.3 | 0.0 | |
| Noncompliance | 60.0 | 80.0 | 25.0 | 68.8 | 0.0 | 65.2 | 85.7 | 0.0 | 40.0 | 42.9 | 50.0 | |
| Premature discharge | 20.0 | 20.0 | 25.0 | 6.3 | 0.0 | 39.1 | 0.0 | 0.0 | 40.0 | 42.9 | 0.0 | |
| Reason for LOS >5 days | ||||||||||||
| Acute illness | 88.4 | 91.2 | 92.7 | 92.3 | 87.5 | 95.4 | 88.6 | 100.0 | 95.3 | 95.2 | 92.3 | |
| Comorbidities | 12.3 | 11.8 | 16.4 | 21.4 | 11.5 | 25.0 | 22.7 | 11.8 | 26.2 | 25.3 | 15.4 | |
| Waiting for biopsy results | 32.6 | 8.8 | 5.5 | 3.0 | 56.3 | 2.8 | 6.8 | 50.0 | 10.3 | 16.9 | 15.4 | |
| Waiting for equipment | 3.6 | 0.0 | 1.8 | 0.6 | 2.1 | 1.9 | 4.5 | 2.9 | 0.9 | 0.0 | 0.0 | |
| Waiting for tests results | 2.9 | 5.9 | 1.8 | 0.6 | 10.4 | 3.7 | 15.9 | 2.9 | 4.7 | 4.8 | 5.1 | |
| Lack of social support | 2.9 | 0.0 | 5.5 | 3.6 | 1.0 | 7.4 | 2.3 | 2.9 | 2.8 | 4.8 | 2.6 | |
| Number of admissions/year | ||||||||||||
| 2015 | 10.1 | 29.4 | 13.5 | 27.1 | 21.7 | 14.1 | 19.3 | 17.5 | 10.0 | 17.1 | 16.7 | 0.001 |
| 2016 | 16.3 | 21.6 | 30.1 | 27.1 | 18.3 | 28.2 | 15.8 | 30.0 | 22.9 | 29.5 | 23.3 | |
| 2017 | 18.3 | 11.8 | 17.9 | 18.6 | 23.3 | 19.7 | 17.5 | 22.5 | 30.0 | 23.8 | 26.7 | |
| 2018 | 20.2 | 13.7 | 24.4 | 14.8 | 20.0 | 24.6 | 26.3 | 12.5 | 20.7 | 20.0 | 20.0 | |
| 2019 | 35.1 | 23.5 | 14.1 | 12.3 | 16.7 | 13.4 | 21.1 | 17.5 | 16.4 | 9.5 | 13.3 |
DM=Diabetes mellitus, HTN=Hypertension, SD=Standard deviation, ILD=Interstitial lung disease, COPD=Chronic obstructive pulmonary disease, OHS=Obesity hypoventilation syndrome, PHT=Pulmonary hypertension, TB=Tuberculosis, BMI=Body mass index, LOS=Length of stay
Results
The total admission to pulmonary services over a period of 5 years was 1315. The demographic and medical characteristics are displayed in Table 1. This table shows that 54.2% were females, BMI ≥30 were 42.5%, 49.1% had diabetes, and 54.9% had HTN, with a mean age of 62.4 (±standard deviation [SD] 17.6) and ages ranging from 14 to 98 years. Only 135 (10.3%) were readmitted within 30 days posthospital discharge. Among the patients who were readmitted, 103 (76.3%) were readmitted due to issues related to previous admission diagnosis and noncompliance 75 (55.5%), along with social reasons and premature discharges in 51 (37.8%) and 29 (21.5%) of the cases, respectively. The most common causes of overall stay in hospital for more than 5 days were acute illness 949 (72.1%), comorbidities 210 (16%), and waiting for biopsy results 194 (14.7%). According to Figure 1, COPD was the most common respiratory disease requiring admission (17.9%), followed by ILD (15.8%), bronchiectasis (11.9%), and OHS (10.8%). Distribution of medical condition for each year displayed in Figure 2, and Table 2, asthma (29.54%) and COPD (27.1%), respectively, were the dominant medical conditions in 2015, while ILD was the dominant medical condition (35.1%) in 2019. The association between medical conditions and other clinical characteristics reveals that in Table 2, the highest readmission rate was among bronchiectasis and OHS patients, 17.3% and 17.6%, respectively, while among all medical conditions, plural effusion and pulmonary infection (pneumonia and TB) had the highest LOS, 22 ± 17 and 17 ± 14 days, respectively. The most common reason for waiting for more LOS than 5 days was acute illness across all the medical conditions, and waiting for the biopsy results was the second most common reason for lung mass and pleural effusion patients, 56.3% and 50%, respectively. Other significant differences in frequency of medical conditions include gender, obesity, DM, HTN, admission type, acute illness, comorbidities, and percentage of admission and readmission of each medical condition for each year presented in Table 2. TB, pleural effusion, and lung mass were more prevalent in male patients as compared to asthma, COPD, OHS, and pulmonary HTN, which were significantly higher among females (P = 0.001). Comorbidities: DM, HTN, and obesity were significantly higher in COPD and OHS (P = 0.001). The average LOS in days was 13.6 (±SD 12.7). LOS is the mean ± SD for each medical condition presented in Table 2, where pleural effusion was significantly the highest LOS (22 ± 17 days) (P = 0.001). Differences in LOS in days and age for each disease are presented in Table 2 and Figures 3, 4.
Figure 1.
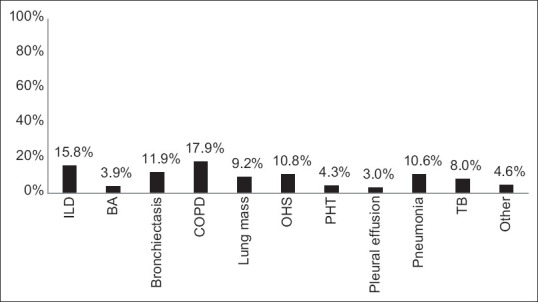
Overall frequency of medical conditions
Figure 2.

Frequency of medical conditions by years
Figure 3.

Length of stay in days by medical conditions
Figure 4.

Age by medical conditions
Discussion
This study was intended to assess pulmonary clinical performance indicators for all patients admitted to pulmonary services rather than looking in depth at each medical condition in great detail or at all possible factors related to admission, readmission, or LOS. The finding is interesting particularly because there are limited data in literature that look at the common medical conditions admitted under pulmonary services at specific institutions nationally or internationally. Most published studies address specific diseases. This is the first study done locally in a large tertiary care specialist hospital that looked at the trend in respiratory diseases admitted over time and considered medical comorbidities and demographic characteristics. In our study, the most common disease was COPD (17.9%), followed by ILD (15.8%), bronchiectasis (11.9%), OHS (10.8%), and pneumonia (10.6%). Alamoudi O[12] retrospectively reviewed 810 patients hospitalized with respiratory diseases in King Abdulaziz University Hospital, over a 5-year period. The most common diseases hospitalized were asthma (38.6%), COPD (17.2%), pneumonia (11.5%), lung cancer (8.4%), TB (7.2%), pleural effusion (4.3%), and ILD including idiopathic pulmonary fibrosis (IPF) (3.8%) and bronchiectasis 1.7%. The Meservey et al.[13] study showed that the most common cause of admissions to hospital was acute chronic respiratory failure (10%) and was due to OSA and OHS, 46% COPD, and 10% asthma. The prevalence of obesity, diabetes, and HTN in Saudi Arabia is quite high, and these were the important comorbidities that were highlighted in our study that resulted in hospital admissions for chronic respiratory conditions.[14,15] Comorbidities in our patients presented in more than half of the cases, DM 49%, HTN 54.95, and obesity 42.5%, compared to other studies where reported morbidities ranged from 16% to 31%.[16,17] However, they were higher than another local study by Alamoudi O,[12] where DM was 22.8% and HTN was 15.1%.
The present study identified the overall rate of readmission as 10.3% within 30 days.
The rate of readmission varies according to the underlying respiratory conditions, but overall, compared to other studies, it is low. The readmission rate among our patients was 11.4%, which is less than the 22% rate reported within the United States, 16.7% in Taiwan, and 14%–20% in London,[11,18,19] but is similar to studies from England and The Netherlands, 11.17% and 9.83%, respectively.[20] The 30-day readmission rates of COPD patients have been reported to be as low as 5.6% and as high as 35%.[11,21,22] In our study, the readmission rate for COPD was 11.4%. In the Alaithan et al.[23] study about the characteristics of 178 patients admitted with COPD exacerbation, more than one-third were above 65 years with a mean age of 72 ± 13.3 years. The majority had comorbidities, and the median (range) LOS was 9 (2–33) days. Our study was similar, with the average age of COPD patients being 70 ± 11 years, the majority having comorbidities, and the mean LOS among our COPD patients being 12 ± 13 days compared to the 7–14 days of the Alamoudi O[12] study. Bronchiectasis, among all other conditions, had the highest readmission rate in our study (17.3%) similar to the readmission rate reported by Kshitij Chatterjee et al.[24] The highest LOS was for pleural disease, OHS, TB, and pneumonia. A 1988 survey on standards of practice of 28 metropolitan health departments in the U. S. found that 18% of reported TB patients were initially hospitalized for treatment, and that percentage had increased to 38% by 1996.[25,26] One study from Saudi Arabia reported that TB accounts for 7.2% of all admissions,[12] which is similar to our study, where the rate of TB admission was 8%. The most common cause of LOS of more than 5 days was due to acute illness of the primary diagnosis (88.4%–100%) of the cases. The second most common cause was waiting for biopsy results.
One of the interesting findings is the progressive increase in the cases admitted with ILD since 2015. In one local study, in 2000, ILD accounted for approximately 2% and another study reported 3.8%.[12] In our study, the number of ILD cases increased steadily over the period of the study from 10% in 2015 to 35% in 2019. We understand this observation could be due to (1) more awareness of ILD, (2) more access to high-resolution computed tomography scans, and (3) the fact that ILD is a disease of the aging population, and our study does suggest the average age is higher than other local studies. The above factors are probably identified more by establishment of comprehensive specialized services run by two subspecialized ILD consultants and their teams; an increase in the number of new referrals to our ILD services; the availability of specialized radiological, serological, and physiological diagnostic tests; onsite medical and surgical diagnostic tissue diagnostic services; regular ILD Multidisciplinary team (MDT); and approval of new antifibrotic agents in our institution.
The main strength of our study is the comprehensive, accurate diagnoses by hospital specialists in a large pulmonary division. The services provided are based on subspecialty work and all the diagnoses are made according to internationally published guidelines. There are well-established multidisciplinary meetings in the area of ILDs, and each patient is given an accurate diagnosis based on the latest agreed-upon international diagnostic guidelines.
The overall prevalence of IPF in the U. S. is estimated to be between 13 and 63 per 100,000 persons, depending on the study population,[27] with an estimated annual prevalence of 12.6–35.5 per 100,000 person-year depending on the definitions used in Italy.[28] Approximately 3 million people worldwide and 130,000 people in the United States have IPF.[29] Fan et al.[17] followed up on 300 patients included in the Pulmonary Fibrosis Prospective Outcomes, reporting an overall probability of hospitalization of 18% and 30% at 6 and 12 months, respectively, and the probability of the first hospitalization was 25% and 51% at 6 and 12 months, respectively. Associated comorbidities were present in 16%–31%, and bacterial pneumonia in 38.5%, COPD in 38.2%, asthma in 8.6%, lung cancer in 1.8%, ischemic heart disease in 28.4%, and congestive heart failure in 27.8% of the patients with IPF.[16,17] From a total of 42,924 IPF patients admitted to US hospitals, 55% were related to respiratory conditions, elective admission accounts for 15.7%, and 66.7% through the emergency departments, and the mean LOS was 7.4 ± 0.15 days.[16]
Nevertheless, the exact prevalence of ILD in general and IPF in particular for our population is not known. A retrospective study that looked at all the patients diagnosed with IPF at two tertiary care hospitals in KSA reported the IPF patients’ frequency of hospital admission was 2.4 ± 1.7 per year and the duration of hospital stay was 17.4 ± 23.8 days. In another study,[30,31] our patients with ILD also had comorbidities, and some of them had advanced cases of ILD. These patients were slightly older, 66 ± 15, compared to 64 ± 13 years in another local study[30] and Middle Eastern patients were 54.7 ± 15.2.[32] The LOS in patients with ILD was shorter in our patients, 11 ± 9 versus 17.4 ± 23.8 days by Sherbini et al.,[30] but higher than LOS reported by Mooney et al., 7.4 ± 0.15 days.[16]
OHS is defined as a combination of obesity (body mass index ≥30 kg/m2), daytime hypercapnia (arterial carbon dioxide tension ≥45 mmHg), and sleep-disordered breathing, after ruling out other disorders that may cause alveolar hypoventilation.[10] The exact prevalence of OHS in the general population remains unknown, particularly in some cases where it may be misdiagnosed as COPD. In one study OHS accounts for 10% of total admissions of acute chronic respiratory failure to a hospital.[13] Nowbar et al.[17] reported that 48% of obese inpatients with a BMI >50 kg/m2, admitted to medicine, were diagnosed with OHS and 31% of obese inpatients did not have a previous diagnosis of OHS, despite having met the criteria for this diagnosis.
OHS compared to OSA has more comorbidities and adjusted mortality, and therapy by continuous positive airway pressure or noninvasive ventilation has reduced mortality significantly.[33,34]
The incidence and prevalence of pulmonary HTN are unknown: Studies from Scotland and France revealed an incidence of 2.5–7.1 cases/million and a prevalence ranging from 5 to 52/million adults.[35,36,37] One study by Bergot et al. reported that approximately 50% of the reasons for admissions among pulmonary HTN patients were for monitoring and 20% due to worsening of the clinical state of the patient, while the mean LOS was 6.7 days.[38]
Unfortunately, underdiagnosis and overdiagnosis have been widely reported in the literature.[39,40] The major limitations of this study, are a single center experience, and we did not account for all factors related to length of stay and readmission. Furthermore, we did not look in depth at each medical condition in great detail concerning all possible factors related to admission, readmission, or LOS.
Conclusion
The study shows society’s burden of chronic respiratory diseases. Chronic respiratory diseases are prevalent in our population and mostly influenced by gender, age, obesity status, comorbidities, LOS, and admissions. Policymakers and health professionals need to recognize the burden of chronic respiratory diseases on patients and health systems and implement prevention programs.
Ethics approval
The study obtained ethical approval from the Ministry of National Guard-Health Affairs, IRB. Ref No. IRBC/0997/20. This study was completed prior to Dr. Anwar Ahmed joining the Uniformed Services University of the Health Sciences and Henry M Jackson Foundation for the Advancement of Military Medicine.
Authors’ contributions
HA, AA, AA, and KA participated in the study concepts, design of the study, development of the questionnaire, and data acquisition and entry. AA, HA, MA, SA, and MA contributed to data analysis and statistical analysis of the data, participated in the intellectual content, reviewed, and summarized the published literature and clinical studies. HH, AA, and SA participated in outlining the result themes and manuscript preparation, editing, and review. Corresponding author HA takes responsibility for the integrity of the work as a whole. All authors have critically reviewed and approved the final draft and are responsible for the content and similarity index of the manuscript.
Financial support and sponsorship
Nil.
Conflicts of interest
There are no conflicts of interest.
References
- 1.Burney P, Jarvis D, Perez-Padilla R. The global burden of chronic respiratory disease in adults. Int J Tuberc Lung Dis. 2015;19:10–20. doi: 10.5588/ijtld.14.0446. [DOI] [PubMed] [Google Scholar]
- 2.World health organization. The top 10 causes of death. [[Last accessed on 2022 Aug 01]]. URL: Available from: https://www.who.int/news-room/fact-sheets/detail/the-top-10-causes-of-death .
- 3.Goto T, Yoshida K, Faridi MK, Camargo CA, Jr, Hasegawa K. Contribution of social factors to readmissions within 30 days after hospitalization for COPD exacerbation. BMC pulmonary medicine. 2020;20:107. doi: 10.1186/s12890-020-1136-8. [DOI] [PMC free article] [PubMed] [Google Scholar]
- 4.Tageldin MA, Nafti S, Khan JA, Nejjari C, Beji M, Mahboub B, et al. Distribution of COPD-related symptoms in the Middle East and North Africa: Results of the BREATHE study. Respir Med. 2012;106(Suppl 2):S25–32. doi: 10.1016/S0954-6111(12)70012-4. [DOI] [PubMed] [Google Scholar]
- 5.Al Ghobain M, Al-Hajjaj MS, Wali SO. Prevalence of chronic obstructive pulmonary disease among smokers attending primary healthcare clinics in Saudi Arabia. Ann Saudi Med. 2011;31:129–33. doi: 10.4103/0256-4947.77485. [DOI] [PMC free article] [PubMed] [Google Scholar]
- 6.Wali SO, Idrees MM, Alamoudi OS, Aboulfarag AM, Salem AD, Aljohaney AA, et al. Prevalence of chronic obstructive pulmonary disease in Saudi Arabia. Saudi Med J. 2014;35:684–90. [PubMed] [Google Scholar]
- 7.Al Ghamdi BR, Koshak EA, Ageely HM, Omer FM, Awadalla NJ, Mahfouz AA. Prevalence and factors associated with adult bronchial asthma in Aseer region, Southwestern Saudi Arabia. Ann Thorac Med. 2019;14:278–84. doi: 10.4103/atm.ATM_67_19. [DOI] [PMC free article] [PubMed] [Google Scholar]
- 8.Moradi-Lakeh M, El Bcheraoui C, Daoud F, Tuffaha M, Kravitz H, Al Saeedi M, et al. Prevalence of asthma in Saudi adults: Findings from a national household survey, 2013. BMC Pulm Med. 2015;15:77. doi: 10.1186/s12890-015-0080-5. [DOI] [PMC free article] [PubMed] [Google Scholar]
- 9.Idrees M, Koniski ML, Taright S, Shahrour N, Polatli M, Ben Kheder A, et al. Management of chronic obstructive pulmonary disease in the Middle East and North Africa: Results of the BREATHE study. Respir Med. 2012;106(Suppl 2):S33–44. doi: 10.1016/S0954-6111(12)70013-6. [DOI] [PubMed] [Google Scholar]
- 10.Gómez de Terreros FJ, Cooksey JA, Sunwoo BY, Mokhlesi B, Masa JF, Ruminjo JK, et al. Clinical practice guideline summary for clinicians: Evaluation and management of obesity hypoventilation syndrome. Ann Am Thorac Soc. 2020;17:11–5. doi: 10.1513/AnnalsATS.201908-579CME. [DOI] [PubMed] [Google Scholar]
- 11.Goto T, Faridi MK, Gibo K, Toh S, Hanania NA, Camargo CA, Jr, et al. Trends in 30-day readmission rates after COPD hospitalization, 2006-2012. Respir Med. 2017;130:92–7. doi: 10.1016/j.rmed.2017.07.058. [DOI] [PMC free article] [PubMed] [Google Scholar]
- 12.Alamoudi O. Prevalence of respiratory diseases in hospitalized patients in Saudi Arabia: A 5 years study 1996-2000. Ann Thorac Med. 2006;1:76–80. [Google Scholar]
- 13.Meservey AJ, Burton MC, Priest J, Teneback CC, Dixon AE. Risk of readmission and mortality following hospitalization with hypercapnic respiratory failure. Lung. 2020;198:121–34. doi: 10.1007/s00408-019-00300-w. [DOI] [PMC free article] [PubMed] [Google Scholar]
- 14.Al-Raddadi R, Bahijri SM, Jambi HA, Ferns G, Tuomilehto J. The prevalence of obesity and overweight, associated demographic and lifestyle factors, and health status in the adult population of Jeddah, Saudi Arabia. Ther Adv Chronic Dis. 2019;10:1–10. doi: 10.1177/2040622319878997. [DOI] [PMC free article] [PubMed] [Google Scholar]
- 15.Memish ZA, Jaber S, Mokdad AH, AlMazroa MA, Murray CJ, Al Rabeeah AA, et al. Burden of disease, injuries, and risk factors in the Kingdom of Saudi Arabia, 1990-2010. Prev Chronic Dis. 2014;11:E169. doi: 10.5888/pcd11.140176. [DOI] [PMC free article] [PubMed] [Google Scholar]
- 16.Mooney JJ, Raimundo K, Chang E, Broder MS. Hospital cost and length of stay in idiopathic pulmonary fibrosis. J Med Econ. 2017;20:518–24. doi: 10.1080/13696998.2017.1282864. [DOI] [PubMed] [Google Scholar]
- 17.Nowbar S, Burkart KM, Gonzales R, Fedorowicz A, Gozansky WS, Gaudio JC, et al. Obesity-associated hypoventilation in hospitalized patients: prevalence, effects, and outcome. The American journal of medicine. 2004;116:1–7. doi: 10.1016/j.amjmed.2003.08.022. [DOI] [PubMed] [Google Scholar]
- 18.Laverty AA, Elkin SL, Watt HC, Millett C, Restrick LJ, Williams S, et al. Impact of a COPD discharge care bundle on readmissions following admission with acute exacerbation: Interrupted time series analysis. PLoS One. 2015;10:e0116187. doi: 10.1371/journal.pone.0116187. [DOI] [PMC free article] [PubMed] [Google Scholar]
- 19.Shah T, Press VG, Huisingh-Scheetz M, White SR. COPD readmissions: Addressing COPD in the era of value-based health care. Chest. 2016;150:916–26. doi: 10.1016/j.chest.2016.05.002. [DOI] [PMC free article] [PubMed] [Google Scholar]
- 20.Hekkert K, van der Brug F, Keeble E, Borghans I, Cihangir S, Bardsley M, et al. Re-admission patterns in England and the Netherlands: A comparison based on administrative data of all hospitals. Eur J Public Health. 2019;29:202–7. doi: 10.1093/eurpub/cky199. [DOI] [PubMed] [Google Scholar]
- 21.Gibson GJ, Loddenkemper R, Lundbäck B, Sibille Y. Respiratory health and disease in Europe: the new European Lung White Book. The European respiratory journal. 2013;42:559–63. doi: 10.1183/09031936.00105513. [DOI] [PubMed] [Google Scholar]
- 22.Hartl S, Lopez-Campos JL, Pozo-Rodriguez F, Castro-Acosta A, Studnicka M, Kaiser B, et al. Risk of death and readmission of hospital-admitted COPD exacerbations: European COPD audit. Eur Respir J. 2016;47:113–21. doi: 10.1183/13993003.01391-2014. [DOI] [PubMed] [Google Scholar]
- 23.Alaithan AM, Memon JI, Rehmani RS, Qureshi AA, Salam A. Chronic obstructive pulmonary disease: Hospital and intensive care unit outcomes in the Kingdom of Saudi Arabia. Int J Chron Obstruct Pulmon Dis. 2012;7:819–23. doi: 10.2147/COPD.S37611. [DOI] [PMC free article] [PubMed] [Google Scholar]
- 24.Chatterjee K, Goyal A, Joshi M. Thirty-day readmissions in adults hospitalized for COPD or bronchiectasis: Findings from the nationwide readmission database 2013. Chest. 2017;151:943–5. doi: 10.1016/j.chest.2016.12.034. [DOI] [PubMed] [Google Scholar]
- 25.Leff DR, Leff AR. Tuberculosis control policies in major metropolitan health departments in the United States. IV. Standards in 1988. Am Rev Respir Dis. 1989;139:1350–5. doi: 10.1164/ajrccm/139.6.1350. [DOI] [PubMed] [Google Scholar]
- 26.Leff DR, Leff AR. Tuberculosis control policies in major metropolitan health departments in the United States. VI. Standard of practice in 1996. Am J Respir Crit Care Med. 1997;156:1487–94. doi: 10.1164/ajrccm.156.5.9704105. [DOI] [PubMed] [Google Scholar]
- 27.Ley B, Collard HR. Epidemiology of idiopathic pulmonary fibrosis. Clin Epidemiol. 2013;5:483–92. doi: 10.2147/CLEP.S54815. [DOI] [PMC free article] [PubMed] [Google Scholar]
- 28.Harari S, Madotto F, Caminati A, Conti S, Cesana G. Epidemiology of Idiopathic pulmonary fibrosis in Northern Italy. PLoS One. 2016;11:e0147072. doi: 10.1371/journal.pone.0147072. [DOI] [PMC free article] [PubMed] [Google Scholar]
- 29.Martinez FJ, Collard HR, Pardo A, Raghu G, Richeldi L, Selman M, et al. Idiopathic pulmonary fibrosis. Nat Rev Dis Primers. 2017;3:17074. doi: 10.1038/nrdp.2017.74. [DOI] [PubMed] [Google Scholar]
- 30.Sherbini N, Feteih MN, Wali SO, Alamoudi OS, Al-Faifi SM, Khalid I. Idiopathic pulmonary fibrosis in Saudi Arabia: Demographic, clinical, and survival data from two tertiary care hospitals. Ann Thorac Med. 2014;9:168–72. doi: 10.4103/1817-1737.134073. [DOI] [PMC free article] [PubMed] [Google Scholar]
- 31.Pedraza-Serrano F, López de Andrés A, Jiménez-García R, Jiménez-Trujillo I, Hernández-Barrera V, Sánchez-Muñoz G, et al. Retrospective observational study of trends in hospital admissions for idiopathic pulmonary fibrosis in Spain (2004-2013) using administrative data. BMJ Open. 2017;7:e013156. doi: 10.1136/bmjopen-2016-013156. [DOI] [PMC free article] [PubMed] [Google Scholar]
- 32.Alhamad EH, Masood M, Shaik SA, Arafah M. Clinical and functional outcomes in Middle Eastern patients with idiopathic pulmonary fibrosis. Clin Respir J. 2008;2:220–6. doi: 10.1111/j.1752-699X.2008.00070.x. [DOI] [PubMed] [Google Scholar]
- 33.Kreivi HR, Itäluoma T, Bachour A. Effect of ventilation therapy on mortality rate among obesity hypoventilation syndrome and obstructive sleep apnoea patients. ERJ Open Res. 2020;6:00101–2019. doi: 10.1183/23120541.00101-2019. [DOI] [PMC free article] [PubMed] [Google Scholar]
- 34.Mokhlesi B, Masa JF, Afshar M, Almadana Pacheco V, Berlowitz DJ, Borel JC, et al. The effect of hospital discharge with empiric noninvasive ventilation on mortality in hospitalized patients with obesity hypoventilation syndrome. An individual patient data meta-analysis. Ann Am Thorac Soc. 2020;17:627–37. doi: 10.1513/AnnalsATS.201912-887OC. [DOI] [PubMed] [Google Scholar]
- 35.Humbert M, Sitbon O, Chaouat A, Bertocchi M, Habib G, Gressin V, et al. Pulmonary arterial hypertension in France: Results from a national registry. Am J Respir Crit Care Med. 2006;173:1023–30. doi: 10.1164/rccm.200510-1668OC. [DOI] [PubMed] [Google Scholar]
- 36.Peacock AJ, Murphy NF, McMurray JJ, Caballero L, Stewart S. An epidemiological study of pulmonary arterial hypertension. Eur Respir J. 2007;30:104–9. doi: 10.1183/09031936.00092306. [DOI] [PubMed] [Google Scholar]
- 37.Prins KW, Thenappan T. World Health Organization Group I pulmonary hypertension: Epidemiology and pathophysiology. Cardiol Clin. 2016;34:363–74. doi: 10.1016/j.ccl.2016.04.001. [DOI] [PMC free article] [PubMed] [Google Scholar]
- 38.Bergot E, De Leotoing L, Bendjenana H, Tournier C, Vainchtock A, Nachbaur G, et al. Hospital burden of pulmonary arterial hypertension in France. PLoS One. 2019;14:e0221211. doi: 10.1371/journal.pone.0221211. [DOI] [PMC free article] [PubMed] [Google Scholar]
- 39.Thomas ET, Glasziou P, Dobler CC. Use of the terms “overdiagnosis” and “misdiagnosis” in the COPD literature: A rapid review. Breathe (Sheff) 2019;15:e8–19. doi: 10.1183/20734735.0354-2018. [DOI] [PMC free article] [PubMed] [Google Scholar]
- 40.Al-Kassimi FA, Abba AA, Al-Hajjaj MS, Alhamad EH, Raddaoui E, Shaikh SA. Asthma masquerading as chronic obstructive pulmonary disease: A study of smokers fulfilling the GOLD definition of chronic obstructive pulmonary disease. Respiration. 2011;82:19–27. doi: 10.1159/000323075. [DOI] [PubMed] [Google Scholar]