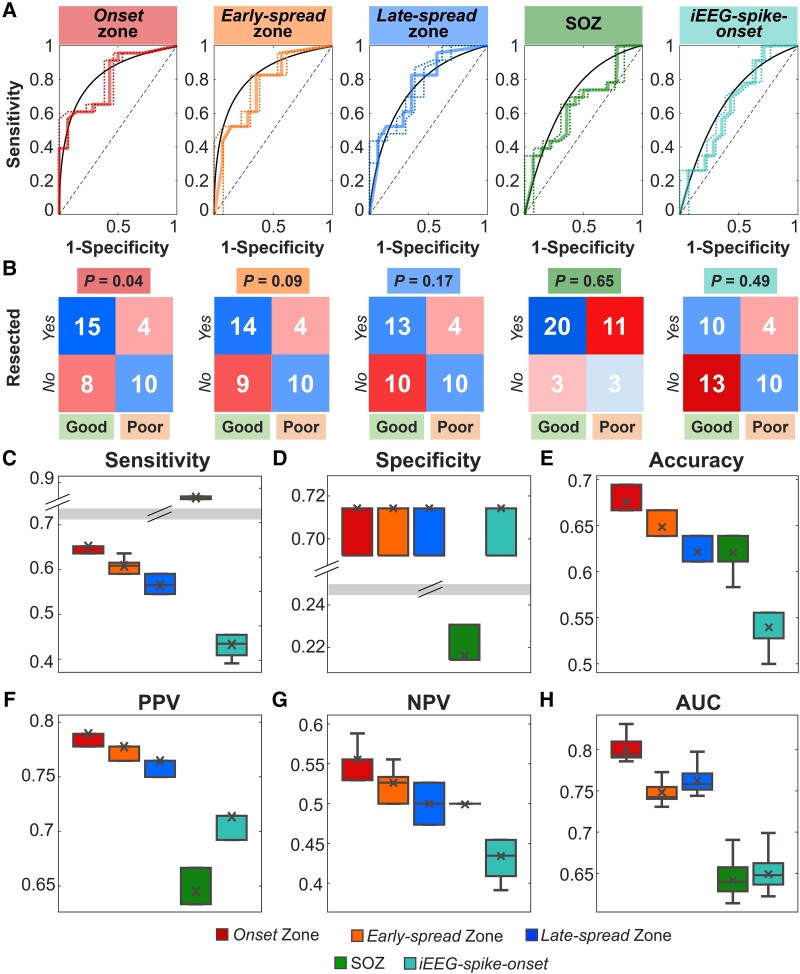
Figure 5.
Outcome prediction results. (A) From left to right: ROC curves and their confidence intervals for ORES of the onset zone, early-spread zone, late-spread zone, clinically-defined SOZ and iEEG spike onset as predictor of the post-surgical outcome. (B) Confusion matrices for each region of interest (ROI) obtained on the whole cohort, setting 50% as best threshold for evaluating the post-surgical outcome. (C) Sensitivity, (D) specificity, (E) accuracy, (F) positive predictive value (PPV), (G) negative predictive value (NPV) and (H) area under the curve (AUC) leave-one-out cross validated measures evaluated for each ROI. In A, the black line is the convex hull of the mean ROC curve (i.e. continuous coloured line), while the dashed lines are the superior and inferior ROC ranges. In the box plots, the cross identifies the mean value, the line is the median, the lower and upper edges are, respectively, the 25th and 75th percentiles, while the whiskers range from the minimum to the maximum values (disregarding the outliers).

