

1. Abstract
The brain primarily relies on glycolysis for mitochondrial respiration but switches to alternative fuels such as ketone bodies (KB) during low glucose availability. Neuronal KB uptake, which does not rely on the glucose transporter 4 (GLUT4) and insulin, has shown promising clinical applications in alleviating the neurological and cognitive effects of disorders with hypometabolic components. However, the specific mechanisms by which such interventions affect neuronal functions are poorly understood. In this study, we pharmacologically blocked GLUT4 to investigate the effects of the exogenous KB D-β-hydroxybutyrate (D-βHb) on mouse brain metabolism during acute insulin resistance (AIR). We found the impacts of AIR and D-βHb to be qualitatively distinct across neuronal compartments: AIR decreased synaptic activity and LTP, and impaired axonal conduction, synchronization, and action potential (AP) properties. D-βHb rescued neuronal functions connected to axonal conduction and synchronization but did not rescue synaptic activity. While DβHb failed to rescue synaptic activity, it successfully rescued neuronal functions associated with axonal conduction and synchronization.
Keywords: hippocampus, beta-hydroxybutyrate, insulin resistance, Schaffer collaterals, pyramidal neurons
2. Introduction
Over the past two decades, research on insulin signaling in the brain has become increasingly important in the contexts of type 2 diabetes mellitus (T2DM) and Alzheimer’s disease (AD) [1,2]. Insulin plays a critical role in memory formation processes in the hippocampus. Systemic insulin resistance can interfere with hippocampal metabolism and cognitive function, as shown by various studies [3,4]. Therefore, depletion of glucose availability in the hippocampus may contribute to cognitive decline associated with healthy aging, T2DM, and AD [5,6]. Additionally, insulin is an essential element in memory processing in the hippocampus and a vital mediator of cognitive impairments in T2DM and AD [7,8]. Although insulin does not easily cross the blood-brain barrier, research suggests local insulin synthesis and release in the brain [9]. It is believed that hippocampal insulin might enhance the pro-cognitive effects of brain glucose [10].
Brain aging and age-based cognitive impairment are associated with cerebral glucose hypometabolism [13]. Indeed T2DM, and thus insulin resistance, are associated with accelerated brain aging and cognitive decline [12]. This relationship has led to the hypothesis that brain aging and associated hypometabolism reflect encroaching neuronal insulin resistance. The hippocampus is highly enriched with the insulin responsive GLUT4, which is the primary neuronal glucose transporter, particularly in brain areas with high concentrations of insulin receptors and increased neuronal activity [10,13,14]. Insulin acts by enhancing GLUT4 translocation across neuronal membranes in a time-dependent manner under regulation by phosphatidylinositol 3-kinase (PI3K), which furthermore promotes memory formation [15,16]. GLUT4 is primarily expressed in the soma rather than in the more metabolically active hippocampal neuropil during memory formation [17,18]. Indeed, the results of those studies suggest that insulin release throughout the hippocampus may act simultaneously at synapses and soma to control glutamatergic neurotransmission by enhancing GLUT4 translocation and neuronal glucose utilization. Mouse models of AD or diet-induced obesity (DIO) showed blunting of the pro-cognitive effects of intrahippocampal insulin injections, along with decreased local glucose metabolism [19,20]. These mouse models also showed neuronal hyperexcitability with epileptiform spikes, along with impairment of GLUT4 translocation, which is considered a key factor in the associated cognitive and metabolic impairments [21].
During periods of lower glucose availability, including sleep, the brain switches to alternative fuels such as ketone bodies (KBs) [22,23]. Shifting brain metabolism from its default glycolysis to ketosis through the introduction of a ketogenic diet has shown pro-cognitive benefits in patients suffering from T2DM or AD. These benefits may arise from a reduction in neuronal firing rates during ketosis, which can help to maintain neuronal stability [24–26]. One of the earliest studies of the effects of the ketogenic diet on rodent brain metabolism showed that shifting to KB metabolism increased ATP:ADP ratios, which could account for improved neuronal stability [27]. The substantial formation of acetyl-CoA via KB metabolism [28] is thought to contribute to the increased secretion of the inhibitory neurotransmitter GABA [29], improvements in the NAD:NADH equilibrium, increased efficiency of ATP production, and reduced production of free radicals, which together may help to moderate the excessive neuronal firing and its metabolic consequences [30,31].
Moreover, KBs play a crucial role in protecting mitochondria from acute metabolic stress. KBs prevent mitochondrial permeability transition (mPT) through effects on intracellular calcium levels, leading to a direct increase in the threshold for mPT, thus preserving neuronal cell viability and preventing cell death [31,32]. Furthermore, KBs can affect neuronal firing frequency by modulating the activity of ion channels, by promoting the opening of ATP sensitive K+ channels (K-ATP), thus reducing the cytosolic pool of ATP generated from glycolysis and disinhibiting the opening of K-ATP channels [26,33].
The ketogenic diet calls for strict adherence to promote KB metabolism [34]. However, administration of exogenous KBs such as D-beta-hydroxy-butyrate (DβHb) ester can raise KB levels in circulation without requiring severe restrictions on glucose availability that would be likely to globally perturb metabolic homeostasis [35,36]. It is unclear whether KBs such as D-βHb ester can maintain their neuroprotective effects in the presence of normal glucose levels. However, dietary ketosis through exogenous KBs increased overall brain activity and stabilized functional networks in healthy adults [37], even in younger adults [38].
In this study, we establish a hippocampal model of acute insulin resistance (AIR) through the inhibition of GLUT4 by administration of Indinavir [39,40], a compound best known as a retroviral protease inhibitor. We studied how neuron-specific insulin resistance affects hippocampal neurons and the CA1 circuit, one of the most studied brain circuits for learning and memory. We tested the interaction between D-βHb treatment and AIR to establish the therapeutic potential of a ketogenic diet in euglycemic animals. To examine circuit-wide effects on synaptic and axonal function, we obtained field potential recordings in the hippocampus. Furthermore, patch-clamp recordings in hippocampal slices were utilized to assess the effects of AIR and D-βHb on the electrophysiological properties of CA1 pyramidal neurons and CA1 fast-spiking interneurons (FSI). Finally, we used computational modeling to establish a bridge between our electrophysiological results and the dysfunction of Na+/K+ ATPase observed in our AIR model.
3. Results
Electrophysiological studies have identified various paradigms of synaptic plasticity in the hippocampus, which are associated with learning and memory at a cellular level. Long-term potentiation (LTP) and long-term depression (LTD), spike-timing-dependent plasticity, and EPSP-spike potentiation have been extensively documented in many hippocampal circuits, making it a classic system for studying neuroplasticity. Furthermore, the hippocampus’s simple cytoarchitecture, combined with this background, makes it an ideal model system for investigating the detrimental effects of AIR on learning and memory. In this study, we utilized Indinavir, a potent GLUT4 blocker, to induce AIR pharmacologically, specifically in the brain. Our investigation was focused on the stratum radiatum of the CA1, where numerous synapses are formed between Schaffer collaterals (SCO) and the apical dendrites of the pyramidal neurons.
3.1. Synaptic activity and LTP, but not fiber volleys (FV), are adversely affected by AIR and are not reversed by either 0.1 mM or 1 mM DβHb.
To test synaptic transmission within CA1 under different physiological stimulation paradigms, we measured the circuit’s response under a wide range of energetic demands. First, we applied mild physiological stimulation, consisting of paired stimulation at 25 Hz, with repetition every 20 s over 30-60 trials [Fig. 1A–F], which does not impose high energetic demands and is within the range of a naturally occurring, physiological CA3-driven slow gamma rhythm observed in CA1 during normal behavioral activity [41,42]. Moreover, this stimulation, during field potential recordings, allows us to probe two neuronal functions at once: the fEPSP component of the signal, referring to the glutamatergic synapses of CA1 pyramidal neurons, and the FV component, referring to APs generated by CA3 pyramidal neurons.
Figure 1: Synaptic activity and LTP, but not neuronal firing or PPR, are decreased during paired stimulation and do not recover during D-βHb administration.
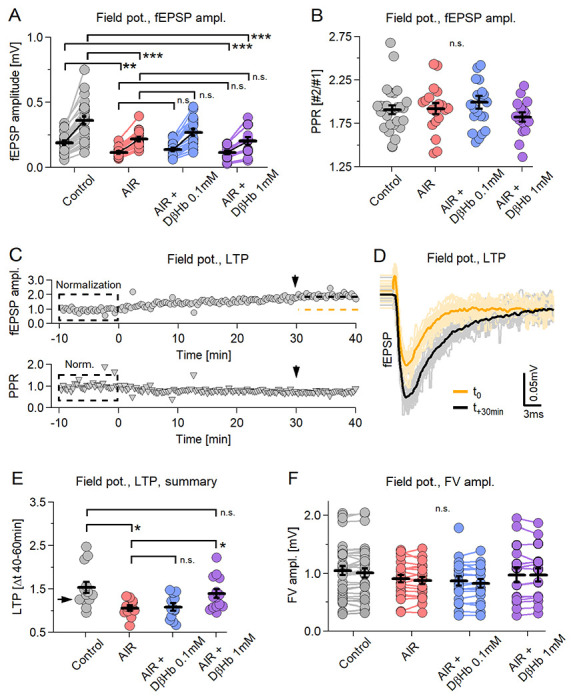
A) Scatter plot of the fEPSP amplitudes evoked by paired-pulse stimulation of Schaffer collaterals. Each pair of circles is the average of 30-40 consecutive responses. Black bars represent mean ± SEM. Control fEPSPs in gray, AIR in red; 0.1 mM D-βHb + AIR in blue; 1 mM D-βHb in purple. Control: n=26 slices; AIR n=19; 0.1 mM D-βHb + AIR: n=20; 1 mM D-βHb + AIR: n=16. B) Scatter plot of the paired-pulse ratio (PPR) of fEPSP recorded in A. The labels, n, are identical to A). No significant differences (p=0.41, ANOVA). C) On top: Representative recording of a Control experiment where the same stimulation as in A) was applied for 50 min. Each circle represents fEPSPs amplitude normalized to the average of the first 30 fEPSPs. The dashed orange line represents the mean amplitude at time −10 to 0 min. The black line represents the mean amplitude at +30 to +40 min. At the bottom: corresponding normalized PPR. D) fEPSPs waveforms recorded in C) showing LTP development. In gray, 30 fEPSP waveforms at t=0 to t=+10 min and their average (black). In yellow, 30 fEPSP at time +30 to +40 min and their average (orange). Stimulation artifacts and FVs are removed. E) Scatter plot of LTP triggered by paired stimulation, as in A). Control: n=13; AIR n=11; 0.1 mM D-βHb + AIR: n=12; 1 mM D-βHb + AIR: n=14. F) Scatter plot of the FV amplitudes recorded during A). The labels, n are identical to A). No significant differences (p=0.42 at stimulus 1, p=0.40 at stimulus 2; ANOVA). In all plots *p<0.05; **p<0.01; ***p<0.001.
During the AIR condition, we observed a strong decrease in fEPSP amplitudes, namely −39.23 ± 8.72% (1st stimulus) and −38.79 ± 8.93% (2nd stim.) compared to baseline (Fig. 1A, p = 0.00029; p = 0.00037, respectively). There was no recovery of amplitude when D-βHb was applied at low (0.1 mM) (+13.10 ± 6.64% and +14.07 ± 6.76%, Fig. 1A, p = 0.34, p = 0.30) or high (1 mM) (Fig. 1A, −5.98 ± 6.13% and −5.81 ± 6.26%, p = 0.88; p = 0.56) concentrations. There were no effects of either AIR or D-βHb + AIR on PPR [Fig. 1B, Control: 1.89; AIR: 1.92; 0.1 mM D-βHb + AIR: 2.00; 1 mM D-βHb + AIR: 1.88; p = 0.54], suggesting that the facilitation at the synaptic sites remained largely unchanged.
When applied over sufficient time, our paired stimulation triggered the development of LTP in the CA1, as evident by a gradual increase in the fEPSP amplitudes [Fig. 1C, top]. As with the LTPs induced by theta burst or tetanic stimulation, PPR showed no visible change [Fig. 1C, bottom]. Therefore, we measured the LTP effect by comparing fEPSP amplitudes during the first 10 min with fEPSP amplitudes at 40 ± 10 min [Fig. 1D–F]. The control condition showed the strongest LTP, with a ratio of 1.53 ± 0.13, while LTP induction was almost abolished during AIR [Fig. 1E, 1.06 ± 0.06 ratio; −30.66 ± 9.42% reduction compared to the Control condition, p = 0.018]. D-βHb at 0.1 mM concentration did not reverse this effect [Fig. 1E, 1.08 ± 0.08, +1.25 ± 6.61% AIR vs. D-βHb + AIR 0.1 mM, p > 0.99], but 1mM D-βHb did [Fig. 1E, 1.39 ± 0.10, +21.19 ± 7.64% AIR vs. D-βHb + AIR 1 mM, p = 0.044].
Moreover, we found no significant effects of either AIR or D-βHb + AIR on the amplitudes of the recorded fiber volleys (FV) [Fig. 1F means of both responses; control: 1.03 ± 0.08; AIR: 0.89 ± 0.07; D-βHb + AIR 0.1 mM: 0.85 ± 0.08; D-βHb + AIR 1 mM: 1.03 ± 0.12; p = 0.40].
Taken together, these results strongly suggest that the effects of both AIR and/or D-βHb could have different specificities for various cellular compartments, with synapses being particularly susceptible to metabolic challenges induced by GLUT4 inhibition.
3.2. AIR and 0.1mM D-βHb have largely the same effects during train stimulation, but 1 mM D-βHb exerts an additional suppressive effect on synaptic transmission.
Next, we tested whether the circuit would behave differently under a stronger stimulation, thereby inducing greater metabolic demands: a model for cognitive load. We stimulated the Schaffer collaterals with 20 pulses applied at 25 Hz, with 20 s breaks between trials. This stimulation lies within the gamma rhythm range, but bursts of 20 APs are rare (although possible) under physiological conditions [41,42]. In all experimental groups we averaged the complete sets of 60 repetitions for comparison among the experimental groups. In addition, to avoid the onset of LTP from skewing the results, we recorded all train stimulations at least 40 min after the paired stimulation paradigm.
All compared groups showed potentiation of fEPSP amplitudes during the train, reaching peak potentiation at stimuli 5-6. Thereafter, the amplitudes experienced a slight decline but remained potentiated [Fig. 2A,B]. Interestingly, throughout the entire stimulation period, the fEPSP amplitudes matched the differences we had seen during paired stimulation [Fig. 2B; at stimulus 5: −34.25 ± 11.80% Control vs. AIR, p = 0.031; −40.54 ± 11.48% Control vs. 1 mM D-βHb + AIR, p = 0.000044; +3.37 ± 7.80 AIR vs. 0.1 mM D-βHb + AIR, p = 0.99; −25.21 ± 7.36% AIR vs. 1 Mm D-βHb + AIR, p = 0.0054]. The FV amplitudes followed a similar pattern, with potentiation observed at stimulus 2, followed by a consistent decline to approximately 70% of the initial amplitude [Fig. 2C]. Similar to paired stimulation, no statistically significant differences were observed between groups at any time point during the train [Fig. 2C; p = 0.16 to 0.40].
Figure 2: AIR and D-βHb have the same effects during train and paired stimulation.
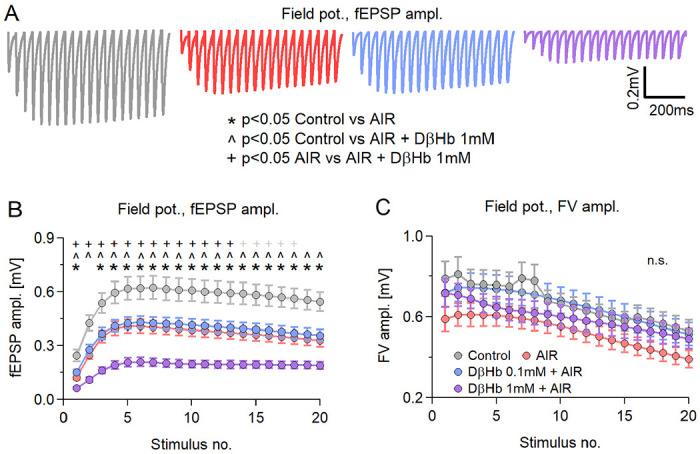
A) Representative examples of averaged fEPSP responses recorded in each experimental group to Schaffer collateral stimulation with 20 pulses applied at 25 Hz every 20 s for 20 min, at 280–350 μm distance between electrodes. Control in gray; AIR in red; 0.1 mM D-βHb + AIR in blue; 1 mM D-βHb + AIR in purple. Stimulation artifacts and FVs are removed for clarity. B) Group mean fEPSP amplitudes ± SEM evoked by stimulation as in A), plotted against the stimulus number. *,#,+,^ mark statistically significant differences. *<0.05 Control vs. 0.1 mM AIR; #p<0.05 Control vs. 0.1 mM D-βHb + AIR; +p<0.05 Control vs. 1 mM D-βHb + AIR; ^p<0.05 0.1 mM D-βHb + AIR vs. 1 mM D-βHb + AIR; ANOVA. Control, n=24, N=22; AIR, n=16, N=15; 0.1 mM D-βHb + AIR, n=17, N=15; 1 mM D-βHb + AIR, n=14, N=10. C) Group mean FV amplitudes ± SEM recorded during A), plotted against the stimulus number. The labels, n, and N are identical to (B). No significant differences (p=0.091 to 0.34 during the trains, ANOVA).
As with paired stimulation, the compartment-specific effects of AIR and D-βHb are preserved. Interestingly, the relatively unchanged response patterns support our previous PPR-related conclusions that synaptic facilitation is largely unchanged [Fig. 1B] Additionally, at the high concentration, D-βHb demonstrated synaptic suppression, potentially linked to the lower vesicular glutamate content reported in previous studies [43,44].
3.3. AIR and D-βHb during non-physiological, long-train stimulation demonstrated effects similar to previously employed physiological stimulation paradigms.
Finally, we examined the hippocampal circuit under conditions of intense non-physiological stimulation. This involved applying long trains of 50 stimuli at 25 Hz, spanning across 60 trials with a 20-second break between each trial. The responses during this specific stimulation varied between trials, making it inappropriate to average them over the entire stimulation period. As a result, we represent the fEPSP and FV amplitudes as heat maps. In these heat maps, each point represents the group’s mean response to a single stimulus at a given time point.
Consistent with our previous results, we observed a period of fEPSP amplitude potentiation followed by a steady decline [Fig. 3A–D; at maximum, trial 4-6, stimuli 7-9: −34.81 ± 10.56% Control vs. AIR, p=0.0084; −48.27 ± 11.37% Control vs. 1 mM D-βHb + AIR, p = 0.00065; +10.19 ± 11.39% AIR vs. 0.1mM D-βHb + AIR, p=0.59; −13.66 ± 9.08% AIR vs. 1mM D-βHb + AIR, p = 0.45]. Synaptic depression developed by the final stimuli of the trains roughly 3 min into the stimulation and became more prominent with each subsequent train application [Fig. 3A–D]. In general, fEPSP amplitudes of controls and AIR groups differed substantially through the first 7 min of the recordings [Fig. 3A]. Control and 1 mM D-βHb + AIR groups also differed throughout most stimulation [Fig. 3B], but the 0.1 mM D-βHb + AIR and AIR alone groups scarcely differed except at the end of the trains [Fig. 3C]. The AIR and 0.1 mM D-βHb groups generally did not differ.
Figure 3: During overtaxing non-physiological stimulation, AIR and D-βHb show comparable effects with physiological stimulation paradigms.
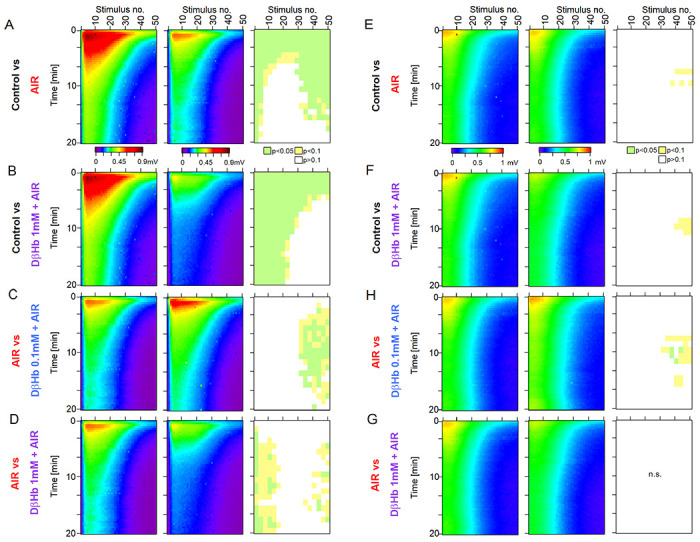
A) Heat maps of mean fEPSP amplitudes recorded over 60 min in the Control and AIR groups and the significance of the differences. The y-axis represents the time points of the trains of 50 stimuli applied at 25 Hz every 20 s at 280-350 μm distance between electrodes. The x-axis represents the time points of responses to individual stimuli. fEPSP amplitudes are color-coded as a visible light spectrum in the range of 0.1 mV (brown) and 0 mV (violet). Control n=24 slices, N=24 mice, and AIR n=21, N=18. The groups were compared as 3 stimuli x 3-time blocks, and the p values are summarized on the rightmost graph. B) The same as A) for Control and 1 mM D-βHb + AIR groups. Control n=24, N=24; 1 mM D-βHb + AIR n=12, N=10. C) The same as A) for AIR and 0.1 mM D-βHb + AIR groups. AIR n=21, N=18; 0.1 mM D-βHb + AIR; n=18, N=15. D) The same as A) for AIR and 1 mM D-βHb + AIRgroups. AIR n=21, N=18; 1 mM D-βHb + AIR n=12, N=10. E) Comparison of mean FV amplitudes between Control and AIR groups as in A). The layout, color-coding, and n or N numbers are identical to A). F) The same as E) for Control and 1 mM D-βHb + AIR groups. The layout, color coding, and n or N numbers are identical to B). G) The same as E) for AIR and 0.1 mM D-βHb + AIR groups. The layout, color coding, and n or N numbers are identical to C). H) The same as E) for AIR and 1 mM D-βHb + AIR groups. The layout, color coding, and n or N numbers are identical to D).
In contrast to fEPSP amplitudes, FV between all the groups remained statistically similar, with almost the same response pattern [Fig. 3E–G], replicating the results from Fig. 1 and Fig. 2.
3.4. AIR impairs axonal conduction speeds, but D-βHb treatment restores and enhances axonal conduction in a dose-dependent manner.
In the previous sections, we highlighted how AIR and the rescue agent D-βHb affected fEPSPs and FVs at CA1 stratum radiatum, finding a surprising lack of adverse effects of AIR on FV amplitudes, along with a noticeable reduction in fEPSP amplitudes, which DβHB all further exacerbated. This difference suggests that different cellular compartments might be differentially affected by AIR or D-βHb treatment. We, therefore, decided to investigate whether any other physiological parameters of FVs change during AIR and whether DβHB remedies any such changes.
Considering first the conduction velocities (CV) of the FVs, we found that inducing AIR resulted in a strong reduction in the CV of Schaffer collaterals (SCOs) [Fig. 4C; −13.07 ± 2.87% Control vs. AIR, p = 0.027]. Interestingly, the addition of 0.1 mM D-βHb to AIR reversed the CV decrease back to Control levels [Fig. 4C; +12.43 ± 4.42% AIR vs. 0.1 mM D-βHb + AIR, p = 0.034; +0.01 ± 0.07% Control vs. 0.1mM D-βHb + AIR, p = 0.99]. However, the combination of 1 mM D-βHb + AIR significantly increased CV levels, surpassing those of the Control group by approximately 20% [Fig. 4C; +31.79 ± 4.59% for AIR vs. 1 mM D-βHb + AIR, p = 4.2E-8; +19.10 ± 4.53% for Control vs. 1 mM D-βHb + AIR, p = 0.00057].
Figure 4: Conduction velocity (CV) of Schaffer collaterals decreases under AIR are rescued by 0.1 mM D-βHb, and increases with 1mM D-βHb concentration.
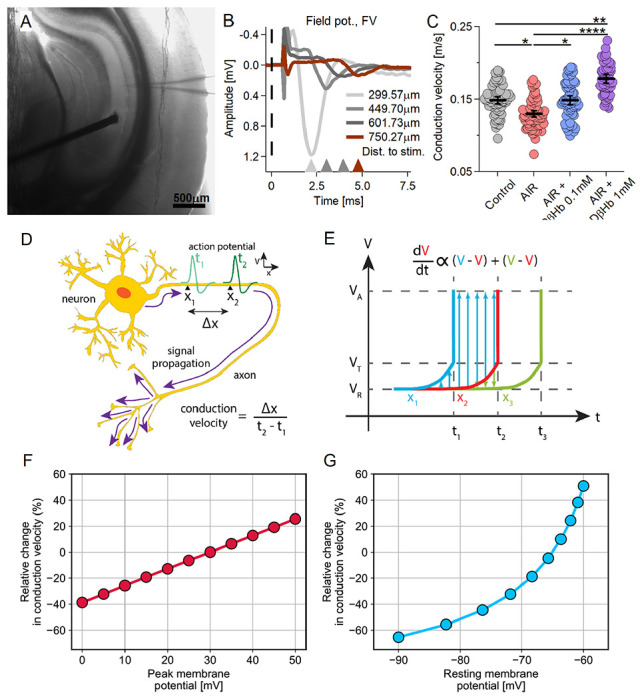
A) Representative hippocampal slice during CV recording. Distance between the electrodes = ~600 μm. B) Representative FV averages recorded in CA1, at ~300-900 μm distance between the electrodes (150 μm spacing). The stimulus onset time (t=0) is marked with a dashed line. Stimulus artifacts are removed for clarity. C) Conduction velocity scatter plots. Each colored circle represents a CV replicate. Control in gray, AIR in light red, 0.1 mM D-βHb + AIR in blue, and 1 mM D-βHb + AIR in purple. Data are shown as means ± SEM. *p<0.05; **p<0.01; ***p<0.001, nested ANOVA, Control: m=62, n=24, N=14; AIR: m=65, n=22, N=13; 0.1 mM D-βHb + AIR: m=64, n=21, N=13; 1 mM D-βHb + AIR: m=50, n=14, N=10. D) Diagram of conduction velocity of an action potential propagating along an axon. Conduction velocity is the ratio between the distance along the axon (Δx) and the time required for an AP to pass that distance (t2 – t1). V represents membrane potential. E) Model of a propagating action potential. Change in V over time (t) is shown at a longitudinal increment along the axon (x2) and at neighboring increments lying immediately ahead (x1) and behind (x3). Membrane potential at rest (VR) changes over time proportionally to the sum of differences between its value and those of the preceding and superseding increments. Upon reaching the threshold potential (VT), a spike occurs and the membrane potential reaches peak value (VA). F-G) CV is modulated by peak and resting membrane potentials. Our computational model predicts declining CV due to reductions in the peak of action potentials (F) and/or hyperpolarization of the resting membrane potential (G). CV quantified as percentage, relative to Control.
To elucidate these trends, we constructed a computational model of CV by employing an analytical approximation of axonal cable theory (refer to Methods for details). Our model examines three potential processes that determine CV, namely resting membrane potential (Vrest), peak membrane potential (Va, the amplitude of Na+-driven AP overshoot), and activation threshold potential (Vt, the earliest potential for Nav activation). We consider Vt to be robust to various physiological conditions, given that it primarily depends on Nav channel type and gating kinetics [45]; therefore, we fixed Vt at a constant value of −50 mV in our calculations. We varied Vrest between −90 and −60 mV and Va between 10 and 30 mV, both of which are considered physiological ranges. We evaluated the formula for CV at these increments relative to a reference state where Vrest = −75 mV, Va = 30 mV, and Vt = −50 mV. Results showed that acutely achieving a decrease in CV required either hyperpolarized resting membrane potential or decreased peak AP amplitude [Fig. 4F–G]. As we shall show below, the absence of such findings in our experimental observations calls for invoking another mechanism.
3.5. AIR adversely affects input timing, restored by high D-βHb concentrations.
Changes in the CV of the observed magnitude and differences in input timing would likely desynchronize the hippocampal network. Therefore, we investigated the changes in latency during stimulation with 20 pulse trains. Here, we assumed that the first 2 stimuli within the first 3 trials represented the baseline resting state of the circuit and normalized all measured latencies throughout the train to the median baseline value.
In all treatment groups, the first FV peaks after the onset of the stimulation tended to synchronize better, with FV peak latencies improving by ~−0.2 ms. This trend reversed in later stages of the train, where minor delays of +0.2 to +0.3 ms appeared. For the first 3 min of stimulation, all experimental groups exhibited the same pattern of latency changes. However, the delays subsequently became significantly different between the AIR group and both the Controls and the 1 mM D-βHb + AIR groups. During AIR, we observed the fastest progression of desynchronization and the largest delays [Fig. 5E–F, Fig. 5I, L; at 15 min, stim. 9-11: +2.69 ± 0.84 ms, Control vs. AIR, p = 0.0077; 2.64 ± 0.94 ms, AIR vs.1 mM D-βHb + AIR, p = 0.020]. The lower (0.1 mM) D-βHb concentration did not significantly improve the time delays when compared with the AIR group [Fig. 5F, G; Fig. 5J, K; p = 0.45 to 0.99]. However, the addition of 1 mM D-βHb resulted in latencies comparable to Control levels, with an almost identical pattern of progression [Fig. 5E, H; Fig. 5J; p = 0.070 to 0.99].
Figure 5: Time delays in axonal firing during taxing stimulation are increased during AIR and are reversed by 1 mM DβHb.
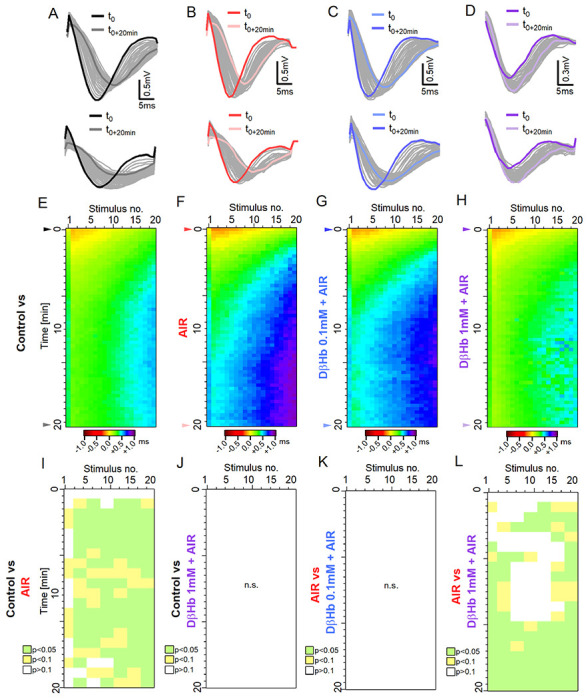
A) Top: Representative example of the FVs recorded at the first stimulus in the control group during stimulation with 20 pulses applied at 25 Hz every 20 s, over 20 min. Bottom: FVs recorded in response to the last stimulus in each train. The FVs recorded at t = 0 are marked in black; the FVs recorded at t = +20 min, are marked in dark gray. B) - D) The same as A) in the AIR, 0.1 mM D-βHb + AIR and 1 mM D-βHb + AIR groups. E) Heat map of the mean, normalized FV peak latencies recorded in the Control group. Each trial is represented by a new row. The columns represent the time points of successive stimuli. Normalized latencies (0 ms) are color-coded in yellow. Delays (>0 ms) are color-coded in green-violet, and latency improvements (<0 ms) are coded in orange-brown. n=24, N=22. F) – H) The same as E) for AIR, n=16, N=15; 0.1 mM D-βHb + AIR. n=17, N=15, 1 mM D-βHb + AIR. n=14, N=10. I) Statistical comparison of latencies for the Control (E) and AIR (F) groups, performed on means of 3 stimuli x 2 trials blocks. p<0.05 in green, p<0.1 in yellow, p≥0.1 in white. J) The same as I) comparing Control (E) and 1 mM D-βHb + AIR (H) groups. No significant differences, p=0.067to p=0.99. K) The same as I) comparing AIR (F) and 0.1 mM D-βHb + AIR (G) groups. No significant differences, p=0.41 to p=0.99. L) The same as I) comparing AIR (F) and 1 mM D-βHb + AIR (H) groups.
3.6. AIR increases membrane resistance (Rm) without affecting other intrinsic membrane properties of CA1 pyramidal neurons. D-βHb treatment under AIR did not recover Rm to normal levels.
Results presented above [Fig. 4] indicate that AIR might negatively impact the membrane properties of hippocampal neurons by disrupting the Na+/K+ ATPase, which normally maintains resting membrane potential after AP generation, thereby requiring roughly 59% of the total de novo ATP production [46]. Given this, we sought to identify membrane properties vulnerable to AIR and test their response to DβHb. Based on dose-response results from the field potential studies, we selected 1 mM D-βHb for use in patch clamp experiments testing the effects of AIR on intrinsic membrane properties of the CA1 pyramidal neurons (membrane resistance, Rm; membrane capacitance, Cm, and resting membrane potential, Vrest.), and their spike thresholds. We found significantly increased Rm of the CA1 pyramidal neurons in the AIR group compared with Controls [Fig. 6B, +43.24 ± 3.73%, p = 1.41E-07], which remained increased in the presence of 1 mM D-βHb [Fig. 6B, +27.86 ± 8.93%, p = 0.030], while AIR and 1 mM D-βHb + AIR groups were very similar (p=0.31). Interestingly, neither did Vrest. [Fig. 6C, −67.26 ± 1.17, −63.57 ± 1.38, −65.11 ± 0.99, p = 0.09, Control, AIR, D-βHb + AIR respectively] nor spike threshold [Fig. 6D, −46.31 ± 0.76, −44.53 ± 0.80, 44.64 ± 0.73, p = 0.17] were significantly affected by either AIR or D-βHb + AIR treatments, as likewise seen for Cm which also remained unaffected [114.25 ± 9.73, 115.52 ± 9.26, 132.20 ± 9.46, p = 0.32].
Figure 6: Membrane resistance (Rm) increases during AIR and is not reversed by DβHb. Other intrinsic properties do not change under either condition.
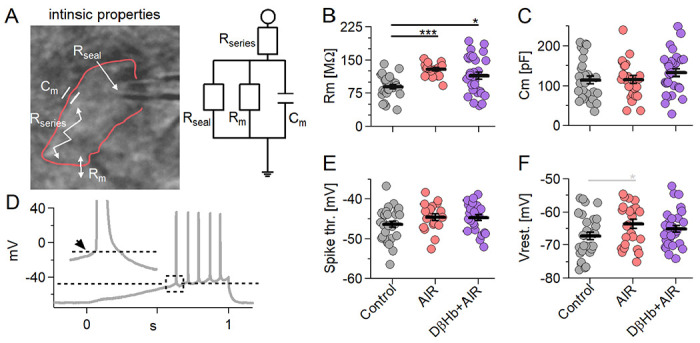
A) On the left: A CA1 pyramidal neuron recorded in whole-cell patch clamp mode (outlined in red) with resistances and capacitance within the cell. On the right: A simple electric circuit diagram of the cell with the same resistances. B) Scatter plots of CA1 pyramidal neuron Rm, compared between the experimental groups. Each colored circle represents a value recorded in a single cell. Control in gray, AIR in light red, 1 mM D-βHb + AIR in purple. Vertical black bars represent mean ± SEM. Control n=28, N=22; AIR n=25, N=17; 1 mM D-βHb + AIR; n=30, N=16. C) Scatter plots of CA1 pyramidal neurons capacitance (Cm), compared between the experimental groups. The plots and coloring are identical to B). No significant differences (p=0.32). Control n=28, N=22; AIR n=25, N=17; 1 mM D-βHb + AIR; n=30, N=16. D) Representative example of a ramp current injection performed in a Control CA1 pyramidal neuron. 300 pA of current were injected into the cell held in current clamp mode. The dashed line marks the spike threshold recorded at the onset of the first AP triggered. The inset shows the magnified AP with the arrow pointing to the onset time point. E) Scatter plots of CA1 pyramidal neurons spike thresholds, compared between the experimental groups. The plots are identical to B). No significant differences (p=0.17). Control n=28, N=22; AIR n=25, N=17; 1 mM D-βHb + AIR; n=30, N=16. F) Scatter plots of CA1 pyramidal neurons resting membrane potential (Vrest.), compared between the experimental groups. The plots and coloring are identical to B). No significant differences (p=0.09). Control n=28, N=22; AIR n=25, N=17; 1 mM D-βHb + AIR; n=30, N=16.
3.7. AIR increased the frequency of spontaneous vesicular release at CA1 synapses (sEPSCs) but did not affect sEPSC quantal parameters. D-βHb did not reverse the increase in frequency or change the properties of sEPSC.
One of the fundamental properties of synaptic transmission is the quantal size, q, which is defined as a single EPSC triggered by the release of a single neurotransmitter vesicle at a presynaptic release site. Due to the quantal nature of signaling, such events are known as quantal or miniature EPSC (mEPSC). Recovering the membrane back to resting potential during synaptic transmission is the most energy-consuming neuronal process (~50% of total ATP produced [46]). Therefore, we tested for changes in the frequency and magnitude of quantal EPSCs that might explain the ~35% decrease in fEPSP amplitudes reported above (Fig. 1–3). During these recordings, CA1 pyramidal neurons were held at Vh = −70 mV in VC, with no drugs other than Indinavir and/or DβHb. AIR significantly increased the frequency of qEPSCs, nearly doubling the number of detected synaptic events compared with the Control [Fig. 7A,B; 0.53 vs. 0.96 Hz, +0.42 ± 0.12 Hz, p = 0.0031]. Interestingly, D-βHb failed to rectify the increased qEPSC frequency [Fig. 7A,B; D-βHb + AIR 0.93 vs. AIR 0.96 Hz, 0.021 ± 0.15 Hz, p = 0.99; D-βHb + AIR vs. Control, +0.40 ± 0.12 Hz, p = 0.0091]. However, the amplitude, rise-time, and decay time of the sEPSCs showed no significant differences between the experimental groups [Fig. 7C–E, amplitude: p = 0.21; rise time: p = 0.51; decay tau: p = 0.98].
Figure 7: AIR increased sEPSC frequency without altering sEPSC properties and D-βHb (1 mM) does not reverse this effect.
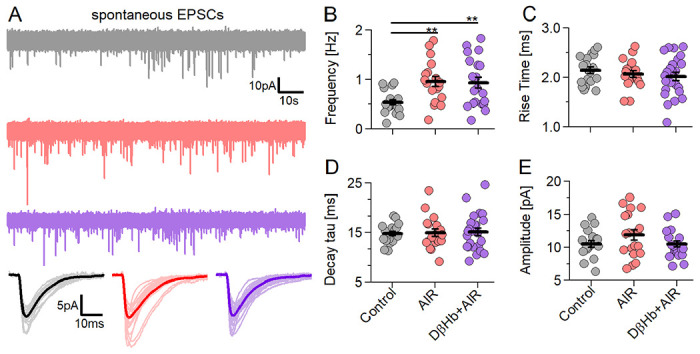
A) Representative examples of the first 2 min of sEPSC recorded in CA1 pyramidal neurons Voltage Clamped at Vh= −70 mV in each experimental group (Control in gray; AIR in red; 1.0 mM D-βHb + AIR in purple). Below: averaged sEPSC waveforms from individual cells (light color) and the group mean (full color). B) Scatter plots of the frequency of the sEPSCs recorded in CA1 pyramidal neurons, compared between the experimental groups. Each colored circle represents a value recorded in a single cell. Control in gray, AIR in light red, 1 mM D-βHb + AIR in purple. Vertical black bars represent mean ± SEM. *p<0.05, Control n=19, N=19; AIR n=19, N=14; 1 mM D-βHb + AIR, n=24, N=16. C) Scatter plots of the sEPSC 20-80% rise times, compared between the experimental groups, as in B). No significant differences (p=0.51). Control n=19, N=19; AIR n=19, N=14; 1 mM D-βHb + AIR, n=24, N=16. D) Scatter plots of the sEPSC decay tau times, compared between the experimental groups, as in B). No significant differences (p=0.98). Control n=19, N=19; AIR n=19, N=14; 1 mM D-βHb + AIR, n=24, N=16. E) Scatter plots of the sEPSC amplitudes, compared between the experimental groups, as in B). No significant differences (p=0.21). Control n=19, N=19; AIR n=19, N=14; 1 mM D-βHb + AIR, n=23, N=16.
Given the change in Rm, the lack of significant changes in the amplitudes is surprising. In addition, several studies utilizing different metabolic challenges, such as food deprivation [47] and inhibition of glycolysis [48], showed an increase in mEPSC/sEPSC amplitudes, therefore, we decided to investigate our sEPSCs in more detail. In most central synapses, in line with the quantal hypothesis, the distribution of mEPSC/sEPSC amplitudes shows several peaks related to multiple quanta released simultaneously or at short delays [49], with each subsequent peak linked to an increasing number of quanta released. Capitalizing on the multiplicative nature of this process, we assumed that small changes in amplitudes [Fig. 7E] would scale up. We detected 2-4 distinct peaks in ~85% of the analyzed cells [Fig. S1A–C], with no differences between the groups in the number of cells with multi-peak distributions [Fig. S1C; 89.5% in Control; 84.2% in AIR, 87.5% in D-βHb + AIR], but the amplitudes at each peak showed large differences between the groups [Fig. S1E], in line with our initial assumptions. Control and D-βHb + AIR groups did not show significant differences in the amplitudes at any point [Fig. S1E; peak 1: p = 0.50; p2: p = 0.17; p3: p = 0.88]. However, the AIR group had significantly higher amplitudes than D-βHb + AIR [p1: p = 0.048; p2: p = 0.0054; p3: p = 0.0038; p4: p = 0.021] and tested as different from Controls at peak 3 [p = 0.007]. We did not compare Control peak 4 with any group due to the low group size (n = 2). It is important to emphasize that D-βHb + AIR had the lowest amplitudes of all compared groups, despite the same sEPSC frequency as AIR [Fig. 7B].
We further validated those findings by comparing the normalized distributions [Fig. S1F–I]. Within the range correlating to peak 2 – peak 4 (sEPSC of 20 pA or more), AIR had a significantly higher number of large events (15.19% of the total) when compared to Control (7.65%) and D-βHb + AIR (9.48%) conditions [Fig. S1F–I]. On the other hand, Control and D-βHb + AIR groups showed little consistent differences in their distributions. This result suggests that during AIR, the elevated frequency of events increased the probability of multi-vesicular events occurring. Conversely, D-βHb during AIR, with the same frequency of sEPSCs as in the AIR-alone condition, produced a distribution resembling Control, as if the vesicles had lower glutamate content, as suggested by Fig. 1–3 and literature [43,44].
3.8. AIR slightly changes the firing pattern of hippocampal pyramidal neurons and causes increased membrane depolarization with input. Those effects of AIR are reversed by D-βHb, which surprisingly also increases AP amplitudes.
The action potential generation and subsequent recovery of Vm to resting levels entail a large part of the energy budget of pyramidal neurons (~41% of all produced ATP [46]). Therefore, we investigated changes in the capacity of CA1 pyramidal neurons to generate APs under the above experimental conditions by recording input-output curves, with the neurons subjected to 20 current steps 1 s apart of increasing magnitude (Δ25 pA) to a maximum current injection of 500 pA.
First, we recorded the firing frequency at different activation levels [Fig. 8A], finding that AIR caused the cells to fire during current injections of lower magnitude than required for Control recordings [Fig. 8B, 100 pA, p = 0.019] and D-βHb + AIR [Fig. 8B, 75 – 150 pA, p = 0.0038 to 0.050], but without altering the maximal firing rate [Fig. 8C, p = 0.78]. These results suggest that the cells activate slightly earlier under AIR than in the Controls or D-βHb + AIR conditions. To test this further, we measured the maximum depolarization attained by each neuron during the final 5 ms of each current injection step [Fig. 8D]. This analysis showed that AIR neurons indeed had slightly higher depolarization with each injection step compared to Controls [Fig. 8E,F; p = 0.0027 to 0.048] or D-βHb + AIR groups [Fig. 8E,F; p = 0.0029 to 0.042].
Figure 8: Neuronal firing is mildly affected by AIR and reversed by DβHb, with DβHb increasing AP overshoot ampitudes.
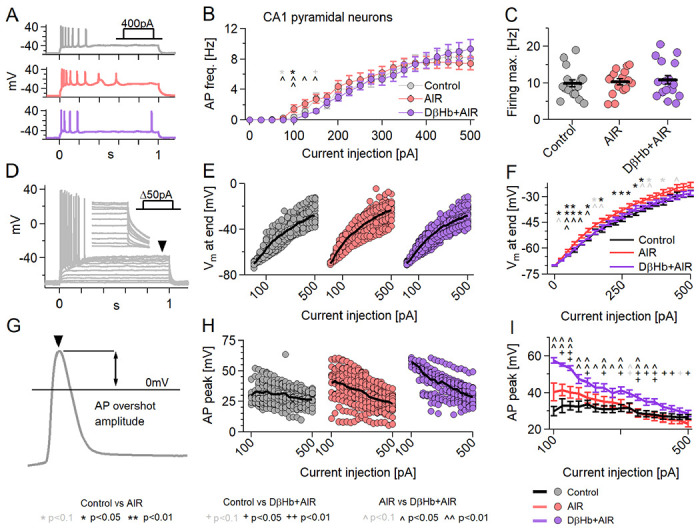
A) Representative examples of responses to 400 pA square current injections into Control (gray), AIR (red), and 1 mM D-βHb + AIR (purple) CA1 pyramidal neurons held at Vh=−70 mV. B) Input-output curves of CA1 pyramidal neurons. Cells received 21, Δ+25pA current injections to a maximum of 500 pA (Vh=−70 mV). Circles represent group mean ± SEM. * Control vs. AIR, + Control vs. 1 mM D-βHb + AIR, ^ AIR vs. 1 mM D-βHb + AIR. *,+,^ in black p<0.05; **,++,^^ in black p<0.01; *,+^ in gray p<0.1; ANOVA, Control n=23, N=20; AIR n=20, N=14; 1.0 mM D-βHb + AIR, n=22, N=16. C) Maximum firing rate of the pyramidal neurons in B). Circles represent single neurons, black bars represent group means ± SEM. No significant differences (p=0.778, ANOVA). N and n are identical to B). D) Example of responses to Δ+50pA square current injections into a control pyramidal neuron. The arrowhead and inset mark the membrane depolarization measurement (Vm, last 5 ms of the step). E) Vm at the current injections from B). Circles represent single neurons. Black lines represent the group mean. F) Group means ± SEM of Vm from E). Statistical tests and labels are identical to B). Control n=23, N=20; AIR n=20, N=14; 1 mM D-βHb + AIR n=22, N=16. G) Example of AP overshoot measurement. Black line marks Vm= 0 mV. H) Averaged AP overshoot amplitudes from B). Circles represent amplitudes in single neurons. Black lines represent group means. I) Group means ± SEM of overshoot amplitudes from H). Statistical tests and labels are identical to B). Control n=23, N=20; AIR n=20, N=14; 1 mM D-βHb + AIR, n=22, N=16.
Next, we investigated whether all experimental groups attained the same AP peak amplitudes [Fig. 8G]. Here, we averaged AP peak amplitudes generated at each step and compared the values by experimental condition, starting with the 100 pA step [Fig. 8H]. Surprisingly, D-βHb + AIR neurons had the largest amplitudes, which remained consistently elevated up to 350 pA compared to Controls [Fig. 8I, p = 0.00015 to 0.030]. At the same time, AIR neurons only showed significant differences from Controls or 1 mM D-βHb + AIR groups at the early injections [Fig. 8I, p = 0.0017 to 0.036, AIR vs. Control; p = 0.0093 to 0.044, AIR vs. 1 mM D-βHb + AIR].
3.8. AIR increases AP decay time, while D-βHb accelerates the AP rise without reversing the AIR-induced slower AP decay.
We next proceeded to investigate other properties of the APs, namely their decay time (from the overshoot peak to 0 mV) [Fig. 9A–C] and rise time (from 0 mV to the overshoot peak) [Fig. 9D–F]. We found that Control neurons had significantly lower average AP decay times when compared to AIR [Fig. 9B,C; p = 0.047 to 0.0019] and D-βHb + AIR conditions [Fig. 9B,C; p = 0.041 to 0.0023], across almost all current injection steps. AIR and D-βHb + AIR cells did not significantly different at any point [Fig. 9B,C; p = 0.32 to 0.99]. However, D-βHb + AIR cells demonstrated faster rise times compared to Control [Fig. 9E,F; p = 0.000094 to 0.0025] and AIR cells [Fig. 8E,F; p = 0.047 to 0.0052] in the majority of the injection steps. Interestingly, AIR cells exhibited slightly faster AP rise times exclusively at the lowest current injections [Fig. 6 N,O; p=0.012 to 0.035]. These slightly faster APs were likely due to earlier activation of the cells, as shown in [Fig. 8B–C, E–F]. Notably, the curves in [Fig. 9E,F] displayed an almost inverse shape compared to those in [Fig. 8H,I], indicating a potential correlation between the AP rise time and the amplitude of the overshoot. Most surprisingly, Control had the most stable AP rise times, changing little with increases in injected currents.
Figure 9: AP decay times change during AIR and DβHb + AIR but DβHb + AIR APs have faster rise times.
A) Example of AP decay time measurement. Black line marks Vm= 0mV. B) Averaged AP decay times for the current injections in B). Circles represent averaged amplitudes in single neurons. Black lines represent group means. C) Group means ± SEM of AP decay times from B). Statistical tests and labels are identical to B). Control n=23, N=20; AIR n=20, N=14; 1 mM D-βHb + AIR, n=22, N=16. D) Example of AP decay time measurement. Black line marks Vm= 0mV. E) Averaged AP rise times for the current injections in B). Circles represent averaged amplitudes in single neurons. Black lines represent group means. F) Group means ± SEM of AP rise times from B). Statistical tests and labels are identical to B). Control n=23, N=20; AIR n=20, N=14; 1 mM D-βHb + AIR, n=22, N=16. G) An example of the AP Inter Event Interval (IEI) measurement. The double arrow marks the latency between AP peaks. H) Averaged IEI recorded during the square current injections in B). Each point represents the average of all overshoot amplitudes recorded at each step in a single neuron. The black line represents the group mean. I) Group means ± SEM of averaged IEI. *,^ p<0.05; ANOVA, Control n=21, N=20; AIR n=19, N=14; 1 mM D-βHb + AIR, n=20, N=16.
Finally, as we did not observe significant differences in firing frequency among the groups [Fig. 8B,C], we examined variations in the timing of AP firing based on the intervals between consecutive APs (AP Inter Event Interval, AP IEI) [Fig. 9G]. There were no clearly consistent changes in the trend of the AP IEI during current injections [Fig. 9H,I; Control vs. AIR, 400, 425 pA injections, p = 0.043 and p = 0.029; Control vs. D-βHb + AIR, 225, 500 pA, p = 0.0053 and p = 0.023], although AIR tended to have some slightly increased IEI during injections of larger currents (>400pA), when compared with Control, but not D-βHb + AIR, but the trend is not consistent [Fig. 9I].
3.9. AP adaptation is negatively affected by AIR, with AP amplitudes showing steeper declines, and is not reversed by D-βHb.
The amplitudes of the AP overshoot, AP decays, and rise times demonstrated a distinct pattern in the AIR and D-βHb + AIR groups. Notably, the average slopes appeared to be steeper than the Control group. It is important to note that the properties of APs during neuronal firing and/or current injections undergo dynamic changes, commonly referred to as spike adaptation or spike frequency adaptation [50]. However, in our experiments, these changes seemed to be intensified by GLUT4 antagonism.
To test this, we examined the adaptation of AP overshoots by separately comparing the first APs triggered by current injections [Fig. S2 A–C,D], the averaged APs [Fig. 8G–I), Fig. S2E] and the final APs during current injections [Fig. S2F]. The first APs represent neuronal firing after rest (10s between subsequent current injections), while the average and final AP are recorded after energy expenditure. As expected, the first APs displayed minimal changes in amplitude with increasing injections [Fig. S2D], with D-βHb + AIR consistently exhibiting larger amplitudes than the Control group (p=0.0071 to p=0.047). AIR, also showing elevated amplitudes, did not differ significantly from either the Control or D-βHb + AIR groups. However, for the final APs, we observed a sharp decline in amplitude scaling with injected current [Fig. S2F]. In contrast to both AIR and D-βHb + AIR, the Control group remained relatively stable, demonstrating significant differences from D-βHb + AIR at low to medium injections (100-300pA; p=0.040 to p=0.00006) and from AIR at large injections (400-500pA; p=0.032 to p=0.0011) [Fig. S2F]. Linear fits to the average AP amplitudes revealed significantly steeper slopes of declining amplitudes [Fig. S2G,H; p=0.00039, AIR vs Control; p=0.0012, D-βHb + AIR vs Control]. These results indicate that the negative effects of AIR are even more pronounced during higher levels of neuronal activity.
3.10. Changes in AP decay and rise times translate into differences in the areas and widths of FVs.
In our initial analysis of the field potential (FV) data, our focus was solely on the amplitudes of the biological signals. Consistently, we found no significant changes in the FV amplitudes [Fig. 1F, 2C, 3E–G], which aligns with our findings on AP overshoot amplitudes [Fig. 8G–I] (with the exception of D-βHb + AIR group). Based on these results, we further investigated whether the changes in AP decay and/or rise times also corresponded to changes in FV areas or widths during our long-train stimulations [Fig. 3].
We first looked into FV areas [Fig. S3D,E], where we observed small but significant differences between all experimental groups during parts of the stimulation period, particularly at the beginning of the stimulation for AIR vs 1mM D-βHb + AIR (p=0.00015 to p=0.049).
Next, we explored the FV widths [Fig. S3F,G]. Consistent with the FV areas and our findings on AP decay/rise times, AIR exhibited the widest FV, followed by the Control group, while 1mM D-βHb + AIR had the narrowest FVs. However, the differences between AIR and Control were inconsistent and limited to a subset of the stimulation range. On the other hand, substantial differences were observed between AIR and 1mM D-βHb + AIR at the beginning of the stimulation, which gradually diminished by the end of the stimulation (p=1.26E-05 to p=0.046), supporting our findings on AP adaptation [Fig. S2].
3.11. With abolished GABAergic inhibition, AIR strongly decreased firing rates of CA1 pyramidal neurons and fast-spiking interneurons, which were not rescued by DβHb.
Our patch-clamp results in the CA1 pyramidal highlight an unusual increase in Rm [Fig. 6B], which likely arose from the earlier neuronal activation and the relatively depolarized membranes during current injections [Fig. 8B–F]. However, we performed the recordings under the same conditions as our field potential data [Fig. 1–5], which entailed normally functioning excitatory and inhibitory synaptic and extrasynaptic transmission. Therefore, as the next step, we investigated the properties of CA1 pyramidal neurons and fast-spiking interneurons (FSI) after pharmacologically abolishing AMPA/kainate excitatory and fast GABAergic inhibitory transmission by applying the antagonists NBQX and gabazine, respectively [Fig. S3].
For this investigation, we first recorded the firing frequency of CA1 pyramidal neurons [Fig. S3A,B] at different activation levels [Fig. S3C,D], finding that AIR prominently decreased their firing rate at nearly all injected currents, when compared with Control [Fig. S3C, p = 0.024 to 0.0053]. Surprisingly, the application of 1 mM D-βHb during AIR resulted in a stronger reduction in firing rate when compared with Control [Fig. S3E, p = 0.000027 to 0.035]. AIR and D-βHb + AIR results remained similar throughout the injections [Fig. S3E, with 60 pA, p = 0.035 and 150 pA, p = 0.036 being the only significant differences]. However, all groups differed significantly with respect to the maximum firing rate, with Control having the highest (31.03 ± 3.43) and D-βHb + AIR having the lowest (13.17 ± 2.05) firing rates.
Next, we examined CA1 FSIs using the same drug conditions as those applied to CA1 pyramidal neurons [Fig. S3E,F]. There was a similar but less prominent trend regarding firing frequency: AIR decreased the firing rate of FSIs compared with Control, which differed at the low injection magnitudes [Fig. S3G, p = 0.012 to 0.048]. D-βHb applied during AIR consistently resulted in a stronger reduction in firing rate relative to Control [Fig. 7H, p = 0.00017 to 0.035]. Interestingly, as also seen for pyramidal neurons, the FSIs for AIR and D-βHb + AIR groups remained comparable throughout the injections [Fig. S3G, 300 pA, p = 0.048; as the only clear difference], but none of the groups differed with respect to maximum firing rate [Fig. S3H, p = 0.068].
3.12. Hodgkin-Huxley model predicts that impairments in Na+/K+ ATPase activity result in more depolarized Vrest, lower AP overshoot (Va), and increased neuronal firing.
Here we aim to explain the previous observations of dysregulated firing dynamics in response to Indinavir-induced AIR. We hypothesize that Indinavir restricts the energy supply of neurons and thus impairs the neuronal Na+/K+ ATPase, one of the main consumers of cellular energy [46]. To test this hypothesis, we developed a computational model of the isolated CA1 neuron in the absence of inhibition and toggled Na+/K+ ATPase activity through the enzyme kinetic parameter vATPasemax (see methods, Fig. 10). Figs. 10A,B (at two different temporal scales) shows the predicted changes in neuronal firing dynamics when the Na+/K+ ATPase is impaired. Such an impairment predicts the depolarization of the resting state membrane potential (Fig. 10C) and is consistent with trends in our injected current findings (Fig. 6F). Furthermore, this modeled depolarization reduces the change in membrane potential required for an action potential. Consequently, the model predicts higher frequency oscillations (Fig. 10D), consistent with the observed increases in the number of evoked action potentials (Figs. 10B,C) and spontaneous neural activity (Fig. 7A,B). Finally, the model predicts that the Na+/K+ ATPase should act more slowly to recover ion gradients after an AP, causing the amplitude of subsequent APs to decline progressively with time (Figs. 10E,F). Such an amplitude decrease is consistent with the observed decrease in LTP under Indinavir (Fig. 1E) and with the trends in measured conduction velocity (Fig. 4). There was no corresponding trend in amplitude following Indinavir application (Fig. 7H,I), although we observed a highly significant increase in the decay times of the APs (Fig. 9K,L).
Figure 10: Impairments in Na+/K+ ATPase activity are predicted to have significant effects on neuronal dynamics.
A) Examples of simulated spike trains in response to stimulus lasting 1 s are shown overlaid at the two extremes of the investigated VATPasemax regime. B) Parts of the same two spike trains are shown with finer temporal resolution. C-F) Trends in resting membrane potential (C), firing frequency (D), peak potential of the first spike (E) and slope of the decline of peak membrane potential over subsequent spikes (F) are shown as a function of vATPasemax, with smaller values on the x axis representing declining ATPase activity.
4. Discussion
Central insulin resistance impairs cognitive performance and promotes hippocampal neurodegeneration and memory loss [51,52]. Recent experiments utilizing GLUT4 blockers in animal models expand our understanding of the GLUT4-insulin interactions in the brain [summarized in 10]. Our present results highlight the adverse effects of GLUT4 inhibition on synaptic function and LTP, in accord with findings that acute and chronic blockade of GLUT4 are detrimental to performance on hippocampal-mediated memory tasks, thus suggesting that GLUT4 is critical for acquisition and consolidation of memory [10,14]. Memory formation increases glucose flux into neurons by promoting translocation of the glucose-bound transporter across the membrane [14,53]. This process enables increased metabolic support during high demand, such as during cognitive challenges. Crucially, most GLUT4s localize in the perikaryon [54,55], likely in close proximity to axo-somatic synapses, which are associated with synaptic plasticity and long-term memory (LTM). Indeed, prolonged blockade of the GLUT4 glucose transporter in the brain results in impaired formation of LTM [14]. Decreased levels of hippocampal BDNF, which is a key factor in establishing LTM [56], support the notion of LTM impairments. Moreover, hypoglycemia negatively affects memory performance and cognition [57,58, however, see 14], a clinical result consistent with our mechanistic findings that insulin resistance impairs hippocampal neuronal functioning.
Chronic reduction in GLUT4-mediated glucose uptake increased the neuronal plasma membrane content of AMPA GluR1 subunits and elevated GLUT3 expression, suggesting a compensatory increase in transient synaptic excitability [14]. It is unclear, however, whether such an increase in synaptic activity is adaptive/beneficial or merely another detrimental outcome of hypoglycemia. In this study, we found that AIR increased the frequency of sEPSC events and increased their amplitudes, in line with the previously published data showing similar increases during food deprivation [48], but curiously not under inhibition of glycolysis [47] or ischemia [58]). However, the increased sEPSC frequency we observed is consistent with hypoglycemia driven Ca2+ accumulation at the presynapse, as occurs upon inhibition of glycolysis and during ischemia [47,59], although the frequency increase was much smaller in our study. The same studies suggest that presynaptic glycolysis is essential for maintaining synaptic transmission, even at a low frequency, and cannot be substituted by mitochondrial respiration. Glycolysis meets approximately one-third of the energy budget at presynaptic terminals to sustain low-frequency transmission, and its loss leads to decreased synaptic EPSC amplitudes, which are connected to slower, broader, and smaller presynaptic AP waveforms, and a depolarization of the resting membrane potential [48]; results which are consistent with ones we report. Our pharmacological manipulation with AIR is likely much less severe than ischemia or glycolysis inhibition. Interestingly, D-βHb + AIR treatment, which showed the same increase in the frequency of sEPSCs as with AIR alone, had the lowest amplitudes, implying a reduction in the quantal release of glutamate per vesicle. This result is consistent with reports of lowered conversion of glutamate to aspartate under ketosis [43,44]. The present modeling results highlight a mechanism for increased excitability, decreased CV, and slower AP decays through diminished Na+/K+ ATPase activity due to energy constraints [Fig. 6J–L]. Interestingly, there is a report of comparable findings in the mouse visual cortex, where dietary food restriction resulted in lower excitatory postsynaptic currents, increased input resistance, and depolarization of the resting membrane potential, all of which contributed to increased neuronal excitability, leading to broader orientation tuning, decreased coding precision, and impaired discrimination in visual tasks [48].
Although the results of our computational models are consistent with the observed changes in resting state membrane potential and firing frequency during AIR, there were seemingly contradicting results with respect to AP peak amplitude. Specifically, while we measured slightly increased AP overshoot amplitudes, our model predicted a decrease due to energy constraints. As such, we suppose that neurons may compensate for the energetic limitations induced by Indinavir by counter-regulating alternative properties, such as their membrane resistance, as reported in [48]. However, our model may not encompass all relevant processes, such as the effects of inhibitory synaptic inputs. Furthermore, we used the maximal Na+/K+ ATPase activity as a surrogate for ATP availability, and we relied on literature estimates of kinetic and thermodynamic rate constants. A more direct approach might consider ATP concentration as an input variable, were such experimental data available. Furthermore, ATP has an additional function as a potent signaling molecule, exerting diverse cellular effects beyond the scope of our current model. Furthermore, astrocytic pathways significantly influence neuronal dynamics across different metabolic states [60,61].
Another computational model aiming to establish the underlying causes of the diminished axonal conduction velocity during AIR implicated hyperpolarized resting membrane potential or decreased AP peak amplitude. However, our experimental measurements indicated opposing trends in both metrics, thus suggesting that neither of the two phenomena could account for the lower conduction velocity. This discrepancy might reflect exhaustion effects on the measured conduction velocities; an exhaustion phenomenon would likely result in decreased AP peak amplitude, which would predict declining conduction velocity according to our model. Alternatively, the inconsistency might reflect the simplistic nature of our model, which neglects complex ion dynamics, altered membrane permeability, synaptic processes, and a possible astrocytic contribution.
Inclusion of 0.1 or 1 mM D-βHb in the medium recovered some functions of the glucose-deprived hippocampal circuit. The ketogenic diet has served for decades to treat epilepsy and has an emerging wide range of therapeutic applications [34]. However, the mechanisms whereby a ketogenic diet may alleviate, for example, certain neurodegenerative disorders remain uncertain. Possible mechanisms include modulation of potassium channels, free fatty acid receptor 3 (FFAR3/GPR41) activation, promotion of GABA synthesis, and epigenetic modifications [62]. The action of D-βHb in modulating potassium flux across the neuronal membrane may be most relevant in the present context [63]. Indeed, the application of D-βHb modulates the activity of ATP-sensitive K+ channels (KATP), resulting in decreased neuronal firing rates [64,65]. Activation of KATP links neuronal metabolism with firing activity and can prevent picrotoxin-induced epileptiform activity in the hippocampus [66]. This effect of D-βHb seems due to reduced glycolysis rather than direct interaction with the channel [67]. However, this pathway may explain present findings that firing rates and membrane depolarization remained at control levels in the presence of 1 mM D-βHb plus Indinavir, despite an elevated Rm.
D-βHb exerts other neuroprotective effects via increased synthesis of GABA from intermediate metabolites; D-βHb is a precursor for the synthesis of glutamine, which promotes increased GABA levels, as seen in clinical epilepsy studies of the ketogenic diet [68]. D-βHb also directs glutamate towards GABA production by reducing the conversion of glutamate to aspartate [43,44]. In addition, D-βHb has a direct effect on the vesicular glutamate transporter VGLUT2, which plays a crucial role in hippocampal CA3-CA1 circuit, as shown by the impaired spatial learning and memory, along with reduced LTP and synaptic transmission, seen in conditional VGLUT2 knockout mice [69]. DβHb, along with acetoacetate and pyruvate, competes against Cl− at the Cl− binding site of the VGLUT2 and inhibits Cl− dependent glutamate uptake, although less potently than the endogenous KB acetoacetate [70]. Together with the increased formation of GABA and/or GABA derivatives, VGLUT2 inhibition reduces glutamate excitatory transmission. However, given the IC50 for the DβHb-VGLUT2 interaction (3.75 mM), we do not suppose that this was physiologically relevant in the present study [70].
The present results have important implications for the treatment of conditions such as type 2 diabetes, metabolic syndrome, and seizure disorders that involve insulin hyposensitivity. According to NIH estimates, ~40% of Americans today display symptoms of type 2 diabetes, a proportion expected to reach 50% by the end of this decade. Together with the longer average lifespans and demographic changes leading to an expansion in the aging population, obtaining insights into the outcomes of metabolic dysfunction and its potential treatment becomes a more pressing matter each day. Our results provide a unique insight into the potential use of KBs as an inexpensive and relatively risk-free treatment for metabolic disorders and insulin resistance. Medical researchers can use this information to discover new targets for treatment and develop therapies that are more effective. Further research in this area could inform novel treatment approaches that address the complex effects of metabolic disorders on brain health.
5. Materials and Methods
5.0. Mice
Breeding pairs of transgenic GAD2Cre/GCamp5gTdTomato, Thy1/GCamp6fTdTomato, and C57BL/6J mice were originally obtained from The Jackson Laboratory (stocks 010802, 024477, 024339) or Charles River Laboratories and bred in-house under standard conditions of 12-12 hours light-dark cycle, with food and water available ad libitum. The Institutional Animal Care and Use Committee approved all experiments. Mice of both sexes aged between 30 and 60 days (P30-P60) were used in all experiments.
5.1. Electrophysiology under native conditions – slice preparation.
Coronal brain slices containing the hippocampus were used in all recordings. Mice were deeply anesthetized with a mixture of isoflurane and air (3% v/v), decapitated, and their brains extracted and cut using a Leica VT1200S vibratome into 300 μm-thick slices in ice-cold ACSF solution containing (in mM): 230 sucrose, 1 KCl, 0.5 CaCl2, 10 MgSO4, NaHCO3, 1.25 NaH2PO4, 0.04 Na-ascorbate, and 10 glucose; 310 ± 5 mOsm, pH adjusted to 7.35 ± 5 with HCl, and, gassed with carbogen (95% O2, 5% CO2) for at least 30 min before use. The slices were then transferred to a Zbicz-type BSC-PC submerged slice chamber (Harvard Apparatus, USA) filled with artificial cerebrospinal fluid (ACSF) containing (in mM): 124 NaCl, 2.5 KCl, 2 CaCl2, 2 MgSO4, 26 NaHCO3, 1.25 NaH2PO4, 0.04 Na-ascorbate, and 10 glucose; 305 ± 5 mOsm/kg, pH adjusted to 7.35 ± 0.05 mOsm/kg, gassed with carbogen and prewarmed to 32 °C. The slices were allowed to recover in the warm ACSF for 15 min, whereupon the heating was switched off, and the slice preparation gradually cooled down to room temperature (RT; 23 ± 2 °C) over 45 min.
Following their recovery, individual slices were transferred to another BSC-PC chamber filled with gassed ACSF and a mixture of drugs (Indinavir 0.1 mM; Indinavir 0.1 mM and either 0.1 or 1 mM DβHb), where they were incubated for 60 ± 15 min. Next, the slices were transferred to a submerged recording chamber mounted on an upright microscope stage (E600FN, Nikon, Japan) equipped with infrared differential interference contrast (IR-DIC) filters. The slices were kept at RT and superfused continuously with gassed ACSF delivered by a peristaltic pump at a steady rate of ~2 ml/min.
5.2. Field potential recordings under native conditions.
Evoked field potential responses were triggered with an isolated pulse stimulator (Model 2100, AM Systems, Science Products, Germany) using a CBARC75 concentric bipolar electrode (FHC, USA) placed in the center of the junction between CA3 and CA1. The recording electrode was placed 300 ± 50 μm away for the recordings of CA1 FV and fEPSP. During the recordings of axonal conduction velocity (CV), the electrodes were 300 to 900 (± 50) μm apart, and up to 6 different sites were recorded. All stimulation paradigms were applied every 20 s as biphasic rectangular pulses of 240 μs total duration, 50 ± 5 V strength (~60 ± 10% of the maximum response size), and a between-stimuli frequency of 25 Hz (40 ms).
During non-CV recordings, three different types of stimulation were applied: two stimuli (“mild” stimulation), 20 stimuli (“taxing”), and 50 stimulus trains (“overtaxing”), repeated every 20 s for a total period of 20 min in each case. We consider the “mild” and “taxing” stimulations as two extremes mimicking physiological activation in CA3/CA1. The “overtaxing” stimulation is non-physiological and thus mimics pathological activation in the network. After each train stimulation, the slice was allowed to recover for 20 min under “mild” stimulation. The recording was discarded if the slice failed to recover FV / fEPSP to at least 50% of pre-train levels.
Recording pipettes were pulled from borosilicate glass capillaries (ID 0.86, OD 1.5, BF150-86-10, Sutter Instruments, USA) on a vertical PC-100 puller (Narishige, Japan) and filled with 6% NaCl (in H2O, 1.02 M). Only pipettes with a resistance of 0.2-1.0 MΩ were used. Recording pipettes were allowed to rest at the recording site for 10 min to equilibrate before the start of a recording. All recorded signals were acquired using a MultiClamp 700B amplifier (Molecular Devices, USA), Bessel-filtered at 2 kHz, and digitized at a sampling frequency of 10 kHz using an Axon Digidata 1440A digitizer (Molecular Devices, USA).
5.3. Whole-cell patch-clamp recordings under native conditions.
Pyramidal neurons of the hippocampal CA1 region were selected for recordings based on their general morphology (pyramidal shape) and position within the pyramidal layer. As an additional verification, recorded cells were screened for GAD2+-driven tdTomato fluorescence. Cells that displayed any level of tdTomato fluorescence were rejected.
Patch pipettes were pulled from borosilicate glass capillaries (BF150-86-10, Sutter Instruments, USA) on a vertical puller (PC100, Narishige, Japan). Pipettes had a resistance of 6–8 MΩ when filled with an internal solution containing (in mM): 136 K-gluconate, 4 Na2ATP, 2 MgCl2, 0.2 EGTA, 10 HEPES, 4 KCl, 7 di-triphospho-creatine, 0.3 Na3GTP; 280–290 ± 5 mOsm/kg, titrated to pH 7.3 ± 0.05 with KOH.
During recordings in voltage clamp (VC), cells were clamped at the holding potential (Vh) = −70 mV with a Multiclamp 700B amplifier (Molecular Devices, USA). This Vh was uncorrected for liquid junction potential before seal formation. All cells were compensated for pipette capacitance. During VC experiments, series resistance (Rs) was not compensated. During recordings in the current clamp (CC) mode, a holding current was applied to the cells to maintain membrane potential at Vh = −70 ± 2 mV. All cells were bridge-balanced at 50% of Rs. Cell capacitance was not compensated in either mode. Immediately after establishing the whole-cell configuration, the cell was kept in I = 0 mode to monitor the resting membrane potential (Vrest.) over a period of ~120 to 180 s. The average value of Vrest. over this period is reported as the Vrest..
During the recordings, every 5 to 10 min we applied a series of 10 square voltage steps of −10 mV to the cell held at Vh = −70 mV to monitor changes in the Rs. All whole-cell currents in response to voltage steps were 0.1 mM-pass filtered at 10 kHz with a Bessel filter and digitized at a sampling frequency of 20 kHz (Axon Digidata 1550B, Molecular Devices, USA). To be included in the final dataset, all recordings had to meet 3 criteria simultaneously: 1) Rs after any recorded protocol could not increase by more than 20% compared to the Rs pre-protocol; 2) Rs during any of the recorded protocols could not exceed 30 MΩ; 3) the offset drift by the end of the recordings could not be lower than ± 5 mV.
Spontaneous synaptic currents (sEPSC) were recorded in VC at Vh = −70 mV in a single, continuous sweep for 10 to 15 min, high-pass filtered at 2 kHz with a Bessel filter, and digitized with a sampling frequency of 10 kHz.
To establish the spiking threshold, each neuron was current-clamped at Vh ~ −70 ± 2 mV and subject to a ramp-shaped 200-500 pA current injection with a duration of 1s. The spike threshold was determined as the membrane potential (Vm) at which the first fully developed action potential (AP) was visible. Each ramp injection was repeated 10x, and the average Vm is reported as the spike threshold for the cell.
To establish the firing properties of recorded neurons, each neuron was current-clamped as described previously and subjected to a square-shaped series of current injections with 25pA Δ per step to a maximum of 500 pA, with each step having a duration of 1 s and inter-step interval (ISI) of 10 s. If necessary, the holding current was corrected during the protocol to maintain Vh at ~ −70 ± 3 mV. During analyses, only fully-formed APs that crossed the 0 mV threshold were included.
All data acquisition was performed using pCLAMP software (Molecular Devices, USA).
5.4. Whole-cell patch-clamp recordings under abolished AMPA/kainatergic and GABAergic inputs.
Acute coronal brain slices (300 μm thick) containing the hippocampus were prepared from male C57BL/6j mice (6 to 8 weeks old; Charles River). The brain was rapidly extracted and soaked in ice-cold (ice slush) oxygenated buffer (in mM): 98 N-methyl-D-glucamine (NMDG), 25 D-glucose, 30 NaHCO3, 20 HEPES, 5 Na-L-ascorbate, 2 thiourea, 2 ethyl pyruvate, 2.5 KCl, 1.25 NaH2PO4, 10 MgSO4, 0.5 CaCl2 and 12 N-acetyl-L-cysteine (adjusted to pH = 7.4) for cutting. Acute brain slices were prepared with a VT1200S vibratome (Leica Biosystems), with cutting parameters set to 0.08 mm/s speed and 1.2 mm vibration amplitude. 10 to 12 slices containing hippocampus were collected and left to recover for 10 minutes in a 32 °C NMDG solution in an interface chamber (Brain Slice Keeper 5, Scientific Systems Design). Slices were individually timed to ensure the precise timing of this step. Slices were then moved to a second interface chamber containing HEPES holding solution at RT containing (in mM): 90 NaCl, 25 D-glucose, 30 NaHCO3, 20 HEPES, 3.5 NaOH, 2 CaCl2, 2 MgSO4, 1.25 NaH2PO4, 2.5 KCl, 2 thiourea, 5 Na-L-ascorbate, and 5 ethyl pyruvate, and left to recover for an additional 50 minutes. The total time of recovery was at least 60 min after cutting.
Slices were transferred to a recording chamber continuously perfused with recording aCSF at a rate of 3-5 ml/min at RT. Whole-cell recordings were performed using a software-controlled MultiClamp 700B amplifier and a Digidata 1440A digitizer (Molecular Devices, USA). Recording pipettes were pulled from borosilicate glass capillaries (WPI) with a resistance of 3-6 MΩ and filled with an intracellular solution containing (in mM): 135 K-gluconate, 3 KCl, 3 MgCl2, 10 HEPES, 0.5 EGTA, 4 Na2ATP, 0.3 Na3GTP, 10 Na-phosphocreatine, pH adjusted to 7.3 with 1M KOH and osmolarity adjusted to ~290 ± 5 mOsm. Slices were visualized with infrared optics using an upright microscope equipped with differential interference contrast (IR-DIC) using a 4x objective. Pyramidal neurons and fast-spiking interneurons (FSI) in the CA1 region were visualized with a 60x immersion objective and identified by their morphology and electrophysiological properties (i.e., presence of the voltage “sag” with hyperpolarizing current step injections and specific pattern of AP firing with depolarizing current step injections, in current-clamp).
Slices were incubated in parallel with aCSF in 0.1% DMSO (Control), 0.1 mM Indinavir, or with 0.1 mM Indinavir + 1mM D-βHb at least 45 minutes before the recordings, which were made directly in the patch chamber for a period never exceeding 3 hours, with inclusion of additional synaptic blockers, namely 10 μM NBQX and 10 μM gabazine, which were also present in the aCSF throughout the recording. A maximum of 4 neurons per slice were recorded. Mean incubation times were 93 -min for Control and 95 min for Indinavir groups.
After a short period of stabilization (3 minutes) in whole-cell configuration, neurons were recorded without any current injection (the holding was not set within a specific range) in current-clamp mode. The protocol for pyramidal neurons consisted of 3-second sweeps with 1-second pulses of from −20 to 100 pA in steps of 20, and then to 500 pA in steps of 50. For fast-spiking interneurons we used 3-second sweeps with 1-second pulses from −20 to 100 pA in steps of twenty, 500 pA in steps of 50, and then to 800 pA in steps of 100. Each group of pulses was separated by 15 seconds, and with averaging of 3 consecutive runs
All data acquisition was performed using pCLAMP software (Molecular Devices, USA).
5.5. Field potential recordings – analyses.
During field potential recordings, the biologically relevant signals are superimposed onto the decaying stimulation artifact. To isolate the stimulation artifacts for subtraction from the total signal at the end of each recording, we applied 1 μM TTX to the slice. After the drug had abolished all responses to stimulation, 30 repetitions of each stimulation paradigm were recorded in the presence of TTX.
All recorded traces were analyzed in IgorPro (Wavemetrics, USA). First, an average of the traces recorded in the presence of TTX was subtracted from each trace containing the biologically relevant signals. The traces were then filtered using a rolling five-point average to remove noise, and the baseline was adjusted to the 1 s period before the application of stimuli. Next, the amplitudes and latencies of FVs and fEPSPs were measured at their peaks relative to the start of the preceding stimulus. Amplitudes were measured against 0 mV baselines, while latencies were measured against the onset of the stimulation. During high-frequency stimulation, cells often do not have sufficient time to fully recover their membrane potentials before the next stimulus is applied. This leads to a gradual shift in the baseline. To correct for this effect, we subtracted the median value at +35 to +40 ms after each stimulus (where the exponentially recovering baseline is mostly linear) from each FV or fEPSP peak amplitude. The width of a FV is determined as a time difference between the FV start (peak of the first positive deflection) and FV end (peak of the second positive deflection). To calculate the FV area, first we subtracted from each data point values corresponding to a line interpolated between the FV start and end. After the correction, the area under the curve is measured in arbitrary units (AU).
All traces were screened for occasional electrical interference and the affected data points were manually removed from the analysis.
To measure axonal conduction velocity (CV), we calculated the time shift (Δt ms) between the stimulus start and the time of the FV peak. Next, the linear distance between the recording site and the stimulation electrode was divided by the measured Δt We recorded CV at 3-6 sites over a span of 300-900 μm, with ~150 μm steps between sites. Each CV recording site served as a replicate for statistical analysis (see Statistics). During CV recording, stimulation remained stationary, and the sites were recorded in randomized order, always starting and ending at 300 μm.
To investigate whether there were any additional changes in CV during or after the train stimulation, the Δt of each recorded FV in a single slice subject to train stimulation was calculated in the same manner described above for CV measurements. Afterward, the median Δt at stimulus 1-3 of traces 1-2 ΔtN) was used as a normalizing value and was subtracted from each Δt. Finally, we calculated a group matrix of normalized, averaged Δt and saved it as a text file for visualization (see below).
5.6. Field potential recordings – data visualization.
For constructing “heatmap” visualizations of the data, numerical matrices of FV or fEPSP amplitude means were built for each of the four slice treatment groups. Every matrix consisted of amplitudes recorded during the stimulation period and responses to each subsequent train in a new row. Then, two additional columns were added at the end as a color normalization in the heatmap (0, 1 mV), and the matrix was saved as a text file. Afterward, the text files were imported to ImageJ (NIH, USA) as text images, converted from 32- to 16-bit, and saved as TIFF images, which were then imported to IgorPro (Wavemetrics, USA), whereupon their look-up table (LUT) was changed from “Grays” to “Spectrum.”
The heat maps for time delays during train stimulation were generated similarly but using different normalizations: 20 pulse train recordings had normalization boundaries of −1 and +1 ms.
5.7. Whole-cell patch-clamp – sEPSC analyses.
sEPSCs detection was automatized using a convolution-based algorithm in Fbrain 3.03 [71], a customized program running under IgorPro 6 (WaveMetrics, Lake Oswego, USA), kindly provided by the Peter Jonas Lab (IST, Klosterneuburg, Austria). Recorded traces were smoothed by subtracting a 20-term polynomial fitted to the trace and digital lowpass (10 Hz) and Notch (50 ± 0.5 Hz) filtered in FBrain before the analysis. The trace subject to convolution was passed through a digital band-pass filter at 0.001 to 200 Hz. The event detection template had a rise-time time constant (tau) τ = 1.5 ms, a decay tau, τ = 6 ms, and an amplitude of −10 pA. The event detection threshold (θ) was set to 4.2 times the standard deviation of a Gaussian function fitted to the all-point histogram of the convolved trace. All events detected by the algorithm were inspected visually. Those that clearly did not show fast rise time and exponential decay kinetics of a typical hippocampal EPSC were removed by hand. Only cells with a rejection ratio higher than 20% were included in the analysis. The analysis was performed using custom-written macros kindly provided by Dr. Maria Kukley (Achucarro Basque Center for Neuroscience, Bilbao, Spain).
Afterwards, individual sEPSC waveforms were extracted from the trace. Each waveform consisted of a 5 ms segment of the trace before the onset of the sEPSC and a 50 ms piece after the onset to capture the full decay of the waveform. Before averaging, all sEPSCs were baseline-adjusted to the pre-onset 5 ms. The peak amplitude, 20-80% onset-to-peak rise time, and decay constant τ were measured for the averaged sEPSC. The decay constant τ was calculated as the monoexponential fit from the peak to the final 50 ms of the averaged waveform.
To avoid selection bias during sEPSC extraction, we repeated the Fbrain analysis at least twice in each cell and averaged the results.
5.8. Multi-Gaussian fitting
To create histograms of sEPSC amplitudes, we measured the amplitudes of at the peak in each individual waveform using the custom-written macros in 5.7. Afterwards, we created histograms of the amplitudes with Igor’s build-in Histogram function by binning the amplitudes into 200 of 0.5 pA bins, ranging from −100 to 0 pA. In the next step, the histograms were imported into the Multipeak Fitting 2.16 build-in Igor package. We started the analysis by using the “Auto-locate Peaks Now” option, which utilizes an automatic peak-finding algorithm searching for peaks by finding maxima in the smoothed second derivative of the data. The algorithm automatically estimates the noise level in the data and an optimal smoothing factor. If the initial guess appeared correct, the data were fitted with the multi-Gaussians suggested by the software. If the fits appeared erroneous, the smoothing factor, widths, and locations of Gaussian peaks were corrected manually until the best possible fit was achieved. If no corrections provided a good fit, the distributions were fitted by a single Gaussian to capture the largest peak.
5.9. Statistics.
All data acquisitions were made in randomized sequence, with a maximum of 2 slices (field potential recordings) or 2 cells (patch clamp recordings) from a single animal per experimental condition to avoid pseudoreplication. All experimental groups had comparable distributions of ages (close to P50 ± 6) and sex. The order of slice pre-incubation with drugs was randomized for each animal. The numbers of slices or cells and animals used in each experiment are indicated in the figure legends.
Statistical analysis was performed using GraphPad Prism 9.5.1 (GraphPad Software, USA). Significant outliers were removed with the Prism ROUT method at Q = 5%, and the normality of residuals and homoscedasticity were tested for each comparison. If the datasets had normal residuals and equal variances, we used ordinary one-way ANOVA with post hoc Holm-Šídak’s test. If the datasets had normal residuals but unequal variances, we used Brown-Forsythe ANOVA with post hoc Dunnett’s T3 test. If the datasets were not normally distributed but had equal variances, we used Kruskal-Wallis ANOVA with post hoc Dunn’s test. In rare cases where the data was neither normally distributed nor had equal variance, we applied the Brown-Forsythe ANOVA with post hoc Dunnett’s T3 test. If the combined sample size exceeded n=50, only one-way ANOVA or Brown-Forsythe ANOVA were used. If the dataset consisted of multiple replicates (as in Fig. 3), we used nested one-way ANOVA with post hoc Holm-Šídak’s test. The tested groups and p values are indicated in the text and the figure legends. Individual cells or slices are labeled as n, replicates are labeled as m, and the numbers animals used are labeled as N. If the groups tested as being different, we report the p-values of post hoc tests, but omit the p-value of the omnibus test. If the groups did not test as differing, only the p-value of an omnibus test is reported. For scatter plots, each point represents an individual data point (cell, slice or replicate), and the horizontal bars represent the group mean ± SEM. In all other graphs, we present mean ± SEM. The heat maps represent the group means.
5.10. Power and sample size calculations.
The sample sizes for all statistical comparisons in this work were determined based on the means and pooled standard deviations from preliminary recordings of 8-10 cells or slices per group, α = 0.05, β = 0.8, corrected for the number of pairwise comparisons (τ), based on the following equations:
Where n is the sample size, σ is standard deviation, φ is standard normal distribution function, α is Type I error rate, τ is the number of pairwise comparisons, and β is Type II error rate. During the calculations, the normality of residuals and equality of variances were assumed a priori.
All of the calculations were performed in an online calculator available at: http://powerandsamplesize.com/Calculators/Compare-k-Means/1-Way-ANOVA-Pairwise
5.11. Hodgkin-Huxley model
Our computational simulations investigating the effects of declined Na+/K+ ATPase activity utilized a model primarily based on a previously validated CA1 neuron model [72]. This model builds upon the original Hodgkin-Huxley model, but entails greater specificity to various voltage gated ion channels, including separate Ca2+, Na+, and various types of K+ channels. We combined this framework with additional components specific to the Na+/K+ ATPase, which were adapted from [73]. These additions involved kinetic equations for concentrations and reversal potentials specific to Na+ and K+, and a dependence on ATPase activity. To investigate the effects of different rates of the Na+/K+ ATPase, we toggled the kinetic parameter vATPasemax between 10 μA/cm2 and 100 μA/cm2 in increments of 10 μA/cm2. vATPasemax determines Na+/K+ ATPase activity in the following manner:
Where , are ion concentrations that vary over time, and , are Michaelis-Menten constants. The extension with pump dynamics necessitated a volume and a surface to be specified for the CA1 neuron. Our modeled neuron had a volume of 2000 μm3 [74], and assuming a smooth spherical surface, an active surface area of 800 μm2. Temperature was set at 24.5 °C to closely match experimental conditions. During each simulation, the neuron was left at rest for 1 s to reach equilibrium and then stimulated for 1 s at 3.125 μA/cm2, equivalent to 250 pA. The model was implemented in the Julia programming language and simulated with the DifferentialEquiations.jl library (https://github.com/SciML/DifferentialEquations.jl).
To evaluate the effects of diminished Na+/K+ ATPase activity, we extracted multiple features from the simulated spike trains. Resting state potential (mV) was quantified as the membrane potential at 1 s, immediately before stimulation. Firing frequency (Hz) was calculated by dividing the number of APs with the time duration between the first and last evoked spike. Peak membrane potential (mV) was taken from the first action potential of the spike train. Lastly, we quantified the rate of exhaustion during a spike train by fitting a linear model to the progression of peak potentials over the index number of the corresponding action potential. The slope of the fitted line was extracted and labeled as the slope of the peak.
All relevant code is available on github, where one can find all equations and parameters. The code can also be used to reproduce all results: https://github.com/lcneuro/iAIR_models.
5.12. Model of conduction velocity
Here we model how AP shape affects the conduction velocity (CV) along an unmyelinated axon. We model an infinitesimally small unit of the axon consisting of three distinct units in a row, separated by a space h. The first and last of these units are kept “fixed” at voltages (the peak membrane potential) and , respectively; this potential difference leads to a voltage flow across the axon which is generally described by the cable equation [75]:
Once the intermediate unit is excited above a threshold voltage , the unit activates and is self-excited up to a voltage . This process then repeats ad infinitum along the entirety of the axon (assuming no backflow of the charge). The conduction velocity (i.e. the rate of this voltage flow) is thus inversely proportional to the reset time (the first time when , with as well). Over the discrete lattice above, the cable equation is given by:
Solving this for and substituting in the boundary conditions, we find:
where K is an integration constant needed to satisfy the initial condition . Substituting in the initial condition and solving for , we find:
Thus
However, h is an arbitrarily small spacing that we can take to approach zero. Thus:
Supplementary Material
7. Acknowledgments
We thank Dr. Vittorio Gallo (Children’s National Research Institute, USA) for sharing his electrophysiology setup, without which this work would not have been possible; Dr. Kieran Clarke (University of Oxford) for providing D-βHb ester and advice; Dr. Joseph Abbah (Children’s National Research Institute, USA) for help during the preliminary stage of the research; Dr. Richard L. Veech and Dr. M. Todd King (Lab of Metabolic Control, NIH/NIAAA, USA) for providing D-βHb ester and advice; Dr. Ting-Jiun Chen (Mt. Sinai Medical Center, USA) for help and advice with setting up patch clamp recordings; Dr. Peter Jonas (Institute of Science and Technology Austria, Austria) for providing FBrain software; Dr Fernando Fernandez (Boston University, USA) for comments to the first draft of the manuscript; Dr Paul Hruz (Washington University School of Medicine in St. Louis, USA) for help with establishing the GluT4 inhibition model; Dr Nandkishore Prakash and Dave Saxon (Children’s National Research Institute, USA) for advice and discussions; Dr Heidi Matos Galicia (National Institute of Neurological Disorders and Stroke, USA) for advice; Dr. Paul Cumming (Bern University Hospital) for critical reading of the manuscript; and members of the Mujica-Parodi laboratory (LCNeuro, USA) for discussions; C.W. also acknowledges support from the Marie-Josée Kravis Fellowship in Quantitative Biology.
8. Funding
This work was supported by the National Institutes of Health Grant K01NS110981 to N.A.S., the National Science Foundation NSF1926781 to L.M.P. and N.A.S., and the Department of Defense ARO W91NF2010189 to N.A.S.
Footnotes
Competing Interests
All authors declare no competing interest.
11. Data and materials availability
Raw data presented in this work, data tables with analyses and tables with statistics are available upon request. All code is available on GitHub, by following the links provided in the text.
6. References
- 1.de la Monte SM. Insulin Resistance and Neurodegeneration: Progress Towards the Development of New Therapeutics for Alzheimer’s Disease. Drugs. 2017;77(1):47–65. doi: 10.1007/s40265-016-0674-0 [DOI] [PMC free article] [PubMed] [Google Scholar]
- 2.De Felice FG, Ferreira ST. Inflammation, defective insulin signaling, and mitochondrial dysfunction as common molecular denominators connecting type 2 diabetes to Alzheimer disease. Diabetes. 2014;63(7):2262–2272. doi: 10.2337/db13-1954 [DOI] [PubMed] [Google Scholar]
- 3.McNay EC, Recknagel AK. Brain insulin signaling: a key component of cognitive processes and a potential basis for cognitive impairment in type 2 diabetes. Neurobiol Learn Mem. 2011;96(3):432–442. doi: 10.1016/j.nlm.2011.08.005 [DOI] [PMC free article] [PubMed] [Google Scholar]
- 4.Zhao WQ, Chen H, Quon MJ, Alkon DL. Insulin and the insulin receptor in experimental models of learning and memory. Eur J Pharmacol. 2004;490(1–3):71–81. doi: 10.1016/j.ejphar.2004.02.045 [DOI] [PubMed] [Google Scholar]
- 5.Craft S. Insulin resistance syndrome and Alzheimer’s disease: age- and obesity-related effects on memory, amyloid, and inflammation. Neurobiol Aging. 2005;26 Suppl 1:65–69. doi: 10.1016/j.neurobiolaging.2005.08.021 [DOI] [PubMed] [Google Scholar]
- 6.Kerti L, Witte AV, Winkler A, Grittner U, Rujescu D, Floel A. Higher glucose levels associated with lower memory and reduced hippocampal microstructure. Neurology. 2013;81(20):1746–1752. doi: 10.1212/01.wnl.0000435561.00234.ee [DOI] [PubMed] [Google Scholar]
- 7.McNay EC, Recknagel AK. Brain insulin signaling: a key component of cognitive processes and a potential basis for cognitive impairment in type 2 diabetes. Neurobiol Learn Mem. 2011;96(3):432–442. doi: 10.1016/j.nlm.2011.08.005 [DOI] [PMC free article] [PubMed] [Google Scholar]
- 8.Ghasemi R, Haeri A, Dargahi L, Mohamed Z, Ahmadiani A. Insulin in the brain: sources, localization and functions. Mol Neurobiol. 2013;47(1):145–171. doi: 10.1007/s12035-012-8339-9 [DOI] [PubMed] [Google Scholar]
- 9.Kuwabara T, Kagalwala MN, Onuma Y, et al. Insulin biosynthesis in neuronal progenitors derived from adult hippocampus and the olfactory bulb. EMBO Mol Med. 2011;3(12):742–754. doi: 10.1002/emmm.201100177 [DOI] [PMC free article] [PubMed] [Google Scholar]
- 10.McNay EC, Pearson-Leary J. GluT4: A central player in hippocampal memory and brain insulin resistance. Exp Neurol. 2020;323:113076. doi: 10.1016/j.expneurol.2019.113076 [DOI] [PMC free article] [PubMed] [Google Scholar]
- 11.Cunnane S, Nugent S, Roy M, et al. Brain fuel metabolism, aging, and Alzheimer’s disease. Nutrition. 2011;27(1):3–20. doi: 10.1016/j.nut.2010.07.021 [DOI] [PMC free article] [PubMed] [Google Scholar]
- 12.Antal B, McMahon LP, Sultan SF, et al. Type 2 diabetes mellitus accelerates brain aging and cognitive decline: Complementary findings from UK Biobank and meta-analyses. Elife. 2022;11:e73138. Published 2022. May 24. doi: 10.7554/eLife.73138 [DOI] [PMC free article] [PubMed] [Google Scholar]
- 13.McEwen BS, Reagan LP. Glucose transporter expression in the central nervous system: relationship to synaptic function. Eur J Pharmacol. 2004;490(1–3):13–24. doi: 10.1016/j.ejphar.2004.02.041 [DOI] [PubMed] [Google Scholar]
- 14.Pearson-Leary J, McNay EC. Novel Roles for the Insulin-Regulated Glucose Transporter-4 in Hippocampally Dependent Memory. J Neurosci. 2016;36(47):11851–11864. doi: 10.1523/JNEUROSCI.1700-16.2016 [DOI] [PMC free article] [PubMed] [Google Scholar]
- 15.McNay EC, Fries TM, Gold PE. Decreases in rat extracellular hippocampal glucose concentration associated with cognitive demand during a spatial task. Proc Natl Acad Sci U S A. 2000;97(6):2881–2885. doi: 10.1073/pnas.050583697 [DOI] [PMC free article] [PubMed] [Google Scholar]
- 16.Grillo CA, Piroli GG, Hendry RM, Reagan LP. Insulin-stimulated translocation of GLUT4 to the plasma membrane in rat hippocampus is PI3-kinase dependent. Brain Res. 2009;1296:35–45. doi: 10.1016/j.brainres.2009.08.005 [DOI] [PMC free article] [PubMed] [Google Scholar]
- 17.Stranahan AM, Norman ED, Lee K, et al. Diet-induced insulin resistance impairs hippocampal synaptic plasticity and cognition in middle-aged rats. Hippocampus. 2008;18(11):1085–1088. doi: 10.1002/hipo.20470 [DOI] [PMC free article] [PubMed] [Google Scholar]
- 18.Ashrafi G, Wu Z, Farrell RJ, Ryan TA. GLUT4 Mobilization Supports Energetic Demands of Active Synapses. Neuron. 2017;93(3):606–615.e3. doi: 10.1016/j.neuron.2016.12.020 [DOI] [PMC free article] [PubMed] [Google Scholar]
- 19.De Felice FG, Ferreira ST. Inflammation, defective insulin signaling, and mitochondrial dysfunction as common molecular denominators connecting type 2 diabetes to Alzheimer disease. Diabetes. 2014;63(7):2262–2272. doi: 10.2337/db13-1954 [DOI] [PubMed] [Google Scholar]
- 20.Kothari V, Luo Y, Tornabene T, et al. High fat diet induces brain insulin resistance and cognitive impairment in mice. Biochim Biophys Acta Mol Basis Dis. 2017;1863(2):499–508. doi: 10.1016/j.bbadis.2016.10.006 [DOI] [PubMed] [Google Scholar]
- 21.Martínez-François JR, Fernández-Agüera MC, Nathwani N, et al. BAD and KATP channels regulate neuron excitability and epileptiform activity. Elife. 2018;7:e32721. Published 2018. Jan 25. doi: 10.7554/eLife.32721 [DOI] [PMC free article] [PubMed] [Google Scholar]
- 22.Kashiwaya Y, Takeshima T, Mori N, Nakashima K, Clarke K, Veech RL. D-beta-hydroxybutyrate protects neurons in models of Alzheimer’s and Parkinson’s disease. Proc Natl Acad Sci U S A. 2000;97(10):5440–5444. doi: 10.1073/pnas.97.10.5440 [DOI] [PMC free article] [PubMed] [Google Scholar]
- 23.Chikahisa S, Shimizu N, Shiuchi T, Séi H. Ketone body metabolism and sleep homeostasis in mice. Neuropharmacology. 2014;79:399–404. doi: 10.1016/j.neuropharm.2013.12.009 [DOI] [PubMed] [Google Scholar]
- 24.Aalling NN, Nedergaard M, DiNuzzo M. Cerebral Metabolic Changes During Sleep. Curr Neurol Neurosci Rep. 2018;18(9):57. Published 2018. Jul 16. doi: 10.1007/s11910-018-0868-9 [DOI] [PMC free article] [PubMed] [Google Scholar]
- 25.Puchalska P, Crawford PA. Multi-dimensional Roles of Ketone Bodies in Fuel Metabolism, Signaling, and Therapeutics. Cell Metab. 2017;25(2):262–284. doi: 10.1016/j.cmet.2016.12.022 [DOI] [PMC free article] [PubMed] [Google Scholar]
- 26.Ma W, Berg J, Yellen G. Ketogenic diet metabolites reduce firing in central neurons by opening K(ATP) channels. J Neurosci. 2007;27(14):3618–3625. doi: 10.1523/JNEUROSCI.0132-07.2007 [DOI] [PMC free article] [PubMed] [Google Scholar]
- 27.Jensen NJ, Wodschow HZ, Nilsson M, Rungby J. Effects of Ketone Bodies on Brain Metabolism and Function in Neurodegenerative Diseases. Int J Mol Sci. 2020;21(22):8767. Published 2020. Nov 20. doi: 10.3390/ijms21228767 [DOI] [PMC free article] [PubMed] [Google Scholar]
- 28.Hartman AL, Gasior M, Vining EP, Rogawski MA. The neuropharmacology of the ketogenic diet. Pediatr Neurol. 2007;36(5):281–292. doi: 10.1016/j.pediatrneurol.2007.02.008 [DOI] [PMC free article] [PubMed] [Google Scholar]
- 29.Yudkoff M, Daikhin Y, Horyn O, Nissim I, Nissim I. Ketosis and brain handling of glutamate, glutamine, and GABA. Epilepsia. 2008;49 Suppl 8(Suppl 8):73–75. doi: 10.1111/j.1528-1167.2008.01841.x [DOI] [PMC free article] [PubMed] [Google Scholar]
- 30.Xin L, Ipek Ö, Beaumont M, et al. Nutritional Ketosis Increases NAD+/NADH Ratio in Healthy Human Brain: An in Vivo Study by 31P-MRS. Front Nutr. 2018;5:62. Published 2018. Jul 12. doi: 10.3389/fnut.2018.00062 [DOI] [PMC free article] [PubMed] [Google Scholar]
- 31.Maalouf M, Sullivan PG, Davis L, Kim DY, Rho JM. Ketones inhibit mitochondrial production of reactive oxygen species production following glutamate excitotoxicity by increasing NADH oxidation. Neuroscience. 2007;145(1):256–264. doi: 10.1016/j.neuroscience.2006.11.06 [DOI] [PMC free article] [PubMed] [Google Scholar]
- 32.Shimazu T, Hirschey MD, Newman J, et al. Suppression of oxidative stress by β-hydroxybutyrate, an endogenous histone deacetylase inhibitor. Science. 2013;339(6116):211–214. doi: 10.1126/science.1227166 [DOI] [PMC free article] [PubMed] [Google Scholar]
- 33.Lutas A, Yellen G. The ketogenic diet: metabolic influences on brain excitability and epilepsy. Trends Neurosci. 2013;36(1):32–40. doi: 10.1016/j.tins.2012.11.005 [DOI] [PMC free article] [PubMed] [Google Scholar]
- 34.Poff AM, Moss S, Soliven M, D’Agostino DP. Ketone Supplementation: Meeting the Needs of the Brain in an Energy Crisis. Front Nutr. 2021;8:783659. Published 2021. Dec 23. doi: 10.3389/fnut.2021.783659 [DOI] [PMC free article] [PubMed] [Google Scholar]
- 35.Clarke K, Tchabanenko K, Pawlosky R, et al. Kinetics, safety and tolerability of (R)-3-hydroxybutyl (R)-3-hydroxybutyrate in healthy adult subjects. Regul Toxicol Pharmacol. 2012;63(3):401–408. doi: 10.1016/j.yrtph.2012.04.008 [DOI] [PMC free article] [PubMed] [Google Scholar]
- 36.Kesl SL, Poff AM, Ward NP, et al. Effects of exogenous ketone supplementation on blood ketone, glucose, triglyceride, and lipoprotein levels in Sprague-Dawley rats. Nutr Metab (Lond). 2016;13:9. Published 2016. Feb 4. doi: 10.1186/s12986-016-0069-y [DOI] [PMC free article] [PubMed] [Google Scholar]
- 37.Weistuch C, Mujica-Parodi LR, Razban RM, et al. Metabolism modulates network synchrony in the aging brain. Proc Natl Acad Sci U S A. 2021;118(40):e2025727118. doi: 10.1073/pnas.2025727118 [DOI] [PMC free article] [PubMed] [Google Scholar]
- 38.Mujica-Parodi LR, Amgalan A, Sultan SF, et al. Diet modulates brain network stability, a biomarker for brain aging, in young adults. Proc Natl Acad Sci U S A. 2020;117(11):6170–6177. doi: 10.1073/pnas.1913042117 [DOI] [PMC free article] [PubMed] [Google Scholar]
- 39.Hruz PW, Murata H, Qiu H, Mueckler M. Indinavir induces acute and reversible peripheral insulin resistance in rats. Diabetes. 2002;51(4):937–942. doi: 10.2337/diabetes.51.4.937 [DOI] [PubMed] [Google Scholar]
- 40.Hresko RC, Hruz PW. HIV protease inhibitors act as competitive inhibitors of the cytoplasmic glucose binding site of GLUTs with differing affinities for GLUT1 and GLUT4. PLoS One. 2011;6(9):e25237. doi: 10.1371/journal.pone.0025237 [DOI] [PMC free article] [PubMed] [Google Scholar]
- 41.Colgin LL, Denninger T, Fyhn M, et al. Frequency of gamma oscillations routes flow of information in the hippocampus. Nature. 2009;462(7271):353–357. doi: 10.1038/nature08573 [DOI] [PubMed] [Google Scholar]
- 42.Buzsáki G, Wang XJ. Mechanisms of gamma oscillations. Annu Rev Neurosci. 2012;35:203–225. doi: 10.1146/annurev-neuro-062111-150444 [DOI] [PMC free article] [PubMed] [Google Scholar]
- 43.Newman JC, Verdin E. β-Hydroxybutyrate: A Signaling Metabolite. Annu Rev Nutr. 2017;37:51–76. doi: 10.1146/annurev-nutr-071816-064916 [DOI] [PMC free article] [PubMed] [Google Scholar]
- 44.Lund TM, Obel LF, Risa Ø, Sonnewald U. β-Hydroxybutyrate is the preferred substrate for GABA and glutamate synthesis while glucose is indispensable during depolarization in cultured GABAergic neurons. Neurochem Int. 2011;59(2):309–318. doi: 10.1016/j.neuint.2011.06.002 [DOI] [PubMed] [Google Scholar]
- 45.Catterall WA. From ionic currents to molecular mechanisms: the structure and function of voltage-gated sodium channels. Neuron. 2000;26(1):13–25. doi: 10.1016/s0896-6273(00)81133-2 [DOI] [PubMed] [Google Scholar]
- 46.Howarth C, Gleeson P, Attwell D. Updated energy budgets for neural computation in the neocortex and cerebellum. J Cereb Blood Flow Metab. 2012;32(7):1222–1232. doi: 10.1038/jcbfm.2012.35 [DOI] [PMC free article] [PubMed] [Google Scholar]
- 47.Lujan B, Kushmerick C, Banerjee TD, Dagda RK, Renden R. Glycolysis selectively shapes the presynaptic action potential waveform. J Neurophysiol. 2016;116(6):2523–2540. doi: 10.1152/jn.00629.2016 [DOI] [PMC free article] [PubMed] [Google Scholar]
- 48.Padamsey Z, Katsanevaki D, Dupuy N, Rochefort NL. Neocortex saves energy by reducing coding precision during food scarcity. Neuron. 2022;110(2):280–296.e10. doi: 10.1016/j.neuron.2021.10.024 [DOI] [PMC free article] [PubMed] [Google Scholar]
- 49.Jensen TP, Zheng K, Cole N, Marvin JS, Looger LL, Rusakov DA. Multiplex imaging relates quantal glutamate release to presynaptic Ca2+ homeostasis at multiple synapses in situ. Nat Commun. 2019;10(1):1414. Published 2019. Mar 29. doi: 10.1038/s41467-019-09216-8 [DOI] [PMC free article] [PubMed] [Google Scholar]
- 50.Scott RS, Henneberger C, Padmashri R, Anders S, Jensen TP, Rusakov DA. Neuronal adaptation involves rapid expansion of the action potential initiation site. Nat Commun. 2014;5:3817. Published 2014. May 23. doi: 10.1038/ncomms4817 [DOI] [PMC free article] [PubMed] [Google Scholar]
- 51.Stranahan AM, Mattson MP. Impact of energy intake and expenditure on neuronal plasticity. Neuromolecular Med. 2008;10(4):209–218. doi: 10.1007/s12017-008-8043-0 [DOI] [PMC free article] [PubMed] [Google Scholar]
- 52.Piroli GG, Grillo CA, Reznikov LR, et al. Corticosterone impairs insulin-stimulated translocation of GLUT4 in the rat hippocampus. Neuroendocrinology. 2007;85(2):71–80. doi: 10.1159/000101694 [DOI] [PubMed] [Google Scholar]
- 53.Grillo CA, Piroli GG, Hendry RM, Reagan LP. Insulin-stimulated translocation of GLUT4 to the plasma membrane in rat hippocampus is PI3-kinase dependent. Brain Res. 2009;1296:35–45. doi: 10.1016/j.brainres.2009.08.005 [DOI] [PMC free article] [PubMed] [Google Scholar]
- 54.Leloup C, Arluison M, Kassis N, et al. Discrete brain areas express the insulin-responsive glucose transporter GLUT4. Brain Res Mol Brain Res. 1996;38(1):45–53. doi: 10.1016/0169-328x(95)00306-d [DOI] [PubMed] [Google Scholar]
- 55.Vannucci SJ, Koehler-Stec EM, Li K, Reynolds TH, Clark R, Simpson IA. GLUT4 glucose transporter expression in rodent brain: effect of diabetes. Brain Res. 1998;797(1 ):1–11. doi: 10.1016/s0006-8993(98)00103-6 [DOI] [PubMed] [Google Scholar]
- 56.Miranda M, Morici JF, Zanoni MB, Bekinschtein P. Brain-Derived Neurotrophic Factor: A Key Molecule for Memory in the Healthy and the Pathological Brain. Front Cell Neurosci. 2019;13:363. Published 2019. Aug 7. doi: 10.3389/fncel.2019.00363 [DOI] [PMC free article] [PubMed] [Google Scholar]
- 57.Won SJ, Yoo BH, Kauppinen TM, et al. Recurrent/moderate hypoglycemia induces hippocampal dendritic injury, microglial activation, and cognitive impairment in diabetic rats. J Neuroinflammation. 2012;9:182. Published 2012. Jul 25. doi: 10.1186/1742-2094-9-182 [DOI] [PMC free article] [PubMed] [Google Scholar]
- 58.Yamada KA, Rensing N, Izumi Y, et al. Repetitive hypoglycemia in young rats impairs hippocampal long-term potentiation. Pediatr Res. 2004;55(3):372–379. doi: 10.1203/01.PDR.0000110523.07240.C [DOI] [PubMed] [Google Scholar]
- 59.Lee SY, Kim JH. Mechanisms underlying presynaptic Ca2+ transient and vesicular glutamate release at a CNS nerve terminal during in vitro ischaemia. J Physiol. 2015;593(13):2793–2806. doi: 10.1113/JP270060 [DOI] [PMC free article] [PubMed] [Google Scholar]
- 60.De Pittà M, & Berry H (Eds.). Computational Glioscience. Springer Series in Computational Neuroscience. 2019; doi: 10.1007/978-3-030-00817-8 [DOI] [Google Scholar]
- 61.Allaman I, Bélanger M, Magistretti PJ. Astrocyte-neuron metabolic relationships: for better and for worse. Trends Neurosci. 2011;34(2):76–87. doi: 10.1016/j.tins.2010.12.001 [DOI] [PubMed] [Google Scholar]
- 62.García-Rodríguez D, Giménez-Cassina A. Ketone Bodies in the Brain Beyond Fuel Metabolism: From Excitability to Gene Expression and Cell Signaling. Front Mol Neurosci. 2021;14:732120. Published 2021. Aug 27. doi: 10.3389/fnmol.2021.732120 [DOI] [PMC free article] [PubMed] [Google Scholar]
- 63.van Nieuwenhuizen H., Chesebro A. G., Polizu C., Clarke K., Strey H. H., Weistuch C., & Mujica-Parodi L. R. Ketosis regulates K+ ion channels, strengthening brain-wide signaling disrupted by age. bioRxiv, 2023-05. [Google Scholar]
- 64.Ma W, Berg J, Yellen G. Ketogenic diet metabolites reduce firing in central neurons by opening K(ATP) channels. J Neurosci. 2007;27(14):3618–3625. doi: 10.1523/JNEUROSCI.0132-07.2007 [DOI] [PMC free article] [PubMed] [Google Scholar]
- 65.Tanner GR, Lutas A, Martínez-François JR, Yellen G. Single K ATP channel opening in response to action potential firing in mouse dentate granule neurons. J Neurosci. 2011;31(23):8689–8696. doi: 10.1523/JNEUROSCI.5951-10.2011 [DOI] [PMC free article] [PubMed] [Google Scholar]
- 66.Martínez-François JR, Fernández-Agüera MC, Nathwani N, et al. BAD and KATP channels regulate neuron excitability and epileptiform activity. Elife. 2018;7:e32721. Published 2018. Jan 25. doi: 10.7554/eLife.32721 [DOI] [PMC free article] [PubMed] [Google Scholar]
- 67.Juge N, Gray JA, Omote H, et al. Metabolic control of vesicular glutamate transport and release. Neuron. 2010;68(1 ):99–112. doi: 10.1016/j.neuron.2010.09.002 [DOI] [PMC free article] [PubMed] [Google Scholar]
- 68.Lund TM, Ploug KB, Iversen A, Jensen AA, Jansen-Olesen I. The metabolic impact of β-hydroxybutyrate on neurotransmission: Reduced glycolysis mediates changes in calcium responses and KATP channel receptor sensitivity. J Neurochem. 2015;132(5):520–531. doi: 10.1111/jnc.12975 [DOI] [PubMed] [Google Scholar]
- 69.Fremeau RT Jr, Kam K, Qureshi T, et al. Vesicular glutamate transporters 1 and 2 target to functionally distinct synaptic release sites. Science. 2004;304(5678):1815–1819. doi: 10.1126/science.1097468 [DOI] [PubMed] [Google Scholar]
- 70.Juge N, Gray JA, Omote H, et al. Metabolic control of vesicular glutamate transport and release. Neuron. 2010;68(1):99–112. doi: 10.1016/j.neuron.2010.09.002 [DOI] [PMC free article] [PubMed] [Google Scholar]
- 71.Pernía-Andrade AJ, Goswami SP, Stickler Y, Fröbe U, Schlögl A, Jonas P. A deconvolution-based method with high sensitivity and temporal resolution for detection of spontaneous synaptic currents in vitro and in vivo. Biophys J. 2012;103(7):1429–1439. doi: 10.1016/j.bpj.2012.08.039 [DOI] [PMC free article] [PubMed] [Google Scholar]
- 72.Traub RD, Wong RK, Miles R, Michelson H. A model of a CA3 hippocampal pyramidal neuron incorporating voltage-clamp data on intrinsic conductances. J Neurophysiol. 1991;66(2):635–650. doi: 10.1152/jn.1991.66.2.635 [DOI] [PubMed] [Google Scholar]
- 73.Yu N, Morris CE, Joós B, Longtín A. Spontaneous excitation patterns computed for axons with injury-like impairments of sodium channels and Na/K pumps. PLoS Comput Biol. 2012;8(9):e1002664. doi: 10.1371/journal.pcbi.1002664 [DOI] [PMC free article] [PubMed] [Google Scholar]
- 74.Altemus KL, Lavenex P, Ishizuka N, Amaral DG. Morphological characteristics and electrophysiological properties of CA1 pyramidal neurons in macaque monkeys. Neuroscience. 2005;136(3):741–756. doi: 10.1016/j.neuroscience.2005.07.001 [DOI] [PubMed] [Google Scholar]
- 75.Koch C, Chapter 6: The Hodgkin and Huxley Model of Action Potential Generation. In: Koch C, Biophysics of Computation: Information Processing in Single Neurons. Oxford University Press. 2004. p. 139–176. Print. [Google Scholar]
Associated Data
This section collects any data citations, data availability statements, or supplementary materials included in this article.
Supplementary Materials
Data Availability Statement
Raw data presented in this work, data tables with analyses and tables with statistics are available upon request. All code is available on GitHub, by following the links provided in the text.