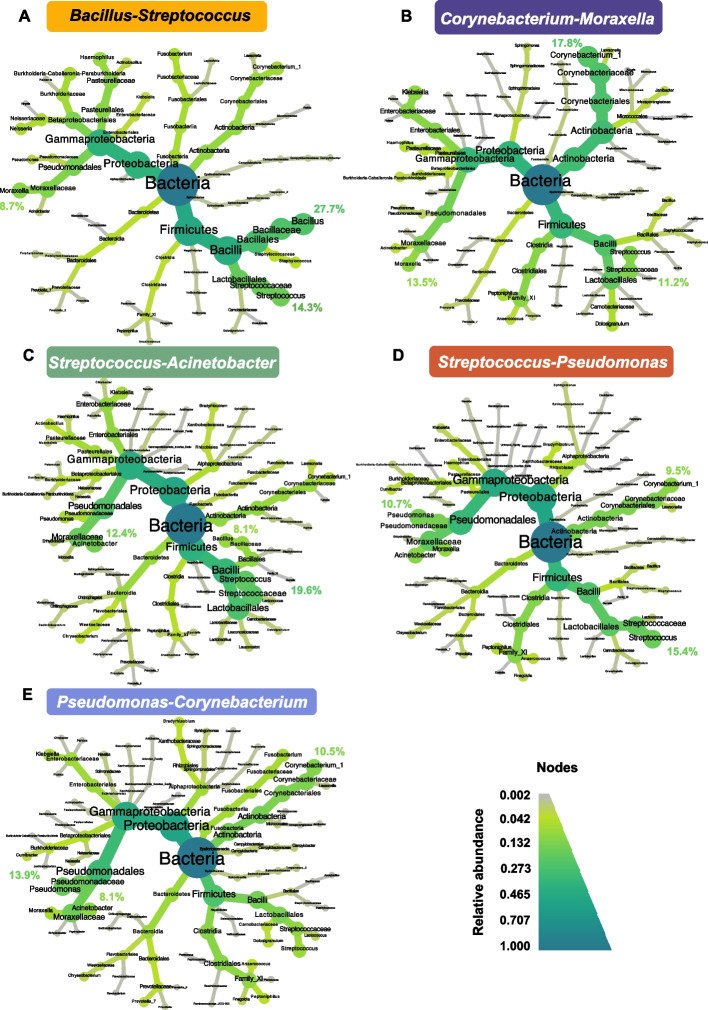
Fig. 3.
Nasopharyngeal microbiota clusters. Taxonomic heat trees for the five clusters identified. A Bacillus-Streptococcus (48.2% of the total samples), B Corynebacterium-Moraxella in dark blue (16.3%), C Streptococcus-Acinetobacter (13.3%), D Streptococcus-Pseudomonas (12.0%), and E Pseudomonas-Corynebacterium (10.2%). The center of each tree represents the kingdom and has a relative abundance of 1. In the extremities, the relative abundances at the genus level are represented. From the center to the extremities, each taxonomic level from kingdom to genus is indicated. The gradient of colors represents relative abundance. In each cluster, the relative abundance of the three most common genera is specified

