

Abstract
Gallate material, a luminescent matrix with excellent performance is normally prepared by vapor deposition or solid phase sintering method at high temperature. However, it has not been solved to prepare gallate-based fluorescent materials with full-color luminescent properties at low temperature. In this paper, ZnGa2O4 undoped or doped with Cr or Mn nanoflowers composed of nanosheet-level structure were prepared by hydrothermal method at low temperature. Under ultraviolet light irradiation, ZnGa2O4, ZnGa2O4:Mn2+ and ZnGa2O4:Cr3+ display three primary colors of blue, green and red luminescence through self-excitation, Mn2+ and Cr3+ excitation respectively. The solid fluorescence yields of blue, green, and red colors are 32.3, 36.5, and 40.7%, respectively. It is highly expected to be applied to color display, biological imaging, white light devices.
Subject terms: Materials for optics, Nanoscale materials
Introduction
In recent years, inorganic luminescent materials have attracted people's attention because of their wide applications in fluorescence imaging, color display, white Light Emitting Diodes (LEDs) and so on1–3. Therefore, constructing and designing efficient inorganic luminescent materials has become a hot topic for material scientists. Zinc gallate (ZnGa2O4), a ternary spinel material with a band gap of 4.4–4.7 eV, has exhibited excellent potential in future display system due to its prominent blue emission, high chemical and thermal stability, and good cathodoluminescence characteristics at low-voltage4,5. Compared with other luminescent materials, zinc gallate can be self-excited by Ga-O group, and has blue light emission6,7. ZnGa2O4 can also be used as the matrix of fluorescent materials, which has high luminous efficiency and narrow spectral band. The luminescent color can be changed by adjusting the surface properties4,8 and composition of fluorescent materials9,10, or by doping the dopant activators11,12. Most fluorescent materials use rare earth metals as activators, such as Eu3+, Tb3+, Y3+, etc.13–15, but rare earth metals are expensive and lack of resources. Previous studies have shown that transition metal ions Mn2+ and Cr3+ can be used as activators of fluorescent materials, such as ZnGa2O4:Mn2+ emitting green fluorescence and ZnGa2O4:Cr3+ emitting red fluorescence11,16,17. Various synthetic methods have been adopted to synthesize these fluorescent materials, such as thermal evaporation18, solid-state reaction method19, Chemical Vapor Deposition (CVD), Atomic Layer Deposition (ALD) and so on20. These synthetic methods usually require high reaction temperature, which is over 900 °C, so the energy consumption is high, which brings hidden dangers to environmental pollution control. Therefore, it is an urgent problem to find a low-temperature synthesis method for energy saving and emission reduction in the field of synthesis of full-color luminescent materials.
In this paper, undoped (ZnGa2O4), Mn2+-doped (ZnGa2O4:Mn2+) and Cr3+-doped (ZnGa2O4:Cr3+) nano-luminescent materials have been synthesized at low temperature by one step hydrothermal method under the template action of ethylenediamine. These luminescent materials are composed of 5 μm-sized nano-flowers, each of which is composed of 6–10 nm nanoflake hierarchical structure. Under ultraviolet irradiation, ZnGa2O4, ZnGa2O4:Mn2+ and ZnGa2O4:Cr3+ display three primary colors of blue, green and red through self-excitation, Mn2+ excitation and Cr3+ ion excitation, respectively.
Methods
Raw materials and reagents
Gallium nitrate hydrate (Ga(NO3)3·xH2O), Zinc acetate dihydrate (Zn(CH3COO)2·2H2O), Manganese acetate tetrahydrate (Mn(CH3COO)2·4H2O), Chromium nitrate nonahydrate (Cr(NO3)3·9H2O), and Anhydrous ethylenediamine (NH2(CH2)2NH2) are analytically pure and boughten from Sigma-Aldrich Shanghai trading Co., Ltd.. Anhydrous ethanol (CH3CH2OH), ≥ 99.9% are boughten from Shanghai Sinopharm Chemical Co., Ltd. All reagents were not further treated before use. Water used in the experiment is Milli-Q ultrapure water.
Sample preparation
Synthesis of ZnGa2O4
Ga(NO3)3·xH2O 0.512 g (2 mmol) and Zn(CH3COO)2·2H2O 0.220 g (1 mmol) are added into 20 mL deionized water, magnetically stirred for 20 min at room temperature. And then 10 mL anhydrous ethylenediamine is added into the above solution, with continue stirring for 20 min. The mixed solution is transferred to a 50 mL reaction kettle and placed into an oven, and stirred at 220 °C for 12 h. The white precipitate was obtained by washed with water and absolute ethanol several times, and dried at 60 °C for 12 h.
Synthesis of ZnGa2O4:Mn2+
Ga(NO3)3·xH2O 0.512 g (2 mmol) and Zn(CH3COO)2·2H2O 0.220 g (1 mmol) are added into 17.5 mL deionized water, magnetically stirred for 20 min at room temperature. And then 2.5 mL Mn(CH3COO)2 solution with a concentration of 4 mmol L−1 is added to above solution so that the concentration of Mn2+ is 1% of that of Zn2+, and magnetically stirred at room temperature for 20 min. Next, 10 mL anhydrous ethylenediamine is added into the above solution, with continue stirring for 20 min. The mixed solution is transferred to a 50 mL reaction kettle and placed into an oven, and stirred at 220 °C for 12 h. The white precipitate was obtained by washed with water and absolute ethanol several times, and dried at 60 °C for 12 h.
Synthesis of ZnGa2O4:Cr3+
The method is as same as the preparation of ZnGa2O4:Mn2+, and finally the concentration of Cr3+ is 0.5% of that of Zn2+.
Sample characterization
The phase structure of the sample was determined at room temperature by X-ray powder diffraction analyzer (Rigaku D/Max 2200PC, graphite monochromator filter, Cu Kα radiation, λ = 0.1542 nm) with the condition of tube voltage 40 kV, the tube current 20 mA, the scanning range 10°–80° (2θ) and the scanning speed 10 min−1. The morphology and microstructure of the product were characterized by transmission electron microscope (JEM-100CXII, accelerating voltage 80 kV), high resolution transmission electron microscope (Philips Tecnai 20U-TWIN, accelerating voltage 200 kV) and scanning electron microscope (FE-SEM, S-4800, Hitachi, accelerating voltage 5 kV). X-ray photoelectron spectrometer (PHI-5300 ESCA spectrometer, Perkin Elmer, Al Kα as excitation light source) was used to analyze the surface properties of the samples. Before the spectrogram analysis, the electron binding energies of all elements were corrected with the C1s peak at 284.6 eV as reference. Photoluminescence (PL) and fluorescence lifetime of samples were measured by Agilent Cary Eclipse Fluorescence Spectrometer. The UV–Vis absorption spectrum of the sample at room temperature was tested by Agilent Cary Series UV-VIS spectrometer, and BaSO4 was used as baseline correction before the test. The infrared spectrum of the sample was tested by NICOLET FT-IR spectrometer, and the KBr was used as the background.
Results and discussion
Phase structure and morphology characteristics
ZnGa2O4 is a bimetallic oxide composed of ZnO and Ga2O3, with Fd-3m space group symmetry, a = b = c = 8.335, and spinel structure with chemical formula AB2O4, in which Zn2+ occupying tetrahedral center, Ga3+ occupying octahedral center21, as shown in Fig. 1a. Usually, the charge imbalance caused by the introduction of impurity ions is unfavorable to the luminous intensity of luminophores, so higher energy is needed to eliminate the charge imbalance, such as calcination at high temperature for a long time22. The effective compensation factor φ when ions are substituted was calculated according to the formula φ = Z/r, in which Z is the charge number of ions and r is the effective radius of ions23. The greater the difference of φ, the more difficult it is to substitute ions. As shown in Table S1, for hexa-coordinate substitution of Mn2+, the effective compensation factor φ is 2.41, which is much lower than that of Ga3+ 4.83, so it is difficult for Mn2+ to replace Ga3+, while easy to replace Zn2+ due to the small difference of effective compensation factor11,17. Furthermore, in the substitution reaction of ZnGa2O4, ions with similar effective radii are easy to be substituted with each other, that is, Mn2+ replaces Zn2+ to produce four coordinate substitutions, and Cr3+ replaces Ga3+ to produce six coordinate substitution17,24.
Figure 1.
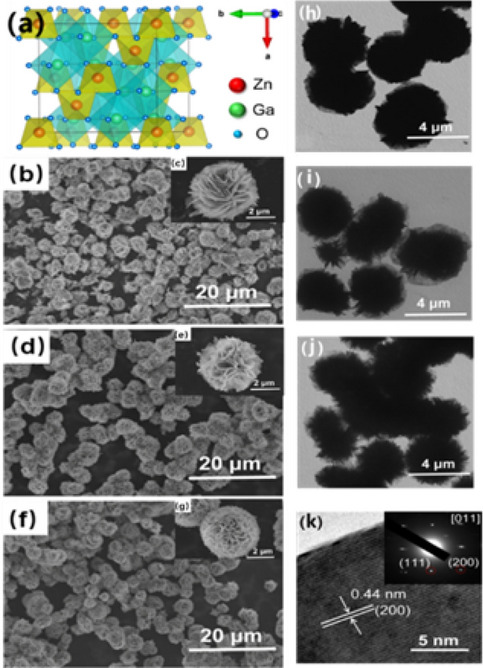
(a) Cubic spinel structure of ZnGa2O4, SEM images of (b-c) ZnGa2O4, (d–e) ZnGa2O4:Mn2+ and (f–g) ZnGa2O4:Cr3+, TEM images of (h) ZnGa2O4, (i) ZnGa2O4:Mn2+, (j) ZnGa2O4:Cr3+ (k) HRTEM image of ZnGa2O4, with the inset showing the corresponding SAED patterns.
The SEM photos of the three nanomaterials (ZnGa2O4, ZnGa2O4:Mn2+ and ZnGa2O4:Cr3+) with different magnification is shown in Fig. 1b–g. They all present a flower-like nanostructure of about 5 μm, which is composed of multiple nanosheet-level substructures with a thickness of 6–10 nm interspersed together. The difference between the three samples is that the nanosheets composed of ZnGa2O4 are thicker and the degree of curling of the nanosheets is smaller, while the nanosheets doped with Mn2+ and Cr3+ are thinner, and the nanosheets are freely curled to form spherical nanoflowers. As shown in Fig. S1. Zn, Ga, O and the corresponding doped elements Mn and Cr are uniformly distributed in the flower-like nanostructures confirmed by the element distribution surface scans. The flower-like structure of ZnGa2O4, ZnGa2O4:Mn2+ and ZnGa2O4:Cr3+ can also be seen from the TEM photos in Fig. 1h–j. Each flower is composed of the sub-structure of nano-flakes, and the size of nano-flowers is about 5 μm. From the contrast of the electron microscope photos, it can be clearly seen that the nano-flakes constituting the flower-like structure become thinner in turn, which is similar to that of Scanning electron microscope (SEM). The phenomenon may be due to the impurity ions adsorbed on the initial grain surface during hydrothermal process, which inhibiting the crystallization of the material to some extent, preventing the grain growth in some directions, and resulting in the formation of thinner nanosheets. High-resolution photos and corresponding selective electron diffraction photos of ZnGa2O4 are shown in Fig. 1k. The lattice spacing 0.44 nm is corresponding to the (200) crystal plane of ZnGa2O4, and the selective electron diffraction photo clearly shows single crystal structure of a ZnGa2O4 nanoflake. In the single crystal structure of the sheet, the diffraction points correspond to (200) and (111) crystal plane. The direction of the crystal zone axis is confirmed to [011] by calculating, therefore the exposed surface of the nanoplate is (110) plane.
As shown in Fig. 2a the diffraction peaks of ZnGa2O4, ZnGa2O4:Mn2+ and ZnGa2O4:Cr3+ all correspond to the diffraction peaks of standard card JCPDS38-1240 ZnGa2O4, which are cubic spinel structure. After doping Mn2+ and Cr3+, the intensity of the diffraction peak decreases, and the corresponding FWHM (full width at half maximum) increases in sequence. The results of X-ray diffractometer (XRD) analysis also indicate that the secondary structure nanosheets that make up the nanoflowers become thinner in turn after doping Mn2+ and Cr3+, which consistent precisely with the observation results of SEM and transmission electron microscopy (TEM). As shown in Fig. 2b–e the electron binding energies of 2p1/2 orbitals and 2p3/2 orbitals of Ga are located at 1143.6 eV and 1116.8 eV, respectively. And the electron binding energies of 2p1/2 orbitals and 2p3/2 orbitals of Zn are located at 1043.8 eV and 1021.1 eV, respectively. The characteristic peaks of electron binding energies located at 654.4 eV and 645.5 eV belong to 2p1/2 orbitals and 2p3/2 orbitals of Mn, respectively and manganese ions show +2 valences. The characteristic peaks of electron binding energy at 586.5 eV and 576.5 eV respectively belong to 2p1/2 orbitals and 2p3/2 orbitals of Cr and chromium ions show +3 valences. The intensity of these characteristic peaks is small due to the low contents of Mn and Cr.
Figure 2.

(a) XRD patterns of ZnGa2O4, ZnGa2O4:Mn2+ and ZnGa2O4:Cr3+. The XPS spectra of ZnGa2O4, ZnGa2O4:Mn2+ and ZnGa2O4: Cr3+: (b) Zn 2p, (c) Ga 2p, (d) Mn 2p in ZnGa2O4:Mn2+ and (e) Cr 2p in ZnGa2O4:Cr3+.
Infrared and ultraviolet spectral characteristics
In order to understand the chemical composition of the sample, the Fourier transform infrared spectrum is conducted. The Fourier Transform infrared spectroscopy (FT-IR) of ZnGa2O4, ZnGa2O4:Mn2+ and ZnGa2O4:Cr3+ in Fig. S2 also indicate the samples were binary metal oxides consisting of Zn-O and Ga-O groups. As showed in Fig. S2, the broad absorption peak at the 3445 cm−1 wavelength belongs to the stretching vibration of O-H and N-H. The stretching vibration of N-H may come from the residual ethylenediamine in the sample, but there is no obvious stretching vibration peak of it near 1190 cm−1. Therefore, the residual ethylenediamine may be very small and can be ignored after repeated cleaning of water and anhydrous ethanol. In the fingerprint region at low wavelength, the larger peaks of 585 cm−1 and 425 cm−1 are attributed to the vibration absorption of Zn-O and Ga-O, respectively. Through the infrared spectrum analysis, no other vibration peaks are observed except Zn-O and Ga-O in the sample, so it is determined that the sample is a binary metal oxide composed of Zn-O group and Ga-O group. The UV-vis absorption spectra of ZnGa2O4, ZnGa2O4:Mn2+ and ZnGa2O4:Cr3+ samples are shown in Fig. S3. It can be seen from the figure that the absorption regions of the three samples are basically the same, and there is only absorption in the region smaller than 350 nm. It is also confirmed that ZnGa2O4 can only be excited at wavelengths less than 350 nm. However, in the 300–350 nm wavelength region, compared with the absorption peak of ZnGa2O4, the absorption of ZnGa2O4:Mn2+ and ZnGa2O4:Cr3+ increases slightly, which may be due to the absorption of a small amount of Mn and Cr itself, because the amount of Mn2+ and Cr3+ is very small, only 0.4% and 1%, so the absorption of these two elements is also very weak.
Luminescent properties
The excitation and emission spectra of ZnGa2O4, ZnGa2O4:Mn2+ and ZnGa2O4:Cr3+ are shown in Fig. 3a–c. For undoped ZnGa2O4, three peaks can be seen in the excitation spectrum, which are located at 226 nm 239 nm and 257 nm, respectively. These excitation peaks are caused by the charge transfer from O2− to octahedral center Ga3+ and the ultraviolet absorption of ZnGa2O4 itself25. The emission spectrum obtained using 226 nm as the excitation wavelength is a broad peak with the highest peak of 456 nm in the range of 340–750 nm. This broad emission peak is in all probability caused by the self-excitation of Ga-O hexahedron in the spinel structure. The luminescent properties of fluorescent host materials are usually changed by introducing impurity ions26, that is also applicable to ZnGa2O4 host materials. Mn2+-doped ZnGa2O4 has green fluorescence emission, as shown in Fig. 3b. Except for the charge transfer from O2- to Ga3+ in the octahedral center and the ultraviolet absorption of ZnGa2O4 itself, the absorption of Mn2+ excites a red shift of 32 near 300 nm, which is consistent with the analysis of ultraviolet-visible absorption spectrum in Fig. S3. Due to the activation of Mn2+, the emission spectrum with the highest emission peak of 505 nm is located in the range of 470–600 nm with the excitation wavelength of 226 nm.
Figure 3.
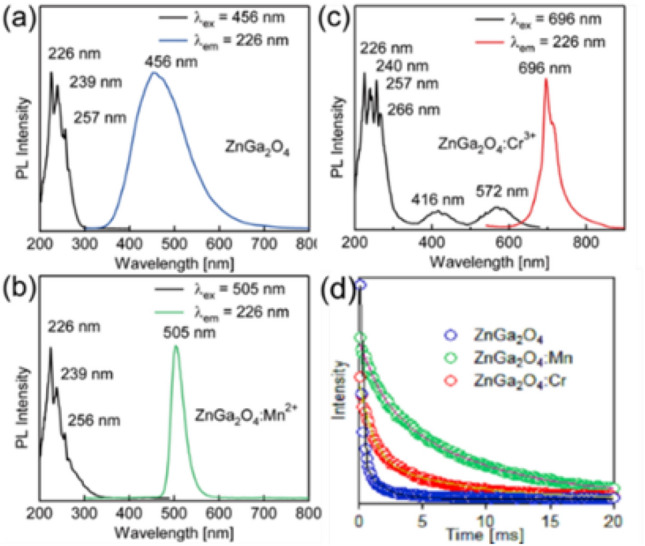
Excitation and emission spectra of (a) ZnGa2O4, (b) ZnGa2O4:Mn2+, (c) ZnGa2O4:Cr3+ and (d) photoluminescence decay curves and bi-exponential fittings for the ZnGa2O4, ZnGa2O4:Mn2+ and ZnGa2O4: Cr3+.
After enlarged locally as shown in Fig. S4, the five smaller excitation peaks located between 351–443 nm and centered at 351 nm, 379 nm, 410 nm, 422 nm and 443 nm respectively correspond to 5A1–4E, 6A1–4T2, 6A1–4A1, 4E1 and 6A1–4T of Mn2+.27 When excited at 226 nm, ZnGa2O4:Mn2+ has green emission at 505 nm, which belongs to the 4T1–6A1 d orbital electron forbidden transition of Mn2+11,17. This is the process of energy transfer from ZnGa2O4 matrix to Mn2+27. The transition process of 4T1–6A1 of Mn2+ is accompanied by strong 3d shell lattice vibration coupling, and is affected by crystal field and symmetric sites. If Mn2+ is in a weak crystal field, i.e. tetrahedron, the splitting of excitation energy will be weak, which will be accompanied by high energy emission, that is, green light and if Mn2+ is in a strong crystal field, i.e., octahedron, it will emit yellow or red light17,27, which is consistent with our previous analysis of crystal structure. In our investigation, Mn2+ replaces Zn2+ with similar ionic radius in cubic ZnGa2O4 matrix to generate tetrahedral coordination and emit green light, which is completely consistent with the test results of fluorescence spectrum.
The excitation and emission spectra of ZnGa2O4:Cr3+ are shown in Fig. 3c. There is a wide excitation peak between 200–350 nm, including four intensity excitation peaks (226 nm, 240 nm, 257 nm, 266 nm), which related to the charge transfer transition of O2− to the octahedral center Ga3+ and the absorption transition with the belt, and the excitation spectrum of 300–350 nm is caused by the absorption of Cr3+. A red emission peak at 696 nm was obtained by excitation at 226 nm, which was attributed to the 2E–4A2 characteristic transformation of Cr3+28. Meanwhile, a similar red emission peak at 696 nm was obtained by excitation at 416 nm and 572 nm. These two excitation peaks at 416 nm and 572 nm are caused by d–d electron-electron transitions of Cr3+24,29, corresponding to the 4A2–4T1 and 4A2–4T2 characteristic transitions of Cr3+, respectively30.
Undoped, Mn2+ doped and Cr3+ doped ZnGa2O4 have blue, green and red emission properties under ultraviolet (UV) excitation, respectively. The excitation wavelengths used in the emission spectra of ZnGa2O4, ZnGa2O4:Mn2+ and ZnGa2O4:Cr3+ are all 226 nm, indicating that the hetero ions in ZnGa2O4:Mn2+ and ZnGa2O4:Cr3+ can effectively enter the lattice of ZnGa2O4 under hydrothermal conditions to replace Zn2+ and Ga3+ to form tetrahedral and octahedral coordination, respectively. This is related to the addition of an appropriate amount of ethylenediamine during hydrothermal. Ethylenediamine aqueous solution is a strongly alkaline solution, which plays an effective role in promoting the crystallization of materials and the entry of hetero ions into the crystal lattice of the matrix under the condition of hydrothermal high temperature and high pressure. We also conduct experiment keeping other conditions remaining the same without ethylenediamine in the synthesis. The obtained ZnGa2O4 doped with Mn2+ and Cr3+ does not show green and red emission properties after UV excitation, indicating that it is difficult for hydrothermal hetero ions to enter into the lattice of ZnGa2O4 matrix under the condition of non-strong alkaline solvent.
The fluorescence attenuation curves of ZnGa2O4, ZnGa2O4:Mn2+ and ZnGa2O4:Cr3+ are fitted exponentially as shown in Fig. 3d. The attenuation curves of the three samples are all fitted by double exponents, which are in accordance with the formula.
| 1 |
where I is the fluorescence intensity when the time is t, I1 and I2 are fitting constants, and τ1 and τ2 are fluorescence lifetime. After fitting, each sample corresponds to two millisecond lifetimes, a shorter lifetime τ1 and a relatively longer life τ2. The specific fitting parameters are shown in Table S2. The longer lifetimes of each sample of ZnGa2O4, ZnGa2O4:Mn2+ and ZnGa2O4:Cr3+ correspond to the self-excitation of Ga-O in the bulk phase of luminescent materials, the 4T1-6A1 transition of Mn2+ and the 2E–4A2 transition of Cr3+, respectively. The short lifetime of the three samples is due to the fact that the surface effect of the materials has a great influence on the luminescence lifetime. These materials are all composed of ultra-thin 6–10 nm nanosheets with large surface area, and the increase of surface atoms leads to the appearance of more activated ions on the surface of the nanosheets. However, the impurities, unsaturated bonds, vacancies and other surface defects on the surface of the nanoparticles will quenched the activated ions and lead to radiation-free transition, thus shortening the life of the activated ions.8
Excited by 254 nm's handheld UV lamp, ZnGa2O4, ZnGa2O4:Mn2+ and ZnGa2O4:Cr3+ appear bright blue, green and red, respectively. Their optical photos are shown in Fig. 4a. The solid fluorescence yields of blue, green, and red colors are 32.3, 36.5, and 40.7%, respectively. Under the light excitation of 226 nm wavelength, the Normalized fluorescence emission spectra of the three materials are shown in Fig. 4b. The maximum fluorescence emission spectra of the three materials are located in 456 nm, 505 nm and 696 nm, respectively, which basically correspond to the central regions of blue, green and red. Their emission spectra are imported into the CIE color coordinate software, respectively, and the color coordinate diagram shown in Fig. 4c is obtained. The color coordinates are located at (0.19, 0.23), (0.10, 0.65) and (0.66, 0.34), respectively, which indicates that any color including white in the triangular area connected by the three points can be obtained by changing the ratio of the three luminescent materials.
Figure 4.

(a) Digital images of ZnGa2O4, ZnGa2O4:Mn2+, and ZnGa2O4:Cr3+ on glass substrates under UV light excitation. (b) Normalized PL emission spectra of ZnGa2O4, ZnGa2O4:Mn2+, and ZnGa2O4:Cr3+ samples. (c) The for ZnGa2O4 (0.19, 0.23), ZnGa2O4:Mn2+ (0.10, 0.65), and ZnGa2O4:Cr3+ (0.66, 0.34) samples.
In order to demonstrate whether there is white luminescence phenomenon when mixing the three samples, we conducted packaged white LED luminescence testing on their mixture. As shown in Fig. 5a, the encapsulated white LED device and the emitting color are shown. The encapsulated white LED prepared has a correlated colour temperature (CCT) of 26702K and a color rendering index (CRI) of 55.1. Within the constant voltage range of 20 mA to 120 mA and 3 V, the relationship between the luminous intensity of the encapsulated white LED and the input forward current is shown in Fig. 5b. From the color of the encapsulated white LED device and the CIE chromaticity diagram, we can see that the light emitted by this mixture is not pure white light, but a cyanish white-like light. According to the emission spectrum of the mixture, we speculate that the reason is that the emission wavelength of red light is mostly in the invisible near-infrared region after 650 nm, and there is an empty window in the wavelength range of 600–650 nm, resulting in the emission color of encapsulated white LED being a cyan white light, rather than a pure white light like the results made by other phosphors31,32.
Figure 5.
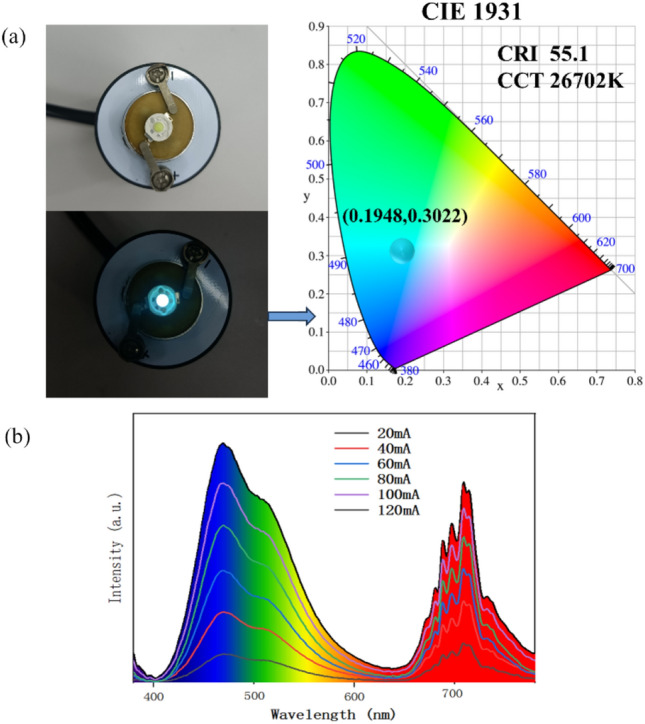
(a) Encapsulated white LED devices and emitting colors. (b) The relationship between the luminous intensity of packaged white LED and the input forward current.
Conclusions
ZnGa2O4 nanoflowers with single size composed of ZnGa2O4 flake substructures with a thickness of 6-10 nm were synthesized by a simple hydrothermal method under the action of ethylenediamine template. The luminescence color of ZnGa2O4 is controlled by doping Mn2+ and Cr3+. Under UV excitation, undoped ZnGa2O4, ZnGa2O4 doped with Mn2+ and Cr3+ have blue, green and red emission properties, respectively. The luminescence properties of the same matrix material with three primary colors are obtained. The blue, green and red fluorescence comes from the self-excited electron transfer of Ga-O itself and the 3d electron energy transfer of Mn2+ and Cr3+. The three samples are mixed to do the encapsulated white LED luminescence test, which has the phenomenon of cyan white luminescence. These ZnGa2O4-based fluorescent nanomaterials are expected to be used in color display, biological imaging and white light devices.
Supplementary Information
Acknowledgements
Thanks for the support of the Experimental Center of Shandong University of Traditional Chinese Medicine, the Natural Science Foundation of Shandong Province (Grant No.: ZR2020 MB108), the Health Commission of Shandong Province (Grant No.: 202004010938 and Q-2023016) and the National Natural Science Foundation of China (Grant No.: 82304431).
Author contributions
Y.L.: Conceptualization, methodology, formal analysis, investigation, writing—original draft, writing—review and editing, T.Z.: conceptualization, data curation, formal analysis, funding acquisition, methodology, supervision, writing-original draft, writing-review & editing. X.Z.: supervision, conceptualization, methodology, invisualization, writing-review & editing. C.C.: supervision, conceptualization, methodology, invisualization, writing-review & editing.
Data availability
All data generated or analyzed during this study are included in this published article (and its Supplementary Information files).
Competing interests
The authors declare no competing interests.
Footnotes
Publisher's note
Springer Nature remains neutral with regard to jurisdictional claims in published maps and institutional affiliations.
Contributor Information
Tingting Zheng, Email: ttz10_10@163.com.
Xiuyun Zhang, Email: zhangxiuyunsh@163.com.
Chen Chen, Email: 21129008@zju.edu.cn.
Supplementary Information
The online version contains supplementary material available at 10.1038/s41598-023-41658-5.
References
- 1.Nie J, Li Y, Han G, Qiu J. In vivo clearable inorganic nanophotonic materials: Designs, materials and applications. Nanoscale. 2019;11:12742–12754. doi: 10.1039/c9nr02083g. [DOI] [PubMed] [Google Scholar]
- 2.Shi C, et al. Facile synthesis of a color-tunable microcrystal phosphor for anti-counterfeit applications. ACS Omega. 2020;5:32420–32425. doi: 10.1021/acsomega.0c04516. [DOI] [PMC free article] [PubMed] [Google Scholar]
- 3.Menendez-Velazquez A, Morales D, Garcia-Delgado AB. Sunlike white light-emitting diodes based on rare-earth-free luminescent materials. Materials (Basel) 2022 doi: 10.3390/ma15051680. [DOI] [PMC free article] [PubMed] [Google Scholar]
- 4.Yang W, et al. Multi-wavelength tailoring of a ZnGa2O4 nanosheet phosphor via defect engineering. Nanoscale. 2018;10:19039–19045. doi: 10.1039/c8nr05072d. [DOI] [PubMed] [Google Scholar]
- 5.Liu N, et al. In vivo repeatedly activated persistent luminescence nanoparticles by radiopharmaceuticals for long-lasting tumor optical imaging. Small. 2020;16:e2001494. doi: 10.1002/smll.202001494. [DOI] [PubMed] [Google Scholar]
- 6.Moon JW, Kim JS, Park JH, Ivanov IN, Phelps TJ. Synthesis of zinc-gallate phosphors by biomineralization and their emission properties. Acta Biomater. 2019;97:557–564. doi: 10.1016/j.actbio.2019.07.052. [DOI] [PubMed] [Google Scholar]
- 7.Hinuma Y, Mine S, Toyao T, Kamachi T, Shimizu KI. Factors determining surface oxygen vacancy formation energy in ternary spinel structure oxides with zinc. Phys. Chem. Chem. Phys. 2021;23:23768–23777. doi: 10.1039/d1cp03657b. [DOI] [PubMed] [Google Scholar]
- 8.Wang T, Layek A, Hosein ID, Chirmanov V, Radovanovic PV. Correlation between native defects and dopants in colloidal lanthanide-doped Ga2O3 nanocrystals: A path to enhance functionality and control optical properties. J. Mater. Chem. C. 2014;2:3212–3222. doi: 10.1039/c3tc31823k. [DOI] [Google Scholar]
- 9.Farvid SS, Wang T, Radovanovic PV. Colloidal gallium indium oxide nanocrystals: A multifunctional light-emitting phosphor broadly tunable by alloy composition. J. Am. Chem. Soc. 2011;133:6711–6719. doi: 10.1021/ja111514u. [DOI] [PubMed] [Google Scholar]
- 10.Wang Z, Teramura K, Hosokawa S, Tanaka T. Highly efficient photocatalytic conversion of CO2 into solid CO using H2O as a reductant over Ag-modified ZnGa2O4. J. Mater. Chem. A. 2015;3:11313–11319. doi: 10.1039/c5ta01697e. [DOI] [Google Scholar]
- 11.Hwang JY, Bark CW, Choi HW. Application of ZnGa2O4: Mn down-conversion layer to increase the energy-conversion efficiency of perovskite solar cells. J. Nanosci. Nanotechnol. 2021;21:4362–4366. doi: 10.1166/jnn.2021.19407. [DOI] [PubMed] [Google Scholar]
- 12.Monika, Yadav RS, Rai A, Rai SB. NIR light guided enhanced photoluminescence and temperature sensing in Ho(3+)/Yb(3+)/Bi(3+) co-doped ZnGa2O4 phosphor. Sci. Rep. 2021;11:4148. doi: 10.1038/s41598-021-83644-9. [DOI] [PMC free article] [PubMed] [Google Scholar]
- 13.Lee H, Choi HW. Characteristics of perovskite solar cells according to thickness of doped ZnGa2O4 down-converting thin film. J. Nanosci. Nanotechnol. 2020;20:7081–7086. doi: 10.1166/jnn.2020.18849. [DOI] [PubMed] [Google Scholar]
- 14.Safeera TA, Anila EI. Wet chemical approach for the low temperature synthesis of ZnGa2O4:Tb3+ quantum dots with tunable blue-green emission. J. Alloys Compd. 2018;764:142–146. doi: 10.1016/j.jallcom.2018.06.048. [DOI] [Google Scholar]
- 15.Noto LL, et al. Structure, photoluminescence and thermoluminescence study of a composite ZnTa2O6/ZnGa2O4 compound doped with Pr3+ Opt. Mater. 2016;55:68–72. doi: 10.1016/j.optmat.2016.03.029. [DOI] [Google Scholar]
- 16.De Vos A, et al. First-principles study of antisite defect configurations in ZnGa2O4: Cr persistent phosphors. Inorg. Chem. 2016;55:2402–2412. doi: 10.1021/acs.inorgchem.5b02805. [DOI] [PubMed] [Google Scholar]
- 17.Dazai T, Yasui S, Taniyama T, Itoh M. Cation-deficiency-induced crystal-site engineering for ZnGa2O4:Mn(2+) thin film. Inorg. Chem. 2020;59:8744–8748. doi: 10.1021/acs.inorgchem.0c00359. [DOI] [PubMed] [Google Scholar]
- 18.Lu MY, Zhou X, Chiu CY, Crawford S, Gradecak S. From GaN to ZnGa2O4 through a low-temperature process: Nanotube and heterostructure arrays. ACS Appl. Mater. Interfaces. 2014;6:882–887. doi: 10.1021/am404158f. [DOI] [PubMed] [Google Scholar]
- 19.Lou Z, Li L, Shen G. High-performance rigid and flexible ultraviolet photodetectors with single-crystalline ZnGa2O4 nanowires. Nano Res. 2015;8:2162–2169. doi: 10.1007/s12274-015-0723-0. [DOI] [Google Scholar]
- 20.Tien L-C, Tseng C-C, Chen Y-L, Ho C-H. Direct vapor transport synthesis of ZnGa2O4 nanowires with superior photocatalytic activity. J. Alloys Compd. 2013;555:325–329. doi: 10.1016/j.jallcom.2012.12.029. [DOI] [Google Scholar]
- 21.Zerarga F, Bouhemadou A, Khenata R, Bin-Omran S. Structural, electronic and optical properties of spinel oxides ZnAl2O4, ZnGa2O4 and ZnIn2O4. Solid State Sci. 2011;13:1638–1648. doi: 10.1016/j.solidstatesciences.2011.06.016. [DOI] [Google Scholar]
- 22.Park S, An S, Mun Y, Lee C. UV-enhanced room-temperature gas sensing of ZnGa2O4 nanowires functionalized with Au catalyst nanoparticles. Appl. Phys. A. 2013;114:903–910. doi: 10.1007/s00339-013-7745-9. [DOI] [Google Scholar]
- 23.Lin L, Sun X, Jiang Y, He Y. Sol-hydrothermal synthesis and optical properties of Eu3+, Tb(3+)-codoped one-dimensional strontium germanate full color nano-phosphors. Nanoscale. 2013;5:12518–12531. doi: 10.1039/c3nr04185a. [DOI] [PubMed] [Google Scholar]
- 24.Viana B, et al. Long term in vivo imaging with Cr3+ doped spinel nanoparticles exhibiting persistent luminescence. J. Lumin. 2016;170:879–887. doi: 10.1016/j.jlumin.2015.09.014. [DOI] [Google Scholar]
- 25.Zhou W, et al. Synthesis of porous zinc gallate prisms composed of highly oriented nanoparticles by an in situ conversion reaction. Chemistry. 2012;18:5367–5373. doi: 10.1002/chem.201102673. [DOI] [PubMed] [Google Scholar]
- 26.Fu Z, Xia W, Li Q, Cui X, Li W. Highly uniform NaLa(MoO4)2:Ln3+ (Ln = Eu, Dy) microspheres: Template-free hydrothermal synthesis, growing mechanism, and luminescent properties. CrystEngComm. 2012 doi: 10.1039/c2ce06682c. [DOI] [Google Scholar]
- 27.Luchechko A, et al. Afterglow, TL and OSL properties of Mn(2+)-doped ZnGa2O4 phosphor. Sci. Rep. 2019;9:9544. doi: 10.1038/s41598-019-45869-7. [DOI] [PMC free article] [PubMed] [Google Scholar]
- 28.Su J, et al. Influence of oxygen vacancy on persistent luminescence in ZnGa_2O_4:Cr3+ and identification of electron carriers. Opt. Mater. Express. 2017 doi: 10.1364/ome.7.000734. [DOI] [Google Scholar]
- 29.Li L, Wang Y, Huang H, Li H, Zhao H. Long-lasting luminescence in ZnGa2O4: Cr3+ through persistent energy transfer. Mod. Phys. Lett. B. 2016 doi: 10.1142/s0217984916500196. [DOI] [Google Scholar]
- 30.Zhang Y, et al. Full color emission in ZnGa2O4: Simultaneous control of the spherical morphology, luminescent, and electric properties via hydrothermal approach. Adv. Func. Mater. 2014;24:6581–6593. doi: 10.1002/adfm.201402092. [DOI] [Google Scholar]
- 31.Kwon K, et al. Luminescence properties and energy transfer of site-sensitive Ca(6–x-y)Mg(x-z)(PO(4))(4):Eu(y)(2+), Mn(z)(2+) phosphors and their application to near-UV LED-based white LEDs. Inorg. Chem. 2009;48:11525–11532. doi: 10.1021/ic900809b. [DOI] [PubMed] [Google Scholar]
- 32.Xie Y, et al. Synthesis of quantum dot-ZnS nanosheet inorganic assembly with low thermal fluorescent quenching for LED application. Materials (Basel) 2017 doi: 10.3390/ma10111242. [DOI] [PMC free article] [PubMed] [Google Scholar]
Associated Data
This section collects any data citations, data availability statements, or supplementary materials included in this article.
Supplementary Materials
Data Availability Statement
All data generated or analyzed during this study are included in this published article (and its Supplementary Information files).