



Abstract
BACH1 plays an important role in promoting cancer. This study aims to further verify the relationship between the expression level of BACH1 in lung adenocarcinoma prognosis, as well as the influence of BACH1 expression on lung adenocarcinoma and the potential mechanism. The expression level of BACH1 in lung adenocarcinoma and its relationship with prognosis was evaluated by lung adenocarcinoma tissue microarray analysis combined with bioinformatics approaches. Gene knockdown and overexpression were used to investigate the functions and molecular mechanisms of BACH1 in lung adenocarcinoma cells. The regulatory downstream pathways and target genes of BACH1 in lung adenocarcinoma cells were explored by bioinformatics and RNA sequencing data analysis, real‐time PCR, western blot analysis, and cell immunofluorescence and cell adhesion assays. Chromatin immunoprecipitation and dual‐luciferase reporter assays were carried out to verify the target gene binding site. In the present study, BACH1 is abnormally highly expressed in lung adenocarcinoma tissues, and high BACH1 expression is negatively correlated with patient prognosis. BACH1 promotes the migration and invasion of lung adenocarcinoma cells. Mechanistically, BACH1 directly binds to the upstream sequence of the ITGA2 promoter to promote ITGA2 expression, and the BACH1‐ITGA2 axis is involved in cytoskeletal regulation in lung adenocarcinoma cells by activating the FAK‐RAC1‐PAK signaling pathway. Our results indicated that BACH1 positively regulates the expression of ITGA2 through a transcriptional mechanism, thereby activating the FAK‐RAC1‐PAK signaling pathway to participate in the formation of the cytoskeleton in tumor cells and then promoting the migration and invasion of tumor cells.
Keywords: BACH1, cytoskeleton, ITGA2, lung adenocarcinoma, metastasis
Lung adenocarcinoma is characterized by high metastasis rate, and this is one of the reasons for the high mortality of lung adenocarcinoma (LUAD) patients. Oncogene BACH1 is highly expressed in lung adenocarcinoma and associated with poor prognosis. Through vivo and vitro experiments we determined that BACH1 can promote the ability of migration and invasion in LUAD cells. By comprehensive bioinformatics analysis, we further found that BACH1 positively transcriptional regulation of ITGA2 promoter region, thereby activating the FAK‐RAC1‐PAK signaling pathway to participate in the formation of tumor cytoskeleton, and then promoting the migration and invasion of tumor cells. These results could provide new ideas for the treatment and future research of lung adenocarcinoma.

Abbreviations
- BACH1
BTB and CNC homology 1
- B‐BS
BTB and CNC homology 1‐binding site
- CSF2
colony stimulating factor 2
- DEG
differentially expressed gene
- FAK
focal adhesion kinase
- FN
fibronectin
- GO
Gene Ontology
- GSEA
Gene Set Enrichment Analysis
- GTRD
Gene Transcription Regulation Database
- HMOX1
heme oxygenase 1
- IHC
immunohistochemistry
- INPP5D
inositol polyphosphate‐5‐phosphatase D
- ITGA2
integrin subunit alpha 2
- LUAD
lung adenocarcinoma
- OE
overexpression
- OS
overall survival
- PAK
P21‐activated kinase
- PPP1R3G
protein phosphatase 1 regulatory subunit 3G
- qRT‐PCR
RT‐quantitative PCR
- RAC1
Rac family small GTPase 1
- RNA‐seq
RNA sequencing
- TCGA
The Cancer Genome Atlas
- TMA
tissue microarray
- TXNIP
thioredoxin interacting protein
- WB
western blot
1. INTRODUCTION
Lung cancer is one of the most common malignant tumors and has high morbidity and mortality worldwide. 1 Among the pathological types of lung cancer, LUAD had the highest incidence in the past few decades. 2 Moreover, the OS of LUAD patients remains poor due to the large proportion of patients diagnosed with metastatic disease. 3 Therefore, it is necessary to explore the mechanisms involved in the metastatic process of LUAD and identify a therapeutic strategy for LUAD.
BACH1 is a member of the CNC‐bZip family of transcription factors. 4 BACH1 is widely expressed in most mammalian tissues and regulates iron‐ and heme‐related genes in normal cells. 5 Investigations in different types of human cancers have explored whether BACH1 promotes cancer progression through multiple mechanisms. Previous studies have established that BACH1 promotes metastasis in breast cancer, 6 colorectal cancer, 7 pancreatic ductal adenocarcinoma, 8 prostate cancer, 9 and ovarian cancer. 10 In lung cancer, tumors with high levels of NRF2 also display high levels of BACH1, and the latter promotes metastasis through transcriptional activation of prometastatic genes. 11 In addition, BACH1 stabilization by antioxidants can induce lung carcinognesis. 12 However, the underlying mechanism of BACH1 in LUAD metastasis remains to be further elucidated. Because we found a strong correlation between BACH1 expression and the regulation of the actin cytoskeleton, we sought to determine whether BACH1 regulates LUAD cell motility through the cytoskeletal pathway.
2. MATERIALS AND METHODS
2.1. Patient specimens and tissue microarrays
The IHC of a total of 90 human lung adenocarcinoma was undertaken by Shanghai Outdo Biotech Company. The anti‐BACH1 Ab was purchased from Santa Cruz Biotechnology (SC‐271211).
2.2. Cell lines and cell culture
PC9, H1975, and 293 T cell lines were purchased from ATCC. PC9 and H1975 cell lines were maintained in RPMI‐1640 (Gibco) supplemented with 10% FBS (Gibco). 293 T cells were maintained in DMEM (Gibco) supplemented with 10% FBS.
2.3. Lentivirus transduction
Lentivirus encoding the target gene or scrambled negative control, purchased from Genechem, were individually transfected into the PC9 and H1975 cell lines according to the manufacturer's instructions. Cell lines were treated with 2 g/mL puromycin to establish stable lentivirus‐transduced lines.
2.4. Cell proliferation assay
The CCK‐8 and colony formation assays were used to assess cell proliferation and measured as previously described. 13
2.5. Transwell assays
Transwell tests were carried out using Transwell plates (8 μm pore size; Corning). To assess invasive and migratory capabilities, chambers covered with or without Matrigel (BD Biosciences) were used. Cells suspended in 200 μL serum‐free medium were seeded at a density of 5 × 10⁴ per well in the upper chamber, and 500 μL complete medium was added to the lower chamber. After incubation in 37°C for 24 h, cells on the bottom surface of the upper chambers were fixed, stained with crystal violet, photographed, and counted.
2.6. Wound healing assay
Cells in 6‐well plates were grown to confluence. The 10 μL pipette tip was used to draw a straight line. The cells were then cultured with serum‐free medium and photographed at 0 and 24 h after wounding. The wound area was calculated by the distance between wound boundaries obtained from three independent fields using ImageJ (version 1.53a).
2.7. Cell adhesion assay
A 96‐well plate was coated with 50 μL FN (10 μg/mL) overnight at 4°C. Coated wells were then blocked with 0.2% BSA in PBS for 1 h at 37°C. Cells were seeded into 96‐well plates at 3 × 10³ cells per well at a concentration of 100 μL and the adhesive ability of cells was analyzed at time points of 0, 30, 60, and 120 min. Nonadherent cells were removed by gentle washing with PBS. The remaining adherent cells were quantified using the CCK‐8 reagents (Biosharp).
2.8. Immunofluorescence analysis
Cells were fixed with 4% paraformaldehyde for 15 min at room temperature, then permeabilized with 0.5% Triton X‐100 and blocked with 5% BSA. The cells were stained with phalloidin (Servicebio) for 2 h in the dark at room temperature, and counterstained with DAPI (Servicebio) for 10 min. Antifade solution was added to the coverslips to prevent quenching. Imaging was collected by fluorescent microscopy (Nikon Eclipse C1).
2.9. Quantitative real‐time PCR assays
TRIzol reagent was used to extract total RNA (Invitrogen). The procedure was carried out as previously described. 13 Table S1 lists the primer sequences used in this study.
2.10. Western blot analysis
We used RIPA buffer (CWbio) containing 0.1 mg/mL PMSF (Keygen), protease inhibitor, and Phospho‐stop to lyse cells individually (Roche). The WB approach was the same as in our prior study. 14 The following Abs were used: anti‐RAC1 (Proteintech 24,072‐1‐AP), anti‐FAK (Proteintech 12,636‐1‐AP), anti‐CSF (Proteintech 17,762‐1‐AP), anti‐TXNIP (Proteintech 18,243‐1‐AP), anti‐ITGA2 (Abcam ab133557), anti‐PAK (Abcam ab40852), anti‐pPAK (Abcam ab40795), and anti‐pFAK (CST 3283).
2.11. RNA sequencing and bioinformatics analysis
Total RNA was extracted using TRIzol as directed by the manufacturer. The sequence was done on the Illumina Hiseq platform. Differentially expressed genes were defined as those with a p value less than 5% and a fold change larger than 1. Gene Ontology enrichment analysis was carried out based on the Database for Annotation, Visualization and Integrated Discovery (DAVID).
The LUAD RNA‐seq gene expression profile and patient survival data were downloaded from the TCGA database (https://portal.gdc.cancer.gov/). SurvMiner is an R program for survival analysis. The data for GSEA were obtained from the TCGA. The clinical LUAD patients were divided into high and low groups based on the median BACH1 expression level.
The genes for which transcription factor BACH1 binds were gathered from metaclusters described in the Gene Transcription Regulation Database (https://gtrd.biouml.org/), which contains transcription factor binding sites identified by ChIP sequencing experiments for Homo sapiens. In addition, the promoter binding sites of BACH1 and target genes were predicted based on the JASPAR database.
2.12. Chromatin immunoprecipitation assay
The ChIP Kit (ab500; Abcam) was used for the ChIP experiments. For 10 min, PC9 cells were cross‐linked with 1% formaldehyde. Then glycine was added, and the cells were rinsed with ice‐cold PBS. The cells were lysed using an ice‐cold Cell Lysis Buffer that contained protease inhibitors, and the DNA was sheared into a range of 200–500 bp using a Vibra‐Cell sonicator (Sonics & Materials, Inc.). Chromatin fraction was then immunoprecipitated using BACH1 or IgG (ab172730; Abcam, 1:200 dilution) Abs overnight at 4°C, respectively. Incubation of the mixture used protein A beads. DNA was then purified after the Ab, chromatin, and beads had been incubated. Table S2 lists the specific primers to amplify regions of the ITGA2 promoter that contained predictive BACH1 binding sites. Afterward, 1% agarose gel electrophoresis was used to verify the PCR products.
2.13. Luciferase reporter assay
Fragments of the ITGA2 promotor containing BACH1 binding sites or mutant sites were amplified and cloned to the pGL3‐basic luciferase reporter vector (Promega). 293 T cells were cotransfected with the reporter vector and BACH1 vector using Lipofectamine 2000 (Invitrogen). After transfection for 48 h, the dual‐luciferase activity was detected according to the protocol using the Dual‐Luciferase Reporter assay system (Promega).
2.14. In vivo tumor metastasis
The mice were maintained under specific pathogen‐free conditions according to the Institutional Guidelines of the Animal Ethics Committee of Central South University. Female nude mice, 4–6 weeks old, were obtained from the Department of Laboratory Animals of Central South University. The research protocol was approved. PC9luc with lentivirus (1 × 10⁶ in 100 μL PBS) infection was injected into mice through the tail vein. Three nude mice were included in each group. Intraperitoneal injection of D‐luciferin potassium salt was used in locating and monitoring the tumor node (PerkinElmer). The mice were killed 30 days after the injection.
2.15. Statistical analysis
All statistical analyses were undertaken using SPSS 26.0 (IBM). Data are presented as mean ± SD. Student's t‐test was applied to compare the differences between two groups, and one‐way ANOVA when comparing more than two groups. The correlation between the expression level of BACH1 and the clinical features of LUAD patients was analyzed by the χ2‐test or Fisher's exact test. Kaplan–Meier analysis was used to assess survival. A p value <0.05 was considered statistically significant. For all statistics, data from at least three experiments were used.
3. RESULTS
3.1. BACH 1 is highly expressed and associated with poor clinicopathologic features and prognosis in LUAD
To investigate the importance of BACH1 in LUAD, we detected BACH1 protein expression by IHC in 90 LUAD patients' tumor tissues (Figure 1A). The results showed that BACH1 protein was highly expressed in LUAD compared to normal tissues (Figure 1B). Then we divided the patients into two groups according to the expression level of BACH1 in tumor tissue. High BACH1 protein expression was associated with poorer overall survival (Figure 1C). Based on the LUAD TCGA dataset, high BACH1 mRNA was also associated with poor prognosis (Figure S1 ). We collected the clinicopathologic characteristics of these patients in the TMA cohort, and the results revealed that patients with high expression of BACH1 showed significant correlation with lymph node metastasis (Table 1). All of the results suggested that BACH1 is highly expressed in LUAD and could be associated with LUAD metastasis.
FIGURE 1.

BACH1 expression is significantly upregulated in lung adenocarcinoma (LUAD) and negatively correlated with the overall survival (OS) of LUAD patients. (A) Tissue microarray for BACH1 Ab staining and representative scanned images with low or high BACH1 by immunohistochemistry (IHC). (B) BACH1 protein levels in adjacent (N) and tumor (T) tissue in tissue microarray (TMA) as examined by IHC (C) Kaplan–Meier survival curves showing the relationship between BACH1 protein level and OS in TMA from Shanghai Outdo Biotech. ***p < 0.001.
TABLE 1.
Clinicopathologic characteristics of enrolled patients.
| Clinicopathologic characteristic | Total (n = 65) | BACH1 | p value | |
|---|---|---|---|---|
| High a (n = 28) | Low a (n = 37) | |||
| Age, years | ||||
| ≤60 | 26 | 12 | 14 | 0.683 |
| >60 | 39 | 16 | 23 | |
| Gender | ||||
| Male | 38 | 16 | 22 | 0.851 |
| Female | 27 | 12 | 15 | |
| Differentiation | ||||
| High | 9 | 2 | 7 | 0.280 |
| Moderate and low | 56 | 26 | 30 | |
| T stage | ||||
| T1 | 16 | 6 | 10 | 0.872 |
| T2 | 33 | 14 | 19 | |
| T3 | 11 | 6 | 5 | |
| T4 | 5 | 2 | 3 | |
| Lymph node metastasis | ||||
| Negative | 31 | 9 | 22 | 0.029 b |
| Positive | 34 | 19 | 15 | |
| M stage | ||||
| M0 | 63 | 26 | 37 | 0.182 |
| M1 | 2 | 2 | 0 | |
High and low expression groups were determined by the cut‐off point, 50% of BACH1 in 65 tumor tissue specimens.
Statistical significance (p < 0.05).
3.2. BACH1 is not important for LUAD cell proliferation
To examine whether BACH1 regulates LUAD cell proliferation, we undertook stable BACH1 knockdown and stable overexpression of BACH1 in PC9 and H1975 LUAD cell lines. Neither the CCK‐8 analysis nor the colony formation assays, to determine whether BACH1 expression is increased or decreased in LUAD cells, showed significant statistical difference (Figure S2A–F). These results suggested that BACH1 has no affect in LUAD cell proliferation.
3.3. BACH1 promotes LUAD cell metastatic ability
Clinical data showed that overexpression of BACH1 is positively related to tumor metastasis. Therefore, we investigate the ability of BACH1 in the metastatic capacity in LUAD cells. We next generated stable BACH1 knockdown and stable overexpression of BACH1 in PC9 and H1975 LUAD cell lines (Figure 2A,C). The wound healing and Transwell assays evaluated the ability of LUAD cells to migrate and invade. As results showed, BACH1 knockdown in PC9 and H1975 cells significantly inhibited cell migration and invasion (Figure 2B,E,G). In contrast, BACH1 overexpression in PC9 and H1975 cells dramatically accelerated cell migration and invasion (Figure 2D,F,H). These results indicated that BACH1 promotes LUAD cell aggressiveness.
FIGURE 2.
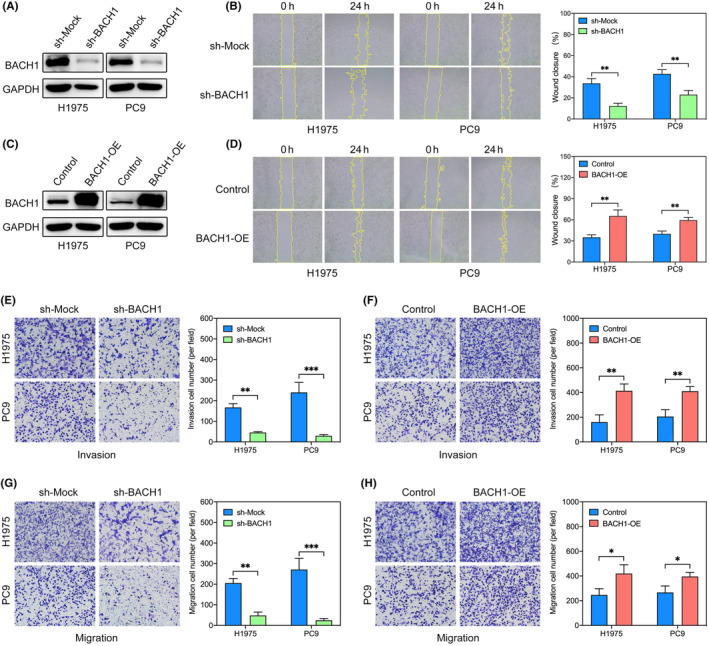
BACH1 promotes lung adenocarcinoma (LUAD) cell migration and invasion. (A, C) Western blot analysis validation of the knockdown or overexpression (OE) effect of BACH1 in H1975 and PC9 cells. (B, D) Quantification of wound healing assays in BACH1 knockdown or overexpression H1975 and PC9 cells. (E, F) Representative images and quantification of the Transwell invasion assay in BACH1 knockdown or overexpression H1975 and PC9 cells. (G, H) Representative images and quantification of the Transwell migration assay in BACH1 knockdown or overexpression H1975 and PC9 cells. *p < 0.05; **p < 0.01.
3.4. BACH1 contributes to actin cytoskeleton regulation in LUAD cells
To explore the underlying molecular functions and mechanisms regulated by BACH1 in LUAD, GSEA relied on the TCGA LUAD dataset and showed a strong correlation between high expression of BACH1 and regulation of the actin cytoskeleton pathway (Figure 3A). In addition, RNA‐seq was carried out using PC9 cells with BACH1 knockdown and control cells. The GO terms suggested that BACH1 regulates a group of genes implicated in metastatic‐related processes, such as cell migration and actin cytoskeleton organization, while its role in modulating the cell migration process might be realized through the regulation of actin cytoskeleton (Figure 3B).
FIGURE 3.

BACH1 promotes metastasis of lung adenocarcinoma (LUAD) cell through cytoskeleton regulation. (A) Gene Set Enrichment Analysis identified BACH1‐related signaling pathways based on The Cancer Genome Atlas LUAD dataset. (B) BACH1‐knockdown PC9 and sh‐Mock PC9 cells’ differentially expressed genes were considered for Gene Ontology analysis. (C) F‐actin staining with TRITC phalloidin in the BACH1 knockdown H1975 and PC9 cells (red). DAPI was used to stain nuclei (blue). (D, E) Adhesion of the BACH1 knockdown H1975 and PC9 cells on fibronectin (10 μg/mL) was analyzed at 0, 30, 60, and 120 min time points. **p < 0.01; ***p < 0.001. OD, optical density.
Based on the bioinformatical analysis, we used TRITC phalloidin to investigate the state of cytoskeletal protein F‐actin in LUAD cells. The results showed that BACH1 inhibition caused LUAD cells a significant decrease in expression levels of cytoskeletal protein F‐actin, as confirmed by weaker staining (Figure 3C). In contrast, the expression of F‐actin increased markedly in BACH1 upregulated LUAD cells (Figure S3A). In addition, we explored the ability of LUAD cell adhesion by using FN. BACH1 knockdown LUAD cells showed reduced adhesion to ECM component FN (Figure 3D,E), while BACH1 overexpression LUAD cells increased adhesion to FN (Figure S3B,C), confirming the role of BACH1 in LUAD cell adhesion. These results showed that BACH1 promotes LUAD metastasis through regulation of actin cytoskeleton.
3.5. Identification of BACH1 downstream targets in LUAD cell metastatic process
To identify the effectors’ transcriptional regulation by BACH1 in the LUAD metastasis process, we mined prior ChIP sequencing datasets for binding gene promoters by BACH1 protein from the GTRD dataset. Genes (n = 4407) were obtained which potential for BACH1 binding within the gene promoters. The RNA‐seq dataset revealed that 26 DEGs had fold change greater than or equal to 4. Next, a Venn diagram displayed the overlap and showed that there were only six genes in common (Figure 4A). A heat map showed that the expression changes of three genes, ITGA2, CSF2, and TXNIP, were consistent with BACH1 expression changes (Figure 4B). We validated the expression changes of the three genes in response to BACH1 knockdown or overexpression in LUAD cells by qRT‐PCR and WB analysis (Figure S4A). Among these three genes, the expression of ITGA2 was both downregulated in BACH1 knockdown cells and upregulated in BACH1 overexpression cells in PC9 and H1975 cell lines. In addition, ITGA2 expression was most significantly altered (Figure 4C,D).
FIGURE 4.

BACH1 directly targets ITGA2 and activates the focal adhesion kinase (FAK) signaling pathway. (A) Venn diagram depicts the overlap between BACH1‐binding genes and differentially expressed genes (DEGs) following BACH1 silencing. (B) Cluster analysis of potential target genes on BACH1 silencing in PC9 cells. (C) Quantitative RT‐PCR analysis of potential BACH1‐binding genes in H1975 and PC9 cells with BACH1 knockdown or overexpression. (D) Western blot (WB) analysis of potential BACH1‐binding genes in H1975 and PC9 cells with BACH1 knockdown or overexpression (OE). (E) Agarose gel electrophoresis showed ChIP assays determining BACH1 binding to the ITGA2 promoter in PC9 cells. B‐BS, BACH1 binding site. (F) Sequence of predicted BACH1‐binding site 2 on ITGA2 promoter (B‐BS2‐wt) and the corresponding mutant sequence (B‐BS2‐mut) constructed in the pGL3‐basic luciferase reporter vector. (G) 293 T were cotransfected with either control (p‐ctrl) or p‐BACH1 in conjunction with pGL3‐ITGA2‐B‐BSs‐wt or pGL3‐ITGA2‐BBS2‐mut. Results were expressed as fold change to negative control (NC) after normalizing firefly luciferase activity to Renilla luciferase activity. (H) WB analysis of FAK, pFAK, RAC1, P21‐activated kinase (PAK), and pPAK protein level in BACH1 knockdown H1975 and PC9 cells. (I) WB analysis of FAK, pFAK, RAC1, PAK, and pPAK protein level in BACH1 overexpression H1975 and PC9 cells. **p < 0.01; ***p < 0.001. ns, not significant.
Next, to verify whether BACH1 bound to the region in ITGA2 promoter as predicted by JASPAR in which there were three potential motifs, by ChIP‐qPCR assay in LUAD cells, we found that BACH1 interacted with the region 1.191 kb upstream of transcriptional start site in ITGA2 (Figure 4E). Luciferase analysis was next used to determine whether BACH1 transcriptionally regulated ITGA2 through binding on the region of ITGA2 promoter determined by CHIP‐qPCR. The results showed that BACH1 overexpression significantly increased the luciferase activity, while the effect was abolished by the mutant of predicted sites (Figure 4F,G).
3.6. BACH1‐ITGA2 axis participates in metastasis of LUAD cells through FAK signaling pathway
Activation of FAK in cancers occurs through the well described mechanisms following engagement of integrin‐mediated cell adhesions. 15 , 16 Our WB analysis revealed that BACH1 silenced in LUAD cells reduced the expression of ITGA2. At the same time, the FAK level did not change significantly, but the expression of pFAK reduced obviously (Figure 4H). Then we sought to determine whether BACH1 regulated F‐actin by activating the Rho GTPase family member RAC1, which plays a critical role in actin network organization. 17 , 18 , 19 , 20 Western blot analysis showed that the protein levels of RAC1 were reduced in BACH1 knockdown PC9 and H1975 cells. In contrast, the levels of RAC1 proteins were both increased in PC9 and H1975 cells with BACH1 overexpression (Figure 4H,I). Phosphorylation of PAK1, a molecular target of active RAC1, also dramatically declined in BACH1 knockdown LUAD cells, while the PAK1 level failed to significantly change (Figure 4H). In BACH1 overexpression LUAD cells, ITAG2, pFAK, and pPAK1 levels increased significantly compared to control LUAD cells (Figure 4I). In addition, WB quantitative analysis results are provided (Figure S4B,C). These results suggested that the BACH1‐ITAG2 axis regulates the LUAD cell metastatic process through FAK‐RAC1‐PAK1 signaling.
3.7. ITGA2 facilitates LUAD cell metastatic ability
To further validate the role of ITGA2 in LUAD metastasis regulation, we silenced ITGA2 expression in PC9 and H1975 cells (Figure 5A). ITGA2 knockdown in PC9 and H1975 cells showed significantly reduced migratory and invasive capabilities, compared to control cells (Figure 5B–D). In addition, the results of the F‐actin staining in ITGA2 knockdown PC9 and H1975 cells were consistent with the actin cytoskeleton phenotypes of PC9 and H1975 cells with downregulated BACH1 (Figure 5E). Similarly, ITGA2‐knockdown reduced the cell adhesion ability in PC9 and H1975 cells (Figure 5F,G). These results indicated that ITGA2 promotes LUAD cell metastasis through regulation of the actin cytoskeleton, a finding that is consistent with the role of BACH1 in LUAD cells.
FIGURE 5.

ITGA2 promotes metastasis of lung adenocarcinoma cell through cytoskeleton regulation. (A) Western blot analysis validation of the knockdown effect of ITGA2 in H1975 and PC9 cells. (B) Quantification of wound healing assays in ITGA2 knockdown H1975 and PC9 cells. (C) Representative images and quantification of the Transwell invasion assay in ITGA2 knockdown H1975 and PC9 cells. (D) Representative images and quantification of the Transwell migration assay in ITGA2 knockdown H1975 and PC9 cells. (E) F‐actin staining with TRITC phalloidin in the ITGA2 knockdown H1975 and PC9 cells (red). DAPI was used to stain nuclei (blue). (F, G) Adhesion of the ITGA2 knockdown H1975 and PC9 cells on fibronectin (10 μg/mL) was analyzed at 0, 30, 60, and 120 min time points. *p < 0.05; **p < 0.01; ***p < 0.001.
3.8. BACH1 promotes metastatic ability of LUAD cells dependent on ITAG2 expression
To assess the function of ITGA2 in the BACH1‐mediated acceleration of LUAD metastasis, we downregulated ITGA2 expression in BACH1 overexpression PC9 and H1975 cells (Figure S5A–D). As shown in the results, the cell migration and invasion induced by BACH1 overexpression were partially weakened by ITGA2 knockdown in Transwell and wound healing assays (Figure 6A–C). In addition, WB results showed that decreased ITGA2 expression could reverse the expression of pFAK, RAC1, and pPAK activated by BACH1 (Figures 6D,E and S6A,B). In line with these observations, decreased expression of ITGA2 also partially abolished BACH1‐mediated regulation of cytoskeleton fibers in cells, as showed by weaker staining of F‐actin (Figure 7A). Moreover, the cell adhesion ability was attenuated (Figure 7B,C). These results further proved that BACH1 promotes LUAD cell metastasis depending on the expression of ITGA2.
FIGURE 6.

BACH1 depends on ITGA2 expression to promote metastasis of lung adenocarcinoma cell. (A) Quantification of the wound healing assays using transfected H1975/PC9 cells. (B) Representative images and quantification of the Transwell invasion assays using transfected H1975/PC9 cells. (C) Representative images and quantification of the Transwell assays using transfected H1975/PC9 cells. (D, E) Western blot analysis of focal adhesion kinase (FAK), pFAK, RAC1, P21‐activated kinase (PAK), and pPAK protein level using transfected H1975/PC9 cells. *p < 0.05; **p < 0.01; ***p < 0.001.
FIGURE 7.

BACH1 depends on ITGA2 expression to regulate lung adenocarcinoma cell cytoskeleton. (A) F‐actin staining with TRITC phalloidin using transfected H1975/PC9 cells (red). DAPI was used to stain nuclei (blue). (B, C) Adhesion of the transfected H1975/PC9 cells on fibronectin (10 μg/mL) was analyzed at 0, 30, 60, and 120 min time points. *p < 0.05; **p < 0.01; ***p < 0.001. OD, optical density; OE, overexpression.
3.9. ITGA2 downregulation alleviates BACH1‐induced LUAD metastatic ability in vivo
After finding that ITGA2 can decrease BACH1 induced metastatic ability in LUAD cells, we sought to prove whether the same result can be observed in vivo. We established four groups nude mice models for injecting PC9 cells transduced with lentivirus through the tail vein: sh‐Mock + Control, BACH1‐OE + sh‐Mock, sh‐ITGA2 + Control, and BACH1‐OE + sh‐ITGA2. All mice were assessed by bioluminescence imaging. Compared to sh‐Mock+Control, BACH1‐OE + sh‐Mock injected mice showed more luminescence intensity (Figure 8A). Also, BACH1‐OE + sh‐ITGA2 mice had fewer metastatic tumor nodes compared to BACH1‐OE + sh‐Mock mice (Figure 8B,C).
FIGURE 8.

ITGA2 downregulation alleviates BACH1 induced lung adenocarcinoma metastatic ability in vivo. (A) Representative luciferase images and quantification of average luciferase intensity of lungs in the in vivo metastasis assay. (B, C) Representative photographs and quantification of metastatic tumor nodes in mouse lungs from the in vivo metastasis assay. The blue arrows indicate tumor nodules. **p < 0.01; ***p < 0.001. OE, overexpression.
4. DISCUSSION
The function of BACH1 as a transcription factor has been described in different kinds of cancers. In this study, we found that BACH1 can transcriptionally regulate the expression of ITGA2 and then control the invasion and migration of LUAD cells through the regulation of the actin cytoskeleton through the FAK‐RAC1‐PAK1 signaling pathway.
We first explored the expression and clinical significance of BACH1 in LUAD patients. The results showed that BACH1 is highly expressed in LUAD and that high BACH1 expression is associated with less favorable clinical features and poor prognosis. Then, we explored the function of BACH1 in LUAD cell lines. The results revealed that BACH1 had no effect on LUAD cell proliferation. However, given the association between the expression level of BACH1 and lymph node metastasis in LUAD, we further evaluated the ability of BACH1 to regulate the invasion and migration of LUAD cells. In wound healing and Transwell assays, the results showed that downregulating or upregulating the expression of BACH1 can significantly decrease or increase, respectively, the invasive and migratory abilities of LUAD cell lines. In addition, BACH1 was proven to increase the migration and invasion abilities in vivo. Similar observations were verified in pancreatic cancer and esophageal cancer. 8 , 21
Cell migration requires changes to the actin cytoskeleton, which provides the major driving force for migration in cancer. 22 The assembly of F‐actin is a necessary condition for process dynamics, cell morphology, and cell migration. 23 , 24 We found that BACH1 expression was positively correlated with the regulation of the actin cytoskeleton according to GSEA. Furthermore, GO analysis indicated that BACH1 can serve as an activator of actin cytoskeleton regulation in the LUAD metastatic process. Similar relationships were explored in the TCGA dataset. 25 This study showed that when BACH1 was knocked down, the number of actin fibers was reduced in LUAD cells, whereas BACH1 overexpression substantially increased the number of actin fibers. In addition, BACH1 could serve as an activator of cell adhesion to the ECM. These results implied that BACH1 promotes LUAD cell migration and invasion through regulation of the cytoskeleton.
To investigate the molecular mechanism by which BACH1 regulates LUAD metastasis, we screened for potential BACH1 target genes in the GTRD database and among the DEGs identified by RNA‐seq. BACH1 can function as a transcription factor by activating or repressing target gene transcription. 4 In our study, we found that ITGA2 could be the target gene of BACH1 transcriptional regulation. In addition, we verified that BACH1 knockdown or overexpression decreased or increased, respectively, the mRNA and protein expression of ITAG2 in LUAD cell lines. Hence, we speculated that BACH1 is the transcriptional activator of ITGA2. Next, we clarified that BACH1, acting as a transcription factor binding to the promoter region of ITGA2, promoted the transcription of ITGA2. Abnormal expression of integrins alters the ability of cell adhesion and the rate of cell migration, which is particularly related to cancer development and progression. 26 Integrin 2 (ITGA2) encodes integrin alpha 2, a transmembrane protein mediating cell adhesion to the ECM that can heterodimerize with the beta 1 subunit of integrin α2β1. 27 , 28 Overexpression of ITGA2 is associated with cancer cell migration and invasion. Inhibiting ITGA2 was reported to decrease gastric cancer cell migration and metastasis by reducing actin polymerization through the RAC1/CDC42 signaling pathway. 29 In the current study, we confirmed that ITGA2 can also promote the migration and invasion of LUAD cells by regulating the cytoskeleton. In addition, the effect of BACH1 overexpression on migration, invasion, adhesion, and actin fiber staining in LUAD cell lines were partially abolished by ITGA2 silencing, implying that BACH1 promotes cell motility and F‐actin assembly at least in partially through ITGA2.
Furthermore, our data confirmed that BACH1 acts as a transcriptional activator to regulate the expression of ITGA2, which subsequently regulates the cytoskeleton and thus affects the process of LUAD metastasis. Our results showed that BACH1 can transcriptionally activate ITGA2 expression, leading to cytoskeletal changes. Integrin signaling can also regulate the production and organization of actin filaments to affect cell motility through various pathways, including actin polymerization. 30 , 31 The interactions between FAK and integrins and cytoskeletal proteins at focal adhesions is responsible for FAK activation and its autophosphorylation at its cytoplasmic tails by integrins during cell adhesion events. 32 , 33 , 34 Focal adhesion kinase signaling plays a role in the signaling cascades that affect invasion and migration and controls actin dynamics. 35 In our experiments, we observed that suppressing the BACH1‐ITAG2 axis reduced the level of pFAK and activity of the RAC1 pathway. The expression of ITGA2, pFAK, and RAC1 was also increased when BACH1 was overexpressed. Focal adhesion kinase undergoes tyrosine phosphorylation and performs its kinase function, subsequently activating a complex signaling cascade to regulate cell migration; RAC1 can be activated during this process. 36 , 37 , 38 Our results are consistent with previous results showing that FAK is a key upstream factor for RAC1 activation. 39 , 40 The Rho GTPase family member RAC1 plays a key role in the dynamic reorganization of the actin cytoskeleton. 41 We further confirmed that PAK1 acts as a downstream effector of RAC1 and found that PAK1 phosphorylation was inhibited in the context of BACH1 knockdown and enhanced in the context of BACH1 overexpression. When RAC1 binds to PAK1, a conformational change and subsequent autophosphorylation of a number of serine and/or threonine residues in PAK1 occur, activating PAK1 to carry out its biological functions, which include changing the dynamics of the cytoskeleton. 42 , 43 In our study, we elucidated that BACH1 acts as a transcription factor to regulate ITGA2 expression, thereby regulating LUAD cell migration and invasion through the FAK‐RAC1‐PAK signaling pathway and influencing cytoskeletal arrangement.
FUNDING INFORMATION
This work was supported by the National Natural Science Foundation of China (No. 81472774) and Natural Science Foundation of Hunan Province (2021JJ40919).
CONFLICT OF INTEREST STATEMENT
The authors declare no conflict of interest.
ETHICS STATEMENT
Approval of the research protocol by an institutional review board: The study was approved by the Ethics Committee of Central South University.
Informed consent: N/A.
Registry and registration no. of the study/trial: N/A.
Animal studies: The study followed the Institutional Guidelines of the Animal Ethics Committee of Central South University and the research protocol was approved (no. 2021sydw0244).
Supporting information
Appendix S1
ACKNOWLEDGEMENTS
We thank all individuals who participate in this research and funding from National Natural Science Foundation of China (No. 81472774) and Natural Science Foundation of Hunan Province (2021JJ40919).
Chen Y, Jin L, Ma Y, et al. BACH1 promotes lung adenocarcinoma cell metastasis through transcriptional activation of ITGA2 . Cancer Sci. 2023;114:3568‐3582. doi: 10.1111/cas.15884
REFERENCES
- 1. Bray F, Ferlay J, Soerjomataram I, Siegel RL, Torre LA, Jemal A. Global cancer statistics 2018: GLOBOCAN estimates of incidence and mortality worldwide for 36 cancers in 185 countries. CA Cancer J Clin. 2018;68:394‐424. [DOI] [PubMed] [Google Scholar]
- 2. Zhou C. Lung cancer molecular epidemiology in China: recent trends. Transl Lung Cancer Res. 2014;3:270‐279. [DOI] [PMC free article] [PubMed] [Google Scholar]
- 3. Siegel RL, Miller KD, Fuchs HE, Jemal A. Cancer statistics, 2021. CA Cancer J Clin. 2021;71:7‐33. [DOI] [PubMed] [Google Scholar]
- 4. Oyake T, Itoh K, Motohashi H, et al. Bach proteins belong to a novel family of BTB‐basic leucine zipper transcription factors that interact with MafK and regulate transcription through the NF‐E2 site. Mol Cell Biol. 1996;16:6083‐6095. [DOI] [PMC free article] [PubMed] [Google Scholar]
- 5. Kobayashi M, Kato H, Hada H, et al. Iron‐heme‐Bach1 axis is involved in erythroblast adaptation to iron deficiency. Haematologica. 2017;102:454‐465. [DOI] [PMC free article] [PubMed] [Google Scholar]
- 6. Lee J, Yesilkanal AE, Wynne JP, et al. Effective breast cancer combination therapy targeting BACH1 and mitochondrial metabolism. Nature. 2019;568:254‐258. [DOI] [PMC free article] [PubMed] [Google Scholar]
- 7. Zhu GD, Liu F, OuYang S, et al. BACH1 promotes the progression of human colorectal cancer through BACH1/CXCR4 pathway. Biochem Biophys Res Commun. 2018;499:120‐127. [DOI] [PubMed] [Google Scholar]
- 8. Sato M, Matsumoto M, Saiki Y, et al. BACH1 promotes pancreatic cancer metastasis by repressing epithelial genes and enhancing epithelial‐mesenchymal transition. Cancer Res. 2020;80:1279‐1292. [DOI] [PubMed] [Google Scholar]
- 9. Shajari N, Davudian S, Kazemi T, et al. Silencing of BACH1 inhibits invasion and migration of prostate cancer cells by altering metastasis‐related gene expression. Artif Cells Nanomed Biotechnol. 2018;46:1495‐1504. [DOI] [PubMed] [Google Scholar]
- 10. Han W, Zhang Y, Niu C, et al. BTB and CNC homology 1 (Bach1) promotes human ovarian cancer cell metastasis by HMGA2‐mediated epithelial‐mesenchymal transition. Cancer Lett. 2019;445:45‐56. [DOI] [PubMed] [Google Scholar]
- 11. Lignitto L, LeBoeuf SE, Homer H, et al. Nrf2 activation promotes lung cancer metastasis by inhibiting the degradation of Bach1. Cell. 2019;178(2):316‐329.e18. [DOI] [PMC free article] [PubMed] [Google Scholar]
- 12. Wiel C, Le Gal K, Ibrahim MX, et al. BACH1 stabilization by antioxidants stimulates lung cancer metastasis. Cell. 2019;178:330‐345.e22. [DOI] [PubMed] [Google Scholar]
- 13. Chen Y, Ji Y, Liu S, Liu Y, Feng W, Jin L. PTBP3 regulates proliferation of lung squamous cell carcinoma cells via CDC25A‐mediated cell cycle progression. Cancer Cell Int. 2022;22:19. [DOI] [PMC free article] [PubMed] [Google Scholar]
- 14. Feng W, Xie Q, Liu S, et al. Kruppel‐like factor 4 promotes c‐met amplification‐mediated gefitinib resistance in non‐small‐cell lung cancer. Cancer Sci. 2018;109:1775‐1786. [DOI] [PMC free article] [PubMed] [Google Scholar]
- 15. Feng X, Arang N, Rigiracciolo DC, et al. A platform of synthetic lethal gene interaction networks reveals that the GNAQ uveal melanoma oncogene controls the hippo pathway through FAK. Cancer Cell. 2019;35(3):457‐472.e5. [DOI] [PMC free article] [PubMed] [Google Scholar]
- 16. Zhang H, Schaefer A, Wang Y, et al. Gain‐of‐function RHOA mutations promote focal adhesion kinase activation and dependency in diffuse gastric cancer. Cancer Discov. 2020;10:288‐305. [DOI] [PMC free article] [PubMed] [Google Scholar]
- 17. Nobes CD, Hall A. Rho, rac, and cdc42 GTPases regulate the assembly of multimolecular focal complexes associated with Actin stress fibers, lamellipodia, and filopodia. Cell. 1995;81:53‐62. [DOI] [PubMed] [Google Scholar]
- 18. Keely PJ, Westwick JK, Whitehead IP, Der CJ, Parise LV. Cdc42 and Rac1 induce integrin‐mediated cell motility and invasiveness through PI(3)K. Nature. 1997;390:632‐636. [DOI] [PubMed] [Google Scholar]
- 19. Machesky LM, Hall A. Role of Actin polymerization and adhesion to extracellular matrix in Rac‐ and rho‐induced cytoskeletal reorganization. J Cell Biol. 1997;138:913‐926. [DOI] [PMC free article] [PubMed] [Google Scholar]
- 20. Kazanietz MG, Caloca MJ. The Rac GTPase in cancer: from old concepts to new paradigms. Cancer Res. 2017;77:5445‐5451. [DOI] [PMC free article] [PubMed] [Google Scholar]
- 21. Zhao Y, Gao J, Xie X, et al. BACH1 promotes the progression of esophageal squamous cell carcinoma by inducing the epithelial‐mesenchymal transition and angiogenesis. Cancer Med. 2021;10:3413‐3426. [DOI] [PMC free article] [PubMed] [Google Scholar]
- 22. Lawson CD, Ridley AJ. Rho GTPase signaling complexes in cell migration and invasion. J Cell Biol. 2018;217:447‐457. [DOI] [PMC free article] [PubMed] [Google Scholar]
- 23. Bugyi B, Carlier MF. Control of Actin filament treadmilling in cell motility. Annu Rev Biophys. 2010;39:449‐470. [DOI] [PubMed] [Google Scholar]
- 24. Le Clainche C, Carlier MF. Regulation of Actin assembly associated with protrusion and adhesion in cell migration. Physiol Rev. 2008;88:489‐513. [DOI] [PubMed] [Google Scholar]
- 25. Zhou J, Liu Z, Zhang H, et al. BACH1: a potential predictor of survival in early‐stage lung adenocarcinoma. Oxid Med Cell Longev. 2022;2022:3921095. [DOI] [PMC free article] [PubMed] [Google Scholar]
- 26. Hynes RO. Integrins: bidirectional, allosteric signaling machines. Cell. 2002;110:673‐687. [DOI] [PubMed] [Google Scholar]
- 27. Campbell ID, Humphries MJ. Integrin structure, activation, and interactions. Cold Spring Harb Perspect Biol. 2011;3(3):a004994. [DOI] [PMC free article] [PubMed] [Google Scholar]
- 28. Tuckwell D, Calderwood DA, Green LJ, Humphries MJ. Integrin alpha 2 I‐domain is a binding site for collagens. J Cell Sci. 1995;108(Pt 4):1629‐1637. [DOI] [PubMed] [Google Scholar]
- 29. Chuang YC, Wu HY, Lin YL, et al. Blockade of ITGA2 induces apoptosis and inhibits cell migration in gastric cancer. Biol Proced Online. 2018;20:10. [DOI] [PMC free article] [PubMed] [Google Scholar]
- 30. Pollard TD. Regulation of Actin filament assembly by Arp2/3 complex and formins. Annu Rev Biophys Biomol Struct. 2007;36:451‐477. [DOI] [PubMed] [Google Scholar]
- 31. Vicente‐Manzanares M, Choi CK, Horwitz AR. Integrins in cell migration – the Actin connection. J Cell Sci. 2009;122:199‐206. [DOI] [PMC free article] [PubMed] [Google Scholar]
- 32. Zhao JH, Reiske H, Guan JL. Regulation of the cell cycle by focal adhesion kinase. J Cell Biol. 1998;143:1997‐2008. [DOI] [PMC free article] [PubMed] [Google Scholar]
- 33. Zheng C, Xing Z, Bian ZC, et al. Differential regulation of Pyk2 and focal adhesion kinase (FAK). The C‐terminal domain of FAK confers response to cell adhesion. J Biol Chem. 1998;273:2384‐2389. [DOI] [PubMed] [Google Scholar]
- 34. Lietha D, Cai X, Ceccarelli DF, Li Y, Schaller MD, Eck MJ. Structural basis for the autoinhibition of focal adhesion kinase. Cell. 2007;129:1177‐1187. [DOI] [PMC free article] [PubMed] [Google Scholar]
- 35. Burridge K. Focal adhesions: a personal perspective on a half century of progress. FEBS J. 2017;284:3355‐3361. [DOI] [PMC free article] [PubMed] [Google Scholar]
- 36. Huveneers S, Danen EH. Adhesion signaling—crosstalk between integrins, Src and rho. J Cell Sci. 2009;122:1059‐1069. [DOI] [PubMed] [Google Scholar]
- 37. Lawson CD, Burridge K. The on‐off relationship of rho and Rac during integrin‐mediated adhesion and cell migration. Small GTPases. 2014;5:e27958. [DOI] [PMC free article] [PubMed] [Google Scholar]
- 38. Mitra SK, Schlaepfer DD. Integrin‐regulated FAK‐Src signaling in normal and cancer cells. Curr Opin Cell Biol. 2006;18:516‐523. [DOI] [PubMed] [Google Scholar]
- 39. Hall JE, Fu W, Schaller MD. Focal adhesion kinase: exploring Fak structure to gain insight into function. Int Rev Cell Mol Biol. 2011;288:185‐225. [DOI] [PubMed] [Google Scholar]
- 40. Koshman YE, Kim T, Chu M, et al. FRNK inhibition of focal adhesion kinase‐dependent signaling and migration in vascular smooth muscle cells. Arterioscler Thromb Vasc Biol. 2010;30:2226‐2233. [DOI] [PMC free article] [PubMed] [Google Scholar]
- 41. Liang J, Oyang L, Rao S, et al. Rac1, a potential target for tumor therapy. Front Oncol. 2021;11:674426. [DOI] [PMC free article] [PubMed] [Google Scholar]
- 42. Yao D, Li C, Rajoka MSR, et al. P21‐activated kinase 1: emerging biological functions and potential therapeutic targets in cancer. Theranostics. 2020;10:9741‐9766. [DOI] [PMC free article] [PubMed] [Google Scholar]
- 43. Radu M, Semenova G, Kosoff R, Chernoff J. PAK signalling during the development and progression of cancer. Nat Rev Cancer. 2014;14:13‐25. [DOI] [PMC free article] [PubMed] [Google Scholar]
Associated Data
This section collects any data citations, data availability statements, or supplementary materials included in this article.
Supplementary Materials
Appendix S1