

Abstract
Pancreatic neuroendocrine neoplasms (pNENs) are among the most frequently occurring neuroendocrine neoplasms (NENs) and require targeted therapy. High levels of fatty acid binding protein 5 (FABP5) are involved in tumor progression, but its role in pNENs remains unclear. We investigated the mRNA and protein levels of FABP5 in pNEN tissues and cell lines and found them to be upregulated. We evaluated changes in cell proliferation using CCK‐8, colony formation, and 5‐ethynyl‐2′‐deoxyuridine assays and examined the effects on cell migration and invasion using transwell assays. We found that knockdown of FABP5 suppressed the proliferation, migration, and invasion of pNEN cell lines, while overexpression of FABP5 had the opposite effect. Co‐immunoprecipitation experiments were performed to clarify the interaction between FABP5 and fatty acid synthase (FASN). We further showed that FABP5 regulates the expression of FASN via the ubiquitin proteasome pathway and both proteins facilitate the progression of pNENs. Our study demonstrated that FABP5 acts as an oncogene by promoting lipid droplet deposition and activating the WNT/β‐catenin signaling pathway. Moreover, the carcinogenic effects of FABP5 can be reversed by orlistat, providing a novel therapeutic intervention option.
Keywords: FABP5, FASN, lipid metabolism, pancreatic neuroendocrine neoplasms, WNT/β‐catenin pathway
This study showed that FABP5 might play a role of oncogene through playing an auxo‐action for the deposition of lipid droplets and FABP5 is involved in activating the WNT/β‐catenin pathway. Moreover, those carcinogenic effects of FABP5 can be reversed by orlistat, providing novel choice for therapeutic intervention.

Abbreviations
- Co‐IP
co‐immunoprecipitation
- EdU
5‐ethynyl‐2′‐deoxyuridine
- FA
fatty acid
- FABP5
fatty acid binding protein 5
- FABPs
fatty acid binding proteins
- FASN
fatty acid synthase
- NENs
neuroendocrine neoplasms
- pNENs
pancreatic neuroendocrine neoplasms
- qRT‐PCR
quantitative real‐time PCR
- WB
western blot
1. INTRODUCTION
Neuroendocrine neoplasms are tumors originating from neuroendocrine cells located throughout the body, Pancreatic neuroendocrine neoplasms are among the most common types of NENs, displaying significant heterogeneity. 1 The incidence of pNENs has risen considerably in recent decades, accounting for over 3% of pancreatic malignancies, due to advancements in diagnostic methods. 2 Notably, recent research has revealed several potential novel biomarkers, such as INSM1 and CDK5, and implicated some new signaling pathways, including TGF‐beta and the NOTCH pathway, as being relevant to the tumorigenesis of pNENs. 3 , 4 , 5 , 6 Despite these advances, current treatment options for the medical management of pNENs remain limited in their sensitivity and specificity. Therefore, there is an urgent need to identify novel biomarkers.
FABPs are 14–15 kDa cytoplasmic proteins capable of transporting lipids into specific compartments of the cell, storing lipid droplets, sending signals inside or outside the cells, promoting the synthesis of the membrane, regulating the activity of other enzymes or the transcription mediated by lipids and so forth. 7 Among FABPs, FABP5, also regarded as epidermal fatty acid binding protein, is one of the hypotypes of FABPs, expressing in many issues and organs. 8 Over the past few decades, FABP5 has been found to play an indispensable role in lipid metabolism, metabolic syndrome, cell growth, cell differentiation, immune response, neurite outgrowth, axon development, an inflammatory cytokine and, at the same time, in the tumorigenesis and cancer development. 9 Since then, FABP5 has been found to be an oncogene in multiple malignant tumors including cervical cancer, gastric cancer, prostate cancer, bladder cancer, and breast cancer, 10 , 11 , 12 , 13 , 14 , 15 , 16 through many pathways including the MMP‐2/MMP‐9, PI3K/AKT, NF‐κB and peroxisome proliferator‐activated receptors (PPARS) pathways. 9 , 17 While the role of FABP5 in pNENs is still unknown.
In the present study, FABP5 was further confirmed as an oncogene participating in pNEN development through the WNT/β‐catenin pathway. Moreover, we revealed that FASN interacts with FABP5 and is positively regulated by FABP5. Orlistat, known as an inhibitor of FASN, can reverse the carcinogenesis caused by overexpression of FABP5 in pNENs, an approach that might bring new inspiration for treatment.
2. MATERIALS AND METHODS
2.1. Cell lines and human tissues
The Human Pancreatic Nestin‐Expressing ductal cells line (HPNE) was obtained from the ATCC (CBP60857). The human pNEN‐derived QGP‐1 cell line has been registered with the Japanese Collection of Research Bioresources (JCRB) cell bank (JCRB0183). The STC‐1 cell line was purchased from the ATCC (CRL‐3254). Furthermore, we isolated primary human pNEN cells (PNET) from neoplasms tissues of consenting patients diagnosed with pNENs (Table S1), using the methods already described, 18 the study protocol was approved by the Ethics Committee/Institution of The First Affiliated Hospital of Nanjing Medical University. HPNE and QGP‐1 cell lines were maintained in RPMI‐1640 medium (Gibco), PNET cells were maintained in McCoy's 5A medium (Gibco), STC‐1 cells were maintained in DMEM (Gibco), supplemented with 10% FBS and 1% penicillin–streptomycin at 37°C, in 5% CO2.
2.2. Construction of stably transfected cell lines
FABP5 overexpression plasmids were constructed in the PLVX vector by Genomeditech. FABP5 and FASN knockdown plasmids were constructed in the PLKO1 vector by Genomeditech, 293T cells were used for lentivirus packaging with 1‐PEI. Stably transfected cells were acquired after being screened with puromycin and verified by WB.
2.3. Quantitative real‐time PCR
Total RNA was extracted using TRIzol reagent (Life), 5× gDNA digester (Yeasen) was used to erase genomic DNA along with the procedure carried out at 42°C for 2 min before adding 4xHifair® III SuperMix plus (Yeasen) followed by 37°C for 15 min and 85°C for 5 s for reverse transcription to synthesize cDNA. Quantitative real‐time PCR was performed using a Roche instrument and the SYBR Green PCR master mix (Yeasen); the procedures were as follows: 95°C for 5 min, 35 cycles at 95°C for 30 s, 58°C for 30 s, and 72°C for 30 s. GAPDH was used as the internal control. Primer sequences are listed in Table S2.
2.4. Western blotting
All proteins were extracted using RIPA buffer containing 1% 100 mM PMSF (Beyotime). An equal amount of protein was loaded on 10% SDS‐PAGE gels and electrotransferred onto a nitrocellulose filter membrane after separation. Membranes were blocked with 8% defatted milk (4 g milk powder in 50 mL TBS Tween‐20 buffer) for 1–2 h then incubated with primary antibodies overnight at 4°C. Then the membranes were washed with TBS Tween three times and each for 10 min. Afterward, the band was incubated with anti‐rabbit IgG or anti‐mouse IgG for 60 min at room temperature. All antibodies used are listed in Table S3. Images were developed by adding enhanced chemiluminescence (NCM Biotech) with Image Laboratory Software.
2.5. Immunofluorescence
In total, 2 × 10⁴ cells were plated into a 24‐well plate and incubated overnight with 200 μL hybridization solution, the slides were then fixed in 4% paraformaldehyde. After PBS‐Tween (PBST) washing, slides were permeabilized with 0.5% Triton X‐100 and then blocked with goat serum for 30 min. After blocking, the slides were incubated with primary antibodies, followed by a 1‐h incubation with CoraLite488‐conjugated goat anti‐rabbit IgG (Proteintech). After incubation with Hoechst 33342 stain for 30 min, images were randomly selected using a fluorescence microscope (Olympus Optical).
2.6. CCK‐8 assay
The proliferation of QGP‐1, PNET or STC‐1 cells was detected using CCK‐8 kits (Yeasen) according to the accompanying protocol. In total, 5 × 10³ QGP‐1 cells, 2.5 × 10³ PNET or 5 × 10³ STC‐1 cells were cultured in 96‐well cell culture plates with 100 μL medium. After treatment with 10 μL CCK8 reagent for 2 h, the cell quantity was detected using a microplate reader.
2.7. Colony formation assay
For cloning formation experiments, 1 × 10³ QGP‐1, PNET or STC‐1 cells per well were cultured in 6‐well cell culture plates for 14 days, the cells were fixed in 4% paraformaldehyde for 20 min and then stained with 0.25% crystal violet for 30 min.
2.8. EdU incorporation assay
For EdU assays, cells were treated with 50 μM EdU (RiboBo) medium at 37°C for 2 h, then cells were fixed in 4% paraformaldehyde. After permeabilizing the cells with 0.5% Triton X‐100, the cells were reacted with 1× Apollo reaction cocktail (RiboBo) for 30 min. Finally, the cells were reacted with Hoechst 33342 stain for 30 min to stain the DNA content of the cells and then visualized using a fluorescence microscope. The pictures were taken from random microscopic fields.
2.9. Migration and invasion assays
In total, 2 × 10⁵ QGP‐1, 2 × 10⁴ PNET, or 2 × 10⁵ STC‐1 cells per transwell chamber (Corning) were seeded for migration assays and 4 × 10⁵ QGP‐1, 4 × 10⁴ PNET or 4 × 10⁵ STC‐1 cells per chamber with Matrigel‐coated (BD) filters diluted with relative medium in a ratio of 1:5 were seeded for invasion assays. Cells were seeded in the upper chamber with 200 μL serum‐free medium and 600 μL medium containing 30% FBS was added to the lower chamber. After 48 h, cells on the lower membrane were fixed and stained, all images were taken from a random field of view.
2.10. Co‐immunoprecipitation
The same amounts of QGP‐1 cell lysates were incubated with normal IgG antibody or anti‐FABP5 antibody or anti‐FASN antibody and then rotated at 4°C for 2 h. After that, 50 μL protein A/G agarose beads (Beyotime) were added to each tube, rotating at 4°C overnight. Next, the beads were washed with RIPA five times and boiled for 5 min. The FABP5 or FASN bands were then detected by WB.
2.11. Quantitation of free FAs and cholesterol
Free FAs concentration was measured using a Free Fatty Acid Assay Kit (Abbkine) and free cholesterol concentration was measured by Free Cholesterol Assay Kits (Applygen Technologies) according to the procedures provided by the manufacturers.
2.12. Nile red staining
Nile red staining was used to examine the cell lipid droplet; transfected or orlistat intervened QGP‐1 cells were seeded into 96‐well plates. After adherence, the cells were fixed with 4% paraformaldehyde for 20 min and then incubated with Nile red staining solution (1 mg/mL) and Hoechst 33342 stain for 20 min at room temperature. Images were taken from random microscope fields.
2.13. RNA extraction and library construction
Total RNA was isolated and purified using TRIzol reagent (Life). Poly(A) RNA was purified from 1 μg total RNA using Dynabeads Oligo(dT)25–61,005 (Thermo Fisher). The poly(A) RNA was fragmented into small pieces and then the cleaved RNA fragments were reverse‐transcribed to create cDNA. cDNA was finally amplified to 300 ± 50 bp. The RNA‐seq data were uploaded to the National Center for Biotechnology Information (NCBI) website (https://www.ncbi.nlm.nih.gov/bioproject/PRJNA916929).
2.14. Animals
Male BALB/c‐nu mice (4–5 weeks old) were housed in a special pathogen‐free animal facility. The experiments involving mice were performed with the approval of the Institutional Animal Care and Use Committee of Nanjing Medical University.
2.15. Immunohistochemistry
Tumor tissues were embedded in paraffin after being fixed with 4% formaldehyde. The paraffin blocks were cut into 5‐μm slices, then the slices were incubated with relative antibodies overnight in a humid environment, at 4°C. After that, the slices were washed three times using PBS and then incubated with a secondary antibody for 1 h at room temperature. Diaminobenzidine was then used to dye the slices for 5 min. Photographs were taken randomly from each slide.
2.16. Statistical analysis
All experiments were repeated at least three times, results were presented as the mean ± SD. Statistical analyses between two groups were conducted using unpaired Student's t‐test. One‐way ANOVA followed by Tukey's test was used for the comparison among multiple groups. All statistical analyses and experimental graphs were performed using GraphPad software (GraphPad Inc., La Jolla, CA, USA). A p‐value <0.05 was considered significant.
3. RESULTS
3.1. FABP5 is highly expressed in human pNEN tissues and pNEN cell lines
To investigate the role of FABP5 in pNENs, we performed immunohistochemistry and the results revealed that FABP5 expressed higher in pNEN tissues than in normal peritumor tissues (Figure 1A). WB of paired tissues confirmed that FABP5 has higher expression in pNENs compared with normal peritumor tissues (Figure 1B,C). We then analyzed FABP5 mRNA expression using the European Genome‐phenome Archive (EGA) database. The results indicated that FABP5 was relatively highly expressed in grade 3 pNENs compared with grade 1 or grade 2 (Figure 1D), while the survival of patients with FABP5 overexpression was not significantly less than patients with low FABP5 expression (Figure 1E), perhaps due to the small sample size, as pNENs are rare tumors. To better explore the function of FABP5 in pNENs, PNETs from neoplasm tissues of pNENs patients were isolated and some pNEN cell lines‐related biomarkers that had been previously reported 19 were tested (Figure S1A). Furthermore, qRT‐PCR and WB determined that FABP5 had higher expression in pNEN cell lines than in a normal human pancreatic cell line (Figure 1F,G), and immunofluorescence showed the location of FABP5 in each cell line (Figure 1H).
FIGURE 1.

FABP5 is highly expressed in pNENs. (A) Immunohistochemistry indicated that FABP5 expression was higher in pNEN tissues than in normal peritumor tissues. (B, C) Western blot (WB) of five paired tissues confirmed that FABP5 was highly expressed in pNENs. (D) Comparison of FABP5 mRNA expression among different grades of pNENs. (E) Correlation between FABP5 expression levels and overall survival of patients with pNENs. (F, G) qRT‐PCR and WB determined that FABP5 has higher expression in NENs cell lines. (H) Immunofluorescence showed the location of FABP5 in each cell lines. **p < 0.01; ***p < 0.001.
3.2. FABP5 knockdown suppresses proliferation, migration and invasion of pNEN cells
To investigate the role of FABP5 in pNENs, we constructed PNET, QGP‐1, and STC‐1 cell lines with stable FABP5 knockdown using lentivirus and confirmed the efficiency of transfection (Figure 2A,B; Figure S1B). CCK‐8 assays and colony formation assays indicated that the knockdown of FABP5 inhibited the cell proliferation rate of pNEN cells (Figure 2C–F). The negative influence of FABP5 on cell proliferation rate was also verified by EdU assays (Figure 2G,H). Transwell assays indicated that FABP5 knockdown repressed cell migration and invasion (Figure 2I,J). CCK‐8 assays (Figure S1C), colony formation assays (Figure S1D,E) and transwell assays (Figure S1F,G) determined that knockdown of FABP5 suppressed the proliferation, migration and invasion of STC‐1 cells. Taken together, these results demonstrated that FABP5 knockdown significantly inhibited pNEN cell proliferation, migration, and invasion.
FIGURE 2.
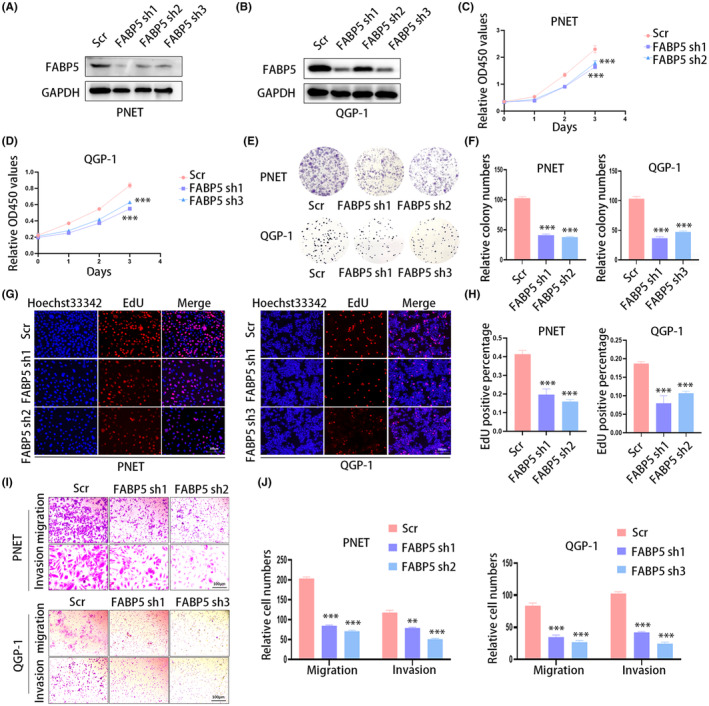
Knockdown of FABP5 suppresses cell viability. (A, B) Stably FABP5‐silenced PNET and QGP‐1 cell lines were constructed and determined by western blot. (C, D) The CCK‐8 assays indicated that FABP5 knockdown inhibited pNEN cell proliferation rate. (E, F) The knockdown of FABP5 repressed pNEN cells colony formation ability. (G, H) FABP5 knockdown significantly suppressed DNA synthesis. (I, J) FABP5 knockdown successfully impaired the migration and invasion ability of pNEN cells. **p < 0.01; ***p < 0.001.
3.3. Overexpression of FABP5 promotes proliferation, migration and invasion of pNEN cells
To further investigate the function of FABP5 in pNENs, we established PNET, QGP‐1 and STC‐1 cell lines that stably overexpressed FABP5 and examined the transfection efficiency (Figure 3A,B; Figure S1H). CCK‐8 assays (Figure 3C,D), colony formation assays (Figure 3E,F) and EdU assays (Figure 3G,H) demonstrated that overexpression of FABP5 facilitated cell proliferation rate of pNEN cells. Transwell assays determined that overexpression of FABP5 facilitated cell migration and invasion ability (Figure 3I,J). Moreover, CCK‐8 assays (Figure S1I), colony formation assays (Figure S1J,K) and transwell assays (Figure S1L,M) determined that FABP5 promoted the proliferation, migration and invasion of STC‐1 cells. Overall, these results confirmed that FABP5 facilitated pNEN cell proliferation, migration and invasion.
FIGURE 3.

Overexpression of FABP5 promotes cell viability. (A, B) pNEN cell lines stably overexpressing FABP5 were constructed and determined by western blot. (C, D) CCK‐8 assays indicated that FABP5 overexpression promoted pNEN cell proliferation rate. (E, F) The overexpression of FABP5 facilitated pNEN cell colony formation ability. (G, H) FABP5 overexpression significantly stimulated DNA synthesis. (I, J) FABP5 overexpression successfully promoted the migration and invasion ability of pNEN cells. **p < 0.01; ***p < 0.001.
3.4. FABP5 interacts with and positively regulates FASN
In light of recent studies linking FABPs and FASN, 20 , 21 we investigated the relationship between FABP5 and FASN in pNENs. qRT‐PCR and WB analysis revealed that FASN mRNA and protein expression levels were significantly higher in pNEN cells than in normal pancreatic cells (Figure 4A,B). Immunohistochemistry and WB further determined that FASN was expressed more in pNEN tissues than in normal peritumor tissues (Figure 4C–E). The interaction between FABP5 and FASN was confirmed by co‐immunoprecipitation assays in QGP‐1 cells (Figure 4F). WB indicated that the expression of FASN protein was significantly decreased following FABP5 knockdown and increased following FABP5 overexpression (Figure 4G). However, FABP5 protein expression did not significantly change along with FASN knockdown (Figure 4H). We then treated Scr QGP‐1 cells and FABP5 knockdown QGP‐1 cells with the protein synthesis inhibitor cycloheximide (CHX). The FASN degraded faster along with FABP5 knockdown (Figure 4I). In addition, treatment with the proteasome inhibitor MG132 significantly increased FASN levels in FABP5 knockdown groups (Figure 4J). Moreover, Co‐IP assays indicated that the ubiquitylation level of FASN significantly increased in cells with FABP5 knockdown (Figure 4K), indicating that FABP5 promoted the protein expression of FASN by inhibiting the ubiquitination of FASN.
FIGURE 4.

FABP5 regulates FASN expression. (A, B) qRT‐PCR and western blot (WB) determined that FASN has higher expression in NENs cell lines. (C) Immunohistochemistry indicated that FASN expressed higher in pNEN tissues. (D, E) WB of five paired tissues confirmed that FABP5 was highly expressed in pNENs. (F) Co‐immunoprecipitation showing the interaction between FABP5 and FASN in QGP‐1 cells. (G) The FASN protein expression was significantly decreased following FABP5 knockdown and increased following FABP5 overexpression in pNEN cells. (H) The expression of FABP5 was not significantly changed along with FASN knockdown. (I) WB analysis of FASN protein levels in wild QGP‐1 cells and FABP5 knockdown QGP‐1 cells with cycloheximide (CHX; 50 μg/mL) treatment at the indicated times. (J) WB analysis of FASN protein levels in wild QGP‐1 cells and FABP5 knockdown QGP‐1 cells with MG132 (25 μM) treatment at the indicated times. (K) WB analysis of FASN ubiquitin levels after immunoprecipitation using IgG or FASN antibodies in wild‐type QGP‐1 cells and FABP5 knockdown QGP‐1 cells. MG132 (25 μM) was added 6 h before harvest. ***p < 0.001.
3.5. Orlistat suppresses proliferation, migration and invasion of pNEN cells
To confirm the biological function of FASN in pNENs, PNET cells and QGP‐1 cells that stably repress FASN were constructed using lentivirus and the efficiency was detected (Figure S2A,B). Next, we performed CCK‐8 assays, colony formation assays and EdU assays indicating that knockdown of FASN inhibited the cell proliferation rate of PNET cells (Figure S2C–G) and QGP‐1 cells (Figure 5A–E). Transwell assays also indicated that FASN knockdown repressed the cell migration and invasion abilities of PNET cells (Figure S2H,I) and QGP‐1 cells (Figure 5F,G). Orlistat is known as a potent and irreversible inhibitor of lipase and FASN. To explore whether the FASN inhibitor would have effects on tumor progression, we first tested the half‐effective inhibition concentration of PNET cells (Figure S2J) and QGP‐1 cells (Figure 5H); 85 μM orlistat was then chosen as the treatment dose. Cells were treated with orlistat for 24 h first, then CCK‐8, colony formation assays, EdU assays, and transwell assays determined that orlistat suppressed pNEN cell proliferation, migration and invasion (Figure S2K–Q; Figure 5I–O).
FIGURE 5.

Orlistat suppresses cell viability by inhibiting FASN. (A) CCK‐8 assays indicated that the proliferation rate of QGP‐1 cells was decreased after FASN was knocked down. (B, C) FASN knockdown inhibited the colony formation ability of QGP‐1 cells. (D, E) FASN knockdown significantly suppressed DNA synthesis of QGP‐1 cells. (F, G) FASN knockdown successfully impaired the migration and invasion ability of QGP‐1 cells. (H) The half‐effective inhibition concentration of QGP‐1 cell line was tested. (I) CCK‐8 assays indicated that the proliferation rate of QGP‐1 cells was decreased after treatment with orlistat. (J, K) Orlistat inhibited the colony formation ability of QGP‐1 cells. (L, M) Orlistat significantly suppressed DNA synthesis of QGP‐1 cells. (N, O) Orlistat successfully impaired the migration and invasion ability of QGP‐1 cells. **p < 0.01; ***p < 0.001.
3.6. FABP5 facilitates the progression of pNENs via lipid metabolism
As FABP5 and FASN are genes involved in lipid metabolism, we measured intracellular free FAs and free cholesterol content in different QGP‐1 cells. We observed that free FAs increased with FABP5 overexpression (Figure 6A) and decreased after FABP5 or FASN knockdown (Figure 6B,C) or treatment with orlistat (Figure 6D). Similar trends were observed for free cholesterol amounts (Figure 6E–H). To explore the effects of free FAs on tumor progression, we treated FABP5 knockdown QGP‐1 cells with 10 μM eicosapentaenoic acid. Our CCK‐8 and transwell assays showed that treatment with free FAs reversed the suppression of proliferation, migration, and invasion induced by FABP5 knockdown (Figure 6I–K). As the results indicated that free FAs promoted the progression of pNENs, we next performed Nile red staining to explore how FABP5 affected lipid droplets in QGP‐1 cells and found that lipid droplets increased with FABP5 upregulation and decreased along with FABP5 or FASN knockdown; these also decreased when QGP‐1 cells were treated with orlistat (Figure 6L–S). Moreover, several lipid metabolism‐related genes were tested by qRT‐PCR, and the results indicated that ACC1, ATGL, and HSL were downregulated along with FABP5 knockdown (Figure S2R–T). Taken together, it was proved that FABP5 facilitates pNEN progression via regulating lipid metabolism.
FIGURE 6.

FABP5 promotes pNEN progression via regulating lipid metabolism. (A–D) Quantification of free fatty acids (FAs) was tested in QGP‐1 cells with FABP5 overexpression (A), FABP5 knockdown (B), FASN knockdown (C) or cells treated by orlistat (D). (E–H) Quantification of free cholesterol was tested in QGP‐1 cells with FABP5 overexpression (E), FABP5 knockdown (F), FASN knockdown (G) or cells treated by orlistat (H). (I–K) CCK‐8 assays and transwell assays determined that treatment of eicosapentaenoic acid (Cayman Chemical, USA) at the dose of 10 μm reverse the suppression of proliferation, migration and invasion induced by FABP5 knockdown. (L–S) Quantification of lipid droplets was tested in QGP‐1 cells with FABP5 overexpression (L, M), FABP5 knockdown (N, O), FASN knockdown (P, Q) or cells treated by orlistat (R, S). *p < 0.05; **p < 0.01; ***p < 0.001.
3.7. FABP5 acts as an oncogene in pNENs through the WNT/β‐catenin pathway
RNA‐seq assays were used to study the molecular mechanism of FABP5 in pNENs (Figure 7A), KEGG pathway analysis demonstrated that FABP5 was connected to the WNT/β‐catenin pathway (Figure 7B) and Gene Ontology (GO) analysis further showed that FABP5 might be involved in biological processes including lipid metabolic processes (Figure 7C). We then confirmed that FABP5 could activate the WNT/β‐catenin pathway by evaluating the WNT signal‐related biomarkers P‐GSK‐3β (Ser‐9), GSK‐3β, and β‐catenin. The results revealed that the WNT/β‐catenin pathway was suppressed when FABP5 was knocked down (Figure 7D), and a reverse tendency showed when FABP5 was upregulated (Figure 7E). As we expected, the WNT/β‐catenin pathway was also suppressed when FASN was knocked down (Figure 7F) or QGP‐1 cells were treated with orlistat (Figure 7G). These results clearly suggested that FABP5 facilitated the progression of pNENs via the WNT/β‐catenin pathway.
FIGURE 7.

FABP5 activates WNT/β‐catenin pathway. (A) 142 genes were upregulated and 81 genes were downregulated after FABP5 was knocked down in QGP‐1 cells. (B) KEGG analysis for RNA‐seq results demonstrated that FABP5 was involved in the WNT/β‐catenin pathway. (C) GO analysis for RNA‐seq results showed that FABP5 participated in multiple biological processes. (D–G) The WNT/β‐catenin signaling related biomarkers were evaluated by western blot in QGP‐1 cells with FABP5 overexpression (D), FABP5 knockdown (E), FASN knockdown (F) or cells treated by orlistat (G).
3.8. Orlistat reverses the protumorigenic role of FABP5 in vitro and in vivo
To further explore whether FABP5 facilitated the progression of pNENs via regulating the expression of FASN and whether orlistat could rescue the carcinogenesis of FABP5 as it inhibited the activity of FASN, rescue experiments were performed in QGP‐1 cells. Lentivirus containing FASN sh1 was used for the knockdown of FASN in FABP5 overexpression QGP‐1 cells and the efficiency was examined by western blot (Figure S3A). CCK‐8 assays (Figure S3B), colony formation assays (Figure S3C,D), EdU assays (Figure S3E,F) and transwell assays (Figure S3G,H) clarified that the proliferation, migration and invasion abilities increased by FABP5 overexpression were reversed after FASN was knocked down. The results further demonstrated that orlistat significantly attenuated the FABP5‐induced promotion of proliferation, migration and invasion in the QGP‐1 cell line, as revealed by the CCK‐8 assays (Figure 8A), colony formation assays (Figure 8B,C), EdU assays (Figure 8D,E) and transwell experiment (Figure 8F,G). Moreover, the knockdown of FASN or treatment of orlistat could reverse the activation of the WNT pathway (Figure S3I; Figure 8H). To further evaluate the influence of FABP5 on tumors in vivo, a nude mice xenograft model was constructed. Here, 5 × 10⁶ QGP‐1 cells were injected subcutaneously into the armpits of nude mice. Orlistat was given to one group of mice injected with FABP5‐upregulated QGP‐1 at a dose of 10 mg/kg/day. The nude mice were euthanized after 5 weeks. Tumors in the FABP5‐overexpressed group had larger volume and higher weight than the Vector group and the FABP5‐overexpressed group treated with orlistat (Figure 8I–K). Immunohistochemistry staining determined that FABP5 and FASN were successfully overexpressed in the FABP5‐overexpressed group or the orlistat‐treated FABP5‐overexpressed group, while orlistat reversed the promotion of proliferation (ki‐67) and activation of the WNT pathway induced by overexpression of FABP5 (Figure 8L,M). Overall, these results determined that orlistat could suppress the protumorigenic role of FABP5 in vitro and in vivo.
FIGURE 8.

Orlistat reverses the tumor promoter role of FABP5 in vitro and in vivo. (A) CCK‐8 assays clarified that the proliferation rate increased by FABP5 overexpression was reversed after treatment with orlistat. (B, C) The colony formation ability facilitated by FABP5 overexpression was reversed after treatment of orlistat. (D, E) Orlistat could attenuate the FABP5‐induced stimulation of DNA synthesis. (F, G) Orlistat could reverse the promotion of migration and invasion ability caused by FABP5 overexpression. (H) WNT/β‐catenin signaling pathway was suppressed after the FABP5 overexpression QGP‐1 cells were treated with orlistat. (I–K) Nude mice injected with transfected QGP‐1 cells subcutaneously were killed and tumors in the FABP5 overexpressed group had larger volume and higher weight than the Vector group and the FABP5 overexpressed group treated with orlistat. (L, M) Quantification of the protein expression of FABP5, FASN, ki‐67 and WNT/β‐catenin signaling related biomarkers was determined by immunohistochemistry. *p < 0.05; **p < 0.01; ***p < 0.001.
4. DISCUSSION
Lipid metabolism plays a crucial role in various diseases, including malignancies. Reprogramming of the lipid metabolism is becoming a characteristic feature of malignant tumors, 22 with FABP5 being a key lipid chaperone involved in this process; 9 the increase in fatty acids has been found to be a carcinogenic factor through the NF‐κB pathway. 23 Noteworthy, FABP5's effect on lipid droplets seems to vary among tumors. Many studies have shown that FABP5 facilitates the degradation of lipid droplets, 17 , 24 while we found contradictory results that FABP5 might play an auxo‐action for the deposition of lipid droplets. As lipid droplets have been found to be independent carcinogenic factors involving many mechanisms such as storing energy for anoikis resistance and cancer cell invasiveness, 25 promoting epithelial–mesenchymal transition and lymphangiogenesis, 26 and facilitating gain of stem‐like cell features, 27 the accumulation of lipid droplets has been demonstrated in many malignant tumors and has been associated with poor prognosis. 28 , 29 , 30 Therefore, the increased deposition of lipid droplets may serve as one of the reasons why FABP5 can promote cancer progression in pNENs.
FABP5, a member of the FABPs family, is involved in different cellular processes all over the human body. Current research is limited in focusing on the role that FABP5 plays in pNENs. Our studies indicated that FABP5 overexpression can facilitate proliferation, migration and invasion in vitro and in vivo. These phenotypes showed opposite trends in vitro following the knockdown of FABP5. Considering recent studies suggesting a link between FABPs and FASN, 20 , 21 we investigated the relationship between FABP5 and FASN in pNENs. Our research has revealed that FABP5 interacts with FASN and could regulate FASN expression, as demonstrated by Co‐IP and western blot analysis. FASN, a crucial lipogenic enzyme, plays a critical role in controlling the terminal steps of fatty acid biosynthesis, therefore regulating lipid metabolism. Additionally, FASN promotes growth and survival advantages in tumors and is druggable in multiple human carcinomas and their precursor lesions. Previous studies have reported a link between FASN and everolimus use in pNEN patients, 31 and is currently a mainline treatment for pNEN patients. In our study, we discovered that FABP5 interacted with FASN and enhanced FASN protein expression by inhibiting its ubiquitination. Both FABP5 and FASN function as “metabolic oncogenes” in pNENs. Furthermore, we uncovered new therapeutic possibilities using orlistat.
Orlistat is the only over‐the‐counter weight‐loss drug approved by the United States Food and Drug Administration, also known as a potent and irreversible inhibitor of lipase and FASN. We sought to investigate its effects on pNENs and in the QGP‐1 cell line overexpressing FABP5, as orlistat inhibits adipogenesis and specifically inhibits FASN, 32 Our results indicated that orlistat could effectively suppress the proliferation, migration, and invasion of both pNEN cell lines. Additionally, orlistat can reverse the carcinogenic effects of QGP‐1 cells overexpressing FABP5 in vitro and in vivo. In recent years, orlistat has shown promising potential as an anticancer agent, capable of suppressing cancer cell proliferation and metastasis, as well as enhancing chemotherapy drug sensitivity, 33 , 34 Currently, orlistat's anticancer applications are limited to preclinical cancer models or early‐phase clinical trials. However, our results offer promising new possibilities for the formulation of pNEN chemotherapy and may help promote the clinical application of orlistat in cancer treatment.
In addition, we conducted RNA‐seq analysis to investigate the relative biological differences caused by FABP5 knockdown. Our findings suggested that FABP5 may be linked to the WNT/β‐catenin pathway, which was further confirmed by testing the protein expression of WNT signal‐related biomarkers. The WNT signaling pathway plays a crucial role in regulating development and adult tissue homeostasis, but has been found to be dysregulated in many types of cancer. 35 Given the evidence for both pro‐ and anti‐tumorigenic roles of the β‐catenin‐dependent WNT signaling pathway, our western blot results confirmed that FABP5 could activate the WNT/β‐catenin pathway by promoting the accumulation of β‐catenin and degradation of P‐GSK‐3β (Ser‐9). This finding was further validated by detecting a significant decrease in β‐catenin and an increase in P‐GSK‐3β levels when FABP5‐overexpressing QGP‐1 cells were treated with orlistat. However, more research is needed to clarify the impact of the WNT pathway on targeted genes and to identify the underlying mechanisms involved.
In conclusion, our findings demonstrated that upregulation of FABP5 in pNEN cells could promote lipid accumulation by facilitating the deposition of lipid droplets. FABP5 also accelerates pNEN progression through regulating the expression of FASN in a ubiquitin‐dependent way and activating the WNT/β‐catenin pathway. Moreover, we detected that orlistat could reverse the protumorigenic role of FABP5 in pNENs in vitro and in vivo (Figure 9). Our study not only identified a potential early diagnostic biomarker for pNENs but also provided a potential therapeutic target of pNENs.
FIGURE 9.

Schematic diagram showing the proposed mechanism by which FABP5 facilitates pNEN progression. FABP5 interacts with FASN and promotes the protein expression of FASN by inhibiting its ubiquitination, together they facilitate the proliferation and metastasis of pNENs by promoting the deposition of lipid droplets and activating the WNT/β‐catenin pathway. After treating pNEN cells with orlistat, the protumorigenic function of FABP5 overexpression is reversed.
AUTHOR CONTRIBUTIONS
TQ and YM designed the study; LF, YM, HC and CJ performed experiments and collected all data; YL, GD, YP, XL and TY analyzed and dealt with the data; LF, YM and CJ participated in writing and making the figures. TQ and BJ were involved in the critical review of the manuscript. All authors read and approved the manuscript.
CONFLICT OF INTEREST STATEMENT
The authors have no conflict of interest.
ETHICS STATEMENTS
Approval of the research protocol by an Institutional Review Board: Approval of the research protocol was approved by an Institutional Reviewer Board.
Informed consent: Informed consent was acquired from every patient from Jiangsu Province Hospital.
Registry and the Registration No. of the study/trial: N/A.
Animal studies: Animal studies were approved by the Institutional Animal Care and Use Committee (IACUC) of Nanjing Medical University.
Supporting information
Figure S1.
Figure S2.
Figure S3.
Table S1.
Table S2.
Table S3.
ACKNOWLEDGEMENTS
Not applicable.
Lu F, Ye M, Hu C, et al. FABP5 regulates lipid metabolism to facilitate pancreatic neuroendocrine neoplasms progression via FASN mediated Wnt/β‐catenin pathway. Cancer Sci. 2023;114:3553‐3567. doi: 10.1111/cas.15883
Feiyu Lu and Mujie Ye contributed equally.
DATA AVAILABILITY STATEMENT
All of the data of this study are available from the corresponding author.
REFERENCES
- 1. Mpilla GB, Philip PA, El‐Rayes B, Azmi AS. Pancreatic neuroendocrine tumors: therapeutic challenges and research limitations. World J Gastroenterol. 2020;26:4036‐4054. [DOI] [PMC free article] [PubMed] [Google Scholar]
- 2. Badarna M, Percik R, Aharon‐Hananel G, Uri I, Tirosh A. Anatomic site as prognostic marker of pancreatic neuroendocrine tumors: a cohort study. Eur J Endocrinol. 2019;181:325‐330. [DOI] [PubMed] [Google Scholar]
- 3. Capodanno Y, Chen Y, Schrader J, et al. Cross‐talk among MEN1, p53 and Notch regulates the proliferation of pancreatic neuroendocrine tumor cells by modulating INSM1 expression and subcellular localization. Neoplasia. 2021;23:979‐992. [DOI] [PMC free article] [PubMed] [Google Scholar]
- 4. Carter AM, Kumar N, Herring B, et al. Cdk5 drives formation of heterogeneous pancreatic neuroendocrine tumors. Oncogenesis. 2021;10:83. [DOI] [PMC free article] [PubMed] [Google Scholar]
- 5. Ungefroren H, Kunstner A, Busch H, et al. Differential effects of somatostatin, octreotide, and Lanreotide on neuroendocrine differentiation and proliferation in established and primary NET cell lines: possible crosstalk with TGF‐beta signaling. Int J Mol Sci. 2022;23:15868. [DOI] [PMC free article] [PubMed] [Google Scholar]
- 6. Capodanno Y, Buishand FO, Pang LY, Kirpensteijn J, Mol JA, Argyle DJ. Notch pathway inhibition targets chemoresistant insulinoma cancer stem cells. Endocr Relat Cancer. 2018;25:131‐144. [DOI] [PubMed] [Google Scholar]
- 7. Furuhashi M, Hotamisligil GS. Fatty acid‐binding proteins: role in metabolic diseases and potential as drug targets. Nat Rev Drug Discov. 2008;7:489‐503. [DOI] [PMC free article] [PubMed] [Google Scholar]
- 8. Matsumata M, Inada H, Osumi N. Fatty acid binding proteins and the nervous system: their impact on mental conditions. Neurosci Res. 2016;102:47‐55. [DOI] [PubMed] [Google Scholar]
- 9. Xu B, Chen L, Zhan Y, et al. The biological functions and regulatory mechanisms of fatty acid binding protein 5 in various diseases. Front Cell Dev Biol. 2022;10:857919. [DOI] [PMC free article] [PubMed] [Google Scholar]
- 10. Wang W, Chu HJ, Liang YC, et al. FABP5 correlates with poor prognosis and promotes tumor cell growth and metastasis in cervical cancer. Tumour Biol. 2016;37:14873‐14883. [DOI] [PubMed] [Google Scholar]
- 11. Zhan YZ, Liu F, Zhang Y, Mo XY, Cheng WD, Wang W. FABP5 promotes cell growth, invasion and metastasis in cervical cancer. Zhonghua Zhong Liu Za Zhi. 2019;41:200‐207. [DOI] [PubMed] [Google Scholar]
- 12. Pan J, Dai Q, Zhang T, Li C. Palmitate acid promotes gastric cancer metastasis via FABP5/SP1/UCA1 pathway. Cancer Cell Int. 2019;19:69. [DOI] [PMC free article] [PubMed] [Google Scholar]
- 13. Zhao G, Wu M, Wang X, Du Z, Zhang G. Effect of FABP5 gene silencing on the proliferation, apoptosis and invasion of human gastric SGC‐7901 cancer cells. Oncol Lett. 2017;14:4772‐4778. [DOI] [PMC free article] [PubMed] [Google Scholar]
- 14. Al‐Jameel W, Gou X, Jin X, et al. Inactivated FABP5 suppresses malignant progression of prostate cancer cells by inhibiting the activation of nuclear fatty acid receptor PPARgamma. Genes Cancer. 2019;10:80‐96. [DOI] [PMC free article] [PubMed] [Google Scholar]
- 15. Jin BY, Fu GH, Jiang X, et al. CRABP2 and FABP5 identified by 2D DIGE profiling are upregulated in human bladder cancer. Chin Med J (Engl). 2013;126:3787‐3789. [PubMed] [Google Scholar]
- 16. Ju J, Wang N, Wang J, Wu F, Ge J, Chen F. 4‐Amino‐2‐trifluoromethyl‐phenyl retinate inhibits proliferation, invasion, and migration of breast cancer cells by independently regulating CRABP2 and FABP5. Drug des Devel Ther. 2018;12:997‐1008. [DOI] [PMC free article] [PubMed] [Google Scholar] [Retracted]
- 17. Zhang C, Liao Y, Liu P, et al. FABP5 promotes lymph node metastasis in cervical cancer by reprogramming fatty acid metabolism. Theranostics. 2020;10:6561‐6580. [DOI] [PMC free article] [PubMed] [Google Scholar]
- 18. April‐Monn SL, Wiedmer T, Skowronska M, et al. Three‐dimensional primary cell culture: a novel preclinical model for pancreatic neuroendocrine tumors. Neuroendocrinology. 2021;111:273‐287. [DOI] [PubMed] [Google Scholar]
- 19. Luley KB, Biedermann SB, Kunstner A, et al. A comprehensive molecular characterization of the pancreatic neuroendocrine tumor cell lines BON‐1 and QGP‐1. Cancers (Basel). 2020;12:691. [DOI] [PMC free article] [PubMed] [Google Scholar]
- 20. Garcia KA, Costa ML, Lacunza E, Martinez ME, Corsico B, Scaglia N. Fatty acid binding protein 5 regulates lipogenesis and tumor growth in lung adenocarcinoma. Life Sci. 2022;301:120621. [DOI] [PubMed] [Google Scholar]
- 21. Campbell WA, Tangeman A, El‐Hodiri HM, et al. Fatty acid‐binding proteins and fatty acid synthase influence glial reactivity and promote the formation of Müller glia‐derived progenitor cells in the chick retina. Development. 2022;149:dev200127. [DOI] [PMC free article] [PubMed] [Google Scholar]
- 22. Bian X, Liu R, Meng Y, Xing D, Xu D, Lu Z. Lipid metabolism and cancer. J Exp Med. 2021;218:e20201606. [DOI] [PMC free article] [PubMed] [Google Scholar]
- 23. Wang Y, Wahafu A, Wu W, et al. FABP5 enhances malignancies of lower‐grade gliomas via canonical activation of NF‐kappaB signaling. J Cell Mol Med. 2021;25:4487‐4500. [DOI] [PMC free article] [PubMed] [Google Scholar]
- 24. Senga S, Kobayashi N, Kawaguchi K, Ando A, Fujii H. Fatty acid‐binding protein 5 (FABP5) promotes lipolysis of lipid droplets, de novo fatty acid (FA) synthesis and activation of nuclear factor‐kappa B (NF‐kappaB) signaling in cancer cells. Biochim Biophys Acta Mol Cell Biol Lipids. 2018;1863:1057‐1067. [DOI] [PubMed] [Google Scholar]
- 25. Corbet C, Bastien E, Santiago de Jesus JP, et al. TGFbeta2‐induced formation of lipid droplets supports acidosis‐driven EMT and the metastatic spreading of cancer cells. Nat Commun. 2020;11:454. [DOI] [PMC free article] [PubMed] [Google Scholar]
- 26. Shang C, Li Y, He T, et al. The prognostic miR‐532‐5p‐correlated ceRNA‐mediated lipid droplet accumulation drives nodal metastasis of cervical cancer. J Adv Res. 2022;37:169‐184. [DOI] [PMC free article] [PubMed] [Google Scholar]
- 27. Liu H, Du J, Chao S, et al. Fusobacterium nucleatum promotes colorectal cancer cell to acquire stem cell‐like features by manipulating lipid droplet‐mediated numb degradation. Adv Sci (Weinh). 2022;9:e2105222. [DOI] [PMC free article] [PubMed] [Google Scholar]
- 28. Aboumrad MH, Horn RC Jr, Fine G. Lipid‐secreting mammary carcinoma. Report of a case associated with Paget's disease of the nipple. Cancer. 1963;16:521‐525. [DOI] [PubMed] [Google Scholar]
- 29. Zhou Q, Melkoumian ZK, Lucktong A, Moniwa M, Davie JR, Strobl JS. Rapid induction of histone hyperacetylation and cellular differentiation in human breast tumor cell lines following degradation of histone deacetylase‐1. J Biol Chem. 2000;275:35256‐35263. [DOI] [PubMed] [Google Scholar]
- 30. Straub BK, Herpel E, Singer S, et al. Lipid droplet‐associated PAT‐proteins show frequent and differential expression in neoplastic steatogenesis. Mod Pathol. 2010;23:480‐492. [DOI] [PubMed] [Google Scholar]
- 31. Vernieri C, Pusceddu S, Fuca G, et al. Impact of systemic and tumor lipid metabolism on everolimus efficacy in advanced pancreatic neuroendocrine tumors (pNETs). Int J Cancer. 2019;144:1704‐1712. [DOI] [PubMed] [Google Scholar]
- 32. Igel LI, Kumar RB, Saunders KH, Aronne LJ. Practical use of pharmacotherapy for obesity. Gastroenterology. 2017;152:1765‐1779. [DOI] [PubMed] [Google Scholar]
- 33. Narayanaswami V, Dwoskin LP. Obesity: current and potential pharmacotherapeutics and targets. Pharmacol Ther. 2017;170:116‐147. [DOI] [PMC free article] [PubMed] [Google Scholar]
- 34. Yang PY, Liu K, Ngai MH, Lear MJ, Wenk MR, Yao SQ. Activity‐based proteome profiling of potential cellular targets of Orlistat–an FDA‐approved drug with anti‐tumor activities. J Am Chem Soc. 2010;132:656‐666. [DOI] [PubMed] [Google Scholar]
- 35. Parsons MJ, Tammela T, Dow LE. WNT as a driver and dependency in cancer. Cancer Discov. 2021;11:2413‐2429. [DOI] [PMC free article] [PubMed] [Google Scholar]
Associated Data
This section collects any data citations, data availability statements, or supplementary materials included in this article.
Supplementary Materials
Figure S1.
Figure S2.
Figure S3.
Table S1.
Table S2.
Table S3.
Data Availability Statement
All of the data of this study are available from the corresponding author.