Abstract
Background:
The leading cause of end-stage renal disease is diabetic nephropathy (DN). A key factor in DN is immune cell infiltration (ICI). It has been shown that immune-related genes play a significant role in inflammation and immune cell recruitment. However, neither the underlying mechanisms nor immune-related biomarkers have been identified in DNs. Using bioinformatics, this study investigated biomarkers associated with immunity in DN.
Methods:
Using bioinformatic methods, this study aimed to identify biomarkers and immune infiltration associated with DN. Gene expression profiles (GSE30528, GSE47183, and GSE104948) were selected from the Gene Expression Omnibus database. First, we identified 23 differentially expressed immune-related genes and 7 signature genes, LYZ, CCL5, ALB, IGF1, CXCL2, NR4A2, and RBP4. Subsequently, protein–protein interaction networks were created, and functional enrichment analysis and genome enrichment analysis were performed using the gene ontology and Kyoto Encyclopedia of Genes and Genome databases. In the R software, the ConsensusClusterPlus package identified 2 different immune modes (cluster A and cluster B) following the consistent clustering method. The infiltration of immune cells between the 2 clusters was analyzed by applying the CIBERSORT method. And preliminarily verified the characteristic genes through in vitro experiments.
Results:
In this study, the samples of diabetes nephropathy were classified based on immune related genes, and the Hub genes LYZ, CCL5, ALB, IGF1, CXCL2, NR4A2 and RBP4 related to immune infiltration of diabetes nephropathy were obtained through the analysis of gene expression differences between different subtypes.
Conclusions:
This study was based on bioinformatics technology to analyze the biomarkers of immune related genes in diabetes nephropathy. To analyze the pathogenesis of diabetes nephropathy at the RNA level, and ultimately provide guidance for disease diagnosis, treatment, and prognosis.
Keywords: biomarker, diabetic nephropathy, differentially expressed genes, GEO, immune infiltration
1. Introduction
Diabetic nephropathy (DN), a microvascular condition linked to the development of diabetes, affects 30% to 40% of diabetic individuals. It is currently the main contributor to end-stage renal failure (ESRD).[1] Even with expensive treatments, such as dialysis and kidney transplantation, it is still feasible to live a long and healthy life. Patients with ESRD are at a higher risk of contracting various infections, anemia, mineral and bone abnormalities, and cardiovascular issues.[2,3] Microalbuminuria, serum creatinine levels, estimated glomerular filtration rate, and urinary microalbumin/creatinine ratio are currently used to diagnose DN.[4] At the same time, other substances in the serum are also used to evaluate diseases. However, despite these strategies, diabetes nephropathy is still progressing relentlessly. The urgent demand for new treatment methods has prompted us to further investigate their underlying pathogenesis.[5,6]
Research has shown that DN is mainly caused by metabolic and hemodynamic variables.[7] However, inflammation and immune cell infiltration have been shown to be important factors in DN’s development of DN. Some researchers believe that some immune and inflammatory genes in the kidney cells of patients with diabetes and in animal models of the disease are upregulated. The increase of intracellular adhesion molecule-1 (ICAM-1), tumor necrosis factor (TNF), interleukin-1 and interleukin -6 and the infiltration and functional activity of macrophages, neutrophils, fibrosis and mast cell in the kidney and their functional activity are important driving factors of renal inflammation and fibrosis.[8–10] Over the past decade, many potential diagnostic markers have been discovered for this condition.[11] Serum TNF receptors 1 and 2 are significantly correlated with certain inflammation-related DN precocious glomerular lesion types.[12] Certain signaling pathways, such as MAP kinase and p38, can trigger an inflammatory response.[13,14] Urinary microalbumin/creatinine ratio and estimated glomerular filtration rate are the only diagnostic markers that have been clinically useful.[15]
Bioinformatics has made it increasingly clear that human diseases are not caused solely by defects in one molecule. Instead, complex interactions between the molecules drive them. These complex interactions include various types of information.[16] They range from protein–protein interactions at the cellular-molecular level to related studies of gene regulation and metabolism, disease pathways, and drug–disease relationships.
This study aimed to identify the key genes and pathways associated with immune infiltration in patients with DN. We will be able to better understand the molecular mechanisms behind DN at the system biology level by identifying key biomarkers for immune infiltration.
2. Materials and methods
2.1. Microarray data source
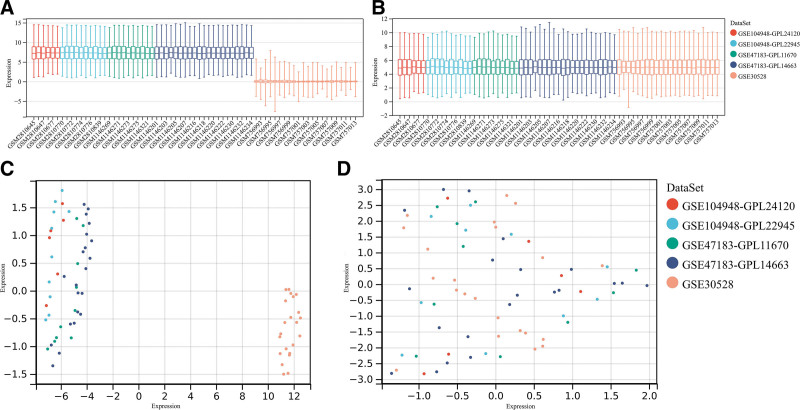
Five DN-related genetic datasets were obtained from the Gene Expression Omnibus database (GEO). They are GSE30528, GSE47183-GPL11670, GSE47183-GPL14663, GSE104948-GPL22945, and GSE104948-GPL24120. These 5 datasets were combined to obtain average expression values when different probes pointed to the same gene. Batch effects can be eliminated using alternative variable analysis, which is available in R environments. 2D principal component analysis (second-degree principal component analysis) was used to analyze DN and normal samples, as well as distribution patterns in the microarray data.
2.2. Screening for differentially expressed immune-related genes (Imm-DEG)
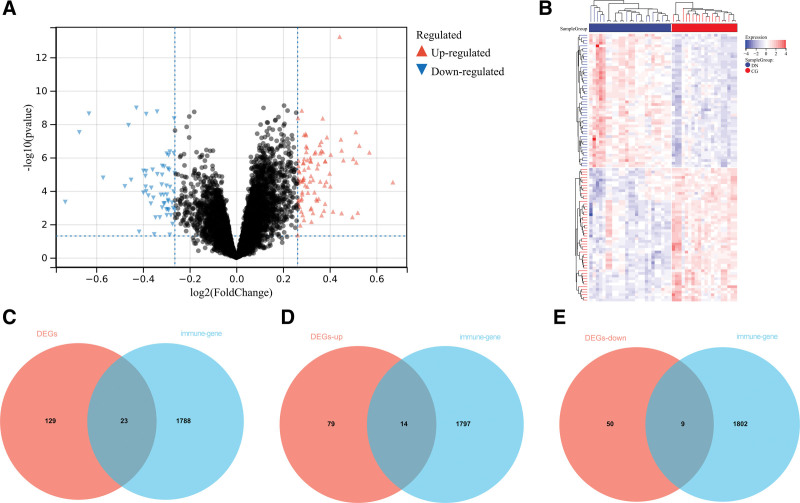
The Immport database contains the Imm-DEG. |log2FC| >1.2 to show differential gene expression results (P < .05), volcano map, and heat map were used. Identification of Imm-DEGs using cross DEG and immune genes.
2.3. Forest model and nomogram model construction
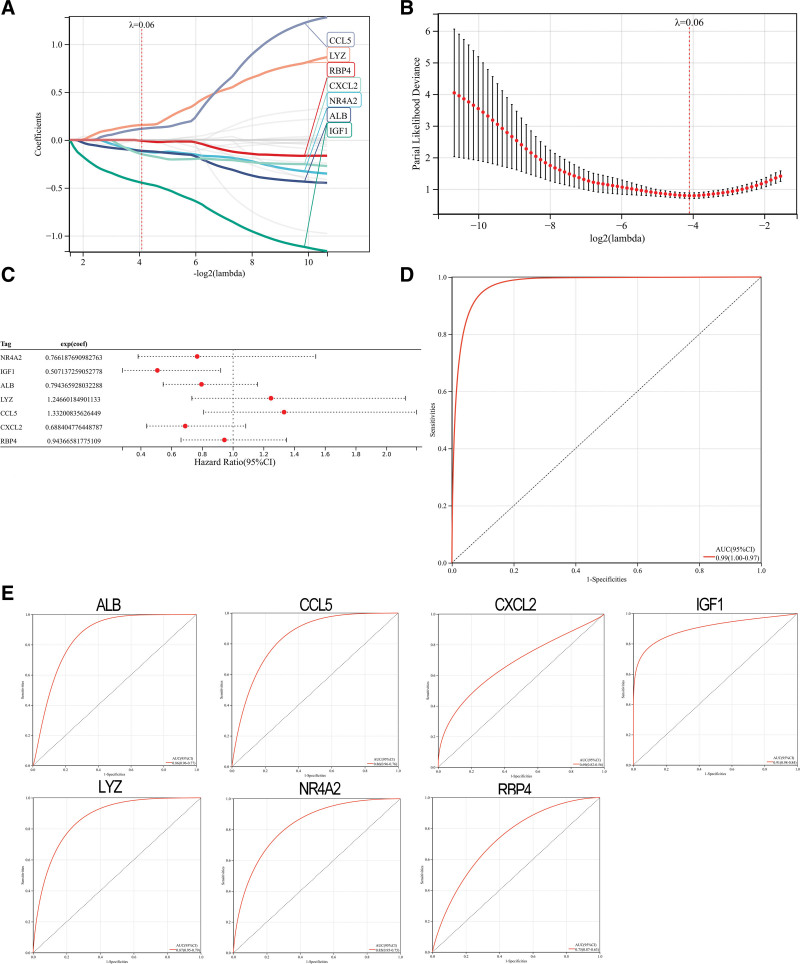
To predict the likelihood of DN, the model was trained using the least absolute shrinkage and selection operator (LASSO).[17] The model included candidate DEIRGs, and the LASSO algorithm was used to analyze the characteristic genes associated with DN. Equation (1) is a risk-score formula that predicts the likelihood of DN. This is based on a forest model.
2.4. Consistency cluster analysis
Consistent clustering is a resampling-based technique for identifying each member, its subgroup number, and validating the clustering. ConsensusClusterPlus was used to reliably cluster disease samples based on the DN expression data. This method allows for the discovery of immunological patterns based only on Imm-DEG. Clustering starts with number 2 being set and then increases one by one until the maximum number of categories is reached. The best number of clusters for the heat map is then selected.
2.5. Different immunological models allow for the determination of DEG
R limma-pack was employed to screen differential genes within different immune mode subgroups to investigate the effects of immune mode on DN. Volcano and heat maps were used to determine the differential gene expression (|log2FC| >1.2 and P < .05).
2.6. Analysis of pathways and biological functions by enrichment
Gene ontology, is the most common method for large-scale functional enrichment research that covers biological processes, molecular functions, and cellular components. The Kyoto encyclopedia of genes and genomes (KEGG) is a popular database that stores information about genes, biological pathways, diseases, and drugs. GO annotation analysis and KEGG pathway enrichment analyses of differentially expressed genes using R’s clusterProfiler package produced a threshold of false discovery rate (P < .05) that was statistically significant.
2.7. Protein–protein interaction network (PPI)
To build a PPI network that was associated with differentially expressed genes (Imm-DEGs) and the determination of DEGs, we used the STRING database. To draw the PPI network model, use Cytoscape (v3.7.2).
2.8. Identification and correlation between immune infiltrating cell types in diseases
RNA sequencing data can be used by CIBERSORT software to determine the number of immune cells in a sample. To calculate 22 immune cell types from patients with different immune systems, we used CIBERSORT software in R software. The Wilcoxon rank-sum test was used to assess differences in the percentage of immune cells. Statistical significance was set at P < .05.
2.9. Western blot analysis
Radioimmunoprecipitation experiment lysis buffer comprising 50 mmol/L Tris–HCl, pH 7.5, 150 mmol/L NaCl, 0.5% deoxycholate, 1% Nonidet P-40, 0.1% sodium dodecyl sulfate, 1 mmol/L phenylmethylsulfonyl fluoride and 1 μg/mL protease cocktail was used to extract protein from cells and tissues. The protein content was determined using a bicinchoninic acid test kit. Protein samples (80 g/lane) were placed onto gels, separated using polyacrylamide gel electrophoresis with 10% sodium dodecyl sulfate, and then transferred to polyvinylidene difluoride membranes. The membranes were then treated with anti-LYZ, anti-CCL5, anti-ALB, anti-IGF1, anti-CXCL2, anti-NR4A2, anti-RBP4 or anti-tubulin antibodies at 4 °C for an overnight period. A secondary antibody was applied to the membrane after 3 rounds of washing. Using improved chemiluminescence, certain signals were detected.
2.10. Statistical analysis
The results are presented in the form of a medium standard deviation. Statistical analyses were carried out with SPSS 17.0 statistical software. The Student t test was used to evaluate the importance of experimental differences among groups. A P-value < 0.05 was assessed as statistically significant.
3. Results
3.1. Patients with DN have Imm-DEG expressed
This study used the data downloaded from the GEO database (Fig. 1). The original data were then removed from the batch processing effect to create an ensemble dataset that included 34 DN and 35 control samples. In total, 152 differentially expressed genes (DEGs) were identified in this study (Fig. 2A and B). Figure 2C shows how Imm-DEG intersect with the differentially expressed genes. Of these 23 Imm-DEGs, 14 were upregulated (Fig. 2D) and 9 were downregulated (Fig. 2E).
Figure 1.
GEO data de-batching. (A) Gene expression level statistics of the dataset before de-batching. (B) Gene expression level statistics of the integrated dataset after de-batching. (C) Uniform manifold approximation and projection (UMAP) between datasets before de-batching. (D) UMAP between integrated datasets after de-batching.
Figure 2.
Immune-related genes and differentially expressed immune genes (Imm-DEGs). (A) DN related differentially expressed genes (DEGs) volcano plot with log2FoldChange in the horizontal coordinate and –log10(P-value) in the vertical coordinate. Red nodes indicate upregulated DEGs, blue nodes indicate downregulated DEGs, and gray nodes indicate genes that are not significantly differentially expressed. (B) Heat map of DN related DEG expression levels. (C) Immune gene versus DEG Venn diagram: blue represents immune genes, red represents DEGs. (D) Venn diagram of immune genes and upregulated DEGs: blue represents immune genes, red represents upregulated DEGs. (E) Venn diagram of immune genes and downregulated DEGs: blue represents immune genes, red represents downregulated DEGs. DN = diabetic nephropathy.
Histograms of ImmDEG expression levels in DN and control samples were plotted to analyze the overall expression (Fig. 3). Many genes were expressed at higher levels in DN samples than in normal samples.
Figure 3.
Expression levels of Imm-DEGs in DN. Overall expression histogram of immune-related genes in DN patients: blue for control samples, red for disease samples, horizontal axis indicates genes, vertical axis indicates gene expression levels (**P < .01, ***P < .001, ****P < .0001). DN = diabetic nephropathy, Imm-DEGs = immune-related genes.
The LASSO algorithm was used to identify 7 genes that significantly influenced DN (Fig. 4A and B). The coefficients of the 7 genes were used to calculate the gene expression (Fig. 4C). These coefficients were multiplied by the corresponding coefficients to obtain the DN score (Fig. 4D). To predict DN, subject working characteristic (ROC) curves were also studied for 7 gene traits. The results demonstrated the predictive power of each gene trait (Fig. 4E).
Figure 4.
Construction of DN model. (A and B) Screening of gene signatures from Imm-DEGs using the LASSO algorithm. (C) Forest plot of gene signatures in DN patients. (D) Receiver operating characteristic (ROC) curve of predicted risk scores in DN diagnosis. (E) ROC curve of 7 gene signatures in DN diagnosis. DN = diabetic nephropathy, Imm-DEGs = immune-related genes, LASSO= least absolute shrinkage and selection operator.
| (1) |
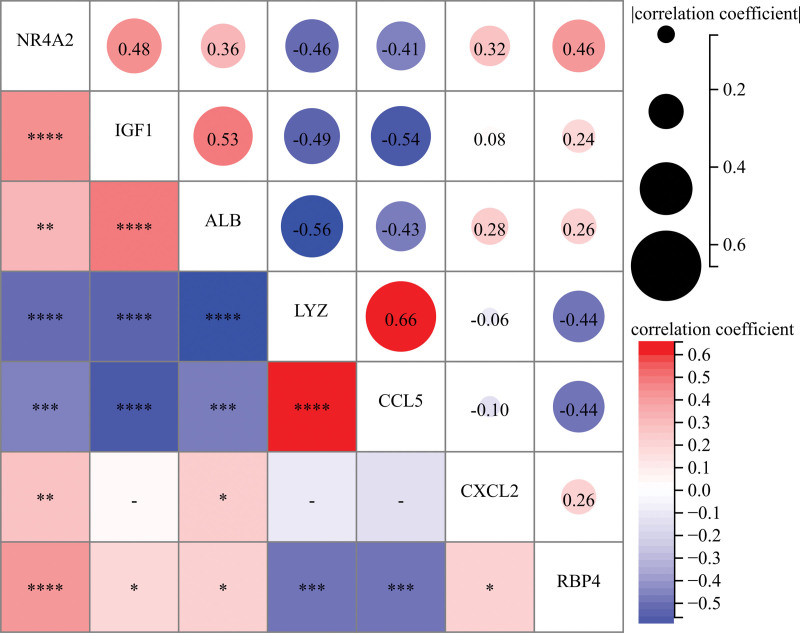
We examined the correlation between gene expression and the functional correlation of 7 trait genes. The functional correlation coefficient between CCL5 and LYZ expression was 0.66. All samples showed that LYZ was negatively correlated with all other genes except CCL5. CXCL2 was also less correlated than other genes (Fig. 5).
Figure 5.
Correlation analysis of disease and 7 trait genes in normal samples: * represents correlation significance, and numbers represent degree of correlation. (*P < .05, **P < .01, ***P < .001, ****P < .0001).
3.2. Unique immunological model of genetic characteristics
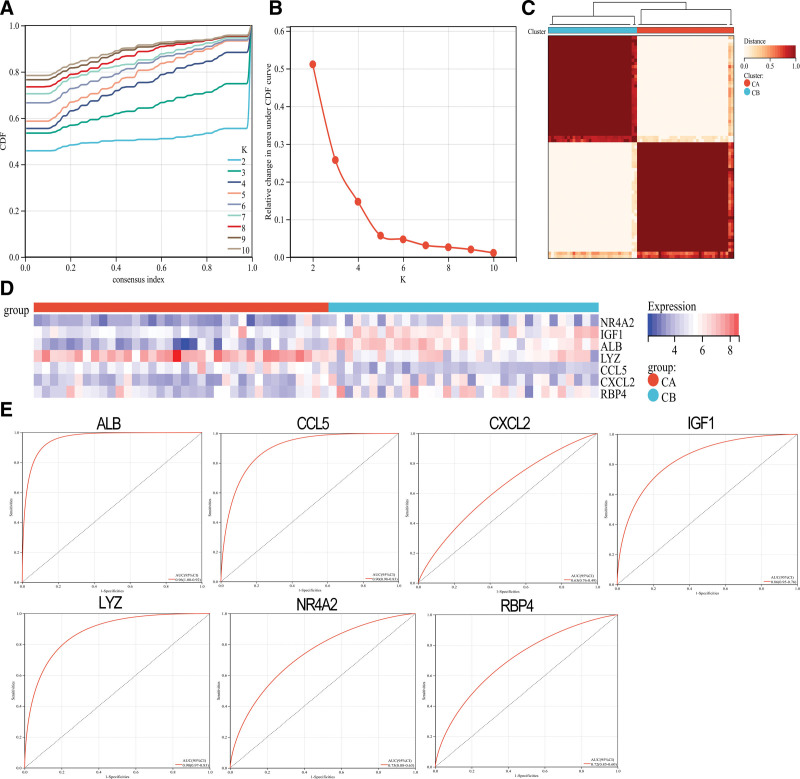
The ConsensusClusterPlus package was used to create 2 immunological models: cluster A and cluster B. This method also uses a consistent clustering algorithm based on 7 distinct genes (Fig. 6A–C). Cluster A contained 36 samples, whereas cluster B had 33 samples. A heat map of all the differentially expressed immune genes was created. There were significant differences between the 2 groups in terms of immune-related gene expression. CCL5 and LYZ were expressed in cluster A more than in cluster B. However, cluster A expression levels were significantly higher than in cluster B. RBP4, ALB, IGF1, CXCL2, NR4A2, and CXCL2 were significantly lower than in cluster A (Fig. 6D). ROC curves for the 7 gene tag categories were also evaluated and showed good classification effects (Fig. 6E).
Figure 6.
Consistent clustering of genes characteristic of DN patients. (A) CDF cumulative distribution curve. (B) Area under the CDF curve. (C) Two sets of clustering heatmaps. (D) Heat map of the expression levels of 7 characteristic genes in 2 clusters: red for cluster A, blue for cluster B, red for high expression, and blue for low expression. (E) ROC curves of the 7 characteristic genes independently distinguish between cluster A and cluster B. (*P < .05, **P < .01, ***P < .001, ****P < .0001). DN= diabetic nephropathy.
3.3. PPI immune gene network
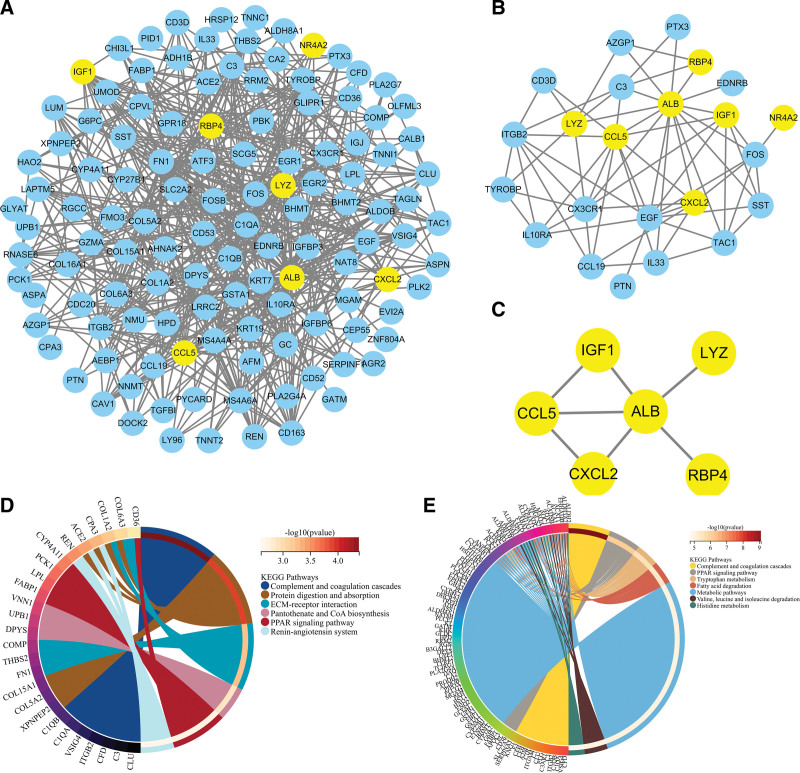
We extracted PPI networks from DEGs, Imm-DEGs, and characteristic genes to explore the relationships between differentially expressed immune genes. The PPI network for DEG contained 472 paired interactions, 122 genes, and ALB was closely related to 46 DEGs. CCL5 was found to be associated with 16 DEGs (Fig. 7A). The PPI network of ImmDEGs also contained 65 interaction pairs and 23 genes, and ALB was closely related to 15 differentially expressed immune gene genes. CCL5 was associated with 11 differentially expressed Imm-DEG (Fig. 7B). Figure 7C shows that the PPI network for the characteristic gene included 7 interacting pairs as well as 6 genes. ALB is an important component of this network. Functional enrichment analysis using KEGG was performed to verify the functions and structures of the genes in the PPI networks. The results showed that genes from the PPI network could be found in the complement and coagulation, protein digestion, absorption, mesangial extracellular matrix receptor interaction, pantothenate, CoA biosynthesis, and PPAR signaling pathways. Enrichment in pathways, such as the renin–angiotensin system, is also shown (Fig. 7D). Imm-DEGs were involved in viral protein interaction and cytokine receptor interaction, cytokine cytokine receiver interaction, cytokine signaling pathway, TNF pathway, and cytosolic DNA-sensing pathway (Fig. 7E).
Figure 7.
Protein–protein interaction (PPI) networks. (A) Differentially expressed gene PPI network: yellow nodes indicate characteristic genes. (B) PPI network of Imm-DEG: yellow nodes indicate characteristic genes. (C) Results of characteristic genes. (D) Results of gene enrichment analysis in the DEG PPI network. (E) Results of gene enrichment analysis in the Imm-DEG PPI network. Imm-DEGs = immune-related genes.
3.4. Comparison analysis of 2 immune models
A total of 516 DEGs were derived between modes A and B to analyze the differences between them. Cluster A had 256 upregulated DEGs, whereas cluster A contained 260 downregulated DEGs. (Fig. 8A). These DEGs could distinguish between the 2 immune modes, as shown in the heat map (Fig. 8B).
Figure 8.
Analysis of differences between 2 different immune modes. (A) The abscissa is log2FoldChange; the ordinate is –log 10 (P-value); red nodes indicate upward-adjusted DEGs; green nodes indicate downward-adjusted DEGs. (B) Heat map of DEG expression levels in 2 clusters: blue for cluster A; red indicates cluster B; red indicates high expression; blue indicates low expression.
We then compared the roles of DEGs between the immune modalities to determine their biological relevance. First, the DEGs were functionally annotated (Fig. 9A). KEGG pathway analysis revealed that these DEGs had functional annotations in the complement and coagulation pathways, PPAR signaling pathway, and tryptophan metabolism (Fig. 9B).
Figure 9.
Functional analysis between 2 different immune modes. (A) Gene ontology (GO) functional enrichment analysis: ordinate is significant; the abscissa is the result of enrichment; node colors indicate biological processes (BP), cellular components (CC), molecular functions (MF). (B) Results of Kyoto encyclopedia of genes and genomes pathway enrichment analysis.
3.5. Differences in immune properties between the 2 models
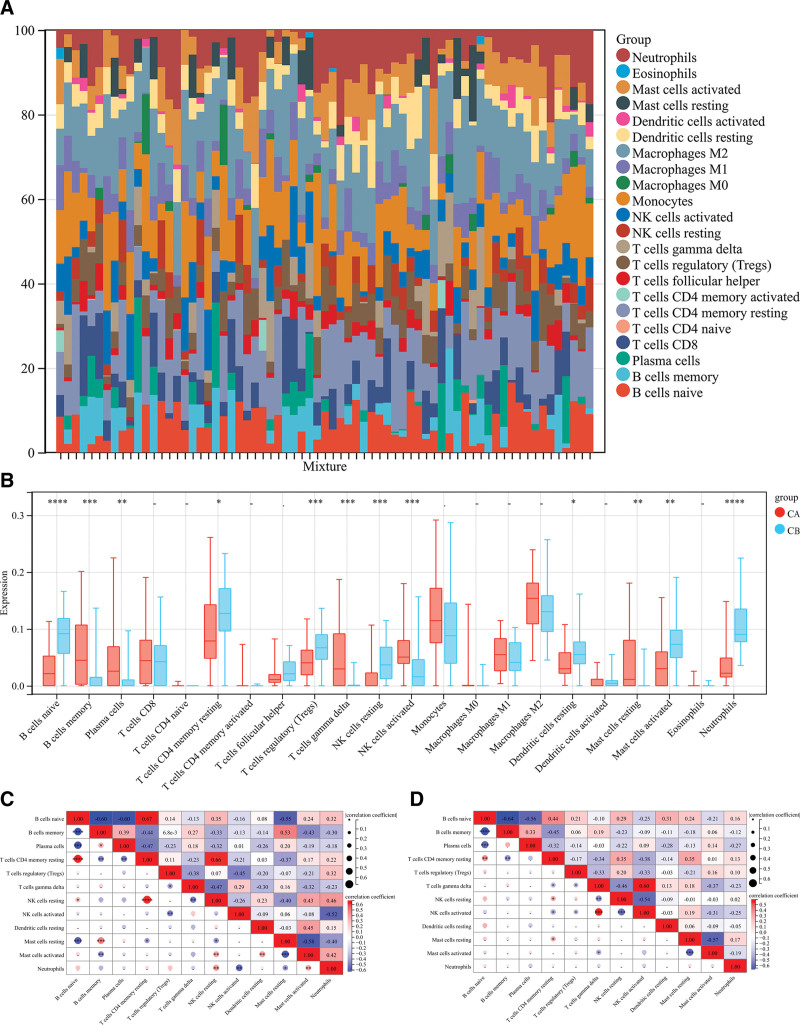
The CIBERSORT algorithm can be used to assess the degree of immune cell infiltration among different immune modalities. The CIBERSORT analysis showed that patients in group A had significantly lower levels than those in group B. These include resting CD4 T cell memory, native B cells, regulatory T cells (Tregs), resting NK cells, resting dendritic cells, and activated mast cells. (Fig. 10A). Cluster B had significantly lower levels of memory B cells, plasma, gamma delta T cells, resting NK cells, and activated mast cells (Fig. 10B).
Figure 10.
Immune properties between 2 different immune modes. (A) Accumulation of immune cell content of cluster A and cluster B: different colors indicate different immune cells; the horizontal axis is the patient ID. (B) Histogram of immune cell content: the horizontal axis represents 22 immune cells; the vertical axis represents the cell contents; red indicates cluster A samples; blue indicates cluster B samples. (C) correlation of immune cells in cluster A patients; (D) correlation of immune cells in cluster B patients: blue indicates negative correlation; red indicates a positive correlation.
The correlation between the immune cells from groups A and B was also calculated. The results showed that naive B cells were positively correlated with resting groups of T cells in CD4 memories resting, but significantly negatively correlated with plasma cells and B cell memory (P < .05, Fig. 10C). In group A, NK cells showed a significantly positive correlation with activated neutrophils and mast cells, but not in Group B (P < .05, Fig. 10D).
3.6. Western blot analysis
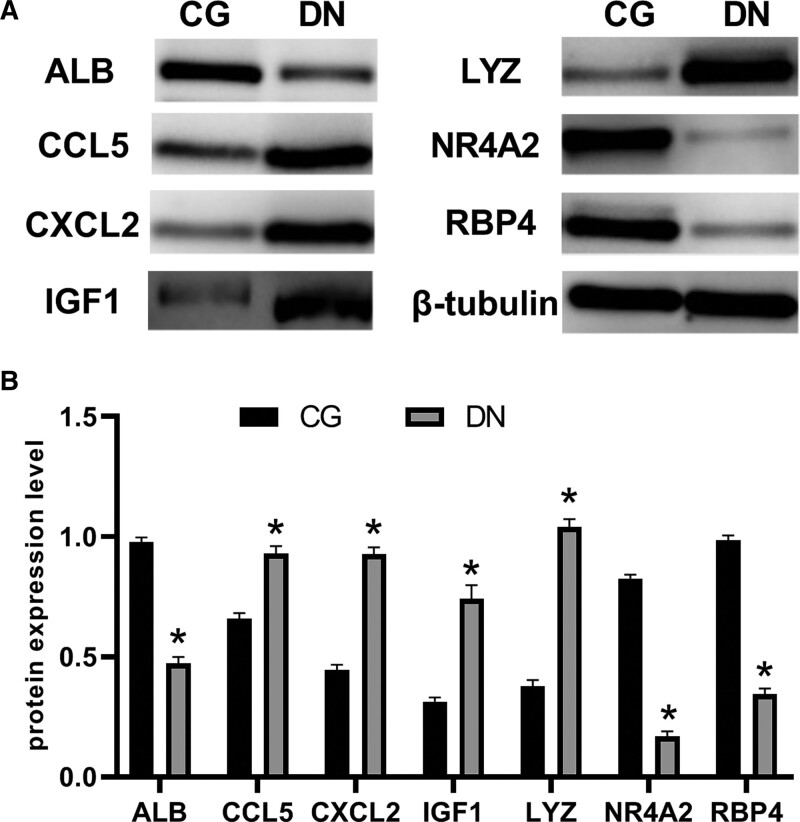
In vitro, we examined the expression of characteristic genes in RMCs that had been altered by high glucose. LYZ, CCL5, ALB, IGF1, CXCL2, NR4A2, and RBP4 had significantly different protein levels after 48 hours of incubation in HG media compared to the groups that received regular glucose medium and mannitol medium (Fig. 11).
Figure 11.
Western blot analysis of the protein levels in rat mesangial cells. LYZ, CCL5, IGF1, and CXCL2 had higher protein levels after being incubated in high-glucose medium (DN) than they had after being incubated in control group (CG). However, ALB, NR4A2, and RBP4 protein levels in DN were below those in CG.
4. Discussion
High-throughput and microarray technologies are the main methods used to explore gene expression levels and improve our understanding of the intrinsic molecular mechanisms underlying complex diseases. ESRD is mainly caused by DN. Current treatments do not provide sufficient control to stop the disease from progressing. Not all cases of diabetes progress to DN. Early treatment can help slow progression. A thorough understanding of the molecular and pathological mechanisms underlying diabetes.[18] This will allow early diagnosis and treatment. Therefore, new treatment strategies are needed. High-throughput genomic data have been used extensively to understand disease mechanisms and predict potential therapeutic targets. We performed a thorough analysis of 5 mRNA microarray datasets and identified 153 DEGs. We identified 23 Imm-DEG. Next, we validated a predictive model and screened for genes encoding LYZ, CCL5, IGF1, CXCL2, NR4A2, and RBP4. In vitro studies have shown that LYZ regulates glycosylation in the human proximal tubular cells. This is important because it can control the release and production of inflammatory mediators as well as the recruitment of macrophages to the inflammatory site. Renal biopsy studies in patients with various kidney diseases have shown that glomerular CCL5 positive cells are closely related to extracapillary lesions.[19] RBP4 expression may be affected by tubular volume or dysfunction. Human insulin sensitivity and glucose homeostasis can also be affected by RBP4 changes.[20,21]
However, experiments have not shown a direct correlation.CX3CR1, EGF, and FOS are closely related to ImmDEG. CX3CR1 is upregulated in diabetic kidneys, and in streptozotocin-induced mouse models of diabetes, CX3CR1 deficiency reduces extracellular matrix deposition, which in turn affects the expression of CCL2.[22] A and activation of Smad2/3 in the glomeruli of diabetic mice, thereby alleviating proteinuria and podocyte loss in diabetic kidneys. Studies have shown that the early stage of glomerular growth in diabetic rats is accompanied by an increase in the expression of proto-oncogenes c-fos and c-jun[23]; Meanwhile, the peroxisome proliferator-activating receptor γ-activating compound thiazolidinedione prevents the activation of the high glucose-induced TGF-1 gene by interacting with the activated protein kinase Cc-Fos-TGF-1 promoter cascade in mesangial cells (MCs)[24,25]; The study found that CXCL10 reduced collagen production by renal fibroblasts in response to high glucose and TGF-|A, suggesting that CXCL10 can inhibit downstream signaling of the TGF-|A receptor pathway.[26]
The pathway was enriched with DEGs in KEGG analysis. Increasing evidence suggests that the complement system plays a role in the pathogenesis and progression of diabetic kidney disease. First, the pattern recognition molecule binds to sugar-glycated proteins. This activates the lectin signaling pathway. Second, hyperglycemia may cause glycosylation and impairment of complement regulatory proteins. This could lead to a spontaneous complement attack by activating several complement pathways. Mannose-binding LECTIN is a pattern recognition molecule in the innate immune system that has been used to identify the possibility of disease.[27,28] The regulation and maintenance of glomerular filtration depend on the function of MCs. Abnormal proliferation of MCs can lead to accumulation of the mesangial extracellular matrix, which further promotes glomerular dysfunction and kidney disease. As the kidneys are mitochondria-rich, energetic-demanding, and metabolically active organs, renal mitochondrial dysfunction can be a major pathological factor in the occurrence of DN. Hypoxia occurs in the kidneys because of the contradiction between abnormal energy metabolism in diabetic patients and their high demand for ATP. Chronic hypoxia in the proximal tubules and other sites of the kidneys is believed to be the most common route by which DN develops into ESRD. Pantothenic acid, a precursor of coenzyme A, plays an important role in energy metabolism and mitochondria. The A-ketoglutaric acid and pyruvate dehydrogenase complexes, which are the main metabolic pathways in the TCA cycle, are key enzymes in the TCA cycle.[29,30] Studies have also shown that 4 metabolites, dihydrouracil, and uridinepropionic acids, PA, and adenosine 3-,5′-bisphosphate, are significantly reduced in patients with DN. This means that the biosynthetic pathway for pantothenic acid and coenzyme A plays an important role in the pathological and physiological processes of DN.[31] In the treatment of DN, adjuvant therapy with renin–angiotensin–aldosterone system (RAAS) inhibitors dilates bulbar arterioles and prevents progressive albuminuria and renal dysfunction by blocking the production of ACE inhibitors (ANGII) or ANGII on ANGII type 1 receptors. Hyperglycemia enhances RAAS activation, including increasing environmental levels of RAAS mediators in the kidney, and also leads to ANGII type 1 receptor localization, expression, and/or changes in sensitivity, resulting in a weakened hemodynamic response to exogenous RAAS stimulation, resulting in corresponding symptoms.
Consensus clustering was performed using the ConsensusClusterPlus software. It is important to discuss molecular typing when analyzing large samples. In this study, consensus clustering was used to group the transcriptome data and divide the samples into distinct clusters. These results revealed that there was a clear difference in the molecular patterns of the transcriptome and proteome among samples from different clusters. This allowed for molecular typing of disease samples. Similar studies have been conducted previously. The scientist obtained large numbers of lung squamous cell carcinoma samples from TCGA database and performed consistent clustering analysis on the tumor samples to determine the 3 subtypes. The results showed that subtype II has a poor prognosis for clinical survival. The clinical survival prognosis for subtype II was poor, and that for subtypes I and III was good. Good. Consistency clustering was used to identify 2 immune patterns (cluster A and cluster B). Significant heterogeneity between the 2 subgroups was confirmed by immune correlation and differential analyses. The related genes were expressed in different ways in each subgroup. We will continue to investigate the mechanism of action of these genes in the DN immune microenvironment.
Bioinformatics studies were used to examine immune infiltration between the DN and control groups. There were significant differences in the expression of LYZ and CCL5, ALB, IGF1 CXCL2, NR4A2, and RBP4, and our data suggest that DN may be associated with complement and coagulation pathway signaling pathways. These studies have also improved our understanding of how DN development. This study will aid in the study of diabetes nephropathy classification and the development of more effective treatments. Further research is needed to determine the relationship between immune infiltration and function as well as the importance of immune patterns in DN.
Author contributions
Conceptualization: Hongli Zhou.
Data curation: Shuo Wang, Shengwu Chen.
Formal analysis: Shuo Wang, Yixuan Gao.
Investigation: Shengwu Chen, Yixuan Gao.
Methodology: Shuo Wang.
Project administration: Yixuan Gao.
Software: Yixuan Gao.
Supervision: Hongli Zhou.
Validation: Shengwu Chen.
Writing – original draft: Shuo Wang.
Writing – review & editing: Shengwu Chen, Yixuan Gao.
Abbreviations:
- DN
- diabetic nephropathy
- ESRD
- end-stage renal failure
- Imm-DEG
- immune-related genes
- KEGG
- Kyoto encyclopedia of genes and genomes
- LASSO
- least absolute shrinkage and selection operator
- MCs
- mesangial cells
- PPI
- protein–protein interaction network
- RAAS
- renin–angiotensin–aldosterone system
- SVA
- alternative variable analysis
- UACR
- urinary microalbumin/creatinine ratio
The authors have no funding and conflicts of interest to disclose.
The datasets generated during and/or analyzed during the current study are publicly available.
How to cite this article: Wang S, Chen S, Gao Y, Zhou H. Bioinformatics led discovery of biomarkers related to immune infiltration in diabetes nephropathy. Medicine 2023;102:35(e34992).
Contributor Information
Shuo Wang, Email: wangshuo20182018@sina.com.
Shengwu Chen, Email: 306669726@qq.com.
Yixuan Gao, Email: 376694476@qq.com.
References
- [1].Bansal N, Katz R, De Boer IH, et al. Development and validation of a model to predict 5-year risk of death without ESRD among older adults with CKD. Clin J Am Soc Nephrol. 2015;10:363–71. [DOI] [PMC free article] [PubMed] [Google Scholar]
- [2].Carrero JJ, Grams ME, Sang Y, et al. Albuminuria changes are associated with subsequent risk of end-stage renal disease andmortality. Kidney Int. 2016;91:244–51. [DOI] [PMC free article] [PubMed] [Google Scholar]
- [3].Ducloux D, Legendre M, Bamoulid J, et al. ESRD-associated immune phenotype depends on dialysis modality and iron status: clinical implications. Immun Ageing. 2018;15:16. [DOI] [PMC free article] [PubMed] [Google Scholar]
- [4].Ellis JW, Chen MH, Foster MC, et al. Validated SNPs for eGFR and their associations with albuminuria. Hum Mol Genet. 2012;21:3293–8. [DOI] [PMC free article] [PubMed] [Google Scholar]
- [5].Chan GCW, Tang SCW. Diabetic nephropathy: landmark clinical trials and tribulations. Nephrol Dial Transplant. 2016;31:359–68. [DOI] [PubMed] [Google Scholar]
- [6].Yang B, Zhao XH, Ma GB. Role of serum β2-microglobulin, glycosylated hemoglobin, and vascular endothelial growth factor levels in diabetic nephropathy. World J Clin Cases. 2022;10:8205–11. [DOI] [PMC free article] [PubMed] [Google Scholar]
- [7].Elkholy RA, Younis RL, Allam AA, et al. Diagnostic efficacy of serum and urinary netrin-1 in the early detection of diabetic nephropathy. J Investig Med. 2021;69:1189–95. [DOI] [PubMed] [Google Scholar]
- [8].Xiang E, Han B, Zhang Q, et al. Human umbilical cord-derived mesenchymal stem cells prevent the progression of early diabetic nephropathy through inhibiting inflammation and fibrosis. Stem Cell Res Ther. 2020;11:336. [DOI] [PMC free article] [PubMed] [Google Scholar]
- [9].Fang Y, Zhang Y, Jia C, et al. Niaoduqing alleviates podocyte injury in high glucose model via regulating multiple targets and AGE/RAGE pathway: network pharmacology and experimental validation. Front Pharmacol. 2023;14:1047184. [DOI] [PMC free article] [PubMed] [Google Scholar]
- [10].Zhang L, Han L, Wang X, et al. Exploring the mechanisms underlying the therapeutic effect of Salvia miltiorrhiza in diabetic nephropathy using network pharmacology and molecular docking. Biosci Rep. 2021;41:BSR20203520. [DOI] [PMC free article] [PubMed] [Google Scholar]
- [11].Thipsawat S. Early detection of diabetic nephropathy in patient with type 2 diabetes mellitus: a review of the literature. Diab Vasc Dis Res. 2021;18:14791641211058856. [DOI] [PMC free article] [PubMed] [Google Scholar]
- [12].Niewczas MA, Gohda T, Skupien J, et al. Circulating TNF receptors 1 and 2 predict ESRD in type 2 diabetes. J Am Soc Nephrol. 2012;23:507–15. [DOI] [PMC free article] [PubMed] [Google Scholar]
- [13].Roux PP, Blenis J. ERK and p38 MAPK-activated protein kinases: a family of protein kinases with diverse biological functions. Microbiol Mol Biol Rev. 2018;68:320–44. [DOI] [PMC free article] [PubMed] [Google Scholar]
- [14].Arulkumar N, Sup LW, Yun JW, et al. Tetraarsenic hexoxide induces G2/M arrest, apoptosis, and autophagy via PI3K/Akt suppression and p38 MAPK activation in SW620 human colon cancer cells. PLoS One. 2017;12:e0174591. [DOI] [PMC free article] [PubMed] [Google Scholar]
- [15].Gluhovschi C, Gluhovschi G, Petrica L, et al. Urinary biomarkers in the assessment of early diabetic nephropathy. J Diabetes Res. 2016;2016:4626125. [DOI] [PMC free article] [PubMed] [Google Scholar]
- [16].Huang X, Liu S, Wu L, et al. High throughput single cell RNA sequencing, bioinformatics analysis and applications. Adv Exp Med Biol. 2018;1068:33–43. [DOI] [PubMed] [Google Scholar]
- [17].Tibshirani RJ, Taylor J. The solution path of the generalized lasso. Ann Stat. 2011;39:1335–71. [Google Scholar]
- [18].Kitada M, Koya D. Diagnosis and management of diabetic nephropathy. Nihon Rinsho. 2015;73:2037–43. [PubMed] [Google Scholar]
- [19].Feng ST, Yang Y, Yang JF, et al. Urinary sediment CCL5 messenger RNA as a potential prognostic biomarker of diabetic nephropathy. Clin Kidney J. 2021;15:534–44. [DOI] [PMC free article] [PubMed] [Google Scholar]
- [20].Zhang L, Cheng YL, Xue S, et al. The role of circulating RBP4 in the type 2 diabetes patients with kidney diseases: a systematic review and meta-analysis. Dis Markers. 2020;2020:8830471. [DOI] [PMC free article] [PubMed] [Google Scholar]
- [21].Mahfouz MH, Assiri AM, Mukhtar MH. Assessment of Neutrophil Gelatinase-Associated Lipocalin (NGAL) and Retinol-Binding Protein 4 (RBP4) in type 2 diabetic patients with nephropathy. Biomark Insights. 2016;11:31–40. [DOI] [PMC free article] [PubMed] [Google Scholar]
- [22].Zhou H, Mu L, Yang Z, et al. Identification of a novel immune landscape signature as effective diagnostic markers related to immune cell infiltration in diabetic nephropathy. Front Immunol. 2023;14:1113212. [DOI] [PMC free article] [PubMed] [Google Scholar]
- [23].Huang K, Huang J, Chen C, et al. AP-1 regulates sphingosine kinase 1 expression in a positive feedback manner in glomerular mesangial cells exposed to high glucose. Cell Signal. 2014;26:629–38. [DOI] [PubMed] [Google Scholar]
- [24].Wu XM, Gao YB, Xu LP, et al. Tongxinluo inhibits renal fibrosis in diabetic nephropathy: involvement of the suppression of intercellular transfer of TGF-[Formula: see text]1-containing exosomes from GECs to GMCs. Am J Chin Med. 2017;45:1075–92. [DOI] [PubMed] [Google Scholar]
- [25].Nicholas SB, Liu J, Kim J, et al. Critical role for osteopontin in diabetic nephropathy. Kidney Int. 2010;77:588–600. [DOI] [PubMed] [Google Scholar]
- [26].Schmid H, Boucherot A, Yasuda Y, et al. Modular activation of nuclear factor-kappaB transcriptional programs in human diabetic nephropathy. Diabetes. 2006;55:2993–3003. [DOI] [PubMed] [Google Scholar]
- [27].Li XQ, Chang DY, Chen M, et al. Complement activation in patients with diabetic nephropathy. Diabetes Metab. 2019;45:248–53. [DOI] [PubMed] [Google Scholar]
- [28].Bus P, Chua JS, Klessens CQF, et al. Complement activation in patients with diabetic nephropathy. Kidney Int Rep. 2017;3:302–13. [DOI] [PMC free article] [PubMed] [Google Scholar]
- [29].Baik JE, Park HJ, Kataru RP, et al. TGF-β1 mediates pathologic changes of secondary lymphedema by promoting fibrosis and inflammation. Clin Transl Med. 2022;12:e758. [DOI] [PMC free article] [PubMed] [Google Scholar]
- [30].Hinder LM, Vivekanandan-Giri A, McLean LL, et al. Decreased glycolytic and tricarboxylic acid cycle intermediates coincide with peripheral nervous system oxidative stress in a murine model of type 2 diabetes. J Endocrinol. 2013;216:1–11. [DOI] [PMC free article] [PubMed] [Google Scholar]
- [31].Ma T, Liu T, Xie P, et al. UPLC-MS-based urine nontargeted metabolic profiling identifies dysregulation of pantothenate and CoA biosynthesis pathway in diabetic kidney disease. Life Sci. 2020;258:118160. [DOI] [PubMed] [Google Scholar]


