

Abstract
Additive Manufacturing of 3D-printed sand cores using the binder jetting process is well-established in prototype manufacturing. Due to the rising focus on sustainability and the fact that printed cores are shifting to serial production, a transition from organic to inorganic binder systems is taking place. To ensure a stable casting process and reduce the scrap rate accurate simulation tools are required. However, a study about the thermomechanical properties and the anisotropy of 3D-printed sand cores has not yet been conducted. In this work the thermomechanical properties of 3D-printed sand cores in three different printing orientations using inorganic binder are given. In contrast to homogeneous materials like metals, the simulation of sand cores requires new material models due to the dependency to hydrostatic pressure. The Drucker-Prager soil plasticity model is used, and the parameters needed for the Drucker-Prager-Cap model until are analysed using the three-point-bending test, the indirect tensile test and the uniaxial compression test. In addition to these specific parameters, also general parameters required for mechanical simulation like the Young's modulus, the Poisson's ratio, the density and the thermal expansion coefficient are given. In comparison to the reference binder system for shot cores using inorganic binder, the 3D-printed cores showed a higher mechanical strength. In the tensile region due to the higher binder content and in the compressive region due to the higher AFS number. Furthermore, the binder system for printed cores showed a lower thermostability.
Keywords: 3D-sand-printing, Inorganic bonded sand, Drucker-Prager-cap model, Thermomechanical properties, FEM simulation
Highlights
-
•
First work on 3D-printed inorganically bonded sand cores at elevated temperatures.
-
•
3D-printed sand cores have a higher mechanical strength compared to shot cores.
-
•
Higher binder content and lower AFS number lead to higher mechanical strength.
-
•
Mechanical strength depends highly on the printing orientation of sand cores.
-
•
Rapid decline of mechanical properties at elevated temperatures.
1. Introduction
Regarding the annual total weight of cast parts, sand mould casting has the largest market share of all casting processes, making it one of the most significant manufacturing technologies. In addition to heavy steel casting parts, it is crucial for complex geometries created by die casting with inlaid sand cores used for mass production. Utilizing 3D-sand-printing (3DSP) to produce more complex geometries brings an even higher degree of design freedom for sand casting and the possibility to combine geometries to gain an economical advantage in comparison to conventional sand cores. Some applications of 3D-printed cores (in the following described as “printed cores”) already made it to serial production, for example, water-jacket cores for automotive aluminium cylinder head applications.
The state-of-the-art 3D-printing process for sand moulds is binder jetting, where a print head applies the liquid binder selectively to the sand bed. An alternative approach to 3DSP is selective laser sintering (SLS). The relevance of SLS for 3DSP is limited due to issues with shrinkage rate, the need for an organic phenolic resin binder and the lack of scientific and case studies [1].
In response to the growing emphasis on sustainability, decarbonization, and emissions, a change in binder type started in the middle of the 2000s. Organic binder used for core shooting processes, that emits CO2 as well as several toxic gases [2] is gradually replaced by the more environment friendly and CO2 neutral inorganic binder. Sand moulds and cores are created during the core shooting process, by fluidizing the sand binder mixture with compressed air. Once the mould is filled with this fluidized moulding material and the air has been let out through vents, the sand binder mixture is left in the mould. Depending on the type of binder, either a catalyst gas or dehydration is used to cure the sand mould. Although inorganic binders, primarily waterglass, with shot cores are state-of-the-art in foundries today [3], few studies on inorganically bonded 3D-printed cores have been conducted, although 3DSP has also shown the transition from organic to inorganic binder in the last ten years. To be able to compete with the shot cores in terms of manufacturing costs the core geometries are getting more complex.
For these complex and thin-walled casting structures as well as for highly complex sand cores, precise simulation tools are required. Historically, the focus of casting simulation was on the casting itself. In recent years, research has also been focused on developing new material models to simulate the hot distortion of bonded sand in the casting process [4]. For example, the modified Drucker-Prager-Cap model (DPC) showed good agreement with experiments for modelling porous materials and describing the hot distortion of sand cores [5]. The thermomechanical properties of inorganically bonded 3D-printed sand cores needed for modelling the material's behaviour are nearly completely unknown. Only a few research studies were published, for example about the accuracy of 3DSP using inorganic binder [6] or the bending strength at room temperature [7]. The thermomechanical properties should still follow the structure of shot cores using inorganic binder [8], but the mechanical strength level at room temperature and the dependency on the printing direction are still unknown.
In this work, the methods of analysing the parameters for the DPC model at room temperature (RT) and elevated temperatures (ET) are shown. These parameters are the three-point-bending test (3PB) the indirect tensile test (ITT) and the uniaxial compression test (UCT). To complete the database of mechanical properties, the Young's modulus () the Poisson's ratio () the thermal expansion coefficient () and the density () are also measured and analysed. Due to the anisotropic properties of printed cores, the parameters are analysed for two to three different orientations of the cores in the print bed and compared to a standard shot sand core with inorganic binder. Concluding this work, the parameters of the Drucker-Prager-Cap (DPC) model are analysed and put in context.
2. Theory
2.1. Introduction to solid mechanics
In solid mechanics the physics of continuous materials is described. The fundamental Hooke's law correlates the stress with the elastic strain through Young's modulus following . The Poisson's ratio is a material property to measure the deformation of the material perpendicular to the direction of loading. The three-dimensional Hooke's law takes the Poisson's ratio into account: with and indicating the direction, the shear modulus , Lamé’s first parameter and the Kronecker delta .
The total strain in temperature dependent cases consists of the elastic strain the inelastic strain and the thermal strain . They are combined in the strain decomposition equation: [9]. The elastic and inelastic strain depend on the loading of the material whereas the thermal strain is driven by the temperature history () and it is defined as [10]:
| (1) |
Using the temperature dependent thermal expansion coefficient , which can be derived from the initial length and the change of length resulting in: .
In three-dimensional load cases the stress state is described by normal and shear components. These components depend on the chosen coordinate system and the load case. The equivalent von Mises stress is proportional to the second invariant of the deviatoric stress tensor and given by: . The deviatoric stress tensor is calculated from the stress tensor according to Eq. (2):
| (2) |
It is assumed that the second invariant of the stress deviator can be used to compare stress states for different load cases. Using the von Mises stress hypothesis it is possible to compare the general 3D stress state to 1D and by that compare to uniaxial tensile tests. Yield functions are defined in this way and are used to characterize the material behaviour and e.g. determine when the material starts to yield.
2.2. Drucker-Prager-Cap model
Metals and other solid materials are assumed to be independent of the hydrostatic pressure and the mechanical behaviour and risk of failure are described by yield functions based on von Mises equivalent stress hypothesis. This assumption is based on experimental observations where yielding is typically similar in compression and tension for metals.
Porous materials like sand moulds made of (quartz) sand and an adhesive, here called binder, show a different behaviour in compression and tension. The sand-binder mixture must be described by different constitutive models, which don't use the standard -plasticity formulation given by the deviatoric stresses. For these cases there are soil plasticity models to describe the behaviour of bonded sand [11]. The DPC model is one of the proposed models fitting the requirements to describe the behaviour of porous materials. This model is usually described in the plane. In this formulation is the hydrostatic pressure which correlates with the first invariant of the stress tensor and is the before mentioned von Mises equivalent stress that takes the influence of the deviatoric stress into account using the second invariant of the deviatoric stress tensor [12].
The yield condition of the DPC model is described by two surfaces, the Drucker-Prager yield surface and the cap yield surface with an elliptic form (Fig. 1). The two surfaces are described using Eq. (3) and Eq. (4) [13]:
| (3) |
| (4) |
With the variables according to Fig. 1 and as the deviatoric component of and .
Fig. 1.

Yield Surfaces of the Drucker-Prager-Cap model (from Ref. [13]).
Unlike the von Mises hypothesis, the DPC model is sensitive to hydrostatic pressure so the threshold for compression and tension is not equal and more than experiment must be conducted to determine the mechanical properties. The tests need to provide information about the mechanical behaviour of the material for different stress states meaning positive and negative pressure.
It is known that specimens manufactured by powder bed-based processes like binder jetting or SLS show anisotropic physical and mechanical properties. In contrast to shot cores, 3D-printed sand cores need to be analysed depending on their printing orientation (e.g. printed lying or standing). To keep the measurements at a reasonable level and due to Ref. [14] who found out, that the x- and y-orientation of sand cores are not significant, only two or three different orientations were tested depending on the individual experiment.
The most general test is the triaxial test where different load levels can be applied for different pressures so in theory the compression side of the Drucker-Prager yield surface and the cap yield surface can be analysed. At the same time, it's the most difficult and cost-intensive test. In comparison to the other tests that are discussed later, the triaxial test is the only test, that can provide information about the shape of the cap yield surface . However, it is assumed that the cap yield surface is not too sensitive to the different manufacturing processes and materials, due to the compressive forces between the sand grains in the area of the cap. Having this in mind, the cap yield surface determined for shot cores in earlier tests was applied and fitted for 3D-printed cores using inorganic binder (see Section 4.6).
can be described by three common mechanical tests. The first one is the 3PB, which describes the behaviour of the specimen during tensile loading. The beginning of the compression region is described by the ITT or Brazilian disc test whereas the latter part it described by the UCT. To be able to describe the high temperature behaviour using the DPC model these three tests are conducted starting from RT until .
The fracture forces given by the three experiments can be assessed by Table 1 using the length , width and height of the specimens. The failure stress , and the DPC parameters and can be determined [12]:
Table 1.
Expressions using the specimen's dimensions and fracture force to calculate , , and for various stress states.
| Test | |||
|---|---|---|---|
| 3PB | |||
| ITT | |||
| UCT |
Like for other material models the Young's modulus () of the specimens must be determined for room and elevated temperatures to relate the stress in the material to the elastic strain as described in the previous chapter. As proposed by Ref. [7] the influence of the manufacturing process of sand cores has a small influence on compared to the binder system, whereas [15] reported an increase of with increasing compression. The last missing parameter to describe the strain is the Poisson's ration that is measured in the same experiment as .
To take all occurring strains into account the thermal expansion coefficient is determined to calculate the thermal strain . The temperature dependent density is determined using and the density at room temperature. .
2.3. Difference between 3D-printed and shot sand cores
To understand and explain the varying results between printed and shot cores, the differences in the manufacturing processes must be clear. There are three main differences between these cores.
-
•
The compression rate and -level during the printing process is lower than in core shooting. During printing the sand grains of each new layer are compressed by a set of recoater-blades. Internal experiments showed that with a higher compression in 3D-printing using inorganic binder with microwave hardening the difficulty of manufacturing dimensionally accurate sand cores increases. Whereas during core shooting it is necessary that the whole specimen is pressed in the mould by pressured air at up to . This leads to a lower density for printed cores and to a lower three-point bending strength (3PBS) [16]. The influence of the lower density to other parameters will be discussed in this work.
-
•
Because of the selective application of the binder during printing the binder must be able to interconnect each layer of the sand core [17]. Compared to core shooting the liquid binder is not mixed with the sand prior to the process. This requires depositing more binder during the printing process to ensure a sufficient strength of the printed sand cores. Nonetheless the amount of binder has to be minimized to prevent defects during casting due to the gas shock and to avoid negative influences on the manufacturing process. These influences can either be contamination of the recoater-blades due to binder adhesion or inaccuracies due to overflow of the binder [6]. Additionally, the binder system for core shooting contains a promotor that improves the thermostability of the sand cores at high temperatures.
-
•
Due to the requirement of a thin layer of sand during printing the mean grain size of sand used for the printing process must be lower than usual silica sand used for core shooting. The authors are not aware of any research on the influence of the grain size on the mechanical properties of sand cores, so it is analysed in section 3.2 of this work for three-point bending.
In addition to these differences, the aforementioned anisotropy of 3D-printed cores is also to be considered.
3. Material and methods
3.1. Manufacturing processes of silica sand specimens
The specimens for the measurements were produced using GS14 and H32 silica sand for printed and shot cores respectively. In Fig. 2 the different sand grain size distributions for GS14 and H32 are shown. Table 2 shows that although the mean grain size of H32 is about times higher than GS14 the bulk density of both sands is nearly the same. The authors aren't aware of any studies examining how different sand sizes affect the mechanical properties of sand moulds. Therefore, a brief experiment was conducted in chapter 3.2 to determine the influence of grain size on 3PBS. It should be mentioned that the 3PBS of shot cores was used as a reference during the development of the 3D printing process. Chapter 4 discusses how different grain sizes affect other mechanical properties.
Fig. 2.

Grainsize distribution of GS14 and H32 Sand.
Table 2.
| GS14 | H32 | |
|---|---|---|
| AFS | 99 | 45 |
| Mean Grainsize in | 130 | 320 |
| Bulk Density in | 1.32 | 1.40 |
For the 3D-printing process a BFD binder system (Reinsicht GmbH Gerling, Germany) is used. GS14 silica sand is mixed with fluid additive TREXEA and powder additive ahead of the printing process. A thick layer of this mixture is applied to the powder bed by the recoater. Approximately of liquid binder KB-EX is selectively deposited on the powder bed. The recoating and binder depositing process is repeated until the desired sand cores are finished. Presumably the connection between the single layers creates a weak interface regarding the mechanical properties which is further investigated in this work.
Once the 3D-printing process is finished the parts are cured in a microwave oven for or for horizontally or vertically printed cores respectively [18]. The cores are printed on a ExOne Exerial 3D-printer that can hold up to two job boxes with a powder bed of .
For core shooting an Inotec binder system (ASK Chemicals GmbH Hilden, Germany) was used. For this process EP 4158 silica binder, WJ4500 and TC4500 promotor are mixed with H32 silica sand. A Laempe L1 sand shooting machine is used with an air pressure of . The core is cured in the tool for at and degassed with hot air for .
The various geometries used for the experiments are shown in Fig. 3. The bending bar a) is used for 3PB and , b) for ITT and UCT, c) for and d) for . For 3PB UCT and ITT the samples were heated in an oven and after reaching a homogenous temperature they were directly taken out and placed onto the testing fixture. During the specimen handling the temperature would inevitably decrease on the surface. To determine the minimum time in the oven and how fast the samples will cool down after taking them out, temperature measurements were carried out.
Fig. 3.

Geometries of specimen used for the experiments.
One bending bar (Fig. 4a)) and one cylinder (Fig. 4b)) were prepared with holes for thermocouples. One in the middle of the specimen and one in the outer quarter. These positions were chosen to examine the heating and cooling behaviour of the two geometries as well as the extent of the inner and outer region differences. After mounting the thermocouples, the holes were carefully covered to reduce any influence on the temperature measurements. The heating and cooling curves were monitored for a specified oven Temperature in steps for printed and shot cores. In Fig. 5 the results are displayed for printed cores and . As expected, the outer layer of the bending bar and test cylinder are heating up and cooling down faster than the middle part. The bending bar is near a homogenous temperature after and the test cylinder after respectively. The same results were seen for shot cores and over all temperature steps.
Fig. 4.

Position of thermocouples: a) Bending bar; b) Test cylinder.
Fig. 5.

Heating and cooling curve of thermocouples in the test cylinder and the bending bar.
3.2. Comparison of GS14, H33 and H32 silica sand
To ensure a good recoating behaviour during the 3D-printing process the sand grain size must be sufficiently small. The mean grain size of GS14 silica sand is approximately half the chosen layer thickness of the 3D-printing process. This ensures a sufficient recoating behaviour [14].
As stated above the authors are not aware of any study regarding the influence of the grain size on the mechanical properties of sand forms, so a brief test was conducted comparing the 3PBS of shot cores using Inotec binder system for silica sands with three different sand grain size distributions. H32 and GS14 are mentioned in Table 2 and for the third sand H33 was used with a AFS number of 53 and an average grain size of , so the grainsize is smaller than H32 but bigger than GS14. H33 was chosen as a third sand, because the sand was available and 3PB specimen are tested for quality management reasons regularly.
Fig. 6 shows the 3PBS immediately after the core shooting process (3PBS0h) and after 24 h (3PBS24h). 3PBS0h is and lower for H33 and GS14 respectively and 3PBS24h and lower.
Fig. 6.
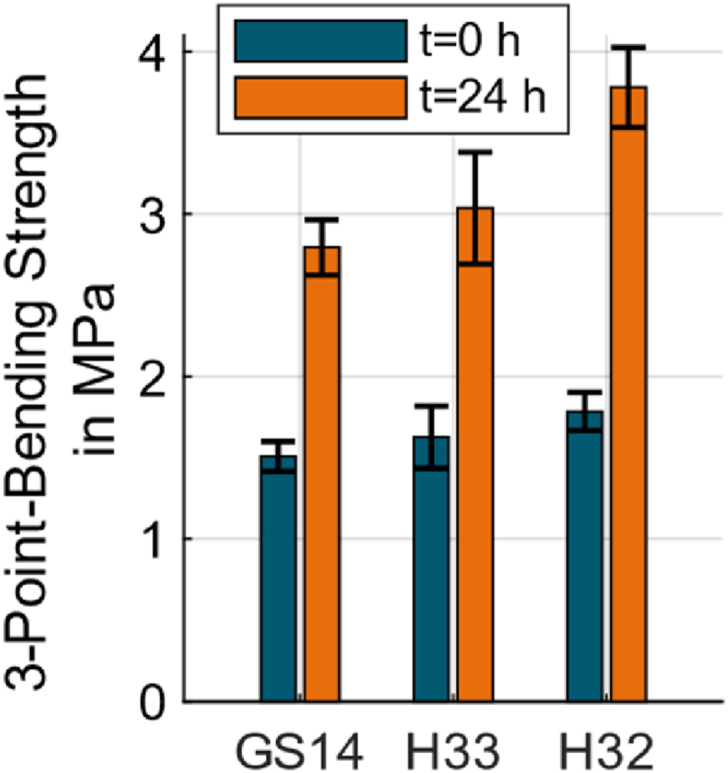
Three point bending strength of H32, H33 and GS14 with Inotec binder system.
With decreasing sand grain size, 3PBS0h and 3PBS24h decreases. This decrease is most likely due to the increasing specific surface (given in Table 2, for H33: ). The smaller sand grains are not entirely coated by the binder during the mixing process. This leads to more faulty binder bridges between the grains and therefor to a lower 3PBS. The decrease of 3PBS24h for H32 and H33 in comparison to the decrease for H33 and GS14 is bigger, which indicates, that the explained effect also decreases with a lower sand grain size.
On the contrary a smaller grain size leads to a higher green strength in metal 3D-printing [21]. That means there is a possibility that a smaller grain size during the 3DSP process even leads to a higher 3PBS so additional tests must be conducted to see the influence of grain size on 3D-printed sand cores.
3.3. Thermal expansion and density
In the first tests the density and the thermal expansion coefficient are determined. The thermal expansion is important for two reasons. (1) To determine the volume change of the specimen during the casting process and therefore, as described above, to determine the induced thermal stress. (2) It provides an easy method to calculate the temperature dependent density .
The specimens to determine the density at room temperature are cubes with an edge length of 60 mm according to Fig. 3d). For every dimension the actual length was measured at three different positions to derive a mean length at RT. From this the mean volume was calculated and together with the mass the density was determined.
To measure specimens according to Fig. 3c) were measured with a Dilatometer NETZSCH DIL 402 Expedis (Fig. 7a) before and Fig. 7b) after the measurement). The contact pressure of the linear variable differential transformer (LVDT) was set to and the heating rate until a maximum temperature of .
Fig. 7.

Specimens (; Fig. 3c)) before and after dilatometer measurement. The change of colour is due to the degradation of the additive. a) Before measurement; b) After measurement.
With and the thermal expansion coefficient (see Eq. (1)) it is possible to calculate according to:
| (5) |
The influence of the specimen density to the mechanical properties and Young's modulus is to be determined.
3.4. Three-point-bending test
According to Ref. [22], 3PB provides information to the tensile behaviour of the specimen. Therefore, 3PB gives information about the tensile region of the DPC model. It is on one side the most common quality test for sand cores because it can be a quick and easy quality control for the sand-binder system and on the other side it is established as an important parameter for the mechanical strength of sand cores in researches [14,23]. The 3PBS is influenced by many process parameters, like the sand grain size (as shown in chapter 2.3), the density and therefore the compression in the 3D-printing process [16] and the binder content of the specimen [24].
The measurements are carried out on a Zwick/Roell Z030 testing machine with a distance between the lower supports of , a preload of and a cross head speed of . The force is measured with a force sensor on top of the cross head. The stress can be calculated according to Table 1.
For three different orientations (Fig. 8) the compression stress, illustrated by a red arrow, is induced by the cross head. It can be seen that the 3PBS will most likely be affected by the different orientations of the specimens due to the induced tension stresses at the bottom of the bending bar (blue and white arrows).
Fig. 8.

Different orientations of 3PB using specimens shown in Fig. 3a). With compression (red) and tension (blue and white) stresses: a) Orientation 1; b) Orientation 2; c) Orientation 3.
In orientation 1 (O1, Fig. 8a)) the tension stress at the lowest point of the specimen is induced in one layer only that can lead to a worse performance. Whereas orientation 2 (O2, Fig. 8b)) is most likely performing better, because the tension stresses are induced in all layers at the same time. Orientation 3 (O3, Fig. 8c)) is expected to be the weakest one, because the tension stress is induced perpendicular to the weak connection between layers.
For shot cores (S), O2 and O3 the specimens were measured at in steps. Because, after preliminary tests O1 is not expected to perform highly different to O3, the evaluation temperature of O1 is chosen as in steps. For each temperature and orientation, 5 individual bending bars were tested.
3.5. Indirect tensile test
To determine the tensile strength of brittle material an ITT, also known as the Brazilian disc test, is used. For this test the test cylinder is placed horizontally on the fixture to induce a diametrical compression. Despite its name, the ITT is used to determine the beginning of the compression region of the DPC model. This is due to the biaxial stress fields of compression and tension stresses induced by the load as seen in Fig. 9 [25]. In this biaxial stress fields, brittle materials fail in tension rather than compression [26].
Fig. 9.

Orientation of specimen in indirect tensile test: a) O1; b) O2; c) O3.
Although usually the Brazilian disc test is carried out with thinner specimen () [27] the same geometry as for UCT (according to Fig. 3b)) was used for the ITT. The manufacturing of the shot specimen would necessitate the use of a new tool. It is assumed that the results using this specimen are still accurate as long as the usual fracture pattern occurs (diametral fracture from the top to the bottom of the specimen), even though the larger height could result in a higher fracture force (up to ) due to a non-homogenous stress state [12].
Regarding the orientations and the induced compression and tension stresses in Fig. 9 (similar to 3PB in Fig. 8), O2 (Fig. 9b)) is most likely to be the weakest, because in this orientation the tensile stresses are perpendicular to the weak connection between layers. For O1 (Fig. 9a)) the tension stresses are induced parallel to the layers, so it is assumed to perform better than O2. The indirect tensile strength (ITS) of O3 (Fig. 9c)) is most likely also higher than O2 but will be discussed in the course of this work.
Due to the expected differences between all orientations, the specimen of all three types were tested for all temperatures, according to O1 and O3 in 3PB. For all orientations and temperatures 5 specimen per temperature were tested.
3.6. Uniaxial compression test
After the solidification in the casting process, the cast part contracts during cooling to room temperature and induces compression stresses in the sand mould. Being able to model the behaviour of the sand form in this case the UCT is conducted [28]. The same geometry used for ITT is placed on the platen of the testing machine horizontally. To ensure the failure surface does not interfere with the shear stresses induced by the fixture the height/diameter ratio was chosen so that [29].
Because there is no difference between O1 (Fig. 10a)) and O2 (Fig. 10b)) in this experiment, one orientation was tested and named O1. The expected fracture pattern is shown in Fig. 10 as a green line. Taking this fracture pattern into account it is expected, that O3 performs better under compression than O1. The fracture has to pass through multiple layers for O3, whereas for O1 it will most likely go along the weak connection between layers and only through a small number of layers. All specimens (S, O1 and O3) were tested at RT and in steps.
Fig. 10.

Orientation for UCT measurement: a) O1; b) O3.
3.7. Young's modulus and Poisson's ratio
As stated above is one of the key parameters for mechanics and every finite-element simulation (FEM). It quantifies the relationship between stress and strain and is important for the elastic deformation of the specimen.
was measured with an acoustic stimulation method, according to ASTM C1548-02 [30]. The bending bar is placed on two thin ceramic supports. Two kinds of measurements were conducted, one for RT in the torsional mode where the stimulating impulse inducing impactor can be placed at any end of the bending bar and the acoustic sensor to record the acoustic signal is placed on the opposite side with a RFDA system 23 (IMCE, Belgium) (Fig. 11a)) [31]. In addition the Poisson's ration is measured for shot cores and printed cores of O1 and O3.
Fig. 11.

Different modes of acoustic measurements to determine and : a) Torsional mode; b) Transverse flexural mode.
The test setup for the second measurement from RT to requires the transverse flexural mode due to space limitations in the oven. The stimulating impulse is induced at the bottom in the middle of the specimen and the acoustic sensor is placed directly above (Fig. 11b)). This measurement was conducted with a RFDA HT1750 (IMCE, Belgium) and a heating rate of . In this test setup the simultaneous measurement of two specimen is possible, but the temperature dependent Poisson's ratio can't be measured due to the different placing of the stimulating impulse and acoustic sensor. As a first approximation it is assumed, that does not change significantly with temperature.
4. Results and discussion
4.1. Thermal expansion and density
The thermal expansion coefficients for printed and shot cores show a typical curve pattern for silica sand with a high increase around the quartz phase transition at (see Ref. [32]). Until is the same for all specimens (Fig. 12). Above the quartz phase transition of printed cores is as high as for O1 and O3 whereas of shot cores is only . The higher expansion can be explained by the lack of thermostability of the binder and therefore a lower resistance against the thermal expansion induced by the quartz phase transition. As mentioned earlier the binder system for shot cores contains a promotor to increase thermostability, so the high temperature adhesion of the sand grains is higher compared to printed cores.
Fig. 12.

Results for and for O1 and O3 compared with shot cores. O2 omitted due to redundancy to O1.
For temperatures over of O3 exceeds O1 for another . This additional increase can be explained by the weak connection of the layers of O3 in axial direction due to the printing process.
The density at room temperature is determined by the volume and mass of the specimen according to Fig. 3d). Overall, 3 specimens for printed and 3 for shot cores were analysed. The density at room temperature is and for printed and shot cores respectively (Fig. 12). This leads to a lower density for printed cores. Due to the nearly identical bulk density of GS14 and H32 this difference is attributed to the lower compression level during the 3D-printing process explained in chapter 2.3.
The temperature dependent density is calculated according to equation (5) with the initial density. The decrease of density is the same for printed and shot cores. O1 and O3 differ a small amount above caused by the small differences of .
4.2. Three-point-bending test
The following material properties were determined using the fracture force to determine the failure stress as described in Table 1. The three-point bending strength (3PBS) for all specimens is shown in Fig. 13. The 3PBS of shot cores is and shows a good agreement with other measurements of shot cores with inorganic binder that are about [33]. During the development of the 3D-printing process the 3PBS of shot cores was chosen as a reference for 3D-printed cores in orientation 1. Therefore there is only small difference between shot cores and O1 at room temperature. The 3PBS of O1 at room temperature is . The lower compression and smaller sand grain size in the 3D-printing process, that lead to a lower 3PBS, are compensated by the higher binder content.
Fig. 13.

Results of 3PB for O1, O2 and O3 compared with shot cores.
The simultaneous induction of tension stresses in all layers in O2 results in a fracture stress of for O2 and is higher compared to shot cores. Printed cores in Ref. [7] show the same behaviour, where the 4-point-bending strength for printed cores was higher compared to shot cores, although there was no mention about the orientation of the printed cores.
With a 3PBS of the fracture stress of O3 is similar to O1 although the tension stresses are induced perpendicular to the weak connection between layers.
For elevated temperatures the higher 3PBS for O2 decreases until it's not significantly higher at compared to other orientations. This decrease of 3PBS is seen for all specimens but is decreased between and . For O3 even an increase in 3PBS can be observed. Above the degradation of the binder used for printing is obvious, whereas the strength of the thermostable binder for core shooting is increasing. The residual 3PBS at is , and for O1, O2 and O3 respectively. The printed cores besides O1 perform poorly compared to the shot cores with a residual 3PBS of . As mentioned above the especially low results in 3PBS of O3 are most likely due to the tensile stresses at the bottom of the specimen induced perpendicular to the weak connection between layers. It should be mentioned that the preload for O3 had to be lowered to for temperatures over to get viable results and the bending bar usually breaks at more than one position, as seen in Fig. 14. So the binder degradation due to the missing promotor has an especially strong effect for O3.
Fig. 14.

Fracture pattern of O3 bending bar at 400 °C.
4.3. Indirect tensile test
Regarding ITS at room temperature, Fig. 15 shows a higher, and lower ITS compared to shot cores for O1, O2 and O3 respectively. The higher ITS of O1 is due to either the higher binder content of printed cores or the fact, that the tensile stresses are induced parallel to the weak connection between layers and the specimen breaks perpendicular to the layers. Regarding O2, the fracture occurs parallel to the weak interface plane so the ITS is decreasing [34]. The decrease for O3 seems arbitrary, also because ITS increases at and then decreases again by for . This can be explained by not fully cured cores at RT or possibly there is an influence of the x-y orientation during the printing process. Because the O3 specimens were printed vertically the direction of the print head can't be determined and the specimen is placed in a random angle in the testing machine. Also, the different fracture patterns of O2 (Fig. 16a)) and O3 (Fig. 16b)) should be noted, that can also explain the higher standard deviation.
Fig. 15.

Results of ITT for O1, O2 and O3 compared with shot cores.
Fig. 16.

Typical fracture pattern of specimens of ITT: a) Specimen O2; b) Specimen O3.
For elevated temperatures the ITS of all specimens decrease until and stays on a constant level or is slightly increasing until . If the ITS below is not taken into account, the ITS of O1 and O3 are very similar.
The residual ITS at is , and for O1, O2 and O3 respectively compared to for shot cores. The large deviation at lower temperatures leads to a misleading residual ITS for O3. The residual ITS for O1 and O2 are similar to the residual ITS of shot cores, so it appears that the thermostability of the binder does not have much influence on ITS at elevated temperatures. Therefore, it is possible to assume, that ITS is higher for O1 at RT because the weak connection between layers is perpendicular to the fracture plane of the specimen.
The slight increase of ITT between and , that can also be seen in Fig. 13, is a result of melt phases that begin to form as described in Ref. [32].
4.4. Uniaxial compression test
Fig. 17 shows that the uniaxial compression strength (UCS) of printed cores O1 and O3 at RT is and higher than the UCS of shot cores. The standard deviation for printed and shot cores is comparatively high, especially for O3, that can be explained by the atypical fracture pattern compared to O1, where the fracture always occurs parallel to the weak interface (O1: Fig. 18a), O3: Fig. 18b)).
Fig. 17.

Results of UCT for O1 and O3 compared with shot cores. O2 omitted due to redundancy to O1.
Fig. 18.

Fracture patterns of UCT: a) O1; b) O3.
Similar to RT, the UCS for elevated temperatures of printed cores is significantly higher than for shot cores, although the difference between O1 and O3 isn't significant anymore. The constantly higher UCS of printed cores is most likely due to the higher AFS number of GS14 silica sand and therefor a higher compression strength. In contrast to 3PBS and ITS the higher UCS is not mainly due to the higher binder content in printed cores because of the previously shown low thermostability of the binder. So for the higher binder content to be the governing parameter to determine the UCS of 3D printed sand moulds the UCS had to decrease more at high temperatures like seen in 3PBS, nonetheless the differences in binder can play a minor roll regarding the material properties. This is seen in the assimilation of UCS of O1 and O3 at higher temperatures, that can be caused by the binder degradation. That means that the binder is the reason for the differences of O1 and O3 at low temperatures and the different grain sizes is the reason for the offset of 3D-printed cores compared to shot cores.
The residual UCS of O1, O3 and shot cores at is , and respectively. The higher residual strength of O3 confirms the higher AFS number to be the reason for the higher UCS of printed cores. The smaller residual strength of O1 is misleading, due to the much higher initial UCS at room temperature. The UCS of O1 at is still higher than the UCS of shot cores.
4.5. Young's modulus and Poisson's ratio
The acoustic determination of the Young's modulus in Fig. 19 shows that at RT of printed cores is lower compared to shot cores. From previous publications the values for shot and printed cores are about to and respectively and match the measurements of this work for and well [7,35]. The Young's modulus of O1 and O2 showed no difference and for O3 was lower, which is within the error of measurement. The lower of all printed cores is most likely due to the lower density [36].
Fig. 19.

Results of the Young's modulus for O1 compared with shot cores. Due to contamination and fracture only O1 could be measured to a Temperature of 350 °C.
It must be noted that the Young's modulus of printed cores at elevated temperatures could only be measured for O1 and until 350 °C, due to contamination of the impulse inducing impactor by small sand grains emitted by the specimen. The Young's modulus of shot cores slowly decreases over temperature to until near the phase transition of quartz. Over the phase transition decreases by after which it slowly increases to at . The behaviour of the Young's modulus around the phase transition is according to the behaviour of pure quartz with the difference that the regeneration of the Young's modulus of shot cores after phase transition is not as distinctive as for quartz [37].
The behaviour of of shot and printed cores until is similar. The hypothesis here is that the behaviour above that temperature is also similar, so the values of shot cores are normalized to calculate the equivalent values for printed cores according to equation (6) and marked by the dashed line in Fig. 19.
| (6) |
With: calculated Young's modulus of printed cores, Initial Youngs's modulus of printed cores, Young's modulus of shot cores, Initial Young's modulus of shot cores and Temperature.
As the measured and calculated curve of 3D-printed cores show (dashed line and “+” in Fig. 19) the data until are nearly identical, including the decrease until and increase until . This enables the use of the calculated data for the simulation. It seems that for inorganically bonded sand cores the progression of the curve is similar, only the starting value of at room temperature is dependent on density and binder type.
The Poisson's Ratio for printed and shot cores was determined to and respectively at RT.
4.6. Proposal for Drucker-Prager-Cap model in P-Q plane
The previously analysed mechanical properties are transformed to the plane according to Table 1 and shown in Fig. 20a) and Fig. 20b) for shot and 3D-printed cores respectively.
Fig. 20.

Combined Drucker-Prager yield surface and cap yield surface of selected Temperatures: a) Shot cores; b) 3D-printed cores.
The triaxial test at for shot cores shows a lower mechanical strength compared to 3PB, ITT and UCT at . The lower strength level was caused by improper storage of the inorganic bonded cores and thus binder degradation due to humidity. The brittleness of the shot cores also made it difficult to portrait the shape of the cap yield surface. Due to these challenges during the triaxial tests, these were only considered as an orientation for the DPC curve. The shape of the cap yield surface was based on triaxial tests of organic bonded 3D-printed sand cores [38].
Regarding 3D-printed cores, a conservative approach was chosen, that means the weakest orientations for all tests were selected. The 3PBS is represented by O1, the ITS by O2 and the UCS by O3. To consider the anisotropy, individual data for all three orientations can be taken into account.
On a basis of these measurements and according to the DPC curve for shot cores (Fig. 20a)), extrapolated curves for the 3D-printed cores are generated. These extrapolated curves show a proposal, how the combined Drucker Prager and cap yield surface of the DPC model could be implemented in a simulation database. To determine the Drucker-Prager yield surface the position of the 3PB, ITT and UCT and the slope of the triaxial tests is considered. The cap yield surface was shaped according to the triaxial tests of organic bonded cores, analysed in Ref. [38]. Due to numerical reasons the transition at both ends of the Drucker-Prager yield surface are smoothened (”+” in Fig. 20).
5. Conclusion and outlook
The behaviour of 3D-printed specimens in compression and tension at high temperatures is covered in detail for the first time in this study and compared to a reference binder system for shot cores. The combined Drucker-Prager and cap yield surface of the Drucker-Prager-Cap model could be suggested using the findings of this work. This material model can be used to simulate highly complex 3D-printed sand cores during the casting process, which is crucial to lower R&D costs and scrap rate of newly developed cast parts using these sand cores.
-
•
While the thermal expansion coefficient only varies above the quartz phase transition (, the density of printed cores is lower than that for shot cores, due to the lack of compression during the 3D-printing process.
-
•
3D printed specimens show mechanical strength equal to or greater than shot specimens at room temperature. Due to a less thermostable binder system, the advantage of printed cores over shot cores decreases with higher temperatures. Horizontally printed specimens show a higher mechanical strength than vertically printed specimens. The higher binder content and higher AFS number of the printed specimens are the causes of the higher compression strength
-
•
Young's modulus of printed cores could only be determined up to and is lower compared to shot cores. The transfer of the Young's modulus of shot cores to printed cores above was presumed due to the similar measurement progression up to that point.
Future research should focus on improving the thermostability of the binder used for printed cores due to the high temperatures during the casting process. This also leads to a high sensitivity to creep due to buoyancy of the printed core in liquid aluminum, which was found during further investigation. Although this work made the first step, it is still not clear how the size of the sand grains will affect the results of the uniaxial compression test and indirect tensile test.
Author contribution statement
Jochen Wendling: Performed the experiments; Analysed and interpreted the data; Contributed reagents, materials, analysis tools or data; Wrote the paper.
Jesper Thorborg: Conceived and designed the experiments; Analysed and interpreted the data; Contributed reagents, materials, analysis tools or data.
Marcel Sterzenbach: Analysed and interpreted the data; Contributed reagents, materials, analysis tools or data.
Johannes Schüssler: Performed the experiments; Analysed and interpreted the data.
Andreas Bührig-Polaczek: Conceived and designed the experiments; Analysed and interpreted the data.
Data availability statement
Data will be made available on request.
Declaration of competing interest
The authors declare that they have no known competing financial interests or personal relationships that could have appeared to influence the work reported in this paper.
References
- 1.Le Néel T.A., Mognol P., Hascoët J.-Y. A review on additive manufacturing of sand molds by binder jetting and selective laser sintering. Rapid Prototyp. J. 2018;24:1325–1336. doi: 10.1108/RPJ-10-2016-0161. [DOI] [Google Scholar]
- 2.Tiedje N., Crepaz R., Eggert T., Bey N. Emission of organic compounds from mould and core binders used for casting iron, aluminium and bronze in sand moulds. J. Environ. Sci. Health, Part A: Toxic/Hazard. Subst. Environ. Eng. 2010;45:1866–1876. doi: 10.1080/10934529.2010.520595. [DOI] [PubMed] [Google Scholar]
- 3.Polzin H. first ed. Fachverlag Schiele Schön; Berlin: 2014. Inorganic Binders: for Mould and Core Production in the Foundry. [Google Scholar]
- 4.Ettemeyer F., Schweinefuß M., Lechner P., Stahl J., Greß T., Kaindl J., Durach L., Volk W., Günther D. Characterisation of the decoring behaviour of inorganically bound cast-in sand cores for light metal casting. J. Mater. Process. Technol. 2021;296 doi: 10.1016/j.jmatprotec.2021.117201. [DOI] [Google Scholar]
- 5.Galles D., Beckermann C. Effect of sand dilation on core expansion during steel casting. IOP Conf. Ser. Mater. Sci. Eng. 2015;84 doi: 10.1088/1757-899X/84/1/012022. [DOI] [Google Scholar]
- 6.Ramakrishnan R., Griebel B., Volk W., Günther D., Günther J. 3D printing of inorganic sand moulds for casting applications. Adv. Mater. Res. 2014;1018:441–449. doi: 10.4028/www.scientific.net/AMR.1018.441. [DOI] [Google Scholar]
- 7.Griebel B., Brecheisen D., Ramakrishnan R., Volk W. Optical measurement techniques determine Young's modulus of sand core materials. Int. J. Metalcast. 2016;10:524–530. doi: 10.1007/s40962-016-0069-8. [DOI] [Google Scholar]
- 8.Stachowicz M., Granat K., Nowak D. Influence of water-glass grade and quantity on residual strength of microwave-hardened moulding sands. Part 1. Arch. Foundry Eng. 2011;11:93–98. [Google Scholar]
- 9.Motoyama Y., Shiga H., Sato T., Kambe H., Yoshida M. Elasto-plastic-creep constitutive equation of an Al-Si-Cu high-pressure die casting alloy for thermal stress analysis. Metall. Mater. Trans. A. 2016;47:5598–5608. doi: 10.1007/s11661-016-3734-x. [DOI] [Google Scholar]
- 10.Hattel J., editor. Fundamentals of Numerical Modelling of Casting Processes. Polyteknisk forlag; Lyngby: 2005. [Google Scholar]
- 11.DiMaggio F.L., Sandler I.S. Material model for granular soils. J. Eng. Mech. Div. 1971;97:935–950. doi: 10.1061/JMCEA3.0001427. [DOI] [Google Scholar]
- 12.Brewin P.R., editor. Modelling of powder die compaction. Springer; London: 2008. [Google Scholar]
- 13.Neto E.A.d.S., Perić D., Owens D. Wiley; Chichester, West Sussex, UK: 2008. Computational Methods for Plasticity: Theory and Applications. [Google Scholar]
- 14.Sivarupan T., El Mansori M., Coniglio N., Dargusch M. Effect of process parameters on flexure strength and gas permeability of 3D printed sand molds. J. Manuf. Tech. Proc. 2020;54:420–437. doi: 10.1016/j.jmapro.2020.02.043. [DOI] [Google Scholar]
- 15.Payan M., Khoshini M., Jamshidi Chenari R. Elastic dynamic Young's modulus and Poisson's ratio of sand–silt mixtures. J. Mater. Civ. Eng. 2020;32 doi: 10.1061/(ASCE)MT.1943-5533.0002991. [DOI] [Google Scholar]
- 16.Coniglio N., Sivarupan T., El Mansori M. Investigation of process parameter effect on anisotropic properties of 3D printed sand molds. Int. J. Adv. Manuf. Technol. 2018;94:2175–2185. doi: 10.1007/s00170-017-0861-5. [DOI] [Google Scholar]
- 17.Vaezi M., Chua C.K. Effects of layer thickness and binder saturation level parameters on 3D printing process. Int. J. Adv. Manuf. Technol. 2011;53:275–284. doi: 10.1007/s00170-010-2821-1. [DOI] [Google Scholar]
- 18.Stachowicz M., Kazimierz G., Nowak D. Influence of water-glass grade and quantity on residual strength of microwave-hardened moulding sands. Part 2. Arch. Foundry Eng. 2011;11:143–148. [Google Scholar]
- 19.Quarzwerke GmbH . Frechen; Germany: 2009. Stoffdaten Quarzsand H 31 Bis H 35, Datasheet.https://www.quarzwerke.com/fileadmin/quarzwerke/Leistungserklaerungen/Leistungserkl-Sortenverz-EN13043-SMH_Revision_1.pdf [Google Scholar]
- 20.Strobel Quarzsand GmbH, Stoffdaten Quarzsand GS14, datasheet, Freihung, Germany. 2016. https://www.strobel-quarzsand.de/media/GS14RP.pdf [Google Scholar]
- 21.Lu K., Hiser M., Wu W. Effect of particle size on three dimensional printed mesh structures. Powder Technol. 2009;192:178–183. doi: 10.1016/j.powtec.2008.12.011. [DOI] [Google Scholar]
- 22.Stauder B.J., Kerber H., Schumacher P. Foundry sand core property assessment by 3-point bending test evaluation. J. Mater. Process. Technol. 2016;237:188–196. doi: 10.1016/j.jmatprotec.2016.06.010. [DOI] [Google Scholar]
- 23.Sivarupan T., El Mansori M., Daly K., Mavrogordato M.N., Pierron F. Characterisation of 3D printed sand moulds using micro-focus X-ray computed tomography. Rapid Prototyp. J. 2019;25:404–416. doi: 10.1108/RPJ-04-2018-0091. [DOI] [Google Scholar]
- 24.Ahmed W.F., Sghaier M.B.H., Allaoui S. Investigation of the effect of three-point bending testing parameters on the behavior of 3D printed sand. Int. J. Adv. Manuf. Technol. 2022;121:1415–1428. doi: 10.1007/s00170-022-09418-3. [DOI] [Google Scholar]
- 25.Jianhong Y., Wu F.Q., Sun J.Z. Estimation of the tensile elastic modulus using Brazilian disc by applying diametrically opposed concentrated loads. Int. J. Rock Mech. Min. Sci. 2009;46:568–576. doi: 10.1016/j.ijrmms.2008.08.004. [DOI] [Google Scholar]
- 26.Li D., Wong L.N.Y. The Brazilian disc test for rock mechanics applications: review and new insights. Rock Mech. Rock Eng. 2013;46:269–287. doi: 10.1007/s00603-012-0257-7. [DOI] [Google Scholar]
- 27.Efe T., Demirdag S., Tufekci K., Sengun N., Altindag R. Estimating the direct tensile strength of rocks from indirect tests. Arabian J. Geosci. 2021;14 doi: 10.1007/s12517-021-07539-9. [DOI] [Google Scholar]
- 28.Lechner P., Stahl J., Hartmann C., Ettemeyer F., Volk W. Mohr–Coulomb characterisation of inorganically-bound core materials. J. Mater. Process. Technol. 2021;296 doi: 10.1016/j.jmatprotec.2021.117214. [DOI] [Google Scholar]
- 29.Inoue Y., Motoyama Y., Takahashi H., Shinji K., Yoshida M. Effect of sand mold models on the simulated mold restraint force and the contraction of the casting during cooling in green sand molds. J. Mater. Process. Technol. 2013;213:1157–1165. doi: 10.1016/j.jmatprotec.2013.01.011. [DOI] [Google Scholar]
- 30.C08 Committee . ASTM International; West Conshohocken, PA: 2023. Test Method for Dynamic Youngs Modulus, Shear Modulus, and Poissons Ratio of Refractory Materials by Impulse Excitation of Vibration. [Google Scholar]
- 31.Tognana S., Salgueiro W., Somoza A., Marzocca A. Measurement of the Young's modulus in particulate epoxy composites using the impulse excitation technique. Mater. Sci. Eng., A. 2010;527:4619–4623. doi: 10.1016/j.msea.2010.04.083. [DOI] [Google Scholar]
- 32.Flemming E., Tilch W. first ed. Dt. Verl. für Grundstoffindustrie; Leipzig: 1993. Formstoffe und Formverfahren. [Google Scholar]
- 33.Lechner P., Hartmann C., Ettemeyer F., Volk W. A plane stress failure criterion for inorganically-bound core materials. Materials. 2021;14:247. doi: 10.3390/ma14020247. [DOI] [PMC free article] [PubMed] [Google Scholar]
- 34.Ma T., Peng N., Zhu Z., Zhang Q., Yang C., Zhao J. Brazilian tensile strength of anisotropic rocks: review and new insights. Energies. 2018;11:304. doi: 10.3390/en11020304. [DOI] [Google Scholar]
- 35.Schneider M., Hofmann T., Andrä H., Lechner P., Ettemeyer F., Volk W., Steeb H. Modelling the microstructure and computing effective elastic properties of sand core materials. Int. J. Solid Struct. 2018;143:1–17. doi: 10.1016/j.ijsolstr.2018.02.008. [DOI] [Google Scholar]
- 36.Lechner P., Fuchs G., Hartmann C., Steinlehner F., Ettemeyer F., Volk W. Acoustical and optical determination of mechanical properties of inorganically-bound foundry core materials. Materials. 2020;13:2531. doi: 10.3390/ma13112531. [DOI] [PMC free article] [PubMed] [Google Scholar]
- 37.Peng Z., Redfern S.A.T. Mechanical properties of quartz at the α-β phase transition: implications for tectonic and seismic anomalies. Geochem. Geophys. Geosyst. 2013;14:18–28. doi: 10.1029/2012GC004482. [DOI] [Google Scholar]
- 38.Thorborg J., Kumar S., Wagner I., Sturm J.C. The virtual core - modelling and optimization of core manufacturing and application. IOP Conf. Ser. Mater. Sci. Eng. 2020;861 doi: 10.1088/1757-899X/861/1/012004. [DOI] [Google Scholar]
Associated Data
This section collects any data citations, data availability statements, or supplementary materials included in this article.
Data Availability Statement
Data will be made available on request.