

Abstract
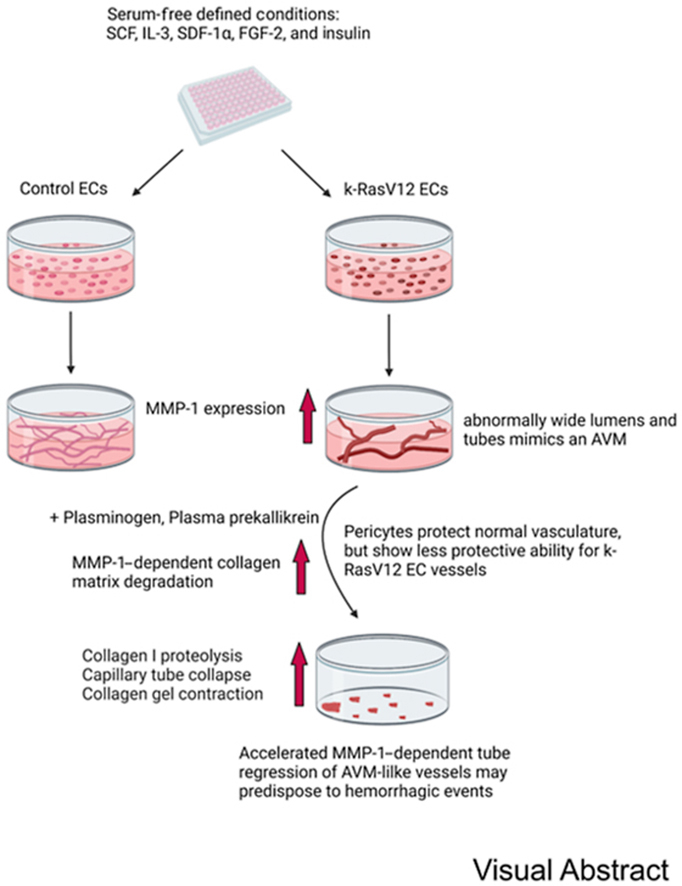
This study sought to identify potential mechanisms by which k-RasV12–expressing endothelial cell (EC) tubes demonstrate an increased propensity to regress compared with controls. Activated k-Ras mutations play a role in a variety of pathological conditions, including arteriovenous malformations, which are prone to bleed, causing serious hemorrhagic complications. ECs expressing active k-RasV12 demonstrate markedly excessive lumen formation with widened and shortened tubes accompanied by reduced pericyte recruitment and basement membrane deposition, leading to deficient capillary network assembly. The current study showed that active k-Ras–expressing ECs secreted greater amounts of MMP-1 proenzyme compared with control ECs, and readily converted it to increased active MMP-1 levels through the action of plasmin or plasma kallikrein (generated from their added zymogens). Active MMP-1 degraded three-dimensional collagen matrices, leading to more rapid and extensive regression of the active k-Ras–expressing EC tubes, in conjunction with matrix contraction, compared with control ECs. Under conditions where pericytes protect control EC tubes from plasminogen- and MMP-1–dependent tube regression, this failed to occur with k-RasV12 ECs, due to reduced pericyte interactions. In summary, k-RasV12–expressing EC vessels showed an increased propensity to regress in response to serine proteinases through accentuated levels of active MMP-1, a novel pathogenic mechanism that may underlie hemorrhagic events associated with arteriovenous malformation lesions.
Graphical abstract
In recent years, considerable efforts have been put forth to investigate the molecular basis for vascular regression (ie, rarefaction) because vessel loss is a causative factor in many disease states and is important in processes such as aging.1, 2, 3, 4, 5, 6, 7, 8, 9, 10, 11 Past studies described vascular regression that involves the ability of matrix metalloproteinases (MMPs), such as MMP-1 and MMP-10, to degrade key extracellular matrices (ECM) including interstitial collagen and basement membrane matrices, which are necessary for the formation and maintenance of vasculature.12, 13, 14, 15, 16 Both in vitro and in vivo studies demonstrate that ECM integrity is required for the vasculature to remain intact and stabilized since the vessels are embedded in these matrices. Excess proteolysis that manifests during developmental processes due to genetic manipulations leads to loss of vascular integrity and embryonic lethality.17, 18, 19 In vitro studies show that serine proteinase activation of endothelial cell (EC)-derived MMP-1, the major human interstitial collagenase, leads to marked breakdown of three-dimensional (3D) collagen matrices, which then induces human EC tube collapse and regression.12,15,20 Multiple serine proteinases that cause this tube regression through MMP-1 activation have been defined. They include the plasma-derived proteinases, plasmin (generated from plasminogen), plasma kallikrein [generated from plasma prekallikrein and its association with high molecular weight kininogen (HMWK) and factor XII], the mast cell proteinases, chymase and tryptase, and neutrophil elastase.15 Furthermore, EC-derived MMP-10 is activated by these serine proteinases and participates in the activation of MMP-1 during this regression response.15 EC-derived MMP-1 and MMP-10, which are ECM-degrading proteinases, influence vascular tube regression responses, and not vessel formation.15 By contrast, MT1-MMP (MMP-14) is a critical cell surface MMP and collagenase necessary for EC lumen and tube formation.21, 22, 23, 24, 25 Pericyte association with capillary tubes inhibits tube regression responses following the addition of serine proteinases. MMP inhibitors, TIMP-2 and TIMP-3, produced from the EC-pericyte co-cultures block MMP-1.20 The presence of pericytes also limits the degree of vessel formation (TIMP-2 and TIMP-3 also block MT1-MMP), and facilitate the assembly of long and narrow capillary vessels with basement membranes deposited on the EC abluminal surface.20,23
Considerable advances have occurred in recent years in the identification of genetic mutations that promote the formation of vascular malformations.26, 27, 28 One key example is that of active k-Ras, such as k-RasV12, which is associated with arteriovenous malformations (AVMs).29, 30, 31 k-Ras mutations are most frequently observed in brain AVMs. AVMs are abnormal vascular tangles between arteries and veins that result from the direct communication of these vessels due to the loss of intervening capillaries. An in vitro model of AVM-like vessel formation using ECs expressing k-RasV12 that excessively forms lumens with widened tubes and markedly reduced pericyte interactions and basement membrane deposition was developed recently.32 The net result of this altered morphogenic response is capillary deficiency, a stimulus for predisposing the arteries and veins to communicate abnormally and create AVM lesions.32 The major clinical complication of AVMs is bleeding and tissue hemorrhage, and presence of AVM within the brain parenchyma can cause a stroke.33, 34, 35 Patients with brain AVMs express high levels of various MMPs,36, 37, 38, 39, 40 which may increase this hemorrhagic risk. MMP-9, particularly, is elevated in these lesions.41 The predominant source of MMP-9 in these AVM lesions appears to be infiltration of inflammatory cells, including neutrophils and monocyte/macrophages.36,41, 42, 43 Overall, pathogenic mechanisms resulting in hemorrhagic events in AVMs and other vascular malformations are not well understood.
The current study identified a novel up-regulation of MMP-1 proenzyme secretion by ECs expressing active k-RasV12 during tube formation in 3D collagen matrices, a key genetic mutation that underlies the development of AVMs. Exposing these ECs to active serine proteinases mimicks a proinflammatory environment in AVMs, activates MMP-1, and induces tube collapse and regression as well as collagen matrix degradation and collagen matrix contraction. The k-RasV12 EC cultures showed accelerated tube regression, greater gel contraction responses, and higher levels of MMP-1 activation compared with control EC cultures. In control ECs addition of pericytes interfered with plasminogen- and MMP-1–dependent tube regression, compared with that in control cultures without pericytes. By contrast, under the same conditions, pericytes failed to protect k-RasV12 EC tubes, and in response to the addition of plasminogen, the tubes regressed like the k-RasV12 EC tubes without pericytes. The results show that EC tubes carrying the k-RasV12–activating mutation are more susceptible to vascular regression in response to serine proteinases due to strongly enhanced MMP-1 activation and vascular ECM degradation. These findings identify a novel mechanism and new potential therapeutic targets to prevent pathologic hemorrhages resulting from vascular regression of active k-Ras–expressing AVM lesions.
Materials and Methods
The materials used in this study are compiled and listed in Table 1.
Table 1.
Materials
| Antibodies | |||||
|---|---|---|---|---|---|
| Target antigen | Vendor | Catalog no. | Concentration (μg/mL) | Molecular weight, kDa | Source |
| MMP-1 | R&D Systems, Minneapolis, MN | MAB901 | WB (0.5) | 43, 55 | Mouse |
| MMP-2 | Calbiochem, San Diego, CA | IM51 | WB (0.5) | 63, 72 | Mouse |
| TIMP-1 | Calbiochem | CC1062 | WB (0.5) | 23 | Goat |
| PAI-1 | R&D Systems | MAB1786 | WB (0.5) | 48 | Mouse |
| Rabbit anti–goat-HRP | Dako-Agilent, Santa Clara, CA | P0449 | WB (0.7) | ||
| Rabbit anti–mouse-HRP | Dako-Agilent | P0260 | WB (0.7) | ||
| Cultured cells | |||||
|---|---|---|---|---|---|
| Name | Vendor | Catalog no. | |||
| HUVECs | Lonza, Basel, Switzerland | ||||
| k-RasV12 lentivirus | Lentivirus (GenTarget, San Diego, CA) transfection | LVP1139-RB | |||
| HBVPs | ScienCell Research Laboratories, Carlsbad, CA | ||||
| Pharmacologic agents | |||||
|---|---|---|---|---|---|
| Drug name | Vendor or source | Catalog no. | Working concentration | ||
| EACA | MedchemExpress, Monmouth Junction, NJ | HY-B0236 | 100 μg/mL | ||
| Aprotinin | Sigma, St. Louis, MO | A6279 | 1 μg/mL | ||
| Glu-plasminogen | Enzyme Research Laboratories, South Bend, IN | HPG201 | 0.25, 0.5, 1, 2, 5, 10 μg/mL | ||
| Human kallikrein | Enzyme Research Laboratories | HKPKa1303 | 0.25, 0.5, 1, 2, 5, 10 μg/mL | ||
| Human factor XII | Enzyme Research Laboratories | HFXII1330 | 25, 50 ng/mL | ||
| Human prekallikrein | Enzyme Research Laboratories | HPK1460 | 2 μg/mL | ||
| Single chain HMW kininogen | Enzyme Research Laboratories | HK5160 | 5, 10 μg/mL | ||
| GM6001 | Tocris, Bristol, UK | 2983 | 10, 20 μmol/L | ||
| Blasticidin S HCl | Gibco | A11139-03 | 10 μg/mL | ||
| L-Ascorbic acid | Sigma | A5960 | 50 μg/mL | ||
| Growth factors | |||||
|---|---|---|---|---|---|
| Factor name | Vendor or source | Catalog no. | Working concentration, ng/mL | ||
| FGF2 | Gibco | PHG0369V | 50 | ||
| rhIL-3 | R&D Systems | 203-IL/CF | 40 | ||
| SDF1α | R&D Systems | 350-NS/CF | 40 | ||
| rhSCF | R&D Systems | 255-SC/CF | 40 | ||
| PCR primers | |||||
|---|---|---|---|---|---|
| Gene name | Forward | Reverse | |||
| MMP1 | 5′-GGTCTCTGAGGGTCAAGCAG-3′ | 5′-AGTTCATGAGCTGCAACACG-3′ | |||
| MMP10 | 5′-GTGGAGTTCCTGACGTTGGT-3′ | 5′-TGCCTGATGCATCTTCTGTC-3′ | |||
| MMP14 | 5′-GCAGAAGTTTTACGGCTTGC-3′ | 5′-AGTGGGTGTCTCCTCCAATG-3′ | |||
| GAPDH | 5′-AAGGTGAAGGTCGGAGTCAACG-3′ | 5′-CATGAGGTCCACCACCCTGTTG-3′ | |||
EACA, 6-aminocaproic acid; HBVPs, human brain vascular pericytes; HUVECs, human umbilical vein endothelial cells; rhIL-3, recombinant human IL-3; rhSCF, recombinant human stem cell factor; SDF1α, pre-B cell growth stimulating factor; WB, Western blot.
Cell Culture
k-RasV12 ECs, human umbilical vein ECs (HUVECs), and human brain vascular pericytes were cultured in an in-house Supermedia on gelatin-coated flasks. Cells were grown at 37°C in incubators containing 5% CO2. The Supermedia contained M199 medium with 20% fetal bovine serum, heparin sodium salt, bovine hypothalamus extract, amphotericin B, and gentamicin. HUVECs from passage 3 to 6, k-RasV12 ECs from passage 6 to 12, and human brain vascular pericytes from passage 4 to 12 were used. The k-RasV12–expressing ECs were obtained by infecting HUVECs with a lentivirus expressing k-RasV12 (NIH Protein database, https://www.ncbi.nlm.nih.gov/protein, NP_004976).32 The k-RasV12 is expressed downstream of the promoter EF1a (elongation factor 1a). After infection, blasticidin (10 μg/mL) was used to select for ECs carrying the lentiviral construct after 3 days. A pool of ECs expressing k-RasV12 was generated from many clones of surviving cells. The ECs in this pool were frozen into liquid nitrogen vials so that they could be regrown and used in future experiments. In a similar fashion, an EC cell line was obtained carrying a nuclear localized red fluorescent protein (RFP) that was selected in the same manner as that described above using blasticidin.
Vasculogenic Assay
Trypsinized HUVECs or k-RasV12 ECs were resuspended in 2.5 mg/mL type I collagen matrix62, and then added to 96-well half-area plates (28 μL/well). The gel was incubated for 30 minutes for polymerization and equilibration. Feeding medium was added on top of gels after polymerization. M199 media plus five growth factors were used in the feeding medium [RSII (Reduced Serum Supplement II) with insulin, FGF2 (fibroblast growth factor 2), SCF (stem cell factor), IL-3, and SDF (stromal derived factor)]. To study the capillary tube regression and gel contraction, plasminogen, human kallikrein, and the combination of human factor XII, single chain HMW kininogen, and human prekallikrein were used, and gel contraction was monitored at 24, 48, and 72 hours. Following contraction, conditioned media were collected and analyzed by Western blot. Pharmacological inhibitors were added to the cultures at the desired concentrations to determine whether they could prevent tube regression and gel contraction.
EC/k-RasV12 EC–Pericyte Co-Culture
The green fluorescent protein (GFP)-pericytes were generated as previously described.44 ECs (HUVECs or k-RasV12–expressing) were co-cultured in 2.5 mg/mL type I collagen matrix at a 1:5 ratio with GFP-labeled pericytes. The mixture was added to the 96-well plate. Upon polymerization, M199 media with 5 growth factors (RSII with insulin, FGF2, SCF, IL-3, and SDF-1α) were added to these cultures. Plasminogen, human kallikrein, and the combination of human factor XII, single chain HMW kininogen, and human prekallikrein were added to the culture media to study the capillary tube regression and gel contraction.
Western Blots
The conditioned media were collected at designated time points and mixed with 3% sample buffer containing 5% beta-mercaptoethanol, and heated at 100°C for 5 minutes. Then 15-μL samples were run on a Bio-Rad (Hercules, CA) gel after they cooled down. The gel was transferred onto a polyvinylidene fluoride membrane, and 3% bovine serum albumin was used to block the membrane. The appropriate primary antibodies were added directly to the blocking buffer and incubated at 4°C overnight. A corresponding horseradish peroxidase–conjugated secondary antibody in 3% milk was used to detect the protein after several washes. After development, X-ray film was used to visualize the results.
RT-PCR
Based on the manufacturer's instructions, EC RNA (HUVECs or k-RasV12 ECs) was extracted using the Direct-zol RNA miniprep kit (Zymo Research, Irvine, CA). A ProtoScript First Strand cDNA synthesis kit (New England Biolabs, Ipswich, MA) was used to synthesize cDNA from 500 ng of RNA. Detailed primer sequences used for targeted amplification are presented in Table 1. The PCR products were run on a 1% agarose gel and visualized using a Fotodyne system (Fotodyne, Hartland, WI).
Microscopy and Imaging
The photographic images were taken using an Olympus CKX41 microscope (Tokyo, Japan) with imaging software (DP Controller/DP Manager version 3.2.1.276). The confocal images were obtained with a Leica SP8 3X STED Laser Confocal Microscope (Leica Microsystems, Wetzlar, Germany) and Leica imaging software [Leica Application Suite X (LAS X)].
Results
k-RasV12–Expressing EC Cultures Exposed to Serine Proteinases Undergo Markedly Accelerated Tube Regression and Collagen Matrix Contraction Compared with Control ECs
Patients with AVM lesions have an increased propensity for hemorrhagic events, and the causative mechanisms underlying this clinical problem remain unknown. EC expression of k-RasV12 induces capillary deficiency through markedly excessive lumen formation, as well as reduced pericyte recruitment and basement membrane deposition.32 These pathogenic factors contribute to the development of AVMs in the vasculature due to the appearance of direct connections between arteries and veins resulting from the loss of intervening capillary beds. Herein, ECs carrying active k-RasV12 were used to investigate potential mechanisms that enhance the ability of AVM-like vascular lesions to breakdown or regress compared with normal vascular tube networks. The general experimental approach in this study is illustrated in Figure 1. Since the abnormal vessel growth is known to interface with adjacent normal vasculature, an enhanced or selective EC tube regression process in these AVM vascular growths is expected to result in clinically significant hemorrhagic events.
Figure 1.

Schematic illustrating the experimental design to address how endothelial cell (EC) expression of an k-RasV12–activating mutation affects serine proteinase– and MMP-1–dependent EC tube regression in three-dimensional (3D) collagen matrices. Schematic depicting control (Con) ECs and k-RasV12 ECs seeding in 3D collagen matrices that underwent EC tube morphogenesis and network formation. Serine proteinase zymogens were added at the beginning of the culture (B and D) or separately after 48 hours of culture (A and C). A: EC expressing k-RasV12 demonstrate marked enhanced EC lumen and tube expansion, compared with control ECs, which is illustrated by the images on the left that show immunostaining for collagen type I (green), and CD31 to label ECs (red). The images on the right are toluidine blue–stained cultures that demonstrate the formation of EC tube structures by the two EC types. Arrows indicate the border of vascular guidance tunnel spaces in which EC tubes are embedded. B–D: The collagen matrix contraction process was monitored and photographed as a bioassay readout of EC tube regression, and conditioned media were collected for Western blot analysis to assess the degree of MMP-1 activation. Scale bars: 200 μm (A); 500 μm (B–D). L, EC luminal space.
The impact of the addition of plasminogen (Plg), a plasma-derived precursor for plasmin, and a serine proteinase known to activate MMP-1 was assessed. MMP-1 represents a key human EC proteinase that can induce collapse and regression of tube networks in 3D matrices.12,15 Tubulogenesis assays were performed in 3D collagen matrices using control ECs versus k-RasV12–expressing ECs in the presence or absence of Plg during a 72-hour period. In the assay, 0, 1, 2, 5, and 10 μg/mL of Plg were added to both cultures, and the cultures were photographed at low power (4×) after 24, 48, and 72 hours. Representative images of control and k-RasV12–expressing ECs after 48 and 72 hours of culture are shown (Figure 2). In addition, the number of collagen gels that contracted over time under these conditions were noted (Supplemental Figure S1A). Using either type of analysis, it is evident that EC cultures expressing k-RasV12 demonstrated acceleration of Plg-dependent collagen gel contraction compared with control EC cultures (Figure 2 and Supplemental Figure S1). This was supported by a more robust and rapid contraction response over time, which required lesser concentrations of Plg at the 48-hour time point (Supplemental Figure S1). For example, a collagen gel containing control ECs started contracting following addition of 2 μg/mL Plg after 48 hours, whereas a collagen gel containing k-RasV12 ECs had already contracted at 48 hours following addition of a lesser amount of Plg (1 μg/mL) (Figure 2). The more extensive collagen degradation of the gels from the k-RasV12 EC cultures was indicated by multiple small fragments of contracted collagen gel, compared with the EC control which had a single contracted gel (Figure 2). The above experiment was repeated with a lentivirus-transduced EC line carrying nuclear RFP and selected with blasticidin, like the EC k-Ras V12 line. The same assays with varying doses of Plg were performed using this nuclear RFP EC line compared with control ECs, the Plg-induced collagen gel contraction response was the same over time (Supplemental Figure S2). The contracted gels from the ECs expressing nuclear RFP were fluorescent red compared with the nonfluorescent control ECs (Supplemental Figure S2).
Figure 2.

Plasminogen-induced tube regression and accompanying collagen gel contraction responses are strongly enhanced using active k-RasV12 endothelial cells (ECs) compared with control (Con) ECs. ECs, as well as ECs carrying k-RasV12, were cultured in 3D collagen matrices in the presence or absence of plasminogen (PLG) at the indicated concentration for 72 hours. The same culture wells were photographed at 48 and 72 hours during the tube regression and collagen gel contraction process. Arrows indicate contracted collagen gels and gel fragments, whereas the arrowhead indicates a partially contracted gel. Scale bars: 500 μm. CT, control.
k-RasV12–Expressing EC Cultures Generate Increased Levels of Activated MMP-1, following Plasminogen Addition, which Directly Correlates with Their Enhanced Tube Regression and Collagen Gel Contraction Responses
The ability of control ECs and k-RasV12 EC cultures to secrete several MMPs as well as proteinase inhibitors was compared over a time course of tube formation under control conditions over 72 hours. k-RasV12 EC cultures secreted high levels of MMP-1 proenzyme as well as the proteinase inhibitors, tissue inhibitor of metalloproteinases (TIMP)-1 and plasminogen activator inhibitor (PAI)-1 over time, whereas control EC cultures secreted high levels of MMP-2 (Figure 3). To determine whether the EC tube regression and collagen gel contraction response correlated with and was caused by MMP-1 activation following Plg addition, Western blots were run to assess the levels of MMP-1 and the degree of activation by control versus k-RasV12 EC culture conditioned medium at either 24 or 72 hours (Figure 3B). In these blots, the upper band is the MMP-1 proenzyme, whereas the lower band is the activated form of MMP-1. Only the MMP-1 proenzyme band is present under control conditions without addition of Plg. Conditioned medium from the k-RasV12 EC had higher amounts of pro-MMP-1 compared with that from controls at 72 hours (Figure 3B). Following addition of Plg, higher levels of activated MMP-1 were observed in the conditioned medium from k-RasV12 EC cultures compared with that from control EC cultures at either 24 or 72 hours of culture (Figure 3B). Thus, the k-RasV12–expressing EC cultures secreted more MMP-1 proenzyme over time (Figure 3A), but also generated more activated MMP-1 than control EC cultures in response to varying levels of added Plg (Figure 3B). Notably, mRNA levels of MMP-1, MMP-10, and MMP-14 were similar in control versus k-RasV12 ECs (data not shown) at the beginning of culture formation. One possible reason for this difference could be reduced secretion of TIMP-1, an inhibitor of MMP-1, or PAI-1, a plasminogen activator inhibitor, from the k-RasV12 ECs compared with that from control ECs. However, Western blots of this same conditioned medium show that k-RasV12–expressing ECs secrete greater amounts of both TIMP-1 and PAI-1 compared with controls (Figure 3B).
Figure 3.

Endothelial cells (ECs) expressing k-RasV12 demonstrate increased secretion and activation of MMP-1 in response to plasminogen addition compared with control (Con) ECs in three-dimensional (3D) collagen matrices. A: Tubulogenesis assays in 3D collagen matrices were performed using control ECs versus ECs expressing k-RasV12. Conditioned media were collected at indicated time points (3, 6, 9, 24, 48, and 72 hours), and the expression of MMP-1, TIMP-1, and PAI-1 was analyzed using Western blots. B: ECs and k-RasV12 ECs were cultured in 3D collagen matrices with or without added plasminogen (PLG) at the indicated and varying concentrations. Conditioned media were collected at either 24 or 72 hours. Western blots were performed to assess the expression of the indicated molecules. Arrows indicate the position of MMP-1 zymogen, and activated MMP-1 was marked with arrowheads. CT, control.
Whether the tube regression and collagen gel contraction response of 3D EC cultures could be blocked using different proteinase inhibitors directed to either Plg/plasmin or MMP-1 was investigated next. Addition of epsilon-amino caproic acid (EACA), which blocks Plg binding to the cell surface and which reduces its conversion to plasmin, inhibited collagen gel contraction and MMP-1 activation from the control EC cultures, while only partially blocking these processes from k-RasV12 EC cultures (Figure 4). By contrast, addition of aprotinin, a direct inhibitor of plasmin, completely blocked tube regression and collagen gel contraction as well as MMP-1 activation from either control or k-RasV12 EC cultures (Figure 4). GM6001, a direct inhibitor of MMP-1, also completely blocked collagen gel contraction and reduced the levels of active MMP-1 from both cultures (Figure 4). These data provide strong support for the conclusion that plasminogen is converted to plasmin by the ECs which leads to MMP-1 proenzyme conversion to active MMP-1. The active MMP-1 degrades the 3D collagen matrices, which then further leads to EC tube collapse and regression in conjunction with collagen gel contraction; events that are highly accelerated in ECs expressing k-RasV12.
Figure 4.

Pharmacological blockade of plasminogen-induced endothelial cell (EC) tube regression using inhibitors targeting serine proteinases and matrix metalloproteinases. Both control (Con) ECs and ECs expressing k-RasV12 were seeded in collagen matrices for 72 hours in the presence of plasminogen (PLG) (2 μg/mL) and the indicated pharmacological agents. A competitive inhibitor of plasminogen binding to cell surfaces, 6-aminocaproic acid (EACA), was added at 100 μg/mL, a direct inhibitor of plasmin, aprotinin (Apr), was added at 1 μg/mL, and the broad spectrum MMP inhibitor, GM6001, was added at 10 μmol/L. A–C: The contraction of collagen gel was recorded and photographed (A), conditioned medium was collected and evaluated for MMP-1 expression and activation (B), and the degree of contraction was evaluated and quantitated (C). B: The conditioned media were collected at 72 hours, and Western blots were performed to assess the levels of MMP-1 zymogen and activated MMP-1. The arrow indicates the position of MMP-1 zymogen, and the arrowhead indicates activated MMP-1 (C) The blue represents a normal collagen matrix without contraction, and the red represents a fully contracted collagen matrix. The data shown are a representative experiment with four wells per condition, which were quantitated and analyzed for gel contraction. Scale bars: 200 μm (A). CT, control.
Plasma Kallikrein Induces Pro-MMP-1 Activation Leading to Accelerated Tube Regression and Collagen Gel Contraction of k-RasV12 EC Cultures Compared with Controls
In addition to plasminogen, another key plasma-derived serine proteinase precursor is plasma prekallikrein. Active plasma kallikrein is generated following the interaction of the coagulation factor, active factor XII, HMWK, and plasma prekallikrein.15 Interestingly, factor XII proenzyme can be activated after adsorption to extracellular matrices, such as collagen type I. Active plasma kallikrein activates pro-MMP-1, which results in EC tube regression and collagen gel contraction.15 Here, the impact of plasma kallikrein on tube regression from control versus k-RasV12–expressing EC cultures (Figure 5) was assessed. Addition of active plasma kallikrein induced marked tube regression and collagen gel contraction at the indicated doses from both control and k-RasV12 EC cultures (Figure 5A and Supplemental Figure S1B). Many fragmented gels were observed at all doses of active plasma kallikrein in the k-RasV12 EC cultures. Lower doses of active plasma kallikrein in the control cultures resulted in a single contracted gel. However, some gel fragmentation was observed with the higher doses (2, 5, 10 μg/mL) in these cultures, an indicator of greater or more rapid collagen degradation and gel contraction (Figure 5A). Western blots indicated MMP-1 activation in the conditioned media from both sets of cultures following the addition of plasma kallikrein. The degree of activation was greater at higher plasma kallikrein doses, and overall, an increased level of active MMP-1 was observed in the k-RasV12 EC cultures compared with that in control (Figure 5B).
Figure 5.

Plasma kallikrein, and plasma prekallikrein in combination with high molecular weight kininogen (HMWK) and coagulation factor XII induce accelerated MMP-1 activation and tube regression from k-RasV12–expressing endothelial cell (EC) cultures compared with control EC cultures. Control ECs and ECs carrying k-RasV12 were cultured in 3D collagen matrices in the presence or absence of plasma kallikrein or the combination of plasma prekallikrein, HMWK, and factor XII. The plasma kallikrein was added at 0, 0.25, 0.5, 1, 2, 5, or 10 μg/mL. The plasma prekallikrein was added at 2 μg/mL, the HMWK was added at either 5 or 10 μg/mL, and factor XII was added at 25 or 50 ng/mL. A: The collagen gel contraction process was photographed and documented at 48 hours. Arrows indicate contracted collagen gels and fragmented contracted gels. B: Conditioned media were collected at 48 hours. MMP-1 zymogen and activated MMP-1 expression were assessed by Western blotting. Arrows indicate the position of MMP-1 zymogen, and activated MMP-1 is indicated with arrowheads. Scale bars: 500 μm (A). CT, control.
Similar conclusions can be reached from experiments in which a combination of plasma prekallikrein, HMWK, and factor XII proenzyme was added at varying doses to control versus k-RasV12 EC cultures. This combination induced tube regression and collagen gel contraction in both k-RasV12 EC and control EC cultures (Figure 5A and Supplemental Figure S1C). The k-RasV12 EC cultures also showed fragmented contracted collagen gels compared with the single contracted gels of the control ECs, suggesting greater MMP-1 activity in the former cultures (Figure 5A). Although Western blot analysis indicated modest MMP-1 activation in both cases, it was greater in the k-RasV12 EC cultures (Figure 5B). Also, addition of aprotinin (to block plasma kallikrein) or GM6001 (to block MMP-1) in either the plasma kallikrein or plasma prekallikrein/HMWK/factor XII experiments resulted in complete inhibition of tube regression and collagen gel contraction (data not shown).
Established k-RasV12–Expressing EC Tube Networks Treated with Serine Proteinases Show Accelerated MMP-1–Mediated Tube Regression and Collagen Gel Contraction Compared with Control EC Tubes
As indicated in Figure 1, cultures were allowed to establish EC tube networks for 48 hours, and then plasminogen (Figure 6A), plasma kallikrein (Figure 6B), or the combination of plasma prekallikrein, HMWK and factor XII proenzyme were added (Figure 6C). The cultures were analyzed at 24, 48, or 72 hours following the addition of these serine proteinases for evidence of tube regression and collagen gel contraction, and Western blots were run to assess MMP-1 activation. In each case, there was accelerated tube regression and collagen gel contraction for the k-RasV12 EC tube networks in comparison to that in the control EC tubes (Figure 6). Furthermore, levels of activated MMP-1 in the k-RasV12 EC cultures were higher as compared with those in control ECs for each of the three different serine proteinase additives (Figure 5).
Figure 6.

Established endothelial cell (EC) tube networks carrying k-RasV12 demonstrate accelerated serine proteinase–induced tube regression responses by generating greater levels of activated MMP-1 compared with control (Con) EC tubes. Tubulogenesis assays were performed using control ECs and k-RasV12–expressing ECs in 3D collagen matrices. At 48 hours of culture, serine proteinases, including plasminogen (A) and plasma kallikrein (B), were added at the indicated concentrations to the culture medium. In addition, combinations of plasma prekallikrein, HMWK, and factor XII were added to the culture media after 48 hours (C). Plasma prekallikrein was added at a concentration of 2 μg/mL, HMWK at a concentration of 5 or 10 μg/mL, and factor XII at a concentration of 25 or 50 ng/mL. The contraction of collagen gels was monitored as an indicator of EC tube regression, and the results were recorded at 24, 48, and 72 hours following the addition of the different serine proteinases and at the indicated concentrations. The blue represents a normal collagen matrix without contraction and the red represents a fully contracted collagen matrix. The data shown are representative experiments with 4 wells per condition, which were quantitated and analyzed for gel contraction. Conditioned media from control ECs versus k-RasV12 EC cultures was collected, and MMP-1 expression and activation induced by plasminogen (A), plasma kallikrein (B), and the combination of prekallikrein, HMWK, and factor XII (C) were analyzed by Western blots. Arrows indicate the MMP-1 zymogen, and activated MMP-1 is indicated with arrowheads. CT, control.
Addition of Pericytes to Control EC Cultures, but Not k-RasV12 EC Cultures, Leads to Protection Against Plasminogen- and MMP-1–Induced Tube Regression and Collagen Gel Contraction
Pericytes have the ability to decrease serine proteinase– and MMP-1–dependent EC tube regression and collagen gel contraction.20 Because pericyte responsiveness and recruitment to k-RasV12-expressing EC tubes is substantially reduced compared with that to control ECs,32 whether pericyte addition would affect the ability of Plg addition to induce tube regression and collagen gel contraction from the control versus k-RasV12 ECs was investigated next. For these experiments, EC tubes (ie, control versus k-RasV12 EC tubes) with or without pericytes were allowed to form for 72 hours, prior to the addition of varying doses of Plg. Immunostaining of these co-cultures at 72 hours was performed with anti-CD31 antibodies to label ECs, and immunofluorescence microscopy was performed to visualize both EC tubes and GFP-labeled pericytes (Supplemental Figure S3). The expression of k-RasV12 in ECs led to marked widening of tubes with reduced pericyte recruitment and pericyte elongation on EC tubes compared with control conditions, where thin narrow networks of EC-lined tubes were visualized with associated and elongated pericytes (Supplemental Figure S3). These co-cultures were also visualized using combined light and fluorescence microscopy (Supplemental Figure S4).
These co-cultures were grown for 72 hours and were then either untreated or treated with varying doses of Plg. The extent of gel contraction was evaluated at 24 or 48 hours after Plg addition. Conditioned medium at 48 hours was collected and analyzed for the degree of MMP-1 activation using Western blots (Figure 7). At the three lowest doses of Plg (0.25, 0.5, and 1 μg/mL), addition of pericytes prevented tube regression and collagen gel contraction from the control ECs at 48 hours compared with that in control EC-only cultures (Figure 7, A and C, and 8). Combined light and fluorescence microscopy was used to visualize the degree of tube collapse, gel contraction, and GFP fluorescence from the pericytes (Figure 8). At these low doses of Plg, only the ECs expressing k-RasV12 showed contracted gels containing fluorescent pericytes, whereas the control EC co-cultures demonstrated uncontracted gels with pericytes distributed throughout the gel that were recruited to EC tube networks (Figure 8 and Supplemental Figure S4). Furthermore, the number of pericytes substantially decreased MMP-1 activation from the control ECs in response to the varying levels of Plg (Figure 7B). By contrast, the number of pericytes did not substantially affect tube regression and gel contraction from the k-RasV12 EC cultures at 48 hours in response to Plg, and compared with cultures without pericytes (Figure 7, A and C). Thus, even at the lower Plg doses (0.25, 0.5, and 1 μg/mL), the k-RasV12 EC–pericyte co-cultures showed tube regression and collagen gel contraction responses at either 24 or 48 hours (Figure 7, A and C), suggesting that the pericytes fail to protect these EC tubes from regressing. Furthermore, the degree of MMP-1 activation at the different doses of Plg appears very similar in the k-RasV12 EC–only versus the k-RasV12 EC–pericyte co-cultures (Figure 7B). Previous findings suggest that EC expression of k-RasV12 leads to capillary deficiency with dysfunctional EC-pericyte interactions.32 The current study shows a novel observation that these abnormal and AVM-like capillary tubes with altered EC–pericyte interactions show an increased susceptibility to serine proteinase and MMP-1–dependent tube regression (Figure 7, Figure 8, Figure 9). This greater tendency to regress in response to Plg/plasmin-, and plasma prekallkrein/plasma kallikrein–induced MMP-1 activation could represent an important reason why the activating k-Ras mutation in human AVMs predisposes patients to bleeding and clinically significant hemorrhagic events (Figure 9).
Figure 7.

Pericytes fail to protect endothelial cell (EC) tubes expressing k-RasV12 from plasminogen- and MMP-1–induced tube regression, whereas they interfere with this regression response by associating with control (Con) EC tubes. Control ECs or ECs expressing k-RasV12 were seeded with green fluorescent protein (GFP)-labeled human brain vascular pericytes (HBVP) in 3D collagen matrices. The co-cultures were allowed to undergo morphogenesis, establish tube networks, and given time for pericyte association with EC tubes for 72 hours prior to adding plasminogen (PLG). PLG was added to the culture at 0.25, 0.5, 1, 2, 5, and 10 μg/mL or not added at 72 hours. A: The collagen gel contraction response was recorded and photographed 24 and 48 hours after PLG addition. The blue represents a normal collagen matrix without contraction, whereas the yellow represents a partial gel contraction, and the red represents a fully contracted collagen matrix. The data shown are a representative experiment with 5 wells per condition, which were quantitated and analyzed for gel contraction. B: After 48 hours of adding PLG, conditioned media were collected and analyzed for the expression and activation of MMP-1 by Western blots. Arrows indicate the MMP-1 zymogen, and arrowheads indicate activated MMP-1. C: Photographs are shown of the EC control co-culture versus the k-RasV12 EC co-cultures with added 0.25, 0.5, and 1 μg/mL PLG at 72 hours and then was assessed 48 hours later for the degree of collagen gel contraction. Arrows indicate the contracted collagen matrix. Scale bars: 500 μm (C). CT, control.
Figure 8.

Pericytes fail to protect endothelial cell (EC) tubes expressing k-RasV12 from MMP-1–induced regression in response to low concentrations of plasminogen, while they do prevent this regression response when associated with control (Con) EC tubes. ECs expressing k-RasV12 or control ECs were seeded in 3D collagen matrices alone or were co-cultured with green fluorescent protein (GFP)-labeled human brain vascular pericytes (HBVP). The cultures were allowed to undergo morphogenesis, establish tube networks, or recruit pericytes for 72 hours prior to adding varying plasminogen (PLG) doses. At 72 hours, PLG was added to the culture at 0.25, 0.5, 1 μg/mL or was not added. Following the addition of PLG, the collagen gel contraction response was photographed 48 hours later using light microscopy or a combination of light and fluorescence microscopy. Scale bars: 500 μm.
Figure 9.

Schematic diagram illustrating the accentuated ability of endothelial cell (EC) tubes expressing active k-RasV12, a key pathogenic regulator of arteriovenous malformations, to regress in response to serine proteinases due to activation of greater levels of MMP-1 and increased collagen matrix destruction. Multiple serine proteinases, including plasmin and plasma kallikrein, can activate EC-derived MMP-1 zymogen and induce tube regression due to MMP-1–dependent proteolysis of the collagen matrix scaffold in which EC tubes are embedded. This process is markedly accelerated when the EC tubes express k-RasV12, which produce arteriovenous malformation (AVM)-like vessels, and they demonstrate more rapid and extensive tube regression and collagen matrix contraction responses in 3D collagen matrices, compared with controls, in response to serine proteinase addition. MMP-1 proenzyme levels are strongly induced by k-RasV12–expressing EC tubes; thus, they generate greater levels of active MMP-1 in response to these serine proteinases, which leads to markedly accelerated tube regression responses. Addition of pericytes strongly reduces serine proteinase– and MMP-1–dependent tube regression with control EC tubes but does not protect k-RasV12–expressing tubes from regressing under the same conditions. The authors conclude that EC expression of active k-RasV12 predisposes the AVM-like vessel networks to regress due to heightened MMP-1 activation and collagen matrix scaffold breakdown, a novel pathogenic mechanism that may explain why AVM vessels bleed, leading to clinically significant hemorrhagic events.
Discussion
In recent years, there have been great advances in the identification of mutations expressed by ECs that predispose them to develop vascular malformations.26, 27, 28 Among the identified mutations are activating mutations in Ras isoforms, with k-Ras being particularly observed in brain AVMs.29, 30, 31 A crucial complication of vascular malformations associated with the blood-associated vasculature is their tendency to rupture and bleed, which can cause clinically significant hemorrhagic events.26,27,45,46 In this instance, such an event can result in a hemorrhagic stroke and patient death. However, the mechanism leading to this is not yet known. The malformed vessels may bleed secondary to abnormalities in the shape or proper connectivity of the vessels when interfaced with normal vascular counterparts (ie, “plumbing” issues). For example, the abnormal direct connection of arteries with veins might predispose to hemorrhage as the newly interacting venous vessels adjust to the higher pressure and flow forces supplied by the arterial vessels. Another possibility is that molecular and signaling differences occur in the genetically altered ECs within vascular malformations that predispose them to enhanced vessel disruption or regression events compared with their normal vessel counterparts. This study focused on this latter possibility and utilized a new in vitro model system mimicking the AVM vasculature with human ECs expressing activated k-RasV1232 to identify novel pathogenic mechanisms that might promote AVM vessel regression and tissue hemorrhagic events (Figure 9).
This issue was addressed by investigating whether EC tubes expressing k-RasV12 might be more susceptible to factors that promote vascular regression in comparison to control EC tubes. Specifically, a mechanism of tube regression that primarily depended on EC production and activation of MMP-1 was evaluated.12,15,20 EC MMP-1 activation by various serine proteinases, which are known to become activated or exposed to EC tube networks during tissue injury responses, led to marked collagen matrix degradation, and tube collapse and regression. Multiple serine proteinases were identified to activate MMP-1 and cause EC tube regression in 3D collagen matrices, including plasminogen/plasmin, plasma kallikrein, neutrophil elastase, and cathepsin G, and the mast cell proteinases, chymase, and tryptase.15 Activity of these proteinases on the vasculature during tissue injury can lead to mast cell or neutrophil degranulation or induce vascular permeability causing leakage of plasminogen and plasma prekallikrein, which then convert to active plasmin and plasma kallikrein, respectively. The collagenous ECM in which the tubes are embedded is destroyed by proteolysis leading to EC tube collapse and regression. Because the EC tubes form a network throughout the 3D matrix, they exert tensional forces. When the collagenous matrices degrade in response to active MMP-1, these EC tensional forces induce collagen gel contraction, which is a functional readout of this tube collapse and regression process.12,15 In several in vivo studies, a similar phenomenon has been demonstrated during developmental vascularization, whereby genetic manipulations led to dysregulation of either serine proteinases or MMPs causing loss of vascular integrity and embryonic lethality.17,19,47 In addition, there are analogies to this process during wound repair, wherein provisional matrices are deposited, granulation tissue is formed, and the matrices are degraded along with the removal of the vasculature as the wound heals.13,14 Turnover of the endometrium during the menstrual cycle is known to involve cyclical inductions of proteinases, including MMPs (eg, MMP-1 and MMP-10), with associated vascular regression and hemorrhage.48, 49, 50
The current study compared the response of normal ECs versus ECs carrying the activating mutation k-RasV12 to the addition of serine proteinases to evaluate whether the MMP-1–dependent tube regression process was altered. Remarkably, multiple experimental approaches and paradigms indicated that ECs expressing k-RasV12 showed more rapid and extensive MMP-1–dependent tube regression and collagen gel contraction responses compared with EC control cultures. This was observed in response to the addition of plasminogen, plasma kallikrein, or plasma prekallikrein, HMWK, and factor XII proenzyme, from the beginning of culture or following the establishment of EC tube networks. Analysis of MMP-1 levels and activation in these instances revealed greater amounts of secreted MMP-1 zymogen, but also increased MMP-1 activation when the ECs expressing k-RasV12 were compared with control ECs. The degree of MMP-1 activation directly correlated with the consequence of this activation, which was tube collapse and regression as well as collagen gel contraction. In most instances, multiple and fragmented contracted gels were seen from the k-RasV12 cultures, which presumably resulted from the elevated levels of active MMP-1 in these cultures compared with EC control cultures. This tube regression and collagen gel contraction response to serine proteinase addition was completely inhibited by addition of aprotinin to directly inhibit serine proteinases, or GM6001 to block MMP-1. Another experiment that illustrates the greater ability of k-RasV12 EC tubes to regress in response to serine proteinase exposure was assessed using established EC–pericyte co-cultures (Figures 7 and 8). The presence of pericytes delayed tube regression and prevented tube regression at the lower Plg doses, but only with the control EC co-cultures, and not with the k-RasV12 EC co-cultures. Previous studies showing that EC expression of k-RasV12 leads to capillary deficiency, due in part to impaired pericyte interactions with these malformed tube networks,32 supports this conclusion.
Overall, the current studies reveal a key difference between control ECs and ECs expressing the k-RasV12–activating mutation, where the latter ECs demonstrate an increased susceptibility to serine proteinase– and MMP-1–dependent tube collapse and regression secondary to degradation of collagenous matrices. MMP-1 has been strongly implicated in the pathogenesis of other key human vascular diseases including atherosclerosis,51, 52, 53 coronary vessel atherosclerotic plaque rupture,54, 55, 56 abdominal aortic aneurysms,51,57,58 and cerebral vascular aneurysms.59 The current study utilized HUVECs as a representative human EC type. However, it would be important in future studies to evaluate the impact of k-RasV12 expression in human brain ECs on MMP-1 levels and MMP-1–dependent tube regression, since this organ-specific EC type is associated with AVM lesions in this tissue site. The current novel results raise the possibility that enhanced serine proteinase–dependent MMP-1 activation by abnormal vessels expressing k-RasV12 might induce vascular regression in these AVM vessels and represent a new pathogenic mechanism that increases the risk of hemorrhage associated with vascular malformations. These insights could also lead to new therapeutic strategies (such as direct blockade of the serine proteinases or MMP-1) to decrease the incidence of hemorrhagic events in the context of AVMs and other vascular malformations.
Footnotes
Supported by NIH grants HL136139, HL126518, and HL149748 (G.E.D.); an AHA predoctoral fellowship (P.K.L.); and the Vascular Inflammation and Injury Training ProgramT32 HL160529 (S.S.K.).
Disclosures: None declared.
Supplemental material for this article can be found at http://doi.org/10.1016/j.ajpath.2023.05.015.
Author Contributions
Z.S., P.K.L., K.Y., and S.S.K. performed experiments; Z.S., P.K.L., K.Y., S.S.K., and G.E.D. designed experiments, analyzed data, and generated figures; and Z.S., P.K.L., K.Y., S.S.K., and G.E.D. wrote the paper. All authors reviewed the manuscript. G.D. is the guarantor of this work and, as such, had full access to all of the data in the study and takes responsibility for the integrity of the data and the accuracy of the data analysis.
Supplemental Data
Supplemental Figure S1.

Serine proteinase–dependent MMP-1 activation induces endothelial cell (EC) tube regression and collagen gel matrix contraction that is accelerated from EC tubes expressing active k-RasV12 compared with control (Con) EC tubes. Control ECs, as well as ECs carrying k-RasV12, were cultured in 3D collagen matrices in the presence or absence of different serine proteinases and at varying indicated doses. The serine proteinases include plasminogen (PLG) (A), plasma kallikrein (B), and the combination of plasma prekallikrein, high molecular weight kininogen (HMWK), and factor XII (C). In the latter case, plasma prekallikrein was added at a concentration of 2 μg/mL, HMWK at a concentration of 5 or 10 μg/mL, and factor XII at a concentration of 25 or 50 ng/mL. The contraction of collagen gels was monitored as a measure of EC tube regression responses and was recorded at 24, 48, and 72 hours. The blue represents a normal collagen matrix without contraction, the yellow represents partial gel contraction, and the red represents a fully contracted collagen matrix. The data shown are representative experiments with four wells per condition, which were quantitated and analyzed for gel contraction. CT, control.
Supplemental Figure S2.

Control lentiviral transduced endothelial cells (ECs) carrying nuclear red fluorescent protein (RFP) demonstrate dose-dependent plasminogen (Plg)-induced collagen gel contraction in an identical manner to control ECs. Control (Con) ECs, as well as ECs carrying nuclear RFP, were cultured in 3D collagen matrices in the presence or absence of Plg added at varying indicated doses. A: The contraction of collagen gels was monitored as a measure of EC tube regression responses and was recorded at 24, 48, and 72 hours. The blue represents a normal collagen matrix without contraction, the yellow represents partial gel contraction, and the red represents a fully contracted collagen matrix. The data shown are representative experiments with five wells per condition, which were quantitated and analyzed for gel contraction. B: Representative cultures were photographed after 48 or 72 hours to assess the collagen gel contraction at the varying levels of Plg addition. C: Contracted cultures from the control ECs versus the ECs expressing nuclear RFP were photographed using fluorescence microscopy at 48 hours and from the 10 μg/mL Plg condition. The arrow indicates a contracted red fluorescent gel from the nuclear RFP expressing ECs. Scale bars: 200 μm (B and C). CT, control.
Supplemental Figure S3.

Control (Con) endothelial cells (ECs) form capillary tubes with marked pericyte recruitment as well as elongated and narrow tube networks, whereas k-RasV12–expressing ECs demonstrate deficient capillary network assembly with shortened and widened tube structures and strongly reduced pericyte recruitment. Control ECs or ECs expressing k-RasV12 were seeded in 3D collagen matrices alone with green fluorescent protein (GFP)-labeled human brain vascular pericytes (HBVP). These co-cultures were allowed to develop for 72 hours, then were fixed and immunostained with anti-CD31 antibodies. A: The immunostained cultures were photographed under fluorescence to image the morphology of the EC tube networks and the recruitment of GFP-labeled pericytes. B: The same immunostained co-cultures at 72 hours were imaged using confocal microscopy. Scale bars: 50 μm (A); 200 μm (B).
Supplemental Figure S4.

Transmitted light and fluorescence images of capillary tube networks formed by control (Con) endothelial cells (ECs) and k-RasV12–expressing ECs that are cultured alone or with green fluorescent protein (GFP)-labeled pericytes. Control ECs and k-RasV12–expressing ECs were seeded with or without added GFP (green fluorescent protein)-labeled human brain vascular pericytes (HBVP) in 3D collagen matrices. These cultures were allowed to develop for 72 hours, and were then fixed and photographed using light microscopy (A) or combined light and fluorescent microscopy (B). Scale bar = 200 μm (A).
References
- 1.Koller G.M., Schafer C., Kemp S.S., Aguera K.N., Lin P.K., Forgy J.C., Griffin C.T., Davis G.E. Proinflammatory mediators, IL (interleukin)-1beta, TNF (tumor necrosis factor) alpha, and thrombin directly induce capillary tube regression. Arterioscler Thromb Vasc Biol. 2020;40:365–377. doi: 10.1161/ATVBAHA.119.313536. [DOI] [PMC free article] [PubMed] [Google Scholar]
- 2.Kemp S.S., Penn M.R., Koller G.M., Griffin C.T., Davis G.E. Proinflammatory mediators, TNFalpha, IFNgamma, and thrombin, directly induce lymphatic capillary tube regression. Front Cell Dev Biol. 2022;10 doi: 10.3389/fcell.2022.937982. [DOI] [PMC free article] [PubMed] [Google Scholar]
- 3.Afsar B., Afsar R.E., Dagel T., Kaya E., Erus S., Ortiz A., Covic A., Kanbay M. Capillary rarefaction from the kidney point of view. Clin Kidney J. 2018;11:295–301. doi: 10.1093/ckj/sfx133. [DOI] [PMC free article] [PubMed] [Google Scholar]
- 4.Basile D.P. Rarefaction of peritubular capillaries following ischemic acute renal failure: a potential factor predisposing to progressive nephropathy. Curr Opin Nephrol Hypertens. 2004;13:1–7. doi: 10.1097/00041552-200401000-00001. [DOI] [PubMed] [Google Scholar]
- 5.Camici P.G., Tschope C., Di Carli M.F., Rimoldi O., Van Linthout S. Coronary microvascular dysfunction in hypertrophy and heart failure. Cardiovasc Res. 2020;116:806–816. doi: 10.1093/cvr/cvaa023. [DOI] [PubMed] [Google Scholar]
- 6.Gilbert R.E. Endothelial loss and repair in the vascular complications of diabetes: pathogenetic mechanisms and therapeutic implications. Circ J. 2013;77:849–856. doi: 10.1253/circj.cj-13-0236. [DOI] [PubMed] [Google Scholar]
- 7.Kida Y. Peritubular capillary rarefaction: an underappreciated regulator of CKD progression. Int J Mol Sci. 2020;21:8255. doi: 10.3390/ijms21218255. [DOI] [PMC free article] [PubMed] [Google Scholar]
- 8.Montagna W., Carlisle K. Structural changes in aging human skin. J Invest Dermatol. 1979;73:47–53. doi: 10.1111/1523-1747.ep12532761. [DOI] [PubMed] [Google Scholar]
- 9.Triantafyllou A., Anyfanti P., Pyrpasopoulou A., Triantafyllou G., Aslanidis S., Douma S. Capillary rarefaction as an index for the microvascular assessment of hypertensive patients. Curr Hypertens Rep. 2015;17:33. doi: 10.1007/s11906-015-0543-3. [DOI] [PubMed] [Google Scholar]
- 10.Yoshida Y., Shimizu I., Minamino T. Capillaries as a therapeutic target for heart failure. J Atherosclerosis Thromb. 2022;29:971–988. doi: 10.5551/jat.RV17064. [DOI] [PMC free article] [PubMed] [Google Scholar]
- 11.Paavonsalo S., Hariharan S., Lackman M.H., Karaman S. Capillary rarefaction in obesity and metabolic diseases-organ-specificity and possible mechanisms. Cells. 2020;9:2683. doi: 10.3390/cells9122683. [DOI] [PMC free article] [PubMed] [Google Scholar]
- 12.Davis G.E., Pintar Allen K.A., Salazar R., Maxwell S.A. Matrix metalloproteinase-1 and -9 activation by plasmin regulates a novel endothelial cell-mediated mechanism of collagen gel contraction and capillary tube regression in three-dimensional collagen matrices. J Cell Sci. 2001;114(Pt 5):917–930. doi: 10.1242/jcs.114.5.917. [DOI] [PubMed] [Google Scholar]
- 13.Davis G.E., Saunders W.B. Molecular balance of capillary tube formation versus regression in wound repair: role of matrix metalloproteinases and their inhibitors. J Invest Dermatol Symp Proc. 2006;11:44–56. doi: 10.1038/sj.jidsymp.5650008. [DOI] [PubMed] [Google Scholar]
- 14.Davis G.E., Senger D.R. Extracellular matrix mediates a molecular balance between vascular morphogenesis and regression. Curr Opin Hematol. 2008;15:197–203. doi: 10.1097/MOH.0b013e3282fcc321. [DOI] [PubMed] [Google Scholar]
- 15.Saunders W.B., Bayless K.J., Davis G.E. MMP-1 activation by serine proteases and MMP-10 induces human capillary tubular network collapse and regression in 3D collagen matrices. J Cell Sci. 2005;118(Pt 10):2325–2340. doi: 10.1242/jcs.02360. [DOI] [PubMed] [Google Scholar]
- 16.Aplin A.C., Zhu W.H., Fogel E., Nicosia R.F. Vascular regression and survival are differentially regulated by MT1-MMP and TIMPs in the aortic ring model of angiogenesis. Am J Physiol Cell Physiol. 2009;297:C471–C480. doi: 10.1152/ajpcell.00019.2009. [DOI] [PMC free article] [PubMed] [Google Scholar]
- 17.Ingram K.G., Curtis C.D., Silasi-Mansat R., Lupu F., Griffin C.T. The NuRD chromatin-remodeling enzyme CHD4 promotes embryonic vascular integrity by transcriptionally regulating extracellular matrix proteolysis. PLoS Genet. 2013;9 doi: 10.1371/journal.pgen.1004031. [DOI] [PMC free article] [PubMed] [Google Scholar]
- 18.Crosswhite P.L., Podsiadlowska J.J., Curtis C.D., Gao S., Xia L., Srinivasan R.S., Griffin C.T. CHD4-regulated plasmin activation impacts lymphovenous hemostasis and hepatic vascular integrity. J Clin Invest. 2016;126:2254–2266. doi: 10.1172/JCI84652. [DOI] [PMC free article] [PubMed] [Google Scholar]
- 19.Chang S., Young B.D., Li S., Qi X., Richardson J.A., Olson E.N. Histone deacetylase 7 maintains vascular integrity by repressing matrix metalloproteinase 10. Cell. 2006;126:321–334. doi: 10.1016/j.cell.2006.05.040. [DOI] [PubMed] [Google Scholar]
- 20.Saunders W.B., Bohnsack B.L., Faske J.B., Anthis N.J., Bayless K.J., Hirschi K.K., Davis G.E. Coregulation of vascular tube stabilization by endothelial cell TIMP-2 and pericyte TIMP-3. J Cell Biol. 2006;175:179–191. doi: 10.1083/jcb.200603176. [DOI] [PMC free article] [PubMed] [Google Scholar]
- 21.Chun T.-H., Sabeh F., Ota I., Murphy H., McDonagh K.T., Holmbeck K., Birkedal-Hansen H., Allen E.D., Weiss S.J. MT1-MMP-dependent neovessel formation within the confines of the three-dimensional extracellular matrix. J Cell Biol. 2004;167:757–767. doi: 10.1083/jcb.200405001. [DOI] [PMC free article] [PubMed] [Google Scholar]
- 22.Bayless K.J., Davis G.E. Sphingosine-1-phosphate markedly induces matrix metalloproteinase and integrin-dependent human endothelial cell invasion and lumen formation in three-dimensional collagen and fibrin matrices. Biochem Biophys Res Commun. 2003;312:903–913. doi: 10.1016/j.bbrc.2003.11.017. [DOI] [PubMed] [Google Scholar]
- 23.Stratman A.N., Saunders W.B., Sacharidou A., Koh W., Fisher K.E., Zawieja D.C., Davis M.J., Davis G.E. Endothelial cell lumen and vascular guidance tunnel formation requires MT1-MMP-dependent proteolysis in 3-dimensional collagen matrices. Blood. 2009;114:237–247. doi: 10.1182/blood-2008-12-196451. [DOI] [PMC free article] [PubMed] [Google Scholar]
- 24.Sacharidou A., Koh W., Stratman A.N., Mayo A.M., Fisher K.E., Davis G.E. Endothelial lumen signaling complexes control 3D matrix-specific tubulogenesis through interdependent Cdc42- and MT1-MMP-mediated events. Blood. 2010;115:5259–5269. doi: 10.1182/blood-2009-11-252692. [DOI] [PMC free article] [PubMed] [Google Scholar]
- 25.Davis G.E., Stratman A.N., Sacharidou A., Koh W. Molecular basis for endothelial lumen formation and tubulogenesis during vasculogenesis and angiogenic sprouting. Int Rev Cell Mol Biol. 2011;288:101–165. doi: 10.1016/B978-0-12-386041-5.00003-0. [DOI] [PMC free article] [PubMed] [Google Scholar]
- 26.Wetzel-Strong S.E., Detter M.R., Marchuk D.A. The pathobiology of vascular malformations: insights from human and model organism genetics. J Pathol. 2017;241:281–293. doi: 10.1002/path.4844. [DOI] [PMC free article] [PubMed] [Google Scholar]
- 27.Queisser A., Seront E., Boon L.M., Vikkula M. Genetic basis and therapies for vascular anomalies. Circ Res. 2021;129:155–173. doi: 10.1161/CIRCRESAHA.121.318145. [DOI] [PubMed] [Google Scholar]
- 28.Nguyen H.L., Boon L.M., Vikkula M. Genetics of vascular anomalies. Semin Pediatr Surg. 2020;29 doi: 10.1016/j.sempedsurg.2020.150967. [DOI] [PubMed] [Google Scholar]
- 29.Nikolaev S.I., Vetiska S., Bonilla X., Boudreau E., Jauhiainen S., Rezai Jahromi B., Khyzha N., DiStefano P.V., Suutarinen S., Kiehl T.R., Mendes Pereira V., Herman A.M., Krings T., Andrade-Barazarte H., Tung T., Valiante T., Zadeh G., Tymianski M., Rauramaa T., Yla-Herttuala S., Wythe J.D., Antonarakis S.E., Frosen J., Fish J.E., Radovanovic I. Somatic activating KRAS mutations in arteriovenous malformations of the brain. N Engl J Med. 2018;378:250–261. doi: 10.1056/NEJMoa1709449. [DOI] [PMC free article] [PubMed] [Google Scholar]
- 30.Al-Olabi L., Polubothu S., Dowsett K., Andrews K.A., Stadnik P., Joseph A.P., et al. Mosaic RAS/MAPK variants cause sporadic vascular malformations which respond to targeted therapy. J Clin Invest. 2018;128:1496–1508. doi: 10.1172/JCI98589. [DOI] [PMC free article] [PubMed] [Google Scholar]
- 31.Oka M., Kushamae M., Aoki T., Yamaguchi T., Kitazato K., Abekura Y., Kawamata T., Mizutani T., Miyamoto S., Takagi Y. KRAS G12D or G12V mutation in human brain arteriovenous malformations. World Neurosurg. 2019;126:e1365–e1373. doi: 10.1016/j.wneu.2019.03.105. [DOI] [PubMed] [Google Scholar]
- 32.Sun Z., Kemp S.S., Lin P.K., Aguera K.N., Davis G.E. Endothelial k-RasV12 expression induces capillary deficiency attributable to marked tube network expansion coupled to reduced pericytes and basement membranes. Arterioscler Thromb Vasc Biol. 2022;42:205–222. doi: 10.1161/ATVBAHA.121.316798. [DOI] [PMC free article] [PubMed] [Google Scholar]
- 33.Brown R.D., Jr., Wiebers D.O., Torner J.C., O'Fallon W.M. Frequency of intracranial hemorrhage as a presenting symptom and subtype analysis: a population-based study of intracranial vascular malformations in Olmsted country, Minnesota. J Neurosurg. 1996;85:29–32. doi: 10.3171/jns.1996.85.1.0029. [DOI] [PubMed] [Google Scholar]
- 34.Brown R.D., Jr., Wiebers D.O., Forbes G., O'Fallon W.M., Piepgras D.G., Marsh W.R., Maciunas R.J. The natural history of unruptured intracranial arteriovenous malformations. J Neurosurg. 1988;68:352–357. doi: 10.3171/jns.1988.68.3.0352. [DOI] [PubMed] [Google Scholar]
- 35.Graf C.J., Perret G.E., Torner J.C. Bleeding from cerebral arteriovenous malformations as part of their natural history. J Neurosurg. 1983;58:331–337. doi: 10.3171/jns.1983.58.3.0331. [DOI] [PubMed] [Google Scholar]
- 36.Chen Y., Fan Y., Poon K.Y., Achrol A.S., Lawton M.T., Zhu Y., McCulloch C.E., Hashimoto T., Lee C., Barbaro N.M., Bollen A.W., Yang G.Y., Young W.L. MMP-9 expression is associated with leukocytic but not endothelial markers in brain arteriovenous malformations. Front Biosci. 2006;11:3121–3128. doi: 10.2741/2037. [DOI] [PubMed] [Google Scholar]
- 37.Pfefferkorn T., Rosenberg G.A. Closure of the blood-brain barrier by matrix metalloproteinase inhibition reduces rtPA-mediated mortality in cerebral ischemia with delayed reperfusion. Stroke. 2003;34:2025–2030. doi: 10.1161/01.STR.0000083051.93319.28. [DOI] [PubMed] [Google Scholar]
- 38.Komotar R.J., Starke R.M., Connolly E.S. The role of drain placement following chronic subdural hematoma evacuation. Neurosurgery. 2010;66:N15–N16. doi: 10.1227/01.neu.0000367840.82764.3a. [DOI] [PubMed] [Google Scholar]
- 39.Sato S., Kodama N., Sasaki T., Matsumoto M., Ishikawa T. Perinidal dilated capillary networks in cerebral arteriovenous malformations. Neurosurgery. 2004;54:163–168. doi: 10.1227/01.neu.0000097518.57741.be. Discussion 168-70. [DOI] [PubMed] [Google Scholar]
- 40.Zhao Y., Li P., Fan W., Chen D., Gu Y., Lu D., Zhao F., Hu J., Fu C., Chen X., Zhou L., Mao Y. The rs522616 polymorphism in the matrix metalloproteinase-3 (MMP-3) gene is associated with sporadic brain arteriovenous malformation in a Chinese population. J Clin Neurosci. 2010;17:1568–1572. doi: 10.1016/j.jocn.2010.04.023. [DOI] [PubMed] [Google Scholar]
- 41.Hashimoto T., Matsumoto M.M., Li J.F., Lawton M.T., Young W.L., University of California, San Francisco, BAVM Study Group Suppression of MMP-9 by doxycycline in brain arteriovenous malformations. BMC Neurol. 2005;5:1. doi: 10.1186/1471-2377-5-1. [DOI] [PMC free article] [PubMed] [Google Scholar]
- 42.Krithika S., Sumi S. Neurovascular inflammation in the pathogenesis of brain arteriovenous malformations. J Cell Physiol. 2021;236:4841–4856. doi: 10.1002/jcp.30226. [DOI] [PubMed] [Google Scholar]
- 43.Hashimoto T., Wen G., Lawton M.T., Boudreau N.J., Bollen A.W., Yang G.Y., Barbaro N.M., Higashida R.T., Dowd C.F., Halbach V.V., Young W.L. Abnormal expression of matrix metalloproteinases and tissue inhibitors of metalloproteinases in brain arteriovenous malformations. Stroke. 2003;34:925–931. doi: 10.1161/01.STR.0000061888.71524.DF. [DOI] [PubMed] [Google Scholar]
- 44.Stratman A.N., Malotte K.M., Mahan R.D., Davis M.J., Davis G.E. Pericyte recruitment during vasculogenic tube assembly stimulates endothelial basement membrane matrix formation. Blood. 2009;114:5091–5101. doi: 10.1182/blood-2009-05-222364. [DOI] [PMC free article] [PubMed] [Google Scholar]
- 45.Janardhan H.P., Saheera S., Jung R., Trivedi C.M. Vascular and lymphatic malformations: perspectives from human and vertebrate studies. Circ Res. 2021;129:131–135. doi: 10.1161/CIRCRESAHA.121.319587. [DOI] [PMC free article] [PubMed] [Google Scholar]
- 46.Snellings D.A., Hong C.C., Ren A.A., Lopez-Ramirez M.A., Girard R., Srinath A., Marchuk D.A., Ginsberg M.H., Awad I.A., Kahn M.L. Cerebral cavernous malformation: from mechanism to therapy. Circ Res. 2021;129:195–215. doi: 10.1161/CIRCRESAHA.121.318174. [DOI] [PMC free article] [PubMed] [Google Scholar]
- 47.Oh J., Takahashi R., Kondo S., Mizoguchi A., Adachi E., Sasahara R.M., Nishimura S., Imamura Y., Kitayama H., Alexander D.B., Ide C., Horan T.P., Arakawa T., Yoshida H., Nishikawa S., Itoh Y., Seiki M., Itohara S., Takahashi C., Noda M. The membrane-anchored MMP inhibitor RECK is a key regulator of extracellular matrix integrity and angiogenesis. Cell. 2001;107:789–800. doi: 10.1016/s0092-8674(01)00597-9. [DOI] [PubMed] [Google Scholar]
- 48.Marbaix E., Kokorine I., Henriet P., Donnez J., Courtoy P.J., Eeckhout Y. The expression of interstitial collagenase in human endometrium is controlled by progesterone and by oestradiol and is related to menstruation. Biochem J. 1995;305(Pt 3):1027–1030. doi: 10.1042/bj3051027. [DOI] [PMC free article] [PubMed] [Google Scholar]
- 49.Marbaix E., Kokorine I., Donnez J., Eeckhout Y., Courtoy P.J. Regulation and restricted expression of interstitial collagenase suggest a pivotal role in the initiation of menstruation. Hum Reprod. 1996;11 Suppl 2:134–143. doi: 10.1093/humrep/11.suppl_2.134. [DOI] [PubMed] [Google Scholar]
- 50.Gaide Chevronnay H.P., Selvais C., Emonard H., Galant C., Marbaix E., Henriet P. Regulation of matrix metalloproteinases activity studied in human endometrium as a paradigm of cyclic tissue breakdown and regeneration. Biochim Biophys Acta. 2012;1824:146–156. doi: 10.1016/j.bbapap.2011.09.003. [DOI] [PubMed] [Google Scholar]
- 51.Knox J.B., Sukhova G.K., Whittemore A.D., Libby P. Evidence for altered balance between matrix metalloproteinases and their inhibitors in human aortic diseases. Circulation. 1997;95:205–212. doi: 10.1161/01.cir.95.1.205. [DOI] [PubMed] [Google Scholar]
- 52.Nikkari S.T., O'Brien K.D., Ferguson M., Hatsukami T., Welgus H.G., Alpers C.E., Clowes A.W. Interstitial collagenase (MMP-1) expression in human carotid atherosclerosis. Circulation. 1995;92:1393–1398. doi: 10.1161/01.cir.92.6.1393. [DOI] [PubMed] [Google Scholar]
- 53.Lehrke M., Greif M., Broedl U.C., Lebherz C., Laubender R.P., Becker A., von Ziegler F., Tittus J., Reiser M., Becker C., Göke B., Steinbeck G., Leber A.W., Parhofer K.G. MMP-1 serum levels predict coronary atherosclerosis in humans. Cardiovasc Diabetol. 2009;8:50. doi: 10.1186/1475-2840-8-50. [DOI] [PMC free article] [PubMed] [Google Scholar]
- 54.Higashikata T., Yamagishi M., Higashi T., Nagata I., Iihara K., Miyamoto S., Ishibashi-Ueda H., Nagaya N., Iwase T., Tomoike H., Sakamoto A. Altered expression balance of matrix metalloproteinases and their inhibitors in human carotid plaque disruption: results of quantitative tissue analysis using real-time RT-PCR method. Atherosclerosis. 2006;185:165–172. doi: 10.1016/j.atherosclerosis.2005.05.039. [DOI] [PubMed] [Google Scholar]
- 55.Montero I., Orbe J., Varo N., Beloqui O., Monreal J.I., Rodríguez J.A., Díez J., Libby P., Páramo J.A. C-reactive protein induces matrix metalloproteinase-1 and -10 in human endothelial cells: implications for clinical and subclinical atherosclerosis. J Am Coll Cardiol. 2006;47:1369–1378. doi: 10.1016/j.jacc.2005.10.070. [DOI] [PubMed] [Google Scholar]
- 56.Sukhova G.K., Schönbeck U., Rabkin E., Schoen F.J., Poole A.R., Billinghurst R.C., Libby P. Evidence for increased collagenolysis by interstitial collagenases-1 and -3 in vulnerable human atheromatous plaques. Circulation. 1999;99:2503–2509. doi: 10.1161/01.cir.99.19.2503. [DOI] [PubMed] [Google Scholar]
- 57.Irizarry E., Newman K.M., Gandhi R.H., Nackman G.B., Halpern V., Wishner S., Scholes J.V., Tilson M.D. Demonstration of interstitial collagenase in abdominal aortic aneurysm disease. J Surg Res. 1993;54:571–574. doi: 10.1006/jsre.1993.1087. [DOI] [PubMed] [Google Scholar]
- 58.Newman K.M., Malon A.M., Shin R.D., Scholes J.V., Ramey W.G., Tilson M.D. Matrix metalloproteinases in abdominal aortic aneurysm: characterization, purification, and their possible sources. Connect Tissue Res. 1994;30:265–276. doi: 10.3109/03008209409015042. [DOI] [PubMed] [Google Scholar]
- 59.Ameku T., Taura D., Sone M., Numata T., Nakamura M., Shiota F., Toyoda T., Matsui S., Araoka T., Yasuno T., Mae S.-I., Kobayashi H., Kondo N., Kitaoka F., Amano N., Arai S., Ichisaka T., Matsuura N., Inoue S., Yamamoto T., Takahashi K., Asaka I., Yamada Y., Ubara Y., Muso E., Fukatsu A., Watanabe A., Sato Y., Nakahata T., Mori Y., Koizumi A., Nakao K., Yamanaka S., Osafune K. Identification of MMP1 as a novel risk factor for intracranial aneurysms in ADPKD using iPSC models. Sci Rep. 2016;6 doi: 10.1038/srep30013. [DOI] [PMC free article] [PubMed] [Google Scholar]