

Abstract
Objectives:
To examine the associations of actigraphy-assessed sleep timing and regularity with psychological health in early late life women, whose circadian rhythms may be impacted by aging.
Design:
Cross-sectional.
Participants:
A racially/ethnically diverse sample of 1197 community-dwelling women (mean age 65 years) enrolled in the Study of Women’s Health Across the Nation.
Measures:
Actigraphy-assessed sleep measures included timing (mean midpoint from sleep onset to wakeup) and regularity (standard deviation of midpoint in hours). Psychological health measures included a composite well-being score, the Center for Epidemiological Studies Depression Scale, and the Generalized Anxiety Disorder-7 Scale. Linear and logistic regression models, adjusted for covariates (including sleep duration), tested associations between sleep and psychological health measures.
Results:
After covariate adjustment, a sleep midpoint outside of 2:00–4:00 AM was significantly associated with depressive symptoms (β = 0.88, 95% CI = 0.06, 1.70) and scoring above the cut-point for clinically significant depressive symptoms (OR = 1.72, 95% CI = 1.15, 2.57). Sleep irregularity was significantly associated with lower psychological well-being (β = −0.18, 95% CI = −0.33, −0.03), depressive (β = 1.36, 95% CI = 0.29, 2.44) and anxiety (β = 0.93, 95% CI = 0.40, 1.46) symptoms, and scoring above the cut-point for clinically significant depressive (OR = 1.68, 95% CI = 1.01, 2.79) and anxiety (OR = 1.62, 95% CI = 1.07, 2.43) symptoms.
Conclusion:
Above and beyond sleep duration, a sleep midpoint outside of 2:00–4:00 AM was associated with depressive symptoms while sleep irregularity was associated with multiple psychological health domains in late life women.
Keywords: Actigraphy, Sleep regularity, Sleep timing, Women, Psychological health, Well-being, depression, Anxiety, Older adults
Introduction
The proportion of older adults in the United States is increasing—an estimated 20% of the population will be over the age of 65 years by 2030.1 Identifying modifiable behaviors that support better psychological health is critically important for healthy aging. Numerous studies have demonstrated that greater psychological well-being2–4 and good mental health5–7 are predictive of better physical health and fewer functional impairments with aging. The underpinnings of psychological well-being and mental health in midlife and older adults are multifactorial, and include factors that are modifiable (eg, physical activity, sleep) and those less easily modified (eg, higher education, income).8–10 In cohort studies, the associations among sleep, psychological well-being,8,11–13 depression,9,10,14–16 and anxiety17 in midlife and older adults have been examined largely within the specific sleep health dimensions of insomnia, sleep duration, and sleep quality. However, as aging impacts aspects of sleep beyond these dimensions, understanding associations between other aspects of sleep health and psychological health in older adults is critical to informing interventions to enhance psychological health in this population.
Sleep timing (ie, the placement of sleep within the 24-h day) and the regularity of sleep (ie, the consistency of sleep timing across multiple nights) are emerging as important determinants of physical and psychological health.18,19 These dimensions of sleep health are particularly relevant for older adults, as their sleep-wake patterns are impacted by normative aging of the systems that control sleep and its timing.20,21 Moreover, the timing and regularity of sleep may be unhealthy even when other dimensions of sleep health are within the normal range (eg, healthy sleep duration, no significant insomnia symptoms).
Recent work has identified important initial links between the timing and regularity of sleep and depression in older adults.22–24 Healthy sleep timing is most frequently defined as the midpoint of sleep occurring between 2:00 AM and 4:00 AM.23,25–27 However, different definitions have been utilized in the literature (eg, 1:00 AM - 03:00 AM22 in a study based in Taiwan) which may be in part due to sociocultural influences on sleep timing.28 In a sample of more than 1000 older adults in Taiwan, a sleep midpoint outside of 1:00 AM 03:00 AM (based on self-reported sleep timing) was cross-sectionally associated with depressive symptoms.22 In the Study of Osteoporotic Fractures (SOF), a large cohort study of older women (mean age of 80 years), mid-sleep time (derived from self-reported sleep timing) had a U-shaped cross-sectional association (when modeled as a continuous variable) with the presence of clinically significant depressive symptoms, linking both early and late sleep timing to depressive symptoms.23 Moreover, in this same study, an early mid-sleep time (before 02:00) was prospectively associated with the development of clinically significant depressive symptoms 6 years later.23 Findings from the Multi-Ethnic Study of Atherosclerosis (MESA) cohort study in older adults (mean age 69 years) demonstrated that sleep irregularity (derived from wrist actigraphy), but not sleep midpoint (measured continuously), was concurrently associated with depressive symptom severity and presence of clinically significant depressive symptoms.29 In a smaller wrist actigraphy study of 128 older adults, those with current or remitted depression had less sleep regularity relative to healthy controls.24
Findings from these studies suggest important associations among sleep timing, sleep regularity, and depressive symptoms in older adults. However, this nascent body of work has significant limitations, including: samples that are not racially and ethnically diverse (ie, >90% White participants in SOF23); self-reported sleep measures,22,23 which are significantly less accurate relative to actigraphy with respect to the timing of sleep;30 and a focus only on depression (depressive symptoms or current/past history of depression diagnosis), without consideration for other domains of psychological health. Thus, more studies are needed to fully elucidate these relationships using direct, behavioral assessments of sleep timing collected in real time (ie, wrist actigraphy) in larger, more racially/ethnically diverse samples with more comprehensive assessments of psychological health beyond depression.
In the present study, we sought to address these gaps by examining associations among the sleep health dimensions of sleep timing and sleep regularity derived using wrist actigraphy and a more comprehensive set of psychological health domains (psychological well-being, depressive symptoms, and anxiety) in a large, racially, ethnically, and socioeconomically diverse sample of community-dwelling, early late life women participating in the Study of Women’s Health Across the Nation (SWAN). We hypothesized that: (1) An early or late sleep midpoint (outside of 2:00 AM – 4:00 AM) would be associated with poorer psychological health; and (2) Greater irregularity in sleep timing would be associated with poorer psychological wellbeing, anxiety, and depressive symptoms. Further, we explored whether sleep timing and regularity differed by race/ethnicity, and whether associations among the sleep variables and psychological health differed by race/ethnicity.
Participants and methods
Study design
Data were collected as part of SWAN, a community-based, multisite, multiracial, multiethnic, prospective cohort study of women.31 In 1996, SWAN enrolled 3302 premenopausal women aged 42–52, who were followed through menopause and into older age with the goal of characterizing the natural history of the menopausal transition and changes in symptoms and health through this life stage. Participants provided written informed consent, and approval was obtained from Institutional Review Boards at each of the SWAN sites (Boston, MA; Chicago, IL; Southeast MI; Davis and Los Angeles, CA; Newark, NJ; and Pittsburgh, PA). Each site enrolled White women and women of one other race and ethnicity (Black women at 4 sites and Chinese, Hispanic, and Japanese women at one site each). By design, approximately half the participants were White. Eligible women were menstruating, not pregnant or lactating, and not using reproductive hormones at enrollment. Data for the present cross-sectional analysis were collected in 2015–2016 during the SWAN follow-up visit 15, which included a sleep actigraphy substudy.
Participants
Of the 3153 surviving women who were initially enrolled in SWAN, 2091 (66.3%) participated in follow-up clinic visit 15. At the time of follow-up visit 15, a subset of participants (1333 women, 63.7%) were enrolled in the sleep actigraphy substudy. Because of financial constraints as well as timing of the weeklong actigraphy study embedded in the context of the core protocol, not all women were asked to participate in the actigraphy portion of the protocol. Rather, each site was committed to recruit between 141 and 225 women, with Black, Chinese, Japanese, and Hispanic women overrepresented. Participants who were wheelchair bound, blind, or who had plans to travel across time zones during the protocol period were excluded from the actigraphy protocol. Two hundred eighty-five participants who were approached about the sleep actigraphy substudy declined participation. Of the 1333 women enrolled in the sleep actigraphy substudy, 1217 (91.2%) had usable data and met the study inclusion criteria of at least 4 nights of valid actigraphy data (nights did not have to be consecutive). Participants did not differ from other SWAN participants at visit 15 regarding self-assessment of sleep characteristics.32 One participant who did not complete at least one of the psychological health measures at visit 15 and 19 women who reported night shift work at this assessment point were excluded, resulting in a final analytical sample size of 1197 participants. The final analytic sample had an average of 7.7 (standard deviation (SD) = 0.9) nights of actigraphy data.
Sleep measures
Wrist actigraphy was used to behaviorally characterize sleep-wake patterns. Participants wore an Actiwatch-2 (AW-2, Philips Respironics, Bend, OR) on their nondominant wrist for approximately 7 consecutive days and completed a daily diary in the morning and evening on each day of actigraphy. Participants were provided with the following instructions from study staff: how to complete diaries, which included a slide set presentation; how to press the actigraph event marker to indicate when they went to bed with the intention of going to sleep and when they rose from bed to start their day; and to wear the Actiwatch-2 device continuously. The evening diary included items on naps taken that day and the morning diary included items on time of getting into bed, time trying to go to sleep, length of time to fall asleep, number of awakenings during the night, length of time awake during the night, time waking up for the day, time rising from bed to start the day. The diary also included items on hot flashes or night sweats during the night, use of medication for sleep that night, and overall sleep quality.
The AW-2 accelerometer was set at 0.05 g (g = a gravity unit, 1 g = 9.81/second2) for 3–11 Hz. The analog signal was digitized by the digital integration method. The wake threshold was set at 40 counts per minute and data were sampled in 1-min epochs. Data were processed, evaluated for quality, and scored at the University of Pittsburgh study site with the sleep diary “in-hand” in conjunction with the standard sleep detection algorithm in Actiware 5.0.9 (Philips Respironics), using procedures consistent with Society of Behavioral Sleep Medicine guidelines.33 The primary rest interval was defined as the longest period of rest in a 24-hour period, identified by bed and risetimes recorded by event markers or in diaries. Sleep start and stop times were initially detected by the Actiware algorithm, and hand-edited by a single reviewer when needed to adjust misidentified sleep-wake times. Rest intervals which occurred within 30 minutes of a participants’ primary rest interval were incorporated into the primary rest interval. Actigraphy data were averaged across the measurement period.
Two primary independent variables were derived from actigraphy in the present study: (1) sleep timing (the mean midpoint from sleep onset to wake-up), and (2) sleep regularity across nights (SD of the midpoint from sleep onset to wake-up in hours).34 To calculate sleep midpoint, sleep onset and wake-up times were first converted to decimals and centered around midnight (negative values indicate times before midnight). Sleep midpoint was then calculated as: sleep onset time + ((wake-up time-sleep onset time)/2). For each participant, sleep regularity was defined as the standard deviation (in hours) of the sleep midpoint across all nights with actigraphy data; higher values indicate more irregularity in sleep timing. We also calculated the average sleep midpoint for each participant across all nights of their data. Based on a cut-point for healthy sleep timing per published data, the sleep midpoint variable was then dichotomized as healthy (occuring between 2:00 and 4:00 AM) or early/late (outside of 2:00–4:00 AM).23,25–27
Psychological health measures
On the day they completed the psychological health measures, participants were provided with the wrist actigraph and were instructed to begin wearing it. To assess well-being, we used a composite measure of psychological well-being developed in SWAN (for details, see Avis et al.8). In brief, four well-being scales (the Satisfaction with Life Scale,35 the positive affect subscale of the Positive and Negative Affect scale,36 and the Ryff Purpose in Life and Personal Growth scales37) were used to create a composite score. A principal component analysis, run on standardized values of the total scores of each measure, was used to examine the factor structure of the four measures, which resulted in a single factor. Each scale was then weighted using factor loading results, and the sum of the weighted values for each scale was calculated to create the composite well-being score. The psychological well-being (PWB) score is also a standardized score, with a mean of 0 and a SD equal to 1. Negative scores indicate lower-than-average psychological well-being. Depressive symptoms and anxiety symptoms were modeled as both continuous scales and dichotomous variables. Depressive symptoms over the past week were measured using the Center for Epidemiological Studies Depression Scale (CES-D38) where higher scores indicate greater depression symptoms, and a score of 16 indicates clinically significant depressive symptoms.38 Anxiety over the past 2 weeks was measured using the Generalized Anxiety Disorder-7 scale (GAD-739)where higher scores indicate greater anxiety symptoms, and a score of 5 indicates clinically significant generalized anxiety symptoms on the GAD based on data from older adult samples.40
Demographic variables and covariates
Covariates were selected based on a priori associations with sleep and/or psychological health. Demographic covariates included self-reported race/ethnicity (White, Black, Chinese, Hispanic, and Japanese), age, difficulty paying for basic necessities (very/somewhat vs. not at all, as a proxy for financial strain41), and employment status. Medical comorbidities were self-reported at visit 15 and included anemia, diabetes, hypertension, high cholesterol, migraines, osteoarthritis, hyper- or hypoactive thyroid, heart attack, angina, osteoporosis, cancer, pulmonary embolism, deep vein thrombosis, stroke, and congestive heart failure. To create the medical comorbidities covariate variable, we trichotomized the total number of comorbidities reported into 0, 1, or ≥ 2 comorbidities. Sleep covariates total included sleep time and wake after sleep onset (WASO; total minutes within the sleep period scored as wake) measured via wrist actigraphy; both were converted into hours by dividing by 60. Medication covariates included self-reported use of antidepressant medications and use of anxiolytic medications. Hormonal replacement therapy use (yes/no) was collected at visit 15 but not included as a covariate due to the small number of users (~5%). Other covariates based sleep diary data included the proportion of nights when sleep medications were used and the proportion of nights with vasomotor symptoms (VMS; hot flashes or night sweats). All demographics and covariates were collected at follow-up visit 15. For participants missing covariates (eg, employment status and difficulty paying for basics) at visit 15, we used the measure at the closest prior visit.
Statistical analyses
Means and standard deviations were calculated for continuous variables and frequencies for categorical variables. To examine the associations among sleep measures (sleep regularity and sleep timing) and psychological health measures, separate models regressed each psychological health variable on each sleep variable. First, we regressed each psychological health variable on each sleep variable individually in separate unadjusted models, using linear regression for continuous CES-D and GAD variables, and logistic regression for the dichotomous CES-D and GAD variables. Next, all models were adjusted for demographic characteristics, total sleep time, WASO, proportion of nights on sleep medication, proportion of nights experiencing any VMS, and number of medical comorbidities. All model residuals from linear regressions were examined for skew and found to be approximately normally distributed. Statistical signifycance was defined at a < 0.05. All analyses were completed using RStudio version 1.1.456 (RStudio Team42).
To explore whether sleep timing and regularity differed by race/ethnicity, we calculated means and standard deviations by racial/ethnic group and used ANOVA to test for significant differences across groups; for ANOVA tests with p-values < .05, we used Tukey posthoc adjustment (honestly significant difference; HSD) to test for pairwise significant differences. We used a chi-square test to test for racial/ethnic differences in the categorical sleep timing variable. To explore whether the associations among sleep timing and regularity and psychological health differed by race/ethnicity, we fit the adjusted models with interactions between each of the sleep measures and race/ethnicity, with White participants as the referent group. Due to the small number of Hispanic women in the full sample, we excluded Hispanic women from the interaction models.
Results
On average, participants were 65.5 years old (SD =2.6; range = 60.5–72.2 years), and all were postmenopausal. Most participants had completed at least some college (see Table 1 for demographic characteristics). Self-reported race and ethnicity was 25% Black, 46% White, 12% Chinese, 11% Japanese, and 6% Hispanic. Approximately half of the participants had 2 or more medical comorbidities. Antidepressant medication use was reported by 15%, and 8% reported anxiolytic use. Only 5% reported hormone replacement therapy use. Mean total sleep time per actigraphy was 6 hours, 30 minutes (range = 2 hours, 28 minutes to 9 hours, 48 minutes), and mean wake after sleep onset per actigraphy was 52 minutes (range = 4 minutes-166 minutes). Nine participants (0.75% of the sample) had an average sleep duration less than 4 hours per night per wrist actigraphy. A sensitivity analysis excluding these participants indicated no significant changes to the results; therefore, all participants were retained in the analyses regardless of sleep duration.
Table 1.
Population characteristics at follow-up visit 15 (2015–2016) in the Study of Women’s Health Across the Nation (N = 1197)
| Characteristic | Mean ± SD |
|---|---|
| Age (years) | 65.5 ± 2.6 |
| Proportion of nights used sleep medicine* | 0.1 ± 0.3 |
| Proportion of nights with hot flashes/night sweats* | 0.1 ± 0.2 |
| Race/ethnicity | |
| Black | 302(25.2) |
| Chinese | 146(12.2) |
| Hispanic | 73(6.1) |
| Japanese | 129(10.8) |
| White | 547(45.7) |
| Site | |
| Michigan | 180(15.4) |
| Boston | 152(12.7) |
| Chicago | 157(13.1) |
| Davis | 209(17.5) |
| Los Angeles | 205(17.1) |
| New Jersey | 104(8.7) |
| Pittsburgh | 190(15.9) |
| Difficulty paying for basic necessities | |
| Very | 36(3) |
| Somewhat | 232(19.4) |
| Not at All | 929(77.6) |
| Education level | |
| Less than high school | 62(5.2) |
| High school | 182(15.3) |
| Some college | 365(30.7) |
| College | 269(22.6) |
| Post-college | 311(26.2) |
| Antidepressant medication use | |
| No | 1022(85.4) |
| Yes | 175(14.6) |
| Anxiolytic medication use | |
| No | 1105(92.3) |
| Yes | 92(7.7) |
| Employed | |
| No | 581(48.6) |
| Yes | 615(51.4) |
| Number of medical comorbidities | |
| 0 | 242(20.2) |
| 1 | 297(24.8) |
| 2+ | 658(55) |
Missing: proportion of nights used sleep meds, N = 37; proportion of nights with hot flashes/night sweats, N = 35.
Descriptive statistics for the sleep timing, sleep regularity, and psychological health variables are summarized in Tables 2 and 3, respectively. Eleven percent and 21% scored above the cut-point for clinically significant depressive and generalized anxiety symptoms, respectively.
Table 2.
Means and standard deviations of sleep measures overall and by race/ethnicity at follow-up 15 (2015–2016) in the Study of Women’s Health Across the Nation (N = 1197)
| Race/Ethnicity | ||||||
|---|---|---|---|---|---|---|
| Overall (N = 1197) | White (N = 547) | Black (N = 302) | Chinese (N = 146) | Japanese (N = 129) | Hispanic (N = 73) | |
| Measure | Mean ± SD | Mean ± SD | Mean ± SD | Mean ± SD | Mean ± SD | Mean ± SD |
| Sleep regularity* (h) | 0.73 ± 0.38 | 0.68 ± 0.34 | 0.88 ± 0.46 | 0.69 ± 0.33 | 0.59 ± 0.30 | 0.77 ± 0.39 |
| Sleep midpoint (clock time, hh:mm) | 03:25 ± 01:07 | 03:19 ± 01:05 | 3:36 ± 1:14 | 3:36 ± 1:09 | 3:14± 0:54 | 3:25 ± 1:06 |
| N (%) | N (%) | N (%) | N (%) | N (%) | N (%) | |
| Sleep midpoint | ||||||
| Before 2:00 AM | 89(7.44) | 39(7.13) | 25(8.28) | 7(4.79) | 10(7.75) | 8(10.96) |
| Between 2:00–4:00 AM | 796(66.50) | 392(71.66) | 179(59.27) | 89(60.96) | 91(70.54) | 45(61.64) |
| After 4:00 AM | 312(26.07) | 116(21.21) | 98(32.45) | 50(34.25) | 28(21.71) | 20(27.40) |
Note. h, hours; m, minutes; SD, standard deviation.
Sleep regularity is the standard deviation, in hours, of the midpoint from sleep onset to wake-up across nights of actigraph.
Table 3.
Means and standard deviations of well-being/mental health measures at follow-up visit 15 (2015–2016) in the Study of Women’s Health Across the Nation (N = 1197)
| Measure | Mean ± SD |
|---|---|
| CES-D | 6.71 ± 7.12 |
| GAD* | 2.59 ± 3.44 |
| PWB* | 0.04 ± 0.99 |
| N (%) | |
| Depressive symptoms (CES-D ≥ 16) | |
| No | 1063(88.81) |
| Yes | 134(11.19) |
| Anxiety symptoms (GAD ≥ 5) | |
| No | 944(79.26) |
| Yes | 247(20.74) |
Missing: GAD, N = 6; PWB, N = 27.
Note. SD, standard deviation; CES-D, Center for Epidemiological Studies Depression scale, higher scores indicate more severe depressive symptoms; GAD, Generalized Anxiety Disorder-7 scale, higher scores indicate more severe generalized anxiety symptoms; PWB, Psychological Well-Being score, higher scores indicate better psychological well-being.
The associations of sleep timing and sleep regularity with continuous psychological health variables are presented in Table 4 and Fig. 1. In unadjusted models, greater sleep irregularity was associated with lower psychological well-being (β = −0.21, p =.005), and higher depressive (β = 1.77, p ≤ .001), and anxiety (β = 0.97, p ≤ .001) symptom scores. These associations remained significant, though attenuated, after adjustment for covariates (β = −0.18, p = .020, β = 1.36, p = .013, β = 0.93, p ≤ .001 for well-being, depressive symptoms, and anxiety symptoms, respectively). For every hour of sleep irregularity, the well-being composite score was reduced by 0.18, the depressive symptom severity score increased by 1.36 points, and generalized anxiety symptom severity increased by 0.93 points. A sleep midpoint outside of 2:00 – 4:00 AM was associated with lower psychological well-being (β = −0.15, p = .012) and greater depressive symptoms (β = 1.50, p .001); however, only association with depressive symptoms remained after adjustment (β = 0.88, p = .035). Having a a sleep midpoint outside of 2:00 – 4:00 AM increased the depression symptom severity score by 0.88 points.
Table 4.
Unadjusted and adjusted linear regression estimates between sleep and psychological health measures at follow-up visit 15 (2015–2016) in the Study of Women’s Health Across the Nation
| PWB (N =1170)a | CES-D (N =1197)b | GAD-7 (N =1191)c | ||||
|---|---|---|---|---|---|---|
| β (95% CI) | p-value | β (95% CI) | p-value | β (95% CI) | p-value | |
| Unadjusted | ||||||
| Sleep regularity | −0.21 (−0.36, −0.06) | .005 | 1.77(0.73, 2.82) | <.001 | 0.97(0.46, 1.48) | <.001 |
| Sleep midpoint | ||||||
| Between 2:00–4:00 AM | reference | reference | reference | |||
| Outside 2:00–4:00 AM | −0.15 (−0.28, −0.03) | .012 | 1.50(0.65, 2.35) | <.001 | 0.25(−0.16, 0.67) | .231 |
| Adjustedd | ||||||
| Sleep regularity | −0.18 (−0.33, −0.03) | .020 | 1.36(0.29, 2.44) | .013 | 0.93(0.40, 1.46) | <.001 |
| Sleep midpoint | ||||||
| Between 2:00–4:00 AM | reference | reference | reference | |||
| Outside 2:00–4:00 AM | −0.06 (−0.17, 0.06) | .320 | 0.88(0.06, 1.70) | .035 | 0.12(−0.28, 0.52) | .565 |
Note. CI, confidence interval; PWB, Psychological Well-Being score; CES-D, Center for Epidemiological Studies Depression scale, GAD, Generalized Anxiety Disorder-7 scale.
Adjusted N = 1,139.
Adjusted N = 1,160.
Adjusted N = 1, 156.
Adjusted for race and ethnicity, age, difficulty paying for basics, and employment, antidepressant use, anxiolytic use, total sleep time, wake after sleep onset, proportion of nights used sleep medication, proportion of nights with hot flashes/night sweats, and number of medical comorbidities.
Figure 1.
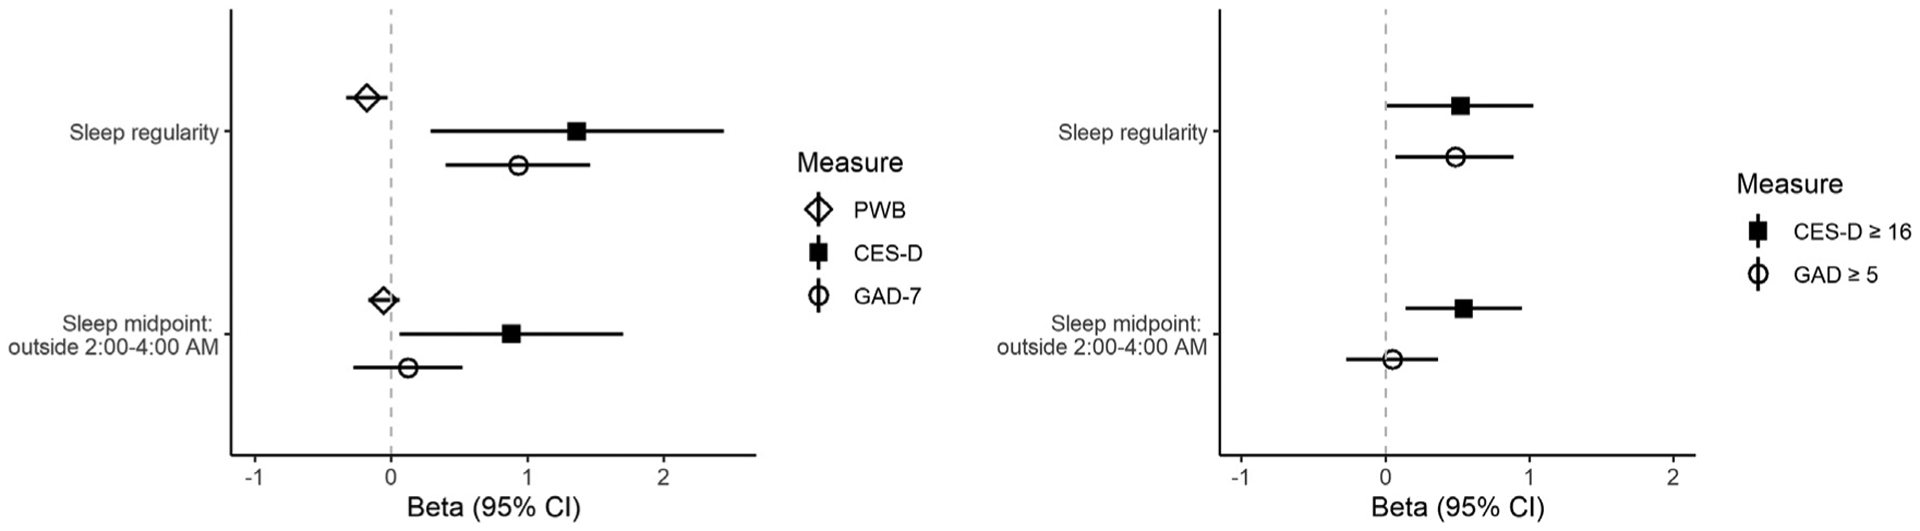
Adjusted linear associations among sleep and psychological health measures. All models adjusted for race and ethnicity, age, difficulty paying for basics, and employment, antidepressant use, anxiolytic use, total sleep time, wake after sleep onset, proportion of nights used sleep medication, proportion of nights with hot flashes/night sweats, and number of medical comorbidities. CI, confidence interval, CES-D, Center for Epidemiological Studies Depression scale, GAD, Generalized Anxiety Disorder-7 scale, PWB, Psychological Well-Being score.
Table 5 and Fig. 1 show the results of the associations of sleep timing and sleep regularity with clinically significant cut-points for the CES-D and GAD-7. Greater sleep irregularity was associated with increased odds of experiencing clinically significant depressive (OR = 1.73, p = .008) and clinically significant anxiety symptoms (OR = 1.53, p = .016); these associations persisted largely unchanged after adjustment (OR = 1.68, p = .046 for depressive symptoms; OR = 1.62, p = .020 for anxiety symptoms). This translates to each hour of sleep irregularity increasing the odds of experiencing clinically significant depressive symptoms by 68% and clinically significant anxiety symptoms by 62%. A sleep midpoint outside of 2:00 – 4:00 AM was associated with greater odds for clinically significant depressive symptoms before (OR = 2.04, p .001) and after adjustment (OR = 1.72, p = .008), but was not significantly associated with scoring above the clinically significant anxiety symptoms cut-point. This translates to a sleep midpoint outside of 2:00 to 4:00 AM increasing the odds of experiencing clinically significant depressive symptoms by 72%.
Table 5.
Unadjusted and adjusted logistic regression estimates between sleep and clinically significant depression and generalized anxiety symptoms at follow-up visit 15 (2015–2016) in the Study of Women’s Health Across the Nation
| CES-D ≥ 16 | GAD ≥ 5 | |||
|---|---|---|---|---|
| N = 1197a | N = 1191b | |||
| OR(95%CI) | p-value | OR(95%CI) | p-value | |
| Unadjusted | ||||
| Sleep regularity | 1.73(1.14, 2.59) | .008 | 1.53(1.08, 2.17) | .016 |
| Sleep midpoint | ||||
| Between 2:00–4:00 AM | reference | reference | ||
| Outside 2:00–4:00 AM | 2.04(1.42, 2.93) | <.001 | 1.18(0.88, 1.58) | .259 |
| Adjusted | ||||
| Sleep regularity | 1.68(1.01, 2.79) | .046 | 1.62(1.07, 2.43) | .020 |
| Sleep midpoint | ||||
| Between 2:00–4:00 AM | reference | reference | ||
| Outside 2:00–4:00 AM | 1.72(1.15, 2.57) | .008 | 1.05(0.76, 1.44) | .757 |
Note. CI, confidence interval, CES-D, Center for Epidemiological Studies Depression scale, GAD, Generalized Anxiety Disorder-7 scale, OR, odds ratio.
Adjusted N = 1160.
Adjusted N = 1156.
Adjusted for race and ethnicity, age, difficulty paying for basics, and employment, antidepressant use, anxiolytic use, total sleep time, wake after sleep onset, proportion of nights used sleep medication, proportion of nights with hot flashes/night sweats, and number of medical comorbidities.
Sleep was significantly more irregular in Black participants relative to White, Chinese, and Japanese participants and in Hispanic participants relative to Japanese participants (Table 2; all Tukey’s HSD p < .001). Black participants had a later sleep midpoint relative to White (Tukey’s HSD p = .003) and Japanese (Tukey’s HSD p = .016) participants (Table 2). The proportion of participants with a a sleep midpoint outside of 2:00 – 4:00 AM also differed by race/ethnicity (p = .002, see Table 2). The association between a sleep midpoint outside of 2:00 – 4:00 AM and depression symptom severity score differed significantly for Black women in comparison to White women (p =.008); there was no significant association between a sleep midpoint outside of 2:00 – 4:00 AM and depressive symptom severity score for Black women (b = −1.03, p = .188), but for White women, a sleep midpoint outside of 2:00 – 4:00 AM was associated with a 1.65-point higher depressive symptom severity score (b = 1.65, p = .009).
Discussion
This is one of the first studies to evaluate the association of actigraphy-assessed sleep regularity and timing with psychological health in a large socioeconomically, racially, and ethnically diverse cohort of community-dwelling, early late life (aged 60–72 years) women. We found that a sleep midpoint outside of 2:00 to 4:00 AM was associated with depressive symptom scores and with an increased risk of having clinically significant depressive symptoms. Greater irregularity in the timing of sleep was associated with worse psychological well-being and higher depressive and anxiety symptoms, as well as with a greater risk of reporting clinically significant depressive and anxiety symptoms, even after adjustment for demographics, medical comorbidities, sleep duration, and time spent awake after initial sleep onset. Further, these associations were observed in a sample whose sleep duration and wake after sleep onset were within the normative range for early late life.43 Our results thus suggest that sleep irregularity is adversely associated with psychological health across multiple domains in community-dwelling early late life women, whereas the timing of sleep is most closely associated with depressive symptoms.
The present study is the first, to our knowledge, to demonstrate in a large cohort that sleep irregularity in early late life is associated with worse psychological health in domains other than depression (specifically, well-being and anxiety). Self-reported insomnia symptoms, particularly when recurrent over time, have been established as important prospective contributors to lower well-being in older adults.8,12,13 Our findings extend this existing body of literature beyond self-reported sleep health measures by demonstrating, for the first time, an association between irregular sleep measured via actigraphy and lower well-being in early late life women. Anxiety has been an understudied domain of psychological health with respect to sleep in this population, despite the meaningful prevalence rate and impact of generalized anxiety disorder in older adults. A previous cohort study linked worse sleep efficiency and more time spent awake during the night (measured via wrist actigraphy) to elevated anxiety symptoms in older adults.17 The authors of this study identified the need for greater recognition of anxiety in research studies as a correlate of sleep disturbances in older adults. In the present work, we answer this call by showing that sleep irregularity is associated with worse anxiety symptoms in early late life. Overall, our findings complement the existing sleep-psychological health literature and emphasize the importance of considering sleep regularity in addition to other aspects of sleep when assessing possible links between sleep and psychological health.
Our results also support prior work linking sleep timing and sleep irregularity to depressive symptoms in older adults.22–24,29 Our findings extend a growing body of work by showing that an extreme sleep midpoint (ie, either very early [before 1–2 AM] or very late [after 3–4 AM]), measured using actigraphy, is associated with depression in older adults, consistent with other studies in older adults which measured sleep timing using self-report.22,23 However, our results differ from a MESA cohort investigation, which did not show associations between sleep timing measured using actigraphy and depressive symptoms, perhaps due to differences in how sleep midpoint was modeled (ie, as a continuous variable in the MESA study, whereas a dichotomized variable was used in the present study). Thus, taken together with other investigations of sleep midpoint using self-reported measures of sleep timing, our findings highlight the value of examining both early and late sleep patterns in the context of depression in this population. By showing that higher levels of depressive symptoms and the risk of reporting clinically significant depressive symptoms both are associated with irregular sleep measured using actigraphy, we replicated previous cross-sectional analyses from both a smaller case-control study24 and a large-scale MESA cohort investigation,29 and bolster the rationale for future work to establish temporality in these relationships. Future work is needed to examine potential cross-cultural and/or solar time zone differences in optimal sleep timing.
More work is needed to understand the mechanisms through which sleep regularity may be associated with psychological health more broadly than sleep timing. Sleep regularity is associated with better perceived sleep quality in older adults,44 as well as longer sleep duration.45 Although these may be mechanisms by which more consistent sleep-wake timing impacts psychological health, it is also important to note that the findings from the present study persisted after adjustment for total sleep time and time spent awake during the night, suggesting that sleep regularity may be uniquely impactful above and beyond sleep duration and time spent awake during the night, both of which are indicators of sleep quality.46 Circadian rhythm dysregulation is a likely mechanism by which irregular sleep may uniquely contribute to poorer psychological health. When kept consistent, an early or late sleep-wake pattern does not disrupt or misalign circadian rhythms, whereas even small changes in the timing of sleep (eg, those caused by daylight saving time changes) may cause significant circadian rhythm disruption.47 Disrupted circadian rhythms in turn negatively impact the physiological underpinnings of psychological health (ie, hormones, neurotransmitters, neuroinflammation), which may be specific pathways through which sleep irregularity contributes more broadly to poorer psychological health.48
We also explored whether sleep timing and regularity differed by race/ethnicity. Consistent with previous work in cohort studies, our findings showed that Black participants were more likely to have a later midsleep time49 and more irregular sleep.29 We also found that a sleep midpoint outside of 2:00 to 4:00 AM was associated with greater depressive symptoms in White women but not Black women. At least one other study has also shown that a late midsleep time is linked to depression only in White participants when comparing Black and White participants.49 Reasons for this finding are likely complex and worthy of more in-depth analysis in future work. One possibility is that a later midsleep time may not represent unhealthy sleep timing for Black individuals, which speaks to the need to further understand whether the definition of healthy sleep timing differs among various groups and cultures.
The present work has several important strengths relative to the existing literature, especially the use of actigraphy to quantify sleep irregularity and timing; adjustment for important health and sleep parameters (including sleep duration and time spent awake during the night) to help clarify the unique roles of sleep regularity and sleep timing; a large, racially, ethnically, and socioeconomically diverse sample of early late life women; and use of a composite measure of psychological well-being that encompasses both eudemonic and hedonic aspects of well-being.
However, limitations should also be considered. As an observational, cross-sectional analysis, the present work cannot disentangle whether sleep timing and regularity prospectively impact psychological health, or visa-versa. More irregular sleep and unhealthy sleep timing may be concurrent manifestations of depression, anxiety, and lower psychological well-being. These pathways are likely complex and bidirectional.14,26 Other limitations of the present study include the inability to examine the impact of sleep timing during the week/work days vs. weekends/free days separately, the reliance on self-report from the sleep diary to define the sleep period for actigraphy; use of questionnaires to measure well-being, depression, and anxiety rather than a clinical diagnostic interview; use of actigraphy and not polysomnography (although actigraphy fares comparably to polysomnography with respect to sleep timing50); and an early late life sample of women prohibits generalizing to men as well as to young-/middle-aged women.
Conclusions
In summary, in a large cohort of early late life women, we found that a sleep midpoint outside of 2:00 to 4:00 AM was associated with elevated depressive symptoms and irregular sleep was linked to worse well-being and elevated anxiety and depressive symptoms. Importantly, these findings persisted even after accounting for wake after sleep onset and sleep duration. This study strengthens support for evidence of the association between sleep regularity and psychological health and suggests the need for future research to assess directionality of this association, as identifying modifiable contributors to psychological health and unhealthy sleep patterns in older adults is key to informing strategies that underlie healthy aging.
Acknowledgments
Clinical Centers: University of Michigan, Ann Arbor-Carrie Karvonen-Gutierrez, Pl 2021 - present, Siobán Harlow, Pl 2011 – 2021, Mar-yFran Sowers, Pl 1994 – 2011: Massachusetts General Hospital, Boston, MA - Sherri-Ann Burnett-Bowie, Pl 2020 - Present; Joel Finkelstein, Pl 1999 – 2020; Robert Neer, Pl 1994 – 1999; Rush University, Rush University Medical Center, Chicago, IL - Imke Janssen, Pl 2020 - Present; Howard Kravitz, Pl 2009 – 2020; Lynd powell, Pl 1994 – 2009; University of California, Davis/Kaiser - Elaine Waetjen and Monique Hedderson, Pls 2020- Present; Ellen Gold, Pl 1994–2020; University of California, Los Angeles – Arun Karlamangla, Pl 2020 - Present; Gail Greendale, Pl 1994 – 2020; Albert Einstein College of Medicine, Bronx, NY – Carol Derby, Pl 2011 - Present, Rachel Wildman, Pl 2010 – 2011; Nanette Santoro Pl 2004 – 2010; University of Medicine and Dentistry - New Jersey Medical School Newark - Gerson Weiss, Pl 1994 – 2004; and the University of Pitsbugh, PA - Rebecca Thurston, Pl 2020 - Present; Karen Matthews, Pl 1994 –2020.
NH Program Office: National Institute on Aging, Bethesda, MD - Rosaly Correa-de-Araujo 2020 - Present; Chhanda Dutta 2016- present; Winifred Rossi 2012 – 2016; Sherry Sherman 1994 – 2012; Marcia Ory 1994 – 2001; National Institute of Nursing Research, Bethesda, MD - Program Officers.
Central Laboratory: University of Michigan, Ann Arbor - Daniel McConnell (Central Ligand Assay Satellite Services).
Coordinating Center: University of Pittsburgh, Pittsburgh, PA – Maria Mori Brooks, Pl 2012 - Present; Kim Sutton-Tyrrell, Pl 2001 – 2012; New England Research Institutes, Watertown, MA – Sonja McKinlay, Pl 1995 – 2001.
Steering Committee: Susan Johnson, Current Chair; Chris Gallagher, Former Chair
We thank the study staff at each site and all the women who participated in SWAN.
Funding
The Study of Women’s Health Across the Nation (SWAN) has grant support from the National Institutes of Health (NIH), DHHS, through the National Institute on Aging (NIA), the National Institute of Nursing Research (NINR) and the NIH Office of Research on Women’s Health (ORWH) (Grants U01NR004061; U01AG012505, U01AG012535, U01AG012531, U01AG012539, U01AG012546, U01AG012553, U01AG012554, U01AG012495, and U19AG063720). The content of this article is solely the responsibility of the authors and does not necessarily represent the official views of the NIA, NINR, ORWH or the NIH.
Disclosures
Dr. Swanson reports grants from National Institutes of Health (NIH), during the conduct of the study. Dr. Kravitz reports grants from NIH/National Institue on Aging, during the conduct of the study. Dr. Hess reports grants from NIH, during the conduct of the study; personal fees from Astellas Pharmaceuticals, outside the submitted work. Dr. Derby reports grants from NIH, during the conduct of the study. Dr. Hall reports grants from NIH, during the conduct of the study. Dr. Joffe reports grants from NIH, during the conduct of the study; grants from Merck, grants from Pfizer, personal fees from Jazz, personal fees from Eisai, personal fees from Bayer, outside the submitted work.
Footnotes
Declaration of conflicts of interest
The authors have declared no conflicts of interest.
References
- 1.Vespa J The graying of America: more older adults than kids by 2035.https://www.census.gov/library/stories/2018/03/graying-america.html; 2018. accessed1/13/2022.
- 2.Ryff CD, Radler BT, Friedman EM. Persistent psychological well-being predicts improved self-rated health over 9–10 years: longitudinal evidence from MIDUS. Health Psychol Open. 2015;2(2):1–11. [DOI] [PMC free article] [PubMed] [Google Scholar]
- 3.Steptoe A, de Oliveira C, Demakakos P, Zaninotto P. Enjoyment of life and declining physical function at older ages: a longitudinal cohort study. Cmaj. 2014;186(4): E150–E156. [DOI] [PMC free article] [PubMed] [Google Scholar]
- 4.Okely JA, Gale CR. Well-being and chronic disease incidence: the English Longitudinal Study of Ageing. Psychosom Med. 2016;78(3):335–344. [DOI] [PMC free article] [PubMed] [Google Scholar]
- 5.Soysal P, Veronese N, Thompson T, et al. Relationship between depression and frailty in older adults: a systematic review and meta-analysis. Ageing Res Rev. 2017;36:78–87. [DOI] [PubMed] [Google Scholar]
- 6.Niles AN, O’Donovan A. Comparing anxiety and depression to obesity and smoking as predictors of major medical illnesses and somatic symptoms. Health Psychol. 2019;38(2):172–181. [DOI] [PMC free article] [PubMed] [Google Scholar]
- 7.Zivin K, Yosef M, Miller EM, et al. Associations between depression and all-cause and cause-specific risk of death: a retrospective cohort study in the Veterans Health Administration. J Psychosom Res. 2015;78(4):324–331. [DOI] [PubMed] [Google Scholar]
- 8.Avis NE, Colvin A, Hess R, Bromberger JT. Midlife factors related to psychological well-being at an older age: Study of Women’s Health Across the Nation. J Womens Health (Larchmt). 2020;30(3):332–340. [DOI] [PMC free article] [PubMed] [Google Scholar]
- 9.Bromberger JT, Kravitz HM, Youk A, Schott LL, Joffe H. Patterns of depressive disorders across 13 years and their determinants among midlife women: SWAN mental health study. J Affect Disord. 2016;206:31–40. [DOI] [PMC free article] [PubMed] [Google Scholar]
- 10.Bromberger JT, Schott LL, Avis NE, et al. Psychosocial and health-related risk factors for depressive symptom trajectories among midlife women over 15 years: Study of Women’s Health Across the Nation (SWAN). Psychol Med. 2019;49(2):250–259. [DOI] [PMC free article] [PubMed] [Google Scholar]
- 11.Steptoe A, O’Donnell K, Marmot M, Wardle J. Positive affect, psychological well-being, and good sleep. J Psychosom Res. 2008;64(4):409–415. [DOI] [PubMed] [Google Scholar]
- 12.Karlson CW, Gallagher MW, Olson CA, Hamilton NA. Insomnia symptoms and well-being: longitudinal follow-up. Health Psychol. 2013;32(3):311–319. [DOI] [PubMed] [Google Scholar]
- 13.Abell JG, Shipley MJ, Ferrie JE, Kivimaki M, Kumari M. Association of chronic insomnia Abell JG, Shipley MJ, Ferrie JE, Kivimaki M, Kumari M. Association of chronicinsomnia symptoms and recurent extreme sleep duration over 10 years with well-being in older adults: a cohort study. BMJ Open. 2016;6(2): e009501. [DOI] [PMC free article] [PubMed] [Google Scholar]
- 14.Bao YP, Han Y, Ma J, et al. Cooccurrence and bidirectional prediction of sleep disturbances and depression in older adults: meta-analysis and systematic review. Neurosci Biobehav Rev. 2017;75:257–273. [DOI] [PubMed] [Google Scholar]
- 15.Pigeon WR, Hegel M, Unutzer J, et al. Is insomnia a perpetuating factor for late-life depression in the IMPACT cohort? Sleep. 2008;31(4):481–488. [DOI] [PMC free article] [PubMed] [Google Scholar]
- 16.Jackowska M, Poole L. Sleep problems, short sleep and a combination of both increase the risk of depressive symptoms in older people: a 6-year follow-up investigation from the English Longitudinal Study of Ageing. Sleep Med. 2017;37:60–65. [DOI] [PubMed] [Google Scholar]
- 17.Spira AP, Stone K, Beaudreau SA, Ancoli-Israel S, Yaffe K. Anxiety symptoms and objectively measured sleep quality in older women. Am J Geriatr Psychiatry. 2009;17(2):136–143. [DOI] [PMC free article] [PubMed] [Google Scholar]
- 18.Bei B, Wiley JF, Trinder J, Manber R. Beyond the mean: A systematic review on the correlates of daily intraindividual variability of sleep/wake patterns. Sleep Med Rev. 2016;28:108–124. [DOI] [PubMed] [Google Scholar]
- 19.Chaput JP, Dutil C, Featherstone R, et al. Sleep timing, sleep consistency, and health in adults: a systematic review. Appl Physiol Nutr Metab. 2020;45(10 (Suppl. 2)): S232–s247. [DOI] [PubMed] [Google Scholar]
- 20.Czeisler CA, Dumont M, Duffy JF, et al. Association of sleep-wake habits in older people with changes in output of circadian pacemaker. Lancet. 1992;340(8825):933–936. [DOI] [PubMed] [Google Scholar]
- 21.Buysse DJ, Cheng Y, Germain A, et al. Night-to-night sleep variability in older adults with and without chronic insomnia. Sleep Med. 2010;11(1):56–64. [DOI] [PMC free article] [PubMed] [Google Scholar]
- 22.Lin CY, Lai TF, Huang WC, et al. Sleep duration and timing are nonlinearly associated with depressive symptoms among older adults. Sleep Med. 2021;81:93–97. [DOI] [PubMed] [Google Scholar]
- 23.Furihata R, Hall MH, Stone KL, et al. An aggregate measure of sleep health is associated with prevalent and incident clinically significant depression symptoms among community-dwelling older women. Sleep. 2017;40(3). zsw075. [DOI] [PMC free article] [PubMed] [Google Scholar]
- 24.Pye J, Phillips AJ, Cain SW, et al. Irregular sleep-wake patterns in older adults with current or remitted depression. J Affect Disord. 2020;281:431–437. [DOI] [PubMed] [Google Scholar]
- 25.Bowman MA, Brindle RC, Joffe H, et al. Multidimensional sleep health is not crosssectionally or longitudinally associated with adiposity in the Study of Women’s Health Across the Nation (SWAN). Sleep Health. 2020;6(6):790–796. [DOI] [PubMed] [Google Scholar]
- 26.Bowman MA, Kline CE, Buysse DJ, et al. Longitudinal association between depressive symptoms and multidimensional sleep health: the SWAN Sleep Study. Ann Behav Med. 2021;55(7):641–652. [DOI] [PMC free article] [PubMed] [Google Scholar]
- 27.Roenneberg T, Kuehnle T, Juda M, et al. Epidemiology of the human circadian clock. Sleep Med Rev. 2007;11(6):429–438. [DOI] [PubMed] [Google Scholar]
- 28.Natale V, Adan A, Fabbri M. Season of birth, gender, and social-cultural effects on sleep timing preferences in humans. Sleep. 2009;32(3):423–426. [DOI] [PMC free article] [PubMed] [Google Scholar]
- 29.Lunsford-Avery JR, Engelhard MM, Navar AM, Kollins SH. Validation of the sleep regularity index in older adults and associations with cardiometabolic risk. Sci Rep. 2018;8(1):14158. [DOI] [PMC free article] [PubMed] [Google Scholar]
- 30.Van Den Berg JF, Van Rooij FJA, VOS H, et al. Disagreement between subjective and actigraphic measures of sleep duration in a population-based study of elderly persons*. J Sleep Res. 2008;17(3):295–302. [DOI] [PubMed] [Google Scholar]
- 31.Sowers M, Crawford S, Sternfeld B, et al. SWAN: a multicenter, multiethnic, community-based cohort study of women and the menopausal transition. In: Lobo R, Marcus R, Kelsey J, eds. Menopause: Biology and Pathobiology. San Diego, CA: Academic Press; 2000:175–188. [Google Scholar]
- 32.Matthews KA, Hall MH, Lee L, et al. Racial/ethnic disparities in women’s sleep duration, continuity, and quality, and their statistical mediators: Study of Women’s Health Across the Nation. Sleep. 2019;42(5):1–10. [DOI] [PMC free article] [PubMed] [Google Scholar]
- 33.Ancoli-Israel S, Martin JL, Blackwell T, et al. The SBSM Guide to Actigraphy Monitoring: Clinical and Research Applications. Behav Sleep Med. 2015;13 (Suppl 1):S4–S38. [DOI] [PubMed] [Google Scholar]
- 34.Wallace ML, Yu L, Buysse DJ, et al. Multidimensional sleep health domains in older men and women: an actigraphy factor analysis. Sleep. 2021;44(2):1–11. [DOI] [PMC free article] [PubMed] [Google Scholar]
- 35.Diener E, Emmons RA, Larsen RJ, Griffin S. The satisfaction with life scale. J Pers Assess. 1985;49(1):71–75. [DOI] [PubMed] [Google Scholar]
- 36.Watson D, Clark LA, Tellegen A. Development and validation of brief measures of positive and negative affect: the PANAS scales. J Pers Soc Psychol. 1988;54 (6):1063–1070. [DOI] [PubMed] [Google Scholar]
- 37.Ryff CD, Keyes CL. The structure of psychological well-being revisited. J Pers Soc Psychol. 1995;69(4):719–727. [DOI] [PubMed] [Google Scholar]
- 38.Radloff LS. The CES-D s self-report depression scale for research in the general population. Appl Psychol Measur. 1977;1:385–401. [Google Scholar]
- 39.Spitzer RL, Kroenke K, Williams JB, Löwe B. A brief measure for assessing generalized anxiety disorder: the GAD-7. Arch Intern Med. 2006;166(10):1092– 1097. [DOI] [PubMed] [Google Scholar]
- 40.Wild B, Eckl A, Herzog W, et al. Assessing generalized anxiety disorder in elderly people using the GAD-7 and GAD-2 scales: results of a validation study. Am J Geriatr Psychiatry. 2014;22(10):1029–1038. [DOI] [PubMed] [Google Scholar]
- 41.Hall MH, Matthews KA, Kravitz HM, et al. Race and financial strain are independent correlates of sleep in midlife women: the SWAN sleep study. Sleep. 2009;32(1):73–82. [PMC free article] [PubMed] [Google Scholar]
- 42.R Studio. Integrated Development for R [computer program]. Boston, MA: RStudio, Inc.; 2015. [Google Scholar]
- 43.Boulos MI, Jairam T, Kendzerska T, Im J, Mekhael A, Murray BJ. Normal polysomnography parameters in healthy adults: a systematic review and meta-analysis. Lancet Respir Med. 2019;7(6):533–543. [DOI] [PubMed] [Google Scholar]
- 44.Monk TH, Buysse DJ, Billy BD, et al. Circadian type and bed-timing regularity in 654 retired seniors: correlations with subjective sleep measures. Sleep. 2011;34 (2):235–239. [DOI] [PMC free article] [PubMed] [Google Scholar]
- 45.Paterson JL, Reynolds AC, Dawson D. Sleep schedule regularity is associated with sleep duration in older australian adults: implications for improving the sleep health and wellbeing of our aging population. Clin Gerontol. 2018;41 (2):113–122. [DOI] [PubMed] [Google Scholar]
- 46.Zak RS, Zitser J, Jones HJ, Gilliss CL, Lee KA. Sleep self-report and actigraphy measures in healthy midlife women: validity of the Pittsburgh Sleep Quality Index. J Womens Health (Larchmt). 2022;31(7):965–973. [DOI] [PMC free article] [PubMed] [Google Scholar]
- 47.Kantermann T, Juda M, Merrow M, Roenneberg T. The human circadian clock’s seasonal adjustment is disrupted by daylight saving time. Curr Biol. 2007;17 (22):1996–2000. [DOI] [PubMed] [Google Scholar]
- 48.Walker WH, Walton JC, DeVries AC, Nelson RJ. Circadian rhythm disruption and mental health. Transl Psychiatry. 2020;10(1):28. [DOI] [PMC free article] [PubMed] [Google Scholar]
- 49.Combs D, Hsu CH, Bailey O, et al. Differences in sleep timing and related effects between African Americans and non-Hispanic Whites. J Clin Sleep Med. 2021;17 (5):897–908. [DOI] [PMC free article] [PubMed] [Google Scholar]
- 50.Lehrer HM, Yao Z, Krafty RT, et al. Comparing polysomnography, actigraphy, and sleep diary in the home environment: the Study of Women’s Health Across the Nation Sleep Study. SLEEP Adv. 2022;3(1):1–12. [DOI] [PMC free article] [PubMed] [Google Scholar]