

Abstract
Extracellular vesicle (EV) secretion rate is stimulated by hypoxia that causes increased reactive oxygen species (ROS) production by the mitochondrial electron transport chain (ETC) and hypoxia‐induced factor (HIF)‐1 signaling; however, their contribution to the increased EV secretion rate is unknown. We found that the EV marker secretion rate in our EV reporter cell line CD9truc‐EGFP was unaffected by the HIF‐1α stabilizer roxadustat; yet, ETC stimulation by dichloroacetic acid (DCA) significantly increased EV secretion. The DCA‐induced EV secretion was blocked by the antioxidant TEMPO and rotenone, an inhibitor of the ETC's Complex I. Under hypoxic conditions, the limited oxygen reduction impedes the ETC's Complex III. To mimic this, we inhibited Complex III with antimycin A, which increased ROS‐dependent EV secretion. The electron transport between Complex I and III is accomplished by coenzyme Q created by the mevalonate pathway and tyrosine metabolites. Blocking an early step in the mevalonate pathway using pitavastatin augmented the DCA‐induced EV secretion, and 4‐nitrobenzoate—an inhibitor of the condensation of the mevalonate pathway with tyrosine metabolites—increased ROS‐dependent EV secretion. Our findings indicate that hypoxia‐mimetics targeting the ETC modify EV secretion and that ROS produced by the ETC is a potent stimulus for EV secretion.
Keywords: cancer, electron transport chain, exercise, hypoxia, kidney, late endosome, multivesicular body
The mitochondrial electron transport chain (ETC) creates reactive oxygen species (ROS), and mitochondrial ROS production is affected by cellular metabolism. Here, we used pharmacological interventions on cultured cells to show that high ETC activity increases EV secretion through a ROS‐dependent mechanism. Together, our data indicate that cellular metabolism is linked to EV secretion.

1. INTRODUCTION
Extracellular vesicle (EV) secretion rate is strongly stimulated by hypoxia, 1 , 2 , 3 , 4 , 5 , 6 and hypoxic niches can exist under various pathophysiological states such as chronic kidney disease and cancer or at physiological conditions as in the healthy intestine or kidney medulla. 7 , 8 , 9 A wide range of molecules, such as protein and RNA, 10 are loaded into EVs and released into all biological fluids, 11 where they may regulate physiological processes, such as metabolism, 12 and be used as easily accessible non‐invasive biomarkers of disease processes. 13 , 14 , 15 , 16 , 17 , 18 Cell type‐specific EV secretion rate is, however, highly variable 19 and to fully exploit EVs and gain insight into their physiological and pathophysiological regulatory mechanisms, we need a better biological understanding of the cellular mechanisms controlling EV secretion.
In mammalian cells, low oxygen conditions not only limit the electron flow in the mitochondrial electron transport chain (ETC) and creates mitochondrial‐derived reactive oxygen species (ROS) but also stabilize hypoxia‐inducible factor (HIF)‐1, a heterodimeric transcription factor consisting of an α‐subunit and a β‐subunit signaling, through inhibition of oxygen‐dependent degradation of HIF‐1α. 20 Hypoxia activated HIF‐1α signaling and enhanced EV secretion in HEK293 cells, and depletion of HIF‐1α, but not HIF‐2α, significantly reduced EV release. 4 Under normoxic conditions, however, expressing oxygen‐insensitive HIF‐1α or IOX2—a pharmacological HIF‐1α stabilizer—did not increase EV secretion. 4 HIF‐1α signaling is also affected by ROS. 21 , 22 ROS is mainly produced in the mitochondria through electrons leaking out of the ETC's Complex I and III. 23 Interestingly, we have recently shown that human blood cells estimated EV secretion rates are strongly correlated with Complex I activity. 19 Although molecular oxygen is a terminal electron acceptor through reduction to metabolic water, 24 the ETC can maintain mitochondrial functions under limiting oxygen availability by using fumarate as a terminal electron acceptor. 25 This requires high levels of ubiquinol—the reduced form of the electron carrier coenzyme Q—and increases the production of mitochondrial ROS. 26 Indeed, inhibition of oxygen reduction by the Complex III inhibitor antimycin increases EV secretion from cultured mature adipocytes. 27 Thus, mitochondrial‐derived ROS is created under normoxic and hypoxic conditions and may affect EV secretion. However, to what extent mitochondrial‐derived ROS contribute to EV secretion is unknown.
This study used targeted pharmacological interventions on our epithelial CD9truc‐EGFP reporter cell line secreting green fluorescent protein (EGFP)‐tagged EVs 28 to test the hypothesis that the mitochondrial ETC increases EV secretion by ROS.
2. METHODS
2.1. EV track data
All relevant data from our experiments are submitted to the EV‐TRACK knowledgebase (EV‐TRACK ID: EV230063). 29
2.2. Cell culturing and pharmacological interventions
The M1 cells with stable CD9truc‐EGFP expression were cultured as described previously. 28 Cells were maintained in Dulbecco's Modified Eagle Medium, F‐12 Nutrient Mixture (Gibco, Sigma Aldrich) with 10% fetal bovine serum (FBS, Fisher Scientific) and 1% Penicillin–Streptomycin at 37°C in a 5% CO2 humidified incubator. For all cell‐conditioned medium analyses, the culture medium was changed to PC1 serum‐free medium (Lonza, No. 344018). CoCl2 (Sigma Aldrich), Roxadustat (Astatech), DCA (Sigma Aldrich), 4‐Hydroxy‐TEMPO (Sigma Aldrich) and 4‐nitrobenzoate (Sigma Aldrich) was dissolved in PC1‐serum‐free medium and added to a final concentration of 100 μM, 30 μM, 30 mM, 2 mM, and 2 mM, respectively. Pitavastatin (Santa Cruz) and Rotenone (Sigma Aldrich) were dissolved in dimethyl sulfoxide and added to a final concentration of 5 μM and 10 μM, respectively, and antimycin A (Sigma Aldrich) was dissolved in 99% ethanol and added to a final concentration of 1 μM. Dissolved drugs were added when cells reached 60–80% confluence in 6‐well plates, and cells and medium were harvested after 24 h incubation.
2.3. EV isolation and cell lysis
The cell‐conditioned medium was harvested on ice and immediately supplemented with protease inhibitor cocktail (Sigma Aldrich). The cell‐conditioned medium was centrifugated at 4°C for 10 min at 5000 ×g. The supernatant was transferred to low‐binding Minisorp Nunc‐Immuno tubes and mixed with freshly made ExtraPEG 30 (16% PEG‐6000, Sigma Aldrich, 1 M NaCl, Milli‐Q water). Following rotation overnight incubation at 4°C, the medium was centrifugated at 4°C for 15 min at 5000 ×g. The EV‐pellet was resuspended in RIPA lysis buffer and stored at −80°C until analyzed by western blotting. Cells were lysed with RIPA Lysis buffer with protease inhibitor cocktail (Sigma Aldrich) and incubated for 1 h at 4°C. Insoluble material was removed by centrifugated at 13.000 ×g for 10 min at 4°C. Cellular protein concentration was measured using the Bio‐Rad DC Protein Assay (BIO‐RAD) according to the manufacturer's instructions.
2.4. Immunoblotting
Samples were mixed with sample reducing agent (Invitrogen, Thermo Fischer Scientific) and LDS sample buffer (Invitrogen, Thermo Fischer Scientific) and heated to 95°C for 10 min before separation by SDS‐polyacrylamide gel electrophoresis (BIO‐RAD). Proteins were then transferred to a PVDF membrane (Merck) and activated in 99% Ethanol. After blotting, the membrane was blocked for 30 min in 5% skimmed milk (Merck) and incubated at 4°C overnight with primary antibody (Table 1). The membrane was washed in Tris‐Buffered saline with Tween‐20 (TBST, 20 mM Tris‐Base, 137 mM NaCl, 0.05% Tween‐20 [Merck], pH 7.6) and incubated for 1 h at room temperature with secondary antibody (Table 1). Membranes were developed with ECL plus and imaged by a Molecular Imager (ChemiDoc XRS +, BIO‐RAD) using Image Lab software (BIO‐RAD). The EV band densities were normalized to cellular protein concentration used as an estimate of cell abundance.
TABLE 1.
Primary and secondary antibodies used for western blotting.
| Target protein | Company | Catalog # | Dilution |
|---|---|---|---|
| Primary antibodies | |||
| HIF‐1α | Cell Signaling Technology, Leiden, NL | 14179S | 1:1000 |
| GFP | Nordic BioSite, Täby, SE | GTX113617 | 1:1000 |
| Caspase‐3 | Cell Signaling Technology, Leiden, NL | 9662S | 1:1000 |
| ALIX | Cell Signaling Technology, Leiden, NL | 2171 | 1:1000 |
| TSG‐101 | Abcam, Cambridge, UK | Ab30871 | 1:1000 |
| Flotilin | Abcam, Cambridge, UK | Ab13493 | 1:1000 |
| PDH‐1α | Abcam, Cambridge, UK | Ab110330 | 1:5000 |
| PDH‐1α‐S293 | Merck, Søborg, DK | Ab177461 | 1:1000 |
| PDH‐1α‐S300 | Merck, Søborg, DK | Ab1064 | 1:1000 |
| Actin | Abcam, Cambridge, UK | Ab8227 | 1:10000 |
| Secondary antibodies | |||
| Polyclonal Goat Anti‐Mouse immunoglobulins/HRP | DAKO, Glostrup, DK | P447 | 1:2000 |
| Polyclonal Goat Anti‐Rabbit immunoglobulins/HRP | DAKO, Glostrup, DK | P448 | 1:2000 |
2.5. Particle size and concentration measurements
Particle sizes and concentrations in the cell‐conditioned medium were measured using ZetaView® Nanoparticle Tracking Analyzer PMX‐220 (Particle Metrix). All samples were diluted in freshly filtered 1× PBS to a final volume of 1 mL. The ideal dilution factor was found by aiming for 140–200 particles/frame. The EVs were measured using eight cell positions with the following capture settings: cell temperature: 23–25°C, sequence length: 30, frame rate (fps): 30, switch frame: 10, video resolution: medium, laser wavelength (nm): 488, sensitivity: 90, shutter: 200, and following analysis settings: min size (nm): 1.0, max size (nm): 1000, trace length: 12, tracking radius: 3 px. All measurements were done in duplicates by injecting 100 μL fresh sample before the second measurement. The data were collected using the ZetaView software, PEX. The results are based on at least 700 valid particle tracks. Particle concentration from each cell‐conditioned medium sample was normalized to the corresponding cellular protein concentration.
2.6. CD9truc‐EGFP cell imaging and analysis
To study the effect of DCA on CD9truc‐EGFP, fluorescent microscopy imaging was performed on CD9truc‐EGFP cells in Dulbecco's Modified Eagle Medium, F‐12 Nutrient Mixture medium as previously described and seeded in 8‐well glass bottom Ibidi μ‐slides and incubated for 24 h, allowing for cells to adhere to the surface. Following incubation, the culturing medium was changed to PC‐1 medium (Lonza, No. 344018) without or with 30 mM DCA (Sigma Aldrich). The cells were then incubated for at least additional 24 h before imaging. Imaging of the cells was performed using a Nikon Ti2, Yokogawa CSU‐W1 spinning disc confocal microscope equipped with two high numerical aperture oil immersion objectives (60× and 100x) and a Photometrics Prime 95B sCMOS detector. A microscope enclosure ensured 37°C and 5% CO2 flow during the imaging. Z‐stack images were captured by exciting the EGFP using a 488 nm diode laser line and applying steps of 0.3 μm. The EGFP emission was detected through a 520/28 Brightline HC filter set. Mean intensities per cell were extracted using a custom Python 3 script on the sum projected cell Z‐stack images. Masks for each cell were acquired by implementing Cellpose 2.0 using the cyto2 model with the parameters 120 in diameter and −0.5 in mask threshold. 31 Tifffile, Pandas, and NumPy were used for image loading, data handling, and numerical operations, respectively. 32 , 33 , 34 Cells in the boundary of the field of view were removed from the extracted intensities. Fiji was used for editing image contrast.
2.7. CD9truc‐EGFP cell fluorescence using flow cytometry
Flow cytometry was used to measure fluorescence intensity in living single cells upon stimulation with different drugs. Cells were treated as described above. To prepare cells for flow cytometry, cells were treated with trypsin, washed twice in washing buffer (1× PBS + 0.05% Bovine serum albumin and 10 mM EDTA), and analyzed on an analytical and cell sorting flow cytometer (ARIAIII Becton Dickinson). FlowLogic 8.5 software was used to analyze cells.
2.8. Statistics
Statistical analyses were performed in GraphPad Prism version 9 (Graphpad Software Inc, USA). Experiments with more than two groups were analyzed using a one‐way ANOVA followed by Tukey's multiple comparisons tests. Experiments with two groups were analyzed using an unpaired t‐test. Data are presented as mean ± the standard error of the mean, n indicates the number of independent experiments, and p ≤ 0.05 was considered statistically significant.
3. RESULTS
3.1. Pharmacological HIF‐1α stabilization does not affect the EV marker release rate
To corroborate previous findings in HEK293 cells, 4 we used two other hypoxia‐mimetic agents—CoCl2 and Roxadustat to stabilize HIF‐1α protein expression in CD9truc‐EGFP cells by inhibiting prolyl hydroxylase domain (PHD, Figure 1A). CoCl2 and Roxadustat increased cellular HIF‐1α abundance, but, compared to control, CoCl2 caused increased cleavage of pro‐apoptic Caspase‐3 (Figure 1B). We did, therefore, not investigate EV markers in the PEG‐precipitated cell‐conditioned medium from CoCl2‐treated cells. Roxadustat did not cause Caspase‐3 cleavage, significant changes in cellular CD9truc‐EGFP protein expression (Figure 1C), or increased abundance of EV markers CD9truc‐EGFP, ALIX, TSG101, and Flotillin in PEG‐precipitated cell‐conditioned medium (Figure 1D,E). Thus, in agreement with previous findings, 4 HIF1α stabilization under normoxic conditions does not significantly affect EV‐marker secretion rate.
FIGURE 1.

Pharmacological HIF‐1α stabilization does not affect EV marker release rate. (A) Schematic illustration of how Roxadustat and COCl2 cause PHD inhibition and HIF‐1α stabilization. (B) Western blotting of CD9truc‐EGFP cell lysates from 100 μM CoCl2 treatment for 24 h increased cellular HIF‐1α and Caspase‐3 cleavage abundance in CD9truc‐EGFP cell lysates (n = 3). (C) Western blotting of CD9truc‐EGFP cell lysates showed that 30 μM Roxadustat treatment for 24 h increased cellular HIF‐1α abundance without Caspase‐3 cleavage (n = 6) in CD9truc‐EGFP cell lysates. (D) Western blotting on PEG‐precipitated cell‐condition medium from the 30 μM Roxadustat‐treated cells showed no significant difference to control‐treated CD9truc‐EGFP cells in EV marker CD9truc‐EGFP, TSG101, ALIX and Flotillin abundances (n = 3–9). (E) Quantification on EV markers from (D). An unpaired t‐test was used to compare groups. Full‐length blots and normalized cellular CD9truc‐EGFP abundance are shown in Figure S1A,B.
3.2. The ETC stimulator DCA increases EV secretion rates through ROS production
DCA is an orally available drug that accelerates the pyruvate flux into the mitochondria by inhibiting the pyruvate dehydrogenase kinases' (PDKs) inhibitory phosphorylation of pyruvate dehydrogenase (PDH), increasing acetyl CoA levels and electron deposition into the ETC via nicotinamide adenine dinucleotide hydrogen (NADH, Figure 2A). 35 Indeed, DCA reduced the inhibitory phosphorylations of PDH1α at serine residues 293 and 300 (Figure 2B), and neither treatment with DCA nor the antioxidant TEMPO caused Caspase‐3 cleavage (Figure 2B). Western blotting for cellular CD9truc‐EGFP and TSG101 showed no significant changes in abundance in DCA‐ and TEMPO‐treated cells (Figure 2B; Figure S2B). Still, spinning‐disc confocal microscopy and flow cytometry of living CD9truc‐EGFP cells revealed a higher CD9truc‐EGFP fluorescence intensity that was not sensitive to TEMPO (Figure 2C; Figure S2C and S3A). Strikingly, DCA treatment was associated with an increased size of the intracellular green fluorescent compartments (Figure 2C). Nanoparticle tracking analyses (NTA) were used to quantify EV secretion rates. The drug interventions did not affect EV size; however, the DCA treatment induced a significant ~twofold increase in EV concentration in the cell‐conditioned medium, blocked by co‐treatment with TEMPO (Figure 2D). The NTA results were corroborated by western blot analyses of the PEG‐precipitated cell‐conditioned medium, where the DCA increased cellular secretion rate of EV markers CD9truc‐EGFP and TSG101 was prevented by TEMPO (Figure 2E). Moreover, the Complex I inhibitor rotenone, which decreases electron deposition into the ETC through complex I inhibition (Figure 2F), abolished the DCA‐induced secretion of EV marker CD9truc‐EGFP (Figure 2G). Thus, the data are consistent with our hypothesis that increased electron deposition into the ETC augments EV secretion through the generation of ROS.
FIGURE 2.

ETC stimulator DCA increase EV secretion rates through ROS production. (A) Schematic illustration of how DCA inhibits PDK, prevents phosphorylation and inhibition of PDH, and increases acetyl CoA and NADH levels in the mitochondria. (B) Western blotting of CD9truc‐EGFP cell lysates showed no significant difference in PDH1α, CD9truc‐EGFP, TSG101, β‐Actin, and caspase‐3 cleavage abundances after 24 h of treatment with 30 mM DCA; however, PDH1α‐S293 and ‐S300 phosphorylation levels were decreased by DCA (n = 3–6), and cellular CD9truc‐EGFP and TSG101 expression were increased by 2 mM TEMPO. Full‐length blots and normalized CD9truc‐EGFP abundance are shown in Figure S2A,B. (C) Top, spinning disc confocal microscopy of living DCA‐treated CD9truc‐EGFP demonstrates increased green fluorescent intensities and diameter of fluorescent organelles (n = 2). Bottom, zoom area outlined in white box in top images. An unpaired t‐test was used to compare groups in Figure S2C. The scale bars are 50 μm. (D) NTA of cell‐conditioned medium showed increased particle concentration from DCA‐treated CD9truc‐EGFP cells, which TEMPO abolished. Drug intervention did not affect particle size (n = 3). Groups were compared with one‐way ANOVA followed by Tukey's multiple comparisons test. ***indicates p < 0.001 compared to the control. (E) Western blotting of PEG‐precipitated cell‐conditioned medium showed increased EV markers TSG101 (n = 3), and CD9truc‐EGFP (n = 6) abundances from DCA‐treated CD9truc‐EGFP treated cells. Full‐length blots are shown in Figure S2d. (F) Rotenone blocks electron deposition in the mitochondrial ETC by preventing ubiquinone reduction. (G) Western blotting of CD9truc‐EGFP abundance in PEG‐precipitated cell‐conditioned medium from CD9truc‐EGFP cells treated with 10 μM rotenone shows blockage of DCA‐induced EV marker secretion (n = 3). Full‐length blots and normalized cellular CD9truc‐EGFP and TSG101 abundance are shown in Figure S2e. **, *** and **** indicate p < 0.01, p < 0.001 and p < 0.0001.
3.3. Inhibition of oxygen reduction by Complex III inhibition increases ROS‐dependent EV secretion rates
When oxygen reduction is hampered by hypoxia, electrons delivered to the ETC by enzymes such as dihydroorotate dehydrogenase (DHODH) and succinate dehydrogenase (SDH) can reduce NAD+ by reversal of Complex I activity, known as reverse electron transfer, which produces mitochondrial ROS. 36 To mimic this, we inhibited the ETC's Complex III antimycin A 37 , 38 (Figure 3A). Antimycin A did not cause Caspase‐3 cleavage or significant changes in CD9truc‐EGFP abundance in cells (Figure 3B; Figure S4B). NTA analyses of cell‐conditioned medium showed a tendency toward higher EV concentration with antimycin A, which was not detected by co‐treatment with TEMPO (Figure 3C). Western blotting of PEG‐precipitated cell‐conditioned medium corroborated this observation and showed a significant increase EV markers CD9truc‐EGFP and TSG101 by antimycin A, which could be inhibited by TEMPO (Figure 3D). Together, this indicates that preventing oxygen reduction by Complex III blockage cause ROS‐dependent stimulation of EV secretion.
FIGURE 3.

Inhibition of oxygen reduction by Complex III inhibition increase ROS‐dependent EV secretion rates. (A) Antimycin A mimics hypoxia by inhibiting the ETC's Complex III, causing increased mitochondrial ROS by ubiquinol (QH2) oxidation blockage. (B) Western blotting of CD9truc‐EGFP cell lysates treated with 1 μM antimycin A for 24 h did not affect cellular CD9truc‐EGFP (n = 6) and Caspase‐3 cleavage abundance (n = 3). (C) NTA of cell‐conditioned medium showed non‐significant increased particle concentration and particle size from DCA‐treated cells (n = 3). A nonparametric Kruskal–Wallis test was performed between the control and treated groups. (D) Western blotting on PEG‐precipitated cell‐condition medium showed that EV markers TSG101 (n = 3) and CD9truc‐EGFP (n = 6) were increased by antimycin A. The significance level was determined by one‐way ANOVA followed by Tukey's multiple comparisons test. Full‐length blots and normalized cellular CD9truc‐EGFP abundance are shown in Figure S4A. *, **, and *** indicate p < 0.05, p < 0.01 and p < 0.001.
3.4. Pharmacological inhibiting coenzyme Q biosynthesis increases ROS‐dependent EV secretion rates
The reduction of oxygen to molecular water enables the oxidation of ubiquinol (QH2) to ubiquinone (Q), also known as coenzyme Q, created by condensation of the mevalonate pathway and tyrosine metabolites. 39 We first tested whether pitavastatin—an inhibitor of the rate‐limiting enzyme 3‐hydroxy‐3‐methyl‐glutaryl‐coenzyme A reductase (HMG‐CoA reductase) of the mevalonate pathway (Figure 4A)—affected EV secretion. In this experiment, we detected a low degree of cellular Caspase‐3 cleavage in all groups; however, there was no difference in cleavage levels between groups, and we, therefore, analyzed the effect of pitavastatin. Pitavastatin treatment did not affect cellular CD9truc‐EGFP expression (Figure 4B; Figure S5B). Pitavastatin treatment alone did not affect EV secretion rate or particle size (Figure 4C); however, pitavastatin augmented the EV secretion induced by DCA (Figure 4C). Supporting the increased EV secretion rate into the cell‐conditioned medium determined by NTA, CD9truc‐EGFP cells co‐treated with DCA and pitavastatin showed a significant increase in EV markers CD9truc‐EGFP and TSG101 in PEG‐precipitated cell‐conditioned medium (Figure 4D). With flow cytometry, CD9truc‐EGFP fluorescence was significantly increased in cells co‐treated with DCA and pitavastatin (Figure S3A). By inhibiting the mevalonate pathway with pitavastatin, we intervene with coenzyme Q biosynthesis and other highly relevant EV components, such as the prenylation of Rab proteins essential for multivesicular body docking and fusion. 40 , 41 Thus, decreased Rab prenylation could mask the potential stimulatory effects of coenzyme Q inhibition on EV secretion. We, therefore, used 4‐nitrobenzoate (4‐NBA) to inhibit the condensation of mevalonate and tyrosine metabolite by 4‐Hydroxybenzoate polyprenyl transferase (COQ2) (Figure 5A). 42 , 43 Cellular CD9truc‐EGFP abundance was unaffected by 4‐NBA, and no Caspase‐3 cleavage was observed (Figure 5B; Figure S6B). By flow cytometry, CD9truc‐EGFP fluorescence intensity was increased in 4‐NBA‐treated cells. The increased fluorescence was not normalized by TEMPO (Figure S3A), but 4‐NBA caused a ~twofold TEMPO‐sensitive increase in EV markers CD9truc‐EGFP and TSG101 in PEG‐precipitated cell‐conditioned medium. (Figure 5C). Supporting the TEMPO‐sensitive EV secretion found by western blotting, NTA on cell‐conditioned medium showed a similar TEMPO‐sensitive increase in EV secretion rates from 4‐NBA‐treated cells (Figure 5D). 4‐NBA treatment did not affect EV size. Together, these data indicate that pharmacological coenzyme Q biosynthesis inhibition causes an increased ROS‐dependent EV secretion.
FIGURE 4.
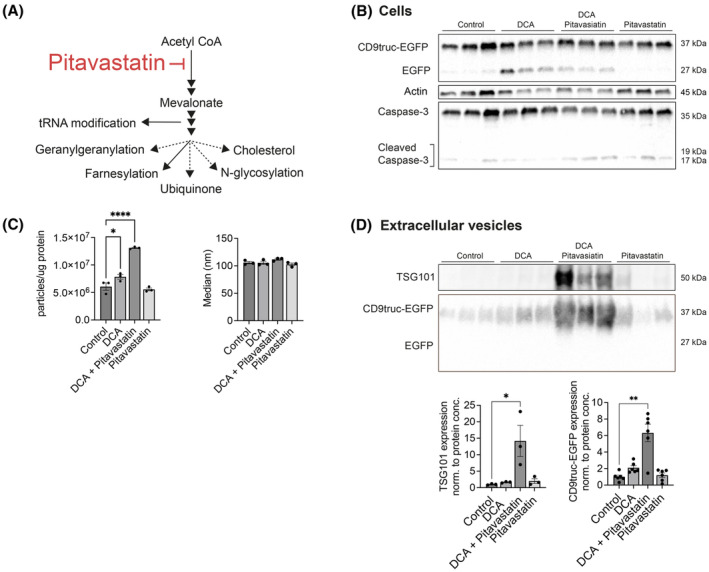
Pharmacological inhibiting of the mevalonate pathway potentiates EV secretion in DCA‐treated cells. (A) Pitavastatin inhibits mevalonate synthesis and affects multiple downstream metabolic pathways. (B) Western blotting of CD9truc‐EGFP cell lysates for CD9truc‐EGFP (n = 6) and Caspase‐3 cleavage (n = 3) showed that abundances were unaffected by 24‐h treatment with 30 mM DCA and 5 μM pitavastatin compared to control. Full‐length blots and normalized cellular CD9truc‐EGFP abundance are shown in Figure S5A,B. (C) NTA of cell‐conditioned medium showed increased particle concentration, but not particle size, from DCA and pitavastatin‐treated CD9truc‐EGFP cells (n = 3). (D) Western blotting of EV markers TSG101 (n = 3) and CD9truc‐EGFP in PEG‐precipitated cell‐conditioned medium (n = 6) shows increased abundances in DCA and pitavastatin‐treated cells. The significance level was determined by one‐way ANOVA followed by Tukey's multiple comparisons test. Full‐length blots are shown in Figure S5C. The significance level was determined by one‐way ANOVA followed by Tukey's multiple comparisons test. *, **, and **** indicate p < 0.05, p < 0.01 and p < 0.0001.
FIGURE 5.

Pharmacological inhibiting coenzyme Q biosynthesis increases ROS‐dependent EV secretion rates. (A) COQ2 inhibition with 4‐nitrobenzoate (4‐NBA) abolishes tyrosine metabolites condensation of the mevalonate pathway and decrease coenzyme Q (ubiquinone) biosynthesis. (B) Western blotting of CD9truc‐EGFP cell lysates showed that cellular CD9truc‐EGFP (n = 6) and Caspase‐3 (n = 3) abundances after 24 h‐treatment with 2 mM 4‐NBA were not different from control‐treated cells. Full‐length blots and normalized CD9truc‐EGFP abundance are shown in Figure S6A,B. (C) Western blotting on PEG‐precipitated cell‐conditioned medium showed that 4‐NBA treatment increased TSG101 and CD9truc‐EGFP abundances in the cell‐conditioned medium. The significance level was determined by one‐way ANOVA followed by Tukey's multiple comparisons test. (n = 6). Full‐length blots and normalized CD9truc‐EGFP abundance are shown in Figure S6A,C. (D) NTA of cell‐conditioned medium demonstrated increased TEMPO‐sensitive particle concentration by 4‐NBA treatment. 4‐NBA and TEMPO did not affect particle size. (E) Model for mitochondrial‐produced ROS (red) by the ETC that was pharmacologically modified in this study, and its effect on EV secretion rate. Broken lines indicate still unknown molecular targets. * and **** indicate p < 0.05 and p < 0.0001.
4. DISCUSSION
We used hypoxia‐mimetics to investigate how a restricted oxygen supply can increase EV secretion rates. Similar to previous studies, 4 we found that stabilization of HIF‐1α during normoxia did not cause significant changes in EV secretion rates. However, pharmacological interventions that increase ROS production by the mitochondrial ETC were associated with higher EV secretion rates. Corroborating that ROS is involved, we found that the antioxidant TEMPO normalized the drug‐induced EV secretion rates. Although HIF‐1 signaling can modify EV secretion under hypoxic conditions, 4 our data suggest that the ETC's production of ROS is a potent stimulator of EV secretion also during normoxia. While this does not rule out other mechanisms for stimulation of EV secretion, our data provide a foundation to understand the large variability in EV secretion rates between cell types, 19 , 44 , 45 , 46 and the in vitro and in vivo evidence for the association between cellular metabolic and EV secretion rates. 46 , 47 , 48 Moreover, our study adds new candidates to the list of pharmacological targets 49 for modification of EV secretion, enabling a deeper understanding of EV biology.
Similar to our previous finding, 50 we observed that EV protein level does not reliably reflect cellular protein abundance in that cellular EV secretion rates can be dynamically modified by the local milieu and metabolic state. This also indicates that the cell‐specific EV abundance is not directly correlated to cell abundance and suggests that, for example, EV‐associated biomarkers should be interpreted with care in that there appears to be an extensive dynamic range for cellular EV secretion rate even for the same cell type.
Our data suggest that metabolic ROS influences the cellular EV secretion rate under physiological and pathophysiological conditions. This is consistent with the observations that diseases, such as cancer and arteriosclerosis, characterized by high cellular ROS levels, 51 , 52 display high circulating EV levels. 53 , 54 Moreover, genetically modified mice with augmented mitochondrial ROS production in adipocytes have elevated adipocyte‐derived EV serum levels. 27 Mitochondria release ROS into the mitochondrial matrix and intermembrane space, 23 and whether the EV stimulatory effect of mitochondrial ROS is sensitive to the topology of ROS release remains to be determined by, for example, measuring the EV secretion in response to selective increased ROS production in the mitochondrial matrix or intermembrane space. We cannot exclude that other ROS sources may also trigger EV secretion; however, our data and others indicate that mitochondria‐derived ROS can drive EV secretion.
Metabolic ROS impacts several critical cellular pathways, 7 but how increased ROS activates EV secretion is unknown. By spinning disc confocal microscopy and flow cytometry, we noticed a brighter cellular EGFP fluorescence in cells treated with DCA and 4‐NBA, while the cellular CD9truc‐EGFP levels were unaffected, and co‐treatment with TEMPO only partially prevented this fluorescence rise. The CD9truc‐EGFP fluorescence likely originates from the multivesicular bodies (late endosomes) with a normal pH of 5.5. 55 The pKa of EGFP is 5.65, 56 suggesting that small changes in MVB pH could cause significant fluorescence changes. Thus, MVB pH regulation may explain some of the DCA‐induced increase in EV secretion rate. Indeed, more alkaline pH values in MVB are associated with higher EV secretion, 57 and Bafilomycin A1—a V‐ATPase inhibitor—is a potent stimulator of EV secretion. 58 Nonetheless, the mechanistic link between mitochondrial ROS and EV secretion remains to be identified.
Interestingly, we observed that the statin pitavastatin potentiated the EV secretory effect of DCA, while others have found that the other statins simvastatin and atorvastatin inhibited EV secretion. 59 , 60 The clinical impact of statins is related to their cholesterol‐lowering effect by HMG CoA inhibition. 61 HMG‐CoA is the rate‐limiting step early in the mevalonate pathway, and HMG‐CoA inhibition has broad effects, including modulation of tRNA modifications, protein N‐glycosylation, protein geranylgeranylation, protein farnesylation, and ubiquinone biosynthesis. 61 , 62 Although statins reduce Rab11 geranylgeranylation, 63 which could be involved in EV secretion, 64 our data imply that the overall effect of statins on EV secretion may depend on the cell's metabolic profile. Thus, we only observed an effect of pitavastatin on the EV secretion rate in DCA‐treated CD9truc‐EGFP cells. While pharmacodynamic differences could also cause the differences in the effects of the statins, we found that more selective coenzyme Q biosynthesis inhibition induced EV secretion, supporting the metabolic influence of statin‐sensitive EV secretion.
A limitation of our study is that our analyses did not allow for discrimination between large and small‐sized EVs but instead analyzed EVs in bulk. It is, therefore, important to stress that we cannot rule out the possibility that the secretion of sub‐types of EVs is stimulated by other means. This is particularly important for the potential role of EVs as mediators of cell–cell communication in that it would allow for metabolic‐independent signaling. With continuous EV analysis improvements and technological developments, this will be an important area for future research.
In summary, we have used pharmacological intervention to identify that ROS derived from the mitochondrial ETC (Figure 5E) controls EV secretion rates in cultured cells. Although EV secretion is a highly conserved cellular mechanism, 65 our interventions mimicking hypoxic conditions indicate that a combination of mitochondrial health and the cellular environment are essential determinants of EV secretion rate. The results enable a better interpretation of EV data and a foundation for a deeper understanding of the highly diverse EV secretion rates among cell types. Moreover, our study identifies molecular targets for modifying EV secretion, which can be used to gain further insight into EV biology.
AUTHOR CONTRIBUTIONS
Study conception and design: Mikkel Ø. Nørgård and Per Svenningsen. Acquisition of data: Mikkel Ø. Nørgård, Philip M. Lund and Nazmie Kalisi Analysis and interpretation of data: Mikkel Ø. Nørgård, Per Svenningsen, Philip M. Lund and Jannik B. Larsen. Manuscript draft: Mikkel Ø. Nørgård and Per Svenningsen. Revising of manuscript: Mikkel Ø. Nørgård, Per Svenningsen, Philip M. Lund, Nazmie Kalisi, Thomas L. Andresen, Jannik B. Larsen and Stefan Vogel.
FUNDING INFORMATION
AP Møller Foundation, Grant/Award Number: 20‐L‐0112. Nyreforeningen, Novo Nordisk Foundation, Grant/Award Numbers: #NF16OC0022166, #NFF19OC0058222, #NNF20OC0063791 and #NF21OC0071957.
CONFLICT OF INTEREST STATEMENT
None.
Supporting information
Figure S1.
Figure S2.
Figure S3.
Figure S4.
Figure S5.
Figure S6.
ACKNOWLEDGMENTS
Mohamed A. Ahmed is thanked for his excellent technical assistance.
Nørgård MØ, Lund PM, Kalisi N, et al. Mitochondrial reactive oxygen species modify extracellular vesicles secretion rate. FASEB BioAdvances. 2023;5:355‐366. doi: 10.1096/fba.2023-00053
DATA AVAILABILITY STATEMENT
The datasets generated during the current study are available from the corresponding author on reasonable request.
REFERENCES
- 1. Mleczko J, Ortega FJ, Falcon‐Perez JM, Wabitsch M, Fernandez‐Real JM, Mora S. Extracellular vesicles from hypoxic adipocytes and obese subjects reduce insulin‐stimulated glucose uptake. Mol Nutr Food Res. 2018;62:1700917. [DOI] [PMC free article] [PubMed] [Google Scholar]
- 2. Sano S, Izumi Y, Yamaguchi T, et al. Lipid synthesis is promoted by hypoxic adipocyte‐derived exosomes in 3T3‐L1 cells. Biochem Biophys Res Commun. 2014;445:327‐333. [DOI] [PubMed] [Google Scholar]
- 3. Gonzalez‐King H, García NA, Ontoria‐Oviedo I, Ciria M, Montero JA, Sepúlveda P. Hypoxia inducible factor‐1α potentiates jagged 1‐mediated angiogenesis by mesenchymal stem cell‐derived exosomes. Stem Cells. 2017;35:1747‐1759. [DOI] [PubMed] [Google Scholar]
- 4. Muñiz‐García A, Romero M, Falcόn‐Perez JM, Murray P, Zorzano A, Mora S. Hypoxia‐induced HIF1α activation regulates small extracellular vesicle release in human embryonic kidney cells. Sci Rep. 2022;12:1‐14. [DOI] [PMC free article] [PubMed] [Google Scholar]
- 5. Wang T, Gilkes DM, Takano N, et al. Hypoxia‐inducible factors and RAB22A mediate formation of microvesicles that stimulate breast cancer invasion and metastasis. Proc Natl Acad Sci U S A. 2014;111:E3234‐E3242. [DOI] [PMC free article] [PubMed] [Google Scholar]
- 6. Zonneveld MI, Keulers TGH, Rouschop KMA. Extracellular vesicles as transmitters of hypoxia tolerance in solid cancers. Cancers. 2019;11:154. [DOI] [PMC free article] [PubMed] [Google Scholar]
- 7. Keeley TP, Mann GE. Defining physiological normoxia for improved translation of cell physiology to animal models and humans. Physiol Rev. 2019;99:161‐234. [DOI] [PubMed] [Google Scholar]
- 8. Zheng L, Kelly CJ, Colgan SP. Physiologic hypoxia and oxygen homeostasis in the healthy intestine. A review in the theme: cellular responses to hypoxia. Am J Physiol ‐ Cell Physiol. 2015;309:C350‐C360. [DOI] [PMC free article] [PubMed] [Google Scholar]
- 9. Evans RG, Smith DW, Lee CJ, Ngo JP, Gardiner BS. What makes the kidney susceptible to hypoxia? Anat Rec (Hoboken). 2020;303:2544‐2552. [DOI] [PubMed] [Google Scholar]
- 10. O'Brien K, Breyne K, Ughetto S, Laurent LC, Breakefield XO. RNA delivery by extracellular vesicles in mammalian cells and its applications. Nat Rev Mol Cell Biol. 2020;21:585‐606. [DOI] [PMC free article] [PubMed] [Google Scholar]
- 11. Yáñez‐Mó M, Siljander PR, Andreu Z, et al. Biological properties of extracellular vesicles and their physiological functions. J Extracell Vesicles. 2015;4:1‐60. [DOI] [PMC free article] [PubMed] [Google Scholar]
- 12. Marzan AL, Nedeva C, Mathivanan S. Extracellular vesicles in metabolism and metabolic diseases. Subcell Biochem. 2021;97:393‐410. [DOI] [PubMed] [Google Scholar]
- 13. Chiva‐Blanch G, Suades R, Crespo J, et al. CD3(+)/CD45(+) and SMA‐α(+) circulating microparticles are increased in individuals at high cardiovascular risk who will develop a major cardiovascular event. Int J Cardiol. 2016;208:147‐149. [DOI] [PubMed] [Google Scholar]
- 14. Chironi G, Simon A, Hugel B́́, et al. Circulating leukocyte‐derived microparticles predict subclinical atherosclerosis burden in asymptomatic subjects. Arterioscler Thromb Vasc Biol. 2006;26:2775‐2780. [DOI] [PubMed] [Google Scholar]
- 15. Koga H, Sugiyama S, Kugiyama K, et al. Elevated levels of remnant lipoproteins are associated with plasma platelet microparticles in patients with type‐2 diabetes mellitus without obstructive coronary artery disease. Eur Heart J. 2006;27:817‐823. [DOI] [PubMed] [Google Scholar]
- 16. Goichot B, Grunebaum L, Desprez D, et al. Circulating procoagulant microparticles in obesity. Diabetes Metab. 2006;32:82‐85. [DOI] [PubMed] [Google Scholar]
- 17. Trappenburg MC, van Schilfgaarde M, Frerichs FCP, et al. Chronic renal failure is accompanied by endothelial activation and a large increase in microparticle numbers with reduced procoagulant capacity. Nephrol Dial Transplant. 2012;27:1446‐1453. [DOI] [PubMed] [Google Scholar]
- 18. Carmona A, Agüera ML, Luna‐Ruiz C, et al. Markers of endothelial damage in patients with chronic kidney disease on hemodialysis. Am J Physiol Renal Physiol. 2017;312:F673‐F681. [DOI] [PubMed] [Google Scholar]
- 19. Auber M, Svenningsen P. An estimate of extracellular vesicle secretion rates of human blood cells. J Extracell Biol. 2022;1:e46. [DOI] [PMC free article] [PubMed] [Google Scholar]
- 20. Ziello JE, Jovin IS, Huang Y. Hypoxia‐inducible factor (HIF)‐1 regulatory pathway and its potential for therapeutic intervention in malignancy and ischemia. Yale J Biol Med. 2007;80:51‐60. [PMC free article] [PubMed] [Google Scholar]
- 21. Jung SN, Yang WK, Kim J, et al. Reactive oxygen species stabilize hypoxia‐inducible factor‐1 alpha protein and stimulate transcriptional activity via AMP‐activated protein kinase in DU145 human prostate cancer cells. Carcinogenesis. 2008;29:713‐721. [DOI] [PubMed] [Google Scholar]
- 22. Calvani M, Comito G, Giannoni E, Chiarugi P. Time‐dependent stabilization of hypoxia inducible factor‐1α by different intracellular sources of reactive oxygen species. PLoS One. 2012;7:e38388. [DOI] [PMC free article] [PubMed] [Google Scholar]
- 23. Snezhkina AV, Kudryavtseva AV, Kardymon OL, et al. ROS generation and antioxidant defense systems in normal and malignant cells. Oxid Med Cell Longev. 2019;2019:6175804. [DOI] [PMC free article] [PubMed] [Google Scholar]
- 24. Marchetti P, Fovez Q, Germain N, Khamari R, Kluza J. Mitochondrial spare respiratory capacity: mechanisms, regulation, and significance in non‐transformed and cancer cells. FASEB J. 2020;34:13106‐13124. [DOI] [PubMed] [Google Scholar]
- 25. Spinelli JB, Rosen PC, Sprenger HG, et al. Fumarate is a terminal electron acceptor in the mammalian electron transport chain. Science. 2021;374:1227‐1237. [DOI] [PMC free article] [PubMed] [Google Scholar]
- 26. Chen R, Lai UH, Zhu L, Singh A, Ahmed M, Forsyth NR. Reactive oxygen species formation in the brain at different oxygen levels: the role of hypoxia inducible factors. Front Cell Dev Biol. 2018;6:132. [DOI] [PMC free article] [PubMed] [Google Scholar]
- 27. Crewe C, Funcke JB, Li S, et al. Extracellular vesicle‐based interorgan transport of mitochondria from energetically stressed adipocytes. Cell Metab. 2021;33:1853‐1868.e11. [DOI] [PMC free article] [PubMed] [Google Scholar]
- 28. Nørgård MØ, Steffensen LB, Hansen DR, et al. A new transgene mouse model using an extravesicular EGFP tag enables affinity isolation of cell‐specific extracellular vesicles. Sci Rep. 2022;12:2021.07.05.451120. [DOI] [PMC free article] [PubMed] [Google Scholar]
- 29. EV‐TRACK Consortium , Van Deun J, Mestdagh P, et al. EV‐TRACK: transparent reporting and centralizing knowledge in extracellular vesicle research. Nat Methods. 2017;14:228‐232. [DOI] [PubMed] [Google Scholar]
- 30. Rider MA, Hurwitz SN, Meckes DG. ExtraPEG: a polyethylene glycol‐based method for enrichment of extracellular vesicles. Sci Reports. 2016;6:1‐14. [DOI] [PMC free article] [PubMed] [Google Scholar]
- 31. Stringer C, Wang T, Michaelos M, Pachitariu M. Cellpose: a generalist algorithm for cellular segmentation. Nat Methods. 2020;18:100‐106. [DOI] [PubMed] [Google Scholar]
- 32. Team T . pandas development. pandas‐dev/pandas: Pandas. 2022.
- 33. Harris CR, Millman KJ, van der Walt SJ, et al. Array programming with NumPy. Nat. 2020;585:357‐362. [DOI] [PMC free article] [PubMed] [Google Scholar]
- 34. Gohlke C. cgohlke/tifffile: v2022.5.4. 2022. doi: 10.5281/ZENODO.6795861 [DOI]
- 35. Michelakis ED, Webster L, Mackey JR. Dichloroacetate (DCA) as a potential metabolic‐targeting therapy for cancer. Br J Cancer. 2008;99:989‐994. [DOI] [PMC free article] [PubMed] [Google Scholar]
- 36. Robb EL, Hall AR, Prime TA, et al. Control of mitochondrial superoxide production by reverse electron transport at complex I. J Biol Chem. 2018;293:9869‐9879. [DOI] [PMC free article] [PubMed] [Google Scholar]
- 37. Barzegari A, Nouri M, Gueguen V, Saeedi N, Pavon‐Djavid G, Omidi Y. Mitochondria‐targeted antioxidant Mito‐TEMPO alleviate oxidative stress induced by antimycin a in human mesenchymal stem cells. J Cell Physiol. 2020;235:5628‐5636. [DOI] [PubMed] [Google Scholar]
- 38. Hytti M, Korhonen E, Hyttinen JMT, et al. Antimycin A‐induced mitochondrial damage causes human RPE cell death despite activation of autophagy. Oxid Med Cell Longev. 2019;2019:1‐12. [DOI] [PMC free article] [PubMed] [Google Scholar]
- 39. Turunen M, Olsson J, Dallner G. Metabolism and function of coenzyme Q. Biochim Biophys Acta ‐ Biomembr. 2004;1660:171‐199. [DOI] [PubMed] [Google Scholar]
- 40. Savina A, Fader CM, Damiani MT, Colombo MI. Rab11 promotes docking and fusion of multivesicular bodies in a calcium‐dependent manner. Traffic. 2005;6:131‐143. [DOI] [PubMed] [Google Scholar]
- 41. Zerial M, McBride H. Rab proteins as membrane organizers. Nat Rev Mol Cell Biol. 2001;2:107‐117. [DOI] [PubMed] [Google Scholar]
- 42. Forsman U, Sjöberg M, Turunen M, Sindelar PJ. 4‐Nitrobenzoate inhibits coenzyme Q biosynthesis in mammalian cell cultures. Nat Chem Biol. 2010;6:515‐517. [DOI] [PubMed] [Google Scholar]
- 43. Quinzii C, Naini A, Salviati L, et al. A mutation in para‐hydroxybenzoate‐polyprenyl transferase (COQ2) causes primary coenzyme Q10 deficiency. Am J Hum Genet. 2006;78:345‐349. [DOI] [PMC free article] [PubMed] [Google Scholar]
- 44. Chiu YJ, Cai W, Shih YRV, Lian I, Lo YH. A single‐cell assay for time lapse studies of exosome secretion and cell behaviors. Small. 2016;12:3658‐3666. [DOI] [PMC free article] [PubMed] [Google Scholar]
- 45. Son KJ, Rahimian A, Shin DS, Siltanen C, Patel T, Revzin A. Microfluidic compartments with sensing microbeads for dynamic monitoring of cytokine and exosome release from single cells. Analyst. 2016;141:679‐688. [DOI] [PubMed] [Google Scholar]
- 46. Garcia‐Martin R, Brandao BB, Thomou T, Altindis E, Kahn CR. Tissue differences in the exosomal/small extracellular vesicle proteome and their potential as indicators of altered tissue metabolism. Cell Rep. 2022;38:110277. [DOI] [PMC free article] [PubMed] [Google Scholar]
- 47. Brahmer A, Neuberger E, Esch‐Heisser L, et al. Platelets, endothelial cells and leukocytes contribute to the exercise‐triggered release of extracellular vesicles into the circulation. J Extracell Vesicles. 2019;8:1615820. [DOI] [PMC free article] [PubMed] [Google Scholar]
- 48. Koritzinsky EH, Street JM, Chari RR, et al. Circadian variation in the release of small extracellular vesicles can be normalized by vesicle number or TSG101. Am J Physiol ‐ Ren Physiol. 2019;317:F1098‐F1110. [DOI] [PMC free article] [PubMed] [Google Scholar]
- 49. Catalano M, O'Driscoll L. Inhibiting extracellular vesicles formation and release: a review of EV inhibitors. J Extracell Vesicles. 2020;9:1703244. [DOI] [PMC free article] [PubMed] [Google Scholar]
- 50. Sabaratnam R, Geertsen L, Skjødt K, et al. In human nephrectomy specimens, the kidney level of tubular transport proteins does not correlate with their abundance in urinary extracellular vesicles. Am J Physiol Renal Physiol. 2019;317:F560‐F571. [DOI] [PubMed] [Google Scholar]
- 51. Perillo B, di Donato M, Pezone A, et al. ROS in cancer therapy: the bright side of the moon. Exp Mol Med. 2020;52:192‐203. [DOI] [PMC free article] [PubMed] [Google Scholar]
- 52. Burtenshaw D, Kitching M, Redmond EM, Megson IL, Cahill PA. Reactive oxygen species (ROS), intimal thickening, and subclinical atherosclerotic disease. Front Cardiovasc Med. 2019;6:89. [DOI] [PMC free article] [PubMed] [Google Scholar]
- 53. Vitale SR, Helmijr JA, Gerritsen M, et al. Detection of tumor‐derived extracellular vesicles in plasma from patients with solid cancer. BMC Cancer. 2021;21:1‐17. [DOI] [PMC free article] [PubMed] [Google Scholar]
- 54. Koga H, Sugiyama S, Kugiyama K, et al. Elevated levels of VE‐cadherin‐positive endothelial microparticles in patients with type 2 diabetes mellitus and coronary artery disease. J Am Coll Cardiol. 2005;45:1622‐1630. [DOI] [PubMed] [Google Scholar]
- 55. Hu YB, Dammer EB, Ren RJ, Wang G. The endosomal‐lysosomal system: from acidification and cargo sorting to neurodegeneration. Transl Neurodegener. 2015;4:18. [DOI] [PMC free article] [PubMed] [Google Scholar]
- 56. Shimizu A, Shiratori I, Horii K, Waga I. Molecular evolution of versatile derivatives from a GFP‐like protein in the marine copepod Chiridius poppei. PLoS One. 2017;12:e0181186. [DOI] [PMC free article] [PubMed] [Google Scholar]
- 57. Choezom D, Gross JC. Neutral sphingomyelinase 2 controls exosome secretion by counteracting V‐ATPase‐mediated endosome acidification. J Cell Sci. 2022;135:jcs259324. [DOI] [PMC free article] [PubMed] [Google Scholar]
- 58. Edgar JR, Manna PT, Nishimura S, Banting G, Robinson MS. Tetherin is an exosomal tether. Elife. 2016;5:e17180. [DOI] [PMC free article] [PubMed] [Google Scholar]
- 59. Kulshreshtha A, Singh S, Ahmad M, et al. Simvastatin mediates inhibition of exosome synthesis, localization and secretion via multicomponent interventions. Sci Rep. 2019;9:1‐10. [DOI] [PMC free article] [PubMed] [Google Scholar]
- 60. Chen Y, Xu Y, Wang J, et al. Statins lower lipid synthesis but promote secretion of cholesterol‐enriched extracellular vesicles and particles. Front Oncol. 2022;12:1965. [DOI] [PMC free article] [PubMed] [Google Scholar]
- 61. Ramkumar S, Raghunath A, Raghunath S. Statin therapy: review of safety and potential side effects. Acta Cardiol Sin. 2016;32:631‐639. [DOI] [PMC free article] [PubMed] [Google Scholar]
- 62. Benko AL, Vaduva G, Martin NC, Hopper AK. Competition between a sterol biosynthetic enzyme and tRNA modification in addition to changes in the protein synthesis machinery causes altered nonsense suppression. Proc Natl Acad Sci U S A. 2000;97:61‐66. [DOI] [PMC free article] [PubMed] [Google Scholar]
- 63. Miettinen TP, Björklund M. Mevalonate pathway regulates cell size homeostasis and Proteostasis through autophagy. Cell Rep. 2015;13:2610‐2620. [DOI] [PMC free article] [PubMed] [Google Scholar]
- 64. Savina A, Vidal M, Colombo MI. The exosome pathway in K562 cells is regulated by Rab11. J Cell Sci. 2002;115:2505‐2515. [DOI] [PubMed] [Google Scholar]
- 65. Kalluri R, LeBleu VS. The biology, function, and biomedical applications of exosomes. Science. 2020;367:eaau697. [DOI] [PMC free article] [PubMed] [Google Scholar]
Associated Data
This section collects any data citations, data availability statements, or supplementary materials included in this article.
Supplementary Materials
Figure S1.
Figure S2.
Figure S3.
Figure S4.
Figure S5.
Figure S6.
Data Availability Statement
The datasets generated during the current study are available from the corresponding author on reasonable request.