


Keywords: DBA/2J, degeneration, gamma band oscillations, glaucoma, primary visual cortex (V1), retina, single-unit recording, tuning curve
Abstract
Glaucoma is a leading cause of irreversible blindness worldwide, and previous studies have shown that, in addition to affecting the eyes, it also causes abnormalities in the brain. However, it is not yet clear how the primary visual cortex (V1) is altered in glaucoma. This study used DBA/2J mice as a model for spontaneous secondary glaucoma. The aim of the study was to compare the electrophysiological and histomorphological characteristics of neurons in the V1 between 9-month-old DBA/2J mice and age-matched C57BL/6J mice. We conducted single-unit recordings in the V1 of light-anesthetized mice to measure the visually induced responses, including single-unit spiking and gamma band oscillations. The morphology of layer II/III neurons was determined by neuronal nuclear antigen staining and Nissl staining of brain tissue sections. Eighty-seven neurons from eight DBA/2J mice and eighty-one neurons from eight C57BL/6J mice were examined. Compared with the C57BL/6J group, V1 neurons in the DBA/2J group exhibited weaker visual tuning and impaired spatial summation. Moreover, fewer neurons were observed in the V1 of DBA/2J mice compared with C57BL/6J mice. These findings suggest that DBA/2J mice have fewer neurons in the V1 compared with C57BL/6J mice, and that these neurons have impaired visual tuning. Our findings provide a better understanding of the pathological changes that occur in V1 neuron function and morphology in the DBA/2J mouse model. This study might offer some innovative perspectives regarding the treatment of glaucoma.
Introduction
Glaucoma is currently the leading eye disease causing blindness worldwide, and is a serious threat to human health. Glaucoma is characterized by progressive degeneration of retinal ganglion cells (RGCs), accompanied by vision loss (Liu et al., 2022; Martinez et al., 2022). Intraocular pressure (IOP) is usually measured to diagnose glaucoma in the clinical setting because high IOP is a significant risk factor for the disease (Chen et al., 2015). Optic nerve depression and retinal nerve fiber layer thinning are observed in most patients with glaucoma (Smith et al., 2017). Previous studies have found significant abnormalities in the structure and function of the primary visual pathway and reorganization of the V1 in patients with glaucoma (Duncan et al., 2007; Hernowo et al., 2011; Murphy et al., 2016; Sujanthan et al., 2022). Hernowo et al. (2011) reported that subjects with glaucoma had reduced volumes of all structures along the visual pathway, including the optic nerves, optic chiasm, optic tracts, lateral geniculate nucleus (LGN), and optic radiations. Duncan et al. (2007) examined the retinotopic organization of the V1 in patients with glaucoma by taking fMRI measurements of cortical function with visual field loss and found that blood oxygenation level-dependent signaling in the V1 is reduced in patients with primary open-angle glaucoma compared with healthy controls, in a manner consistent with the loss of visual function. Pathological studies of glaucoma have also been carried out in a variety of animal models, mostly primates and transgenic mice. In an experimental primate model of unilateral glaucoma, degenerative changes were observed in multiple pathways in the LGN, and these changes correlated with change in IOP and severity of optic nerve damage. Changes in the visual cortex are related to ganglion cell loss (Yucel et al., 2003). A transgenic mouse model of glaucoma developed pigment dispersion, iris transillumination, iris atrophy, anterior synechiae, and elevated IOP with increasing age (Fiedorowicz et al., 2018). These changes were followed by retinal ganglion cell death, optic nerve atrophy, and optic nerve cupping, and the prevalence and severity of these lesions increased with age. Optic nerve atrophy and optic nerve cupping were present in the majority of aged mice (Fernandez-Sanchez et al., 2014).
The DBA/2J mouse line carries recessive mutations in genes encoding glycosylated protein nmb (Gpnmb; NCBI GeneID 93695) and tyrosinase-related protein 1 (Tyrp1; NCBI GeneID 22178). At the age of 3 to 6 months, DBA/2J mice develop iris atrophy and pigment deposition in the anterior segment, and at the age of 8 to 9 months, when IOPs peak in most mice, they develop blockage of ocular drainage structures, elevated IOP, optic nerve atrophy, and RGC degeneration (Nagaraju et al., 2007; Yang et al., 2010). Previous studies have primarily examined glaucoma-related pathology in the retina and LGN, while few animal studies have investigated the V1. Visual information flows from the retina to the LGN and then to the V1, where a more detailed visual feature response and spatio-temporal summation occur. This process includes orientation selectivity, spatial frequency tuning, temporal frequency tuning, and size tuning (Hubel and Wiesel, 1959; Tang et al., 2016). In addition, gamma band oscillations are observed in the local field potential, manifesting as narrow-band increases in power in the gamma frequency range, during the presentation of a visual stimulus (Gray and Singer, 1989; Castelo-Branco et al., 1998; Murty et al., 2018; Han et al., 2022; Hou et al., 2022). Gamma band oscillations in the V1 are thought to play a critical role in visual information processing, such as visual binding and contour integration (Gray et al., 1989; Singer and Gray, 1995). Previous studies (Yan et al., 2017; Fujishiro et al., 2022) have reported some glaucomatous abnormalities in the visual cortex, such as decreased activity of V1 neurons and reduced metabolic activity of cytochrome oxidase in V1 neurons (Crawford et al., 2001). However, few studies have reported the characteristics of neuronal activity and histomorphological changes in the V1 in animal models of glaucoma. At present, our knowledge of changes in the primary visual cortex in glaucoma models is incomplete. Moreover, many recent studies (Burnat et al., 2017; Masuda et al., 2021) found ophthalmic disease causes significant neural plasticity changes in the cerebral cortex, especially in the primary visual cortex. Thus, in this study, we examined neuron morphology and the neuronal response to visual stimulation in 9-month-old DBA/2J mice and age-matched C57BL/6J controls.
Methods
Animals, recordings, and visual stimulation
Data for this experiment were collected from 16 mice (male; Beijing Hfk Biosicence Co., Ltd., Beijing, China license [No. SCXK (jing) 2019-0008]; specific-pathogen-free (SPF) grade), with initial body weights of 20 to 25 g and initial ages of 8 weeks, including eight DBA/2J mice (Jackson Laboratory, Bar Harbor, ME, USA, MSR Cat# JAX:000671, RRID: IMSR_JAX:000671) (experimental group) and eight C57BL/6J mice (control group). All of the mice were naïve (not treated with any drugs) and were housed under conditions of constant temperature and humidity, with a 12/12-hour light/dark cycle, in the animal facility at Sichuan Provincial People’s Hospital (one mouse per cage). All experimental procedures adhering to the ARVO (Association for Research in Vision and Ophthalmology, Rockville, MD, USA) statement for the Use of Animals in Ophthalmic and Vision Research and were approved by the Animal Ethics Committee of the University of Electronic Science and Technology of China. Once a week from the ages of 6 to 9 months all mice were anesthetized by isoflurane inhalation (4–5%, RWD Life Sciences, Shenzhen, China) and restrained with an adjustable stent, and the IOP in both eyes was monitored using a rebound tonometer (iCare TonoLab, Helsinki, Finland).Three measurements were taken for each eye, and the average value was calculated. The study design is shown in Additional Figure 1 (309.2KB, tif) .
After the final IOP measurement was taken in 9-month-old mice, we tested the electrophysiological properties of their V1 neurons in response to moving sinusoidal grating. The surgical procedures were similar to those described in previous studies (Hou et al., 2022). The animals were anesthetized with gaseous anesthetic (4–5% isoflurane for induction, then 0.6–0.8% light isoflurane for maintenance; RWD Life Sciences). After a craniotomy was performed, a bone screw was fixed in the skull over the cerebellum, and a tungsten electrode (A-M Systems, Sequim, USA, Cat# 573400) was placed on the surface of V1, as the ground and recording electrodes, respectively. The V1 area was covered with 2% agar to prevent drying and to reduce the brain pulsation caused by breathing; then, a shield was used to attenuate environmental interference. The animal was maintained at 37°C using a warm pad, and an ocular solution (Mit 5% dexpanthenol eye ointment, Bepanthen, Germany) was regularly applied to ensure that the eyes remained moist throughout the procedure.
A model 1800 microelectrode amplifier (A-M Systems) was used for the recordings. Tungsten electrodes were used to record single units of activity in the anesthetized mice (Figure 1A). As the microelectrode was advanced slowly using an oil hydraulic micromanipulator (MO-10, Narishige, Tokyo, Japan), various patterns of drifting sinusoidal grating were displayed in the animal’s visual field to activate the neurons. The raw neural signal (Figure 1B) was filtered at 0.1–5 kHz and then sampled at 40 kHz using an acquisition card (National Instrument, Austin, TX, USA). The single-unit spiking (500–5000 Hz) and local field potentials (20–90 Hz) were filtered out separately. Spikes were identified using an online window discriminator and time stamped with an accuracy of 1 ms using our data acquisition system. The single units were distinguished based on spike waveform and principal component analysis (Figure 1C). Only well-isolated cells satisfying strict criteria for single-unit recordings (fixed shape of action potential, absence of spikes during the absolute refractory period, maximum firing rate greater than 5 spikes/s) were collected for further analyses. Local field potentials were extracted by low-pass filtering of the raw signal below 90 Hz and subsequently downsampling to 1 kHz. The power spectra of the local field potentials were calculated under drifting sinusoidal grating stimulation (Figure 1D).
Figure 1.

Schematic of the visual single-unit recordings and data analysis.
(A) Grating stimulation was displayed on an LED monitor to measure the orientation selectivity, spatial frequency, temporal frequency, and size tuning of V1 neurons in anesthetized mice. (B) The raw neural signal was filtered at 0.1–5 kHz and sampled at 40 kHz. The single spike (500–5000 Hz) and gamma band oscillations (20–90 Hz) were filtered out and analyzed. (C) Principal component analysis of the dissociated waveforms in spike sorting. The superimposed average waveforms of dissociated spikes from single-unit recordings are also shown as black (right) and gray (left) dots. (D) The power spectrum was analyzed for the baseline gamma band activity and visually induced gamma band oscillations. All experiments were repeated three times. LFP: Local field potential; RF: receptive field.
To measure the response properties of the V1 single unit, stimuli consisting of various sinusoidal gratings were presented on a Philips monitor with gamma correction (screen size 79.2 cm × 59.4 cm, frame rate 70 Hz, resolution 1024 × 768 pixels) positioned 21.5 cm from the eyes of each animal. The contrast of the grating was 100%, and the mean luminance was 10 cd/m2. The left eye of the mouse was covered, and all measurements were performed during stimulation of the right eye. The orientation, spatial frequency, and temporal frequency of the sinusoidal grating were matched to the preferred parameters of the neuron under study, and real-time analyses of the responses using MATLAB (MathWorks, Naticks, MA, USA) were performed. Four different types of stimuli were used to compare neuronal responses, with the following specific parameters: orientation (0°, 30°, 60°, 90°, 120°, 150°, 180°, 210°, 240°, 270°, 300°, and 330°), temporal frequency (0.03, 0.06, 0.12, 0.25, 0.5, 1, 2, and 4 Hz), spatial frequency (0.03, 0.06, 0.12, 0.25, 0.5, 1, 2, and 4 cycles per degree), and size (0°, 11°, 25.4°, 33.9°, 45.4°, 56.4°, 67.8°, 79.3°, and 90.7°). Then, we located the center of the classical receptive field by placing a narrow sinusoidal grating patch at successive positions in a random sequence in the axes perpendicular or parallel to the optimal orientation of the neuron and measured the response to its drift. The center of the classical receptive field was defined as the peak of the response profiles for both axes. Once the receptive field center was established, we performed size tuning. Circular drifting sinusoidal grating patches of different diameters were used as the stimuli. The empirical size of the classical receptive field was defined as the stimulus diameter at which the size-tuning curve reached its peak value. A gray screen was displayed for 2 seconds after each time that a 2-second visual stimulus was presented to the mouse, and a stimulus at each diameter was randomly presented three to five times. To compare the visually induced gamma band oscillations, the stimulus was presented for 10 repetitions as follows: full-field standard drifting sinusoidal gratings (100% contrast, 0.04 cycles per degree, temporal frequency 2 Hz, 2 seconds per trial, interstimulus interval 2 seconds, gray blank with mean luminance).
Histology
Immediately after the electrophysiological recordings were taken, the anesthetized mice were sacrificed, and their brains were carefully removed. The isolated brain tissues were immediately fixed in 10% neutral buffered formalin solution (PH0996, Phygene Company, Fuzhou, China) for 48 hours, dehydrated in an ethanol solution, and incubated in 100% xylene (A27, Kelong, Chengdu, China). Then, the brain tissue was immersed in wax, embedded, and sectioned along the coronal plane (Slicing machine, HM 340E, Thermo Fisher Scientific, Waltham, MA, USA) using conventional methods. The sections were approximately 4 μm thick and were positioned at bregma –2.92 mm of the cortex region, as identified using a mouse brain slicing mold and mouse brain stereotaxic coordinates (Paxinos and Franklin, 2013).
For neuronal nuclear antigen (NeuN) staining, used to identify neurons, the tissue sections were processed in xylene and rehydrated by a descending gradient of ethanol solutions (absolute ethanol I for 5 minutes, absolute ethanol II for 5 minutes, 95% ethanol for 5 minutes, 85% ethanol for 5 minutes, 75% ethanol for 5 minutes). Then the slices were immersed in ethylenediaminetetraacetic acid buffer (pH 8.0), heated in a microwave, cooled to room temperature, and washed with PBS. To block nonspecific antigen labeling, the sections were treated with an autofluorescence quencher (G1221, Servicebio, Beijing, China) for 5 minutes, rinsed with running water for 10 minutes, and incubated in BSA for 30 minutes. The sections were then incubated with primary antibody (NeuN, rabbit polyclonal antibody, 1:100, Servicebio, Cat# GB11138, RRID: AB_2868432) in a humid chamber (M001, Mengnaiqi, Nantong, China) overnight at 4°C and washed three times with PBS before incubation with secondary antibody (Alexa FluorTM 594 donkey anti-rabbit IgG, 1:500, Invitrogen, Carlsbad, CA, USA, Cat# A21207, RRID: AB_141637) for 50 minutes at room temperature in the dark. Next, the sections were rinsed with PBS, and the nuclei were stained with 4′,6-diamidino-2-phenylindole (DAPI; 1:500, D9542-5MG, Sigma, St. Louis, MO, USA). The sections were rinsed again three times, and the coverslips were mounted on slides using anti-fluorescence quenching mounting medium. Images were obtained using a Nikon Eclipse C1 epifluorescence microscope (Nikon, Japan) and processed with Image-Pro Plus 6.0 software (Media Cybernetics, Silver Spring, MD, USA).
For Nissl staining, the paraffinized sections were dewaxed, rehydrated, and placed in 1% toluidine blue staining solution (G1436, Servicebio). Then, the sections were dehydrated in graded ethanol solutions (80% ethanol for 2 seconds, 95% ethanol for 1 minute, absolute ethanol I for 1 minute, absolute ethanol II for 1 minute), incubated in xylene for 20 minutes, and sealed on slides using neutral resin. All images were captured using an optical microscope (CX43, Olympus, Tokyo, Japan) and processed with Image-Pro Plus 6.0 software. All data were analyzed with custom-written MATLAB (MathWorks) scripts. Single-unit activity and gamma band oscillations were filtered from the raw data with 500–5 kHz and 20–90 Hz filters, respectively.
Tuning curve
The orientation selectivity index (OSI) is usually computed by dividing the firing rate of the neuron at the orthogonal orientation by the firing rate of the same neuron at the preferred orientation and subtracting the result from 1 (Crawford et al., 2001; Liao et al., 2004). However, we found that the orientation selectivity curves of most V1 neurons in anesthetized mice were not as good as those in cats and monkeys, and many cells did not show Gaussian nonlinear curves, which meant that the lowest responses for many cells were not observed at the orthogonal orientation. Thus, we used a revised formula (Equation 1) to characterize the OSI of neurons in the mouse V1. The closer the OSI is to 1, the stronger the orientation selectivity.

where Rmax is the maximum response, Rmin is the minimum response, and Rspon is the spontaneous activity in response to a uniformly bright stimulus.
The size-tuning curves for all recorded cells were fitted using a difference of Gaussians model (Chen et al., 2013a). The two Gaussians are considered to overlap concentrically, and the summation profile is represented as the difference between the two Gaussian integrals:

where R0 is the spontaneous firing rate, and each integral represents the relative contributions of putative excitatory and inhibitory components. The excitatory Gaussian is described by the gain (Ke) and a space constant a, and the inhibitory Gaussian is described by the gain (Ki) and a space constant b. The suppression index (SI) was calculated using Equation 3.

where Rmax is the maximum response and Rasy is the asymptotic response. Rspon is the spontaneous firing level when no visual stimuli are provided. When SI = 0, no suppression occurs, and the response either increases or plateaus. When SI = 1, the response is suppressed to the spontaneous firing level. The SI of most cells ranged from 0 to 1.
All values were optimized to provide the least mean square error for the data. All fitting procedures were conducted with the MATLAB optimization toolbox (MathWorks) using the CONSTR and FMINCON nonlinear least-squares functions. The goodness of fit of each model was established by calculating the mean fraction error using the following equation to evaluate how well our experimental data fit the model:

where theoryj and dataj are the expected response and the experimental response to the jth stimulus size, respectively. The error in fit found in the present study ranged from 0.003 to 0.17, with a mean error of 0.035 across the population.
Power spectrum estimation of gamma band oscillations
Previous studies have reported that visually induced gamma band oscillations in the V1 are greatest in layers II/III. Thus, in this study we analyzed the local field potential when the electrode tip was located in layers II/III (close to 300 μm below the dura). Local field potentials were extracted by low-pass filtering of the raw signal (sampled at 40 kHz) below 90 Hz and subsequently downsampling to 1 kHz. LFP power spectra were calculated using multi-taper methods (TW = 3 and K = 5) in a 2-second analysis window at the beginning and end of the stimulus in MATLAB with the Chronux (http://chronux.org/) package using the “locfit” function after removing 50-Hz line noise (Jia et al., 2011). The visually induced local field potential power spectrum is estimated by calculating the difference between the spectrum during stimulus presentation (grating) and the baseline spectrum (gray screen with uniform brightness). Visually induced gamma power was calculated as the summed power in the 25- to 45-Hz range, after averaging spectra for 10 repetitions.
Statistical analysis
Electrophysiological and histological analyses were conducted by investigators blinded to the mouse genotypes. No statistical methods were used to predetermine sample sizes; however, our sample sizes are similar to those reported in previous publications (Chen et al., 2021). Statistical analysis was performed using GraphPad Prism software (version 8.0.2 for Windows, GraphPad Inc., San Diego, CA, USA, www.graphpad.com). Seven datasets were analyzed: (i) OSI (rank-sum test and cumulative distribution), (ii) preferred spatial and temporal frequencies (rank-sum test and cumulative distribution), (iii) proportion of suppressive cells and receptive field size (Mann-Whitney U test), (iv) spontaneous and maximum response (Mann-Whitney U test), (v) visually induced gamma band oscillations (Mann-Whitney U test), (vi) number of NeuN-positive neurons per square millimeter (Student’s t-test), and (vii) number of Nissl-positive cells per square millimeter (Student’s t-test). Because only eight to 12 neurons could be investigated per mouse using single-unit recording, there were large differences in the indicators characterizing visual features among individual mice. Therefore, data from all neurons recorded in the same group of mice were pooled for the analyses described in (i)–(iv). For (v)–(vii), the statistical analyses were performed based on a single mouse. For the NeuN and Nissl staining analyses, three visual fields (magnification 400×) were selected from layer II/III of each hemisphere for each slice. Thus, the results were calculated from the average of six visual fields (magnification 400×) for each mouse. Cells that stained with both DAPI and NeuN are referred to as NeuN-positive cells, and those that contained one or more Nissl bodies are referred to as Nissl-positive cells. The data were first tested for normal distribution using the Shapiro-Wilk normality test. Based on the results, parametric and nonparametric tests (Student’s t-test, rank-sum test, and Mann-Whitney U test) were applied to the datasets. Consequently, comparisons were made between the values of different parameters between the DBA/2J and C57BL/6J mice groups. Detailed information on the statistical tests used can be found in the figure legends and in the Results. P < 0.05 was considered statistically significant.
Results
Fewer neurons are observed in the V1 of DBA/2J mice compared with C57BL/6J mice
NeuN and Nissl bodies are specific markers of neurons. Neuron morphology was determined by NeuN and Nissl stainings of brain section from six mice in each group. In this experiment, NeuN staining was conducted to quantify the number of neurons, and Nissl staining was performed to observe neuronal cytoarchitecture. When neuronal degeneration occurs, Nissl bodies in neurons decrease in density or even disappear, eventually leading to neuronal apoptosis. Low- and high-power microscopic images of the full thickness of V1 are shown in Figure 2A and B. As shown in Figure 2C, the number of NeuN-positive cells in the V1 of DBA/2J mice was significantly lower than that in the V1 of C57BL/6J mice (P < 0.01). Furthermore, the number of Nissl-positive neurons was lower in the V1 of DBA/2J mice than in C57BL/6J mice (P < 0.0001) (Figure 2D). Meanwhile, lower density of Nissl bodies in neurons of the V1 of DBA/2J mice can be observed in slices. In general, these findings suggest that the V1 of DBA/2J mice contained markedly fewer neurons than that of C57BL/6J mice.
Figure 2.

Histology staining of V1 sections from DBA/2J and C57BL/6J mice.
(A) Schematic diagram of neuronal nuclear antigen (NeuN) staining (red), 4′,6-diamidino-2-phenylindole (DAPI) staining (blue), and merged results of brain tissue sections in layer II/III from C57BL/6J and DBA/2J mice. Arrows indicate NeuN-positive cells. (B) Schematic diagram of Nissl staining of brain tissue sections in layers II/III from C57BL/6J and DBA/2J mice. Arrows indicate Nissl-positive cells. (C, D) Significantly more neuronal apoptosis was observed in the V1 of DBA/2J mice than in C57BL/6J mice (**P < 0.01, ****P < 0.0001; Student’s t-test). Data are expressed as the mean ± SD from six mice in each group. All experiments were repeated three times.
Poor visual tuning in DBA/2J mice
To examine the changes in the response characteristic of V1 neurons to different visual features, single-unit recording was used to examine 87 neurons from eight DBA/2J mice and 81 neurons from eight C57BL/6J mice. The tuning curves of four sets for V1 neurons were examined (examples are shown in Figure 3), including orientation selectivity, spatial frequency, temporal frequency, and size tuning. Orientation selectivity is a prominent characteristic of V1 neurons, and the corresponding tuning curve is sharp if the neuron tends to prefer a narrow orientation range. Figure 4A and B shows the distribution of the OSIs for 70 neurons from eight C57BL/6J mice and 69 neurons from eight DBA/2J mice. The OSI in C57BL/6J mice was significantly higher than that in DAB/2J mice (P < 0.0001). Spatial frequency tuning in V1 neurons is essential for visual acuity and for seeing detailed forms. To assess the spatial frequency tuning, 86 neurons were examined from DBA/2J mice, and 79 neurons were examined from C57BL/6J mice. As shown in Figure 4C and D, DBA/2J neurons preferred a much lower spatial frequency than C57BL/6J (P < 0.0001). In the V1, neural tuning to the speed of stimulus changes is directly related to neural tuning to temporal frequency. As shown in Figure 4E and F, neurons from DAB/2J mice preferred higher temporal frequencies than those from C57BL/6J (P < 0.0001). These findings suggest that the V1 neurons in DBA/2J mice exhibit poor tunings to visual features.
Figure 3.

Examples of visual tuning of neurons from DBA/2J and C57BL/6J mice.
Four tests were performed to assess orientation tuning (A), spatial frequency tuning (B), temporal frequency tuning (C), and size tuning (D). The squares represent neurons from C57BL/6J mice, and the rhombuses represent neurons from DBA/2J mice. Data are expressed as the mean ± SEM from six mice in each group. All experiments were repeated three times.
Figure 4.
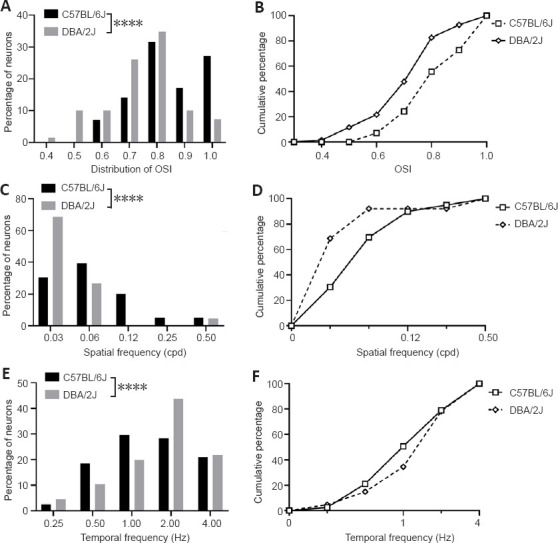
OSI, preferred spatial frequency, and temporal frequency in DBA/2J and C57BL/6J mice.
(A, B) Neurons from DAB/2J mice exhibited poor orientation selectivity (C57BL/6J: n=70 neurons; DAB/2J: n = 69 neurons; rank-sum test, ****P < 0.0001). (C, D) Neurons from DAB/2J mice preferred lower spatial frequencies (C57BL/6J: n = 79 neurons; DAB/2J: n = 86 neurons; rank-sum test, ****P < 0.0001). (E, F) Neurons from DAB/2J mice exhibited a trend toward preferring higher temporal frequencies, but the difference was not statistically significant (C57BL/6J: n = 81 neurons; DAB/2J: n = 87 neurons; rank-sum test, ****P < 0.0001). Data are expressed as the mean ± SD. All experiments were repeated three times. OSI: Orientation selectivity index.
Abnormal size tuning in DBA/2J mice
A fundamental property of the receptive field in V1 is size tuning, which is a neuron’s ability to respond to a stimulus of optimal size inside its receptive field and to be suppressed by larger stimuli surrounding its receptive field. After determining the center of the receptive field, neuronal size tuning was measured by enlarging the size of the drifting sinusoidal grating. As the stimulus size increased, the response either rose to a maximum and then decreased asymptotically or increased to a maximum value (Figure 5A). We calculated the suppression strength as the reduction in the ratio of the maximum response to the minimum response. We chose an arbitrary value of 10% reduction as the smallest change that we could reliably measure. Suppressive cells were classified as having a suppressive index greater than 0.1, and nonsuppressive cells were defined as those having a suppressive index less than 0.1. Size tuning was measured for 70 neurons from DBA/2J mice and 79 neurons from C57BL/6J mice. Surprisingly, we found that the C57BL/6J mice had a higher proportion of suppressive cells than the DBA/2J mice (Figure 5B); 64.6% (51/79) of neurons were suppressive cells in C57BL/6J mice, however, only 45.7% (32/70) of neurons in DBA/2J mice were suppressive cells.
Figure 5.

Size tuning in DBA/2J and C57BL/6J mice.
(A) Example size tuning of a neuron showing obvious surround suppression (solid line) or no surround suppression (dotted line). (B) A much smaller proportion of suppressive cells were observed in DBA/2J mice (64.6% of neurons were suppressive in C57BL/6J mice, and 45.7% of neurons were suppressive in DBA/2J mice). (C) Larger classical receptive field (CRF) size and weaker surround suppression were observed in DBA/2J mice (CRF: n = 51; suppressive index: n = 51) compared with C57BL/6J mice (CRF: n = 32, Mann-Whitney U test, *P < 0.05; suppressive index: n = 32, Mann-Whitney U test, *P = 0.0288). (D) A lower maximum response and no significant difference in spontaneous activity were observed in DBA/2J mice (maximum response (max): n = 70; spontaneous activity (spon): n = 79) compared with C57BL/6J mice (maximum response: n = 79; spontaneous activity: n = 70; Mann-Whitney U test, *P = 0.0147). Data are expressed as the mean ± SD. All experiments were repeated three times.
Next, we calculated the receptive field size and strength of surround suppression in the suppressive cells in the two groups (Figure 5C) and found that the suppressive neurons in C57BL/6J mice had smaller receptive field sizes than those in DBA/2J mice (P < 0.05). In addition, the surround suppression of neurons in C57BL/6J mice was much greater than that in DBA/2J mice (P = 0.0288). We further investigated the maximum response and spontaneous activity (the spike firing rate when neurons are exposed to a gray screen with uniform brightness) in the two groups (Figure 5D). The maximum response of the neurons in C57BL/6J mice was significantly higher than that in the DBA/2J mice (P = 0.0147), and there was no significant difference in mean spontaneous activity between C57BL/6J mice and DBA/2J mice (P > 0.05). Thus, V1 neurons in DBA/2J mice showed weak surround suppression and larger receptive field sizes, which may affected their detection of fine visual features.
Weakened visually induced gamma band oscillations in DBA/2J mice
To investigate change in the visually induced rhythmic oscillations in V1, gamma band oscillations were measured in layers II/III of V1 from seven DBA/2J and C57BL/6J mice, respectively. The drifting sinusoidal grating mainly induces strong oscillations in the gamma band. Previous studies have shown that visually induced gamma band oscillations are greatest in layer II/III. Therefore, we examined the intensity of visually induced gamma band oscillations by recording the local field potential signal from layer II/III. Seven DBA/2J mice and seven C57BL/6J mice were evaluated, and the results are shown in Figure 6. As the example in Figure 6A and B shows, C57BL/6 mice exhibited much greater power in the 25- to 45-Hz bandwidth and lower peak frequency than DAB2/J mice. Figure 6C shows the difference (red line) in local field potential between the spectrum during stimulus presentation (solid gray line) and the baseline spectrum (dotted gray line). Next, we compared the peak frequency and the summed gamma power (25–45 Hz) between the C57BL/6 with DAB2/J mice and found that the peak frequency was lower in the C57BL/6 mice (P = 0.028), while the visually induced gamma band oscillations were much greater in the C57BL/6 mice (P = 0.0157), than in the DAB2/J mice (Figure 6D). Therefore, weakened visually induced gamma band oscillations were found in DBA/2J mice, which may result in the damage in the encoding and transmission of visual information.
Figure 6.

Peak frequency and visually induced gamma band oscillations in C57BL/6J and DBA/2J mice.
An example of raw data (A) and time-frequency analysis (B) for visually induced gamma band oscillations in C57BL/6J and DAB2/J mice. (C) The difference (red line) in gamma power was calculated by subtracting the baseline spectrum (dotted gray line) from the spectrum during stimulus presentation (solid gray line). Peak frequency and summed power between 25–45 Hz were calculated. (D) The peak frequency was lower in C57BL/6J mice (Mann-Whitney U test, *P = 0.028), but the gamma power was greater in C57BL/6J mice (Mann-Whitney U test, *P = 0.0157) compared with DAB2/J mice. Data are expressed as the mean ± SD. All experiments were repeated ten times.
Discussion
Numerous studies have applied quantitative methods to investigate the properties of V1 neurons in mice. Neurons in mice show high selectivity for stimulus parameters such as orientation and spatial frequency, similar to other species (cats and monkeys) (Durand et al., 2016). However, the spatial scale of the mouse receptive field is much larger than that of other species with good eyesight. Recent studies have reported visual tuning changes in other retinal degeneration models (Chen et al., 2016; Foik et al., 2018). In the V1, a smaller receptive field size can provide more stimulus detail to higher-order visual areas (Kobatake and Tanaka, 1994; Glickfeld et al., 2014). Moreover, surround suppression in the V1 constitutes the neural basis of a variety of psychophysical phenomena, such as contour integration (Field et al., 1993; Kapadia et al., 1995), contextual effects (Li and Li, 1994), and figure-ground segregation (Lamme, 1995; Joseph and Optican, 1996). Thus, more DBA/2J neurons exhibited loss of surround suppression and an increased receptive field size compared with C57BL/6J neurons, which suggests that neuronal spatial summation is significantly impaired in this mouse model of glaucoma. However, our study still has some unexpected results. To distinguish between functional changes in cortical neurons that were due to reduced visual input from visual task and functional changes in the cortical neurons themselves, we analyzed differences in spontaneous activity between C57BL/6J mice and DBA/2J mice. We observed no significant difference in spontaneous activity. However, previous studies (Wang et al., 2016, 2018; Foik et al., 2018) have shown that V1 neurons in a retinal degeneration model have a higher firing rate (that is, greater spontaneous activity) than healthy controls, and notably a similar phenomenon occurs in RGCs. When comparing spontaneous activity, the role of retinal disease itself in stimulating V1 neurons should be considered, and complicates the analysis somewhat. In the current study is concerned, we were unable to precisely determine the origin of the functional changes in the V1. More research is needed in the future to investigate the mechanism of the functional variations observed in this glaucoma model. In addition, two-photon imaging has unique advantages for the assessment of spontaneous activities (Busche et al., 2019; Somarowthu et al., 2021), which we plan to take advantage of in future studies.
Many patients with psychiatric disorders show abnormal gamma band oscillations, which are attributed to alterations in synaptic connections and an imbalance between excitatory and inhibitory interactions (Khalid et al., 2016; Fitzgerald and Watson, 2018). Moreover, recent studies revealed that gamma band oscillations (~40 Hz) in the cerebral cortex can effectively activate the neuroimmunity associated with microglia and alleviate the development of Alzheimer’s disease (Iaccarino et al., 2016; Adaikkan et al., 2019; Martorell et al., 2019). Our results revealed a significant reduction in visually induced spiking and gamma band oscillations in DBA/2J mice, suggesting that abnormal gamma band oscillations in the cerebral cortex of DBA/2J mice may increase the risk of degenerative brain conditions, such as Alzheimer’s disease. Yan et al. (2017) reported that elevated IOP induces amyloid-β deposition and tauopathy in the LGN in a monkey model of glaucoma. Lee et al. (2019) identified ophthalmic diseases––including recent glaucoma diagnosis, established age-related macular degeneration, and both recent and established diabetic retinopathy–– as being associated with an increased risk of Alzheimer’s disease in a cohort study. Therefore, it will be important to further clarify the relationship between eye diseases and brain degeneration in future animal studies.
To date, the biological basis of glaucoma has not been completely elucidated, and the factors contributing to its progression are still poorly understood. In this study, we found a great difference in the number of neurons in the V1 of DBA/2J and C57BL/6J mice. Previous studies have demonstrated LGN degeneration in both primates and DBA/2J mice (Weber et al., 2000; Yucel et al., 2003), and our histomorphological findings suggest that neuronal degeneration may occur in the primary visual cortex, based on the concept of trans-synaptic or trans-neuronal degeneration. In summary, we provided new evidence regarding the effects of glaucoma on the visual cortex by directly testing the response properties of V1 cells and investigating their morphological features. Our findings provide further information about the structural and functional features of animal glaucoma models. Some studies have pointed out that structural changes in the V1 region of the brain may arise from a reduction in visual input. Trans-neuronal degeneration may be another explanation for the reduced number of neuronal cells and neurological impairment observed in the V1 region, based on morphological changes seen in the LGN in previous studies of glaucoma models. A recent study proposed using the network degeneration hypothesis to explain brain changes in glaucoma. Further molecular-level studies are needed to determine the mechanisms underlying the changes to the V1 region.
Retinal disease intervention strategies, now mainly were applied to the eye, relying on the integrity of the visual system downstream of the photoreceptors to provide valid and meaningful visual information to the visual centre. However, plastic reorganization brought on by visual impairments, which may occur as potentially maladaptive modifications of cortical circuits (Burnat et al., 2017; Masuda et al., 2021). It is crucial for any attempt to create effective methods for the treatment and rehabilitation of disease. Carvalho et al. (2022) analyzed local neuroplasticity in adult glaucomatous visual cortex by fMRI-signals, and found that adult brains still maintain some local neuroplasticity. Rehabilitation treatment, based on is neuronal plasticity of the visual system, is a glaucoma therapeutic method that aims to reeducate the patient to the use of residual vision through repeated visual stimulation (Nuzzi et al., 2021). A recent study using DBA/2J mice found that changes in neuronal excitability and synaptic input in the LGN may be a result of pathological dysfunction besides stabilizing/homeostatic plasticity (Van Hook et al., 2021). These studies show that there are significant changes in the brain caused by ophthalmic diseases, and we may need to target both the brain and the eye for intervention treatments in the future.
It is important to stress that this study has some limitations. C57BL/6J mice are commonly used as controls for experiments with DBA/2J mice. However, C57BL/6J mice are not genetically matched with DBA/2J mice (Van Hook et al., 2021); thus, the strain differences may have caused some variations in visual tuning. At present, the DBA/2JGpnmb+ line is considered to be the best strain-matched control line for DBA/2J mice (Howell et al., 2007). Besides, despite the significant difference seen in IOPs between the groups after 7 months, the damage to the V1 may have occurred before any significant change in IOP was apparent. Therefore, the structural and functional changes in V1 neurons at different ages could be studied in further detail in future studies, especially the relationship between changes in IOP and the function and status of V1 neurons.
In conclusion, this study is an important addition to the- existing research on pathological changes in the advanced visual centers of subjects with glaucoma. Our results confirm that damage to V1 neurons in experimental glaucoma models may affect both the function and morphology of the neurons involved. These findings provide us with a better understanding of the pathological changes that occur in higher visual centers at the cellular level. However, changes in visual tuning properties involve complex brain regions and neural circuits, including feedforward input from the retina to the LGN, horizontal connections within the V1, and connections from the higher visual cortex. Elevated IOP can lead to deterioration of neuronal function, as well as neuron loss, throughout the visual pathway, forming the basis of V1 pathology in glaucoma. Therefore, it cannot be determined whether V1 pathology is caused by direct elevation of IOP, loss of retinal ganglion cells, or perhaps a combination of multiple factors. In addition, clinically detected visual field defects in patients with glaucoma might be partially due to lesions in the RF of V1 neurons. Further studies investigating interventions such as stimulation of neuronal activity or drug treatment for inducing neuron remodeling in experimental glaucoma models are needed. In summary, this study investigated the structural and functional characteristics of the V1 in a mouse model of glaucoma and provides helpful insights into the mechanisms of and treatment opportunities for glaucoma.
Additional file:
Additional Figure 1 (309.2KB, tif) : Study design.
Study design.
CRF: Classical receptive field; NeuN: neuronal nuclear antigen.
Footnotes
Funding: This study was supported by the STI 2030–Major Projects 2022ZD0208500 (to DY); the National Natural Science Foundation of China, Nos. 82072011 (to YX), 82121003 (to DY), 82271120 (to YS); Sichuan Science and Technology Program, No. 2022ZYD0066 (to YS); a grant from Chinese Academy of Medical Science, No. 2019-12M-5-032 (to YS); and the Fundamental Research Funds for the Central Universities, No. ZYGX2021YGLH219 (to KC).
Conflicts of interest: The authors declare no conflict of interest.
Data availability statement: All relevant data are within the paper.
Editor’s evaluation: Although there are several studies reporting the behavior and optic tract changes in DBA/2J mice, it is an interesting study to investigate the electrophysiological changes of DBA/2J mice, especially in V1 cortex.
C-Editor: Zhao M; S-Editor: Li CH; L-Editors: Crow E, Li CH, Song LP; T-Editor: Jia Y
References
- 1.Adaikkan C, Middleton SJ, Marco A, Pao PC, Mathys H, Kim DN, Gao F, Young JZ, Suk HJ, Boyden ES, McHugh TJ, Tsai LH. Gamma entrainment binds higher-order brain regions and offers neuroprotection. Neuron. (2019);102:929–943.e8. doi: 10.1016/j.neuron.2019.04.011. [DOI] [PMC free article] [PubMed] [Google Scholar]
- 2.Burnat K, Hu TT, Kossut M, Eysel UT, Arckens L. Plasticity beyond V1:reinforcement of motion perception upon binocular central retinal lesions in adulthood. J Neurosci. (2017);37:8989–8999. doi: 10.1523/JNEUROSCI.1231-17.2017. [DOI] [PMC free article] [PubMed] [Google Scholar]
- 3.Busche MA, Wegmann S, Dujardin S, Commins C, Schiantarelli J, Klickstein N, Kamath TV, Carlson GA, Nelken I, Hyman BT. Tau impairs neural circuits, dominating amyloid-beta effects, in Alzheimer models in vivo. Nat Neurosci. (2019);22:57–64. doi: 10.1038/s41593-018-0289-8. [DOI] [PMC free article] [PubMed] [Google Scholar]
- 4.Carvalho J, Invernizzi A, Martins J, Renken RJ, Cornelissen FW. Local neuroplasticity in adult glaucomatous visual cortex. Sci Rep. (2022);12:21981. doi: 10.1038/s41598-022-24709-1. [DOI] [PMC free article] [PubMed] [Google Scholar]
- 5.Castelo-Branco M, Neuenschwander S, Singer W. Synchronization of visual responses between the cortex, lateral geniculate nucleus, and retina in the anesthetized cat. J Neurosci. (1998);18:6395–6410. doi: 10.1523/JNEUROSCI.18-16-06395.1998. [DOI] [PMC free article] [PubMed] [Google Scholar]
- 6.Chen H, Zhao Y, Liu M, Feng L, Puyang Z, Yi J, Liang P, Zhang HF, Cang J, Troy JB, Liu X. Progressive degeneration of retinal and superior collicular functions in mice with sustained ocular hypertension. Invest Ophthalmol Vis Sci. (2015);56:1971–1984. doi: 10.1167/iovs.14-15691. [DOI] [PMC free article] [PubMed] [Google Scholar]
- 7.Chen K, Song XM, Li CY. Contrast-dependent variations in the excitatory classical receptive field and suppressive nonclassical receptive field of cat primary visual cortex. Cereb Cortex. (2013a);23:283–292. doi: 10.1093/cercor/bhs012. [DOI] [PubMed] [Google Scholar]
- 8.Chen K, Wang Y, Liang X, Zhang Y, Ng TK, Chan LL. Electrophysiology alterations in primary visual cortex neurons of retinal degeneration (S334ter-line-3) rats. Sci Rep. (2016);6:26793. doi: 10.1038/srep26793. [DOI] [PMC free article] [PubMed] [Google Scholar]
- 9.Chen K, Ma X, Nehme A, Wei J, Cui Y, Cui Y, Yao D, Wu J, Anderson T, Ferguson D, Levitt P, Qiu S. Time-delimited signaling of MET receptor tyrosine kinase regulates cortical circuit development and critical period plasticity. Mol Psychiatry. (2021);26:3723–3736. doi: 10.1038/s41380-019-0635-6. [DOI] [PMC free article] [PubMed] [Google Scholar]
- 10.Chen WW, Wang N, Cai S, Fang Z, Yu M, Wu Q, Tang L, Guo B, Feng Y, Jonas JB, Chen X, Liu X, Gong Q. Structural brain abnormalities in patients with primary open-angle glaucoma:a study with 3T MR imaging. Invest Ophthalmol Vis Sci. (2013b);54:545–554. doi: 10.1167/iovs.12-9893. [DOI] [PubMed] [Google Scholar]
- 11.Crawford ML, Harwerth RS, Smith EL 3rd, Mills S, Ewing B. Experimental glaucoma in primates:changes in cytochrome oxidase blobs in V1 cortex. Invest Ophthalmol Vis Sci. (2001);42:358–364. [PubMed] [Google Scholar]
- 12.Duncan RO, Sample PA, Weinreb RN, Bowd C, Zangwill LM. Retinotopic organization of primary visual cortex in glaucoma:Comparing fMRI measurements of cortical function with visual field loss. Prog Retin Eye Res. (2007);26:38–56. doi: 10.1016/j.preteyeres.2006.10.001. [DOI] [PMC free article] [PubMed] [Google Scholar]
- 13.Durand S, Iyer R, Mizuseki K, de Vries S, Mihalas S, Reid RC. A comparison of visual response properties in the lateral geniculate nucleus and primary visual cortex of awake and anesthetized mice. J Neurosci. (2016);36:12144–12156. doi: 10.1523/JNEUROSCI.1741-16.2016. [DOI] [PMC free article] [PubMed] [Google Scholar]
- 14.Fernandez-Sanchez L, de Sevilla Mueller LP, Brecha NC, Cuenca N. Loss of outer retinal neurons and circuitry alterations in the DBA/2J mouse. Invest Ophthalmol Vis Sci. (2014);55:6059–6072. doi: 10.1167/iovs.14-14421. [DOI] [PMC free article] [PubMed] [Google Scholar]
- 15.Fiedorowicz M, Orzel J, Kossowski B, Welniak-Kaminska M, Choragiewicz T, Swiatkiewicz M, Rejdak R, Bogorodzki P, Grieb P. Anterograde transport in axons of the retinal ganglion cells and its relationship to the intraocular pressure during aging in mice with hereditary pigmentary glaucoma. Curr Eye Res. (2018);43:539–546. doi: 10.1080/02713683.2017.1416147. [DOI] [PubMed] [Google Scholar]
- 16.Field DJ, Hayes A, Hess RF. Contour integration by the human visual system:evidence for a local “association field”. Vision Res. (1993);33:173–193. doi: 10.1016/0042-6989(93)90156-q. [DOI] [PubMed] [Google Scholar]
- 17.Fitzgerald PJ, Watson BO. Gamma oscillations as a biomarker for major depression:an emerging topic. Transl Psychiatry. (2018);8:177. doi: 10.1038/s41398-018-0239-y. [DOI] [PMC free article] [PubMed] [Google Scholar]
- 18.Foik AT, Lean GA, Scholl LR, McLelland BT, Mathur A, Aramant RB, Seiler MJ, Lyon DC. Detailed visual cortical responses generated by retinal sheet transplants in rats with severe retinal degeneration. J Neurosci. (2018);38:10709–10724. doi: 10.1523/JNEUROSCI.1279-18.2018. [DOI] [PMC free article] [PubMed] [Google Scholar]
- 19.Fujishiro T, Honjo M, Kawasaki H, Aihara M. Visual cortex damage in a ferret model of ocular hypertension. Jpn J Ophthalmol. (2022);66:205–212. doi: 10.1007/s10384-022-00901-8. [DOI] [PubMed] [Google Scholar]
- 20.Glickfeld LL, Reid RC, Andermann ML. A mouse model of higher visual cortical function. Curr Opin Neurobiol. (2014);24:28–33. doi: 10.1016/j.conb.2013.08.009. [DOI] [PMC free article] [PubMed] [Google Scholar]
- 21.Gray CM, Singer W. Stimulus-specific neuronal oscillations in orientation columns of cat visual cortex. Proc Natl Acad Sci U S A. (1989);86:1698–1702. doi: 10.1073/pnas.86.5.1698. [DOI] [PMC free article] [PubMed] [Google Scholar]
- 22.Gray CM, Konig P, Engel AK, Singer W. Oscillatory responses in cat visual cortex exhibit inter-columnar synchronization which reflects global stimulus properties. Nature. (1989);338:334–337. doi: 10.1038/338334a0. [DOI] [PubMed] [Google Scholar]
- 23.Han C, Shapley R, Xing D. Gamma rhythms in the visual cortex:functions and mechanisms. Cogn Neurodyn. (2022);16:745–756. doi: 10.1007/s11571-021-09767-x. [DOI] [PMC free article] [PubMed] [Google Scholar]
- 24.Hernowo AT, Boucard CC, Jansonius NM, Hooymans JM, Cornelissen FW. Automated morphometry of the visual pathway in primary open-angle glaucoma. Invest Ophthalmol Vis Sci. (2011);52:2758–2766. doi: 10.1167/iovs.10-5682. [DOI] [PubMed] [Google Scholar]
- 25.Hou B, Chen K, Jia A, Liu S, Bao X, Liao B, Zhao YL, Guo D, Xia Y, Yao D. Visually induced γband rhythm in spatial summation beyond the receptive field in mouse primary visual cortex. Cereb Cortex: bhac347. (2022) doi: 10.1093/cercor/bhac347. [DOI] [PubMed] [Google Scholar]
- 26.Howell GR, Libby RT, Marchant JK, Wilson LA, Cosma IM, Smith RS, Anderson MG, John SWM. Absence of glaucoma in DBA/2J mice homozygous for wild-type versions of Gpnmb and Tyrp1. BMC Genet. (2007);8:45. doi: 10.1186/1471-2156-8-45. [DOI] [PMC free article] [PubMed] [Google Scholar]
- 27.Hubel DH, Wiesel TN. Receptive fields of single neurones in the cat's striate cortex. J Physiol. (1959);148:574–591. doi: 10.1113/jphysiol.1959.sp006308. [DOI] [PMC free article] [PubMed] [Google Scholar]
- 28.Iaccarino HF, Singer AC, Martorell AJ, Rudenko A, Gao F, Gillingham TZ, Mathys H, Seo J, Kritskiy O, Abdurrob F, Adaikkan C, Canter RG, Rueda R, Brown EN, Boyden ES, Tsai LH. Gamma frequency entrainment attenuates amyloid load and modifies microglia. Nature. (2016);540:230–235. doi: 10.1038/nature20587. [DOI] [PMC free article] [PubMed] [Google Scholar]
- 29.Jia X, Smith MA, Kohn A. Stimulus selectivity and spatial coherence of gamma components of the local field potential. J Neurosci. (2011);31:9390–9403. doi: 10.1523/JNEUROSCI.0645-11.2011. [DOI] [PMC free article] [PubMed] [Google Scholar]
- 30.Jia XX, Kohn A. Gamma rhythms in the brain. PLoS Biol. (2011);9:e1001045. doi: 10.1371/journal.pbio.1001045. [DOI] [PMC free article] [PubMed] [Google Scholar]
- 31.Joseph JS, Optican LM. Involuntary attentional shifts due to orientation differences. Percept Psychophys. (1996);58:651–665. doi: 10.3758/bf03213098. [DOI] [PubMed] [Google Scholar]
- 32.Kapadia MK, Ito M, Gilbert CD, Westheimer G. Improvement in visual sensitivity by changes in local context:parallel studies in human observers and in V1 of alert monkeys. Neuron. (1995);15:843–856. doi: 10.1016/0896-6273(95)90175-2. [DOI] [PubMed] [Google Scholar]
- 33.Khalid A, Kim BS, Seo BA, Lee ST, Jung K-H, Chu K, Lee SK, Jeon D. Gamma oscillation in functional brain networks is involved in the spontaneous remission of depressive behavior induced by chronic restraint stress in mice. BMC Neurosci. (2016);17:4. doi: 10.1186/s12868-016-0239-x. [DOI] [PMC free article] [PubMed] [Google Scholar]
- 34.Kobatake E, Tanaka K. Neuronal selectivities to complex object features in the ventral visual pathway of the macaque cerebral cortex. J Neurophysiol. (1994);71:856–867. doi: 10.1152/jn.1994.71.3.856. [DOI] [PubMed] [Google Scholar]
- 35.Lamme VA. The neurophysiology of figure-ground segregation in primary visual cortex. J Neurosci. (1995);15:1605–1615. doi: 10.1523/JNEUROSCI.15-02-01605.1995. [DOI] [PMC free article] [PubMed] [Google Scholar]
- 36.Lee CS, Larson EB, Gibbons LE, Lee AY, McCurry SM, Bowen JD, McCormick WC, Crane PK. Associations between recent and established ophthalmic conditions and risk of Alzheimer's disease. Alzheimers Dement. (2019);15:34–41. doi: 10.1016/j.jalz.2018.06.2856. [DOI] [PMC free article] [PubMed] [Google Scholar]
- 37.Li CY, Li W. Extensive integration field beyond the classical receptive field of cat's striate cortical neurons--classification and tuning properties. Vision Res. (1994);34:2337–2355. doi: 10.1016/0042-6989(94)90280-1. [DOI] [PubMed] [Google Scholar]
- 38.Liao DS, Krahe TE, Prusky GT, Medina AE, Ramoa AS. Recovery of cortical binocularity and orientation selectivity after the critical period for ocular dominance plasticity. J Neurophysiol. (2004);92:2113–2121. doi: 10.1152/jn.00266.2004. [DOI] [PubMed] [Google Scholar]
- 39.Liu YX, Sun H, Guo WY. Astrocyte polarization in glaucoma:a new opportunity. Neural Regen Res. (2022);17:2582–2588. doi: 10.4103/1673-5374.339470. [DOI] [PMC free article] [PubMed] [Google Scholar]
- 40.Martinez B, Peplow PV. MicroRNAs as biomarkers in glaucoma and potential therapeutic targets. Neural Regen Res. (2022);17:2368–2375. doi: 10.4103/1673-5374.338989. [DOI] [PMC free article] [PubMed] [Google Scholar]
- 41.Martorell AJ, Paulson AL, Suk HJ, Abdurrob F, Drummond GT, Guan W, Young JZ, Kim DN, Kritskiy O, Barker SJ, Mangena V, Prince SM, Brown EN, Chung K, Boyden ES, Singer AC, Tsai LH. Multi-sensory gamma stimulation ameliorates Alzheimer's-associated pathology and improves cognition. Cell. (2019);177:256–271.e22. doi: 10.1016/j.cell.2019.02.014. [DOI] [PMC free article] [PubMed] [Google Scholar]
- 42.Masuda Y, Takemura H, Terao M, Miyazaki A, Ogawa S, Horiguchi H, Nakadomari S, Matsumoto K, Nakano T, Wandell BA, Amano K. V1 projection zone signals in human macular degeneration depend on task despite absence of visual stimulus. Curr Biol. (2021);31:406–412.e3. doi: 10.1016/j.cub.2020.10.034. [DOI] [PubMed] [Google Scholar]
- 43.Murphy MC, Conner IP, Teng CY, Lawrence JD, Safiullah Z, Wang B, Bilonick RA, Kim SG, Wollstein G, Schuman JS, Chan KC. Retinal structures and visual cortex activity are impaired prior to clinical vision loss in glaucoma. Sci Rep. (2016);6:31464. doi: 10.1038/srep31464. [DOI] [PMC free article] [PubMed] [Google Scholar]
- 44.Murty DVPS, Shirhatti V, Ravishankar P, Ray S. Large visual stimuli induce two distinct gamma oscillations in primate visual cortex. J Neurosci. (2018);38:2730–2744. doi: 10.1523/JNEUROSCI.2270-17.2017. [DOI] [PMC free article] [PubMed] [Google Scholar]
- 45.Nagaraju M, Saleh M, Porciatti V. IOP-dependent retinal ganglion cell dysfunction in glaucomatous DBA/2J mice. Invest Ophthalmol Vis Sci. (2007);48:4573–4579. doi: 10.1167/iovs.07-0582. [DOI] [PMC free article] [PubMed] [Google Scholar]
- 46.Nuzzi R, Marolo P, Nuzzi A. What is new in glaucoma:from treatment to biological perspectives. J Ophthalmol. (2021);2021:5013529. doi: 10.1155/2021/5013529. [DOI] [PMC free article] [PubMed] [Google Scholar]
- 47.Paxinos G, Franklin KBJ. Paxinos and Franklin's the mouse brain in stereotaxic coordinates. 4th ed. Boston: Elsevier/Academic Press; (2013). [Google Scholar]
- 48.Singer W, Gray CM. Visual feature integration and the temporal correlation hypothesis. Annu Rev Neurosci. (1995);18:555–586. doi: 10.1146/annurev.ne.18.030195.003011. [DOI] [PubMed] [Google Scholar]
- 49.Smith CA, Vianna JR, Chauhan BC. Assessing retinal ganglion cell damage. Eye (Lond) (2017);31:209–217. doi: 10.1038/eye.2016.295. [DOI] [PMC free article] [PubMed] [Google Scholar]
- 50.Somarowthu A, Goff KM, Goldberg EM. Two-photon calcium imaging of seizures in awake, head-fixed mice. Cell Calcium. (2021);96:102380. doi: 10.1016/j.ceca.2021.102380. [DOI] [PMC free article] [PubMed] [Google Scholar]
- 51.Sujanthan S, Shmuel A, Mendola JD. Visually driven functional MRI techniques for characterization of optic neuropathy. Front Hum Neurosci. (2022);16:943603. doi: 10.3389/fnhum.2022.943603. [DOI] [PMC free article] [PubMed] [Google Scholar]
- 52.Tang J, Ardila Jimenez SC, Chakraborty S, Schultz SR. Visual receptive field properties of neurons in the mouse lateral geniculate nucleus. PLoS One. (2016);11:e0146017. doi: 10.1371/journal.pone.0146017. [DOI] [PMC free article] [PubMed] [Google Scholar]
- 53.Van Hook MJ, Monaco C, Bierlein ER, Smith JC. Neuronal and synaptic plasticity in the visual thalamus in mouse models of glaucoma. Front Cell Neurosci. (2021);14:626056. doi: 10.3389/fncel.2020.626056. [DOI] [PMC free article] [PubMed] [Google Scholar]
- 54.Wang Y, Chen K, Xu P, Ng TK, Chan LL. Spontaneous neural activity in the primary visual cortex of retinal degenerated rats. Neurosci Lett. (2016);623:42–46. doi: 10.1016/j.neulet.2016.04.062. [DOI] [PubMed] [Google Scholar]
- 55.Wang Y, Chen K, Chan LLH. Responsive neural activities in the primary visual cortex of retina-degenerated rats. Neuroscience. (2018);383:84–97. doi: 10.1016/j.neuroscience.2018.05.006. [DOI] [PubMed] [Google Scholar]
- 56.Weber AJ, Chen H, Hubbard WC, Kaufman PL. Experimental glaucoma and cell size, density, and number in the primate lateral geniculate nucleus. Invest Ophthalmol Vis Sci. (2000);41:1370–1379. [PubMed] [Google Scholar]
- 57.Yan Z, Liao H, Chen H, Deng S, Jia Y, Deng C, Lin J, Ge J, Zhuo Y. Elevated intraocular pressure induces amyloid-beta deposition and tauopathy in the lateral geniculate nucleus in a monkey model of glaucoma. Invest Ophthalmol Vis Sci. (2017);58:5434–5443. doi: 10.1167/iovs.17-22312. [DOI] [PubMed] [Google Scholar]
- 58.Yucel YH, Zhang QA, Weinreb RN, Kaufman PL, Gupta N. Effects of retinal ganglion cell loss on magno-, parvo-, koniocellular pathways in the lateral geniculate nucleus and visual cortex in glaucoma. Prog Retin Eye Res. (2003);22:465–481. doi: 10.1016/s1350-9462(03)00026-0. [DOI] [PubMed] [Google Scholar]
Associated Data
This section collects any data citations, data availability statements, or supplementary materials included in this article.
Supplementary Materials
Study design.
CRF: Classical receptive field; NeuN: neuronal nuclear antigen.