

SUMMARY
The master transcriptional regulator PU.1/Spi-1 engages DNA sites with affinities spanning multiple orders of magnitude. To elucidate this remarkable plasticity, we have characterized 22 high-resolution co-crystallographic PU.1/DNA complexes across the addressable affinity range in myeloid gene transactivation. Over a purine-rich core (such as 5'-GGAA-3') flanked by variable sequences, affinity is negotiated by direct readout on the 5' flank via a critical glutamine (Q226) sidechain and by indirect readout on the 3' flank by sequence-dependent helical flexibility. Direct readout by Q226 dynamically specifies PU.1’s characteristic preference for purines and explains the pathogenic mutation Q226E in Waldenström macroglobulinemia. The structures also reveal how disruption of Q226 mediates strand-specific inhibition by DNA methylation and the recognition of non-canonical sites, including the authentic binding sequence at the CD11b promoter. A re-synthesis of phylogenetic and structural data on the ETS family, considering the centrality of Q226 in PU.1, unifies the model of DNA selection by ETS proteins.
Graphical Abstract
In brief
Terrell et al. present 22 high-resolution structures of co-crystal DNA complexes of the master myeloid transcription factor PU.1. They show the role of folded-state dynamics of PU.1 ETS domain in DNA recognition, including strand-specific CpG methylation and recognition of non-canonical targets, over an affinity range of three orders of magnitude.
INTRODUCTION
The DNA selectivity of transcription factors, as primarily determined by their DNA-binding domains (DBDs), is fundamental to gene regulation.1,2 Despite substantial abundance, comprising ~6% of expressed genes in eukaryotes, transcription factors are remarkably restricted in terms of their DBD structure.3 The physical origins of target selection by transcription factors harboring homologous DBDs have remained a central problem in gene regulation4 and a persistent bottleneck in targeted strategies for molecular control.5 The E26 transformation–specific (ETS) family of transcription factors, of which 28 members are expressed in humans, has been an important model for this problem.6,7 ETS factors share a winged helix-turn-helix DBD known as the ETS domain,8 which is tightly conserved in structure. ETS domains characteristically recognize ~10-bp cognate sites containing a 5'-GGA(A/T)-3' core consensus. DNA bases flanking the core consensus vary and their sequences formally categorize the family into four classes, I–IV.6
Structures of DNA-bound ETS complexes have established a paradigm of target recognition by this family.8 ETS domains insert a recognition helix into the DNA major groove of site-specific DNA at the core consensus while making additional contacts with sequences flanking both ends of the consensus. This body plan serves a general basis for comparing the flanking sequence preferences that characterize the four classes in the ETS family.6 Much less clear, however, is how the variation in flanking sequences determines high- and low-affinity interactions within a transcription factor/DNA complex. The significance of this problem is highlighted by recent evidence in which low-affinity DNA directs transcriptional outcomes in tissue development, including those dependent on ETS factors, that are distinct and irreplaceable by high-affinity counterparts in vivo.9-13 Furthermore, fluctuations in chromatin structure and transcription factor abundance lead to a dynamic competition for high- and low-affinity binding sites.14-16 Redistribution of genomic occupancy also holds implications for therapeutic strategies aimed at modifying transcription factor expression and/or their interactions with DNA.17-19
To date, the molecular criteria for DNA selection by ETS transcription factors remain poorly defined. With few exceptions, ETS complexes are solved with high-affinity sequences, so low-affinity structures are disproportionately under-represented in the Protein Data Bank. To improve our understanding of low-affinity binding, an attractive model is PU.1/Spi-1, a class III member whose flanking sequence preferences are more qualitatively differentiated6 and quantitively pronounced20 than its ETS relatives. Interest in PU.1 is further heightened by a Gln → Glu mutation (human residue 226) in the recognition helix of both extant PU.1/DNA structures.21,22 The other ETS classes also contain a Glu (or Asp) residue at the corresponding position. Moreover, Q226E is a recurrent molecular lesion in Waldenström macroglobulinemia, an incurable B cell lymphoma, with an altered gene expression profile.23 It is therefore unclear whether the extant models represent wild-type (WT) PU.1/DNA structures and, closely related to this, to what extent their interactions represent high- or low-affinity binding. Compounding this uncertainty is what range of PU.1-binding affinities are functionally addressable in a native promoter and what level of affinity is required for functional trans regulation. Answers to these questions would considerably inform assessments of promoter strengths of PU.1-dependent genes, given that dose-dependent effects in PU.1 target gene expression16,24 and hematopoietic cell-fate determination (including in disease) are already well established.25-30
To make progress, we determined the cis-activating potential of a panel of PU.1-binding sites, spanning the full range of in vitro affinities (~103-fold in dissociation constant), in the context of the macrophage colony-stimulating factor (M-CSF) receptor (CSF1R) promoter, a major PU.1 target31 in myelomonocytic cells. Guided by the functional data, we then elucidated PU.1 target selection by solving a series of 22 co-crystallographic structures at the highest resolutions reported to date for ETS proteins. The structures enabled explicit assessment of sidechain conformational dynamics (manifest as crystallographic disorder) in high- and low-affinity binding. Complemented by solution binding and sequencing experiments, the data established the critical role for Q226, a signature residue in PU.1 and other class III ETS paralogs, in uniquely determining the DNA selectivity of this class, but is missed by the Q226E mutation in existing models. In resolving the uncertainty surrounding Q226, this suite of structures offers a general and definitive structural understanding of DNA selection by PU.1 and other ETS-family factors.
RESULTS
PU.1 transactivates the CSF1R promoter, a critical myeloid gene target, in an affinity-dependent manner
Myeloid promoters, of which the M-CSF receptor (CSF1R) is a standard exemplar, are distinguished from housekeeping and other tissue-specific promoters notably in their lack of a TATA box.31 To define the relevant correspondence of transactivation potential to binding affinity, we designed a fluorescent reporter based on the human monocytic CSF1R promoter (Figure 1A).32 A single PU.1-binding site near the transcriptional start site (TSS) is essential for myeloid-restricted expression of the downstream gene.33 We substituted the native site with a series of PU.1-binding sequences to probe two fundamental attributes of myeloid gene expression: on the input side, the affinity required to generate a PU.1-responsive output, and, on the output side, the dynamic range of PU.1-dependent transactivation. The probe sequences spanned the full range of PU.1-binding affinities, from 10−10 to 10−6 M, including a core-scrambled nonspecific (NS) version of the highest-affinity sequence (Figure 1B). We adopt a letter-number labeling scheme in order of presentation (e.g., 1H) to facilitate references to DNA sequences in the text.
Figure 1. Affinity-dependent transactivation of the CSF1R promoter by PU.1.

(A) Design of a synthetic fluorescent CSF1R reporter. The essential PU.1-binding site was replaced by a probe-binding site. Promoter transactivation leads to expression of D2EGFP. A constitutive CyOFP1 marker affords gating of transduced cells and normalization.
(B) Panel of PU.1-binding sites in order from highest to lowest affinity. Points represent mean ± SD of three technical replicates.
(C) Promoter transactivation in MOLM-13 and THP-1 cells as mean ratios of D2EGFP/CyOFP1 fluorescence ±SE of at least three biological replicates. Signal dispersion was significant by one-way ANOVA (p < 10−6). Bracketed sequences generate significantly higher fluorescence than the constitutive intensity (p < 0.05, post hoc Tukey honestly significant difference [HSD]).
(D) Response of promoter signal to the hypomethylating agent 5-azacytidine (AZA). Shown is mean fold change in EGFP/CyOFP1 intensity ±SE of at least three biological replicates. Asterisk (*) indicates significantly above the null-GFP control (p < 0.05).
Lentiviral constructs of the affinity-biased CSF1R promoters were transduced into MOLM13 and THP-1 cells, two myeloid cell lines with low and high expression of PU.1, respectively.17 Using a constitutive CyOFP1 marker to control for transduction efficiency, flow cytometric data provided a readout on PU.1-dependent D2EGFP expression. Sequence variation significantly dispersed the transactivation signal (normalized D2EGFP/CyOFP1 intensity) in step with PU.1-binding affinities (Figure 1C). In MOLM13 cells, the CSF1R promoter exhibited significant constitutive activity, and sites with affinities 10−9 M or poorer were refractory to stimulation above background. To further authenticate the dependence on PU.1 of the observed signal, we tested the POMP site, which is a native PU.1 target related to 3H by seven additional 5'-flanking A residues (for a total of 11). A-tracks frequently flank the 5' side of PU.1-binding motifs.1 The enhanced transactivation of the POMP site relative to 3H (POMP/3H = 2.6 ± 0.2) demonstrated this characteristic sequence context. The other probe sequence constructs share an identical format and are directly comparable. Taking the POMP signal as the maximum in-cell efficacy of the system, the dynamic range in MOLM-13 cells was ~60%, and the addressable affinity range was ~10-fold in the range of KD ~10−10 M (sites 1H and 2H). In contrast, THP-1 cells exhibited negligible constitutive activity, resulting in >90% dynamic range, and stronger enhancement by additional flanking purines (POMP/3H = 3.9 ± 0.4) than MOLM-13. The addressable affinity range was also increased in THP-1 by ~10-fold, as the 3H site (KD ~10−9 M) was addressable by PU.1 when it was not in MOLM-13. The CSF1R promoter thus varied in constitutive activity as well as dynamic range and addressable affinity toward transactivation by PU.1 in two different myeloid backgrounds.
Among the probe sequences, 1H, 1L, and NS carry a CpG dinucleotide. The apparent cis-activation potential of 2H on par (THP-1) or stronger (MOLM-13) than 1H suggested potential inhibition by DNA methylation of CpG-containing PU.1 sites. To interrogate the reporter for repression by methylated CpG, stably transduced cells were exposed to 5-azacytidine (AZA, 0.1 μM) or vehicle for 48 h (Figure 1D). In MOLM-13 cells, treatment with AZA enhanced transactivation from the 1H sequence ~10% above control (null-EGFP), but without effect on 1L or NS. In comparison, transactivation at 1H more than doubled above control in THP-1 cells. The robust response was strictly specific to 1H, as the 1L or NS site did not benefit. There was no correlation with apparent affinity, as both 3H and POMP were equally insensitive to AZA. The sequence-specific effect by AZA strongly implicated direct disinhibition of PU.1 as the cause because de-repression of partner regulators would not be expected to select for CpG-containing PU.1-specific properties. However, background variation in the magnitude of AZA de-repression was expected to reflect the differential activities of other CSF1R regulators and of DNA methyltransferases in the two cell lines.
In summary, the CSF1R reporter revealed constitutive and affinity-dependent transactivation at a functional myeloid promoter. Both the addressable affinity and dynamic ranges depend on the cellular context. Additional flanking purines enhance minimal high-affinity sites. The flanking purines do not correspond to binding motifs of known PU.1 co-activators, such as c-Jun, suggesting that these low-complexity sequences act directly on recruiting PU.1. Repression by DNA methylation is reversible only if the affinity of the CpG-containing site is already in the addressable range. Adjusting for these factors, the sequence-dependent DNA-binding affinity of PU.1 establishes the input (addressable affinity) and output (dynamic range) characteristics of PU.1-responsive transactivation. The functional evidence thus motivates us to ask how PU.1 mediates DNA selection and how this mechanism is modified by flanking sequences and CpG methylation.
Indirect readout of 3' flanking DNA defines low-affinity binding
To elucidate the structural determinants of PU.1/DNA affinity, we sought to improve the crystallographic resolution of extant PU.1/DNA complexes, which are limited at ~2 Å. Using the human ETS domain (ΔN165) in complex with 1H as scout, we identified crystallization conditions yielding co-crystals that diffracted to resolution as well as 1.22 Å (Figures 2A and S1A-S1F) and were compatible with a wide range of high- and low-affinity DNA sites (Table S1). Nonspecific sequences did not co-crystallize.
Figure 2. Structural basis of affinity perturbation by 3'-flanking sequence variation.

(A) Domain and gross structure of the high-affinity PU.1/DNA complex 1H. See also Table S1 and Figure S1.
(B) Juxtaposition of the most affinity-divergent complexes 1H and 3L. The DNA is colored by the full scale of isotropic B factors in the DNA. Note the low B factors at the 3'-flanking TGG step in 3L. Protein contacts within 3.5 Å of the TGG step are shown with magenta C atoms. In the 3L complex, R220 and N234 (green C atoms) are 1 Å or further away. 2mFo-DFc maps are rendered at 1.0 σ.
(C) Whisker-box plot of isotropic B factors. Boxes represent median ± quartiles (interquartile range) and whiskers represent the 5th/95th percentile. Complexes with 3' GTG (1L and 3L) show wider dispersion in B factor only for the DNA, regardless of the 5' flanking bases.
(D) Roll angles of base pair steps over the bound sequences. The roll trajectories become tightly segregated by affinity (1H/3H and 1L/3L) beginning at the base step +1/+2 (shaded section), corresponding to a divergence in minor groove width (P-P distance), which is systematically narrower in 1L and 3L.
(E) Sequence-dependent flexibility of the GTG over TGG steps as experimentally detected by DNase I35 and modeled by molecular mechanical resistance to slide.36,37 The literature data are detailed in Figure S2.
In our co-crystals, the complexes assembled in a P1 21 1 space group with one complex per asymmetric unit, connected by end-to-end DNA/DNA and secondary protein/DNA contacts (Figures S1G and S1H). The DNA termini formed three-stack triplexes that transitioned into duplex DNA via a single non-Watson-Crick base pair at the 3' boundary of the protein/DNA interface. The PU.1-bound DNA site was not significantly perturbed by the terminal triplexes, despite a resultant unit cell density over twice that of the extant PU.1/DNA co-crystal (3.8 vs. 1.5 g/cm3), which likely contributed favorably to resolution. As the refinement statistics (Table S2) indicate, this suite of structures represents significantly improved models of ETS/DNA complexes.
Among the WT PU.1/DNA complexes, 1H (PDB: 8E3K) and 3L (PDB: 8EE9) represent the extremes in affinity (Figure 2B). A cluster of residues (R171, L172, W213, K217, A231, Y235) from the termini of H1, H2, and H3 make backbone contacts with 3'-flanking DNA in both complexes. These residues suggest a role for electrostatic interactions in a hydrophobic environment in the indirect readout of the 3'-flanking bases. Two additional contacts (N234 and R220) in 1H miss their cutoff in 3L due to a narrower minor groove along the 3'-flanking bases. The PU.1-bound DNA exhibited a distinct distribution in atomic mobility as judged by their crystallographic B factors. In both complexes, the 5'-flanking region was more mobile than average, while the 3'-flanking region was less mobile. However, the B factors of the low-affinity 3L sequence were more broadly distributed than 1H. We observed similar trends in B factor distributions (interquartile ranges) between pairs of high- and low-affinity 3'-flanking variants (1H/1L and 3H/3L; PDB: 8EBH for 1L and 8E3R for 3H), but only for the DNA (Figure 2C), suggesting overarching principles at work in the indirect readout of the 3'-flanking bases.
To gain insight into the DNA perturbations, we examined the roll angle, which describes the angular opening of the long edge of the base step (Figure 2D). Roll deformation is characteristic of smooth groove bending known as writhe.34 On the 3' side of the binding site (5'-GGAA-3' strand), the roll trajectories sorted strictly by binding affinity (1H/3H vs. 1L/3L) in step with a corresponding divergence in minor groove width. In contrast, the roll trajectories on the 5' side did not cluster by affinity or sequence identity (1H/1L vs. 3H/3L). These observations indicate strong local DNA deformation by PU.1, as conformational changes in one flanking region do not influence the other along the DNA.
Since complex formation involves local DNA deformation by PU.1 and affinity-dependent redistribution of B factor along the DNA, flexibility might be important in selection of the 3'-flanking bases. To address this notion further, we examined literature data on sequence-dependent DNA flexibility relevant to protein-induced DNA bending (Figures 2E and S2): experimental reactivity to DNase I,35 which bends and widens the minor groove for catalytic hydrolysis, and molecular mechanics to slide,36 a major coupled parameter to roll angles.37 Both metrics indicate that the 3'-flanking base steps in 1H and 3H (GTG) were more flexible than TGG in 1L and 3L, in agreement with the locally higher B factors in the 3' flank of 1H and 3H. Differential flexibility in the 3'-flanking base steps therefore supports propensity of DNA structure to yield as the basis of indirect readout by PU.1. These structural perturbations facilitate, in part, the partial insertion of R220 at the loop adjoining H2 and H3 into the minor groove and position N234 in H3 close to the 3'-flanking bases (Figure 2B). Both contacts are more closely made in 1H than in 3L.
Sidechain disorder at Q226 marks high-affinity PU.1/DNA binding
A comparison of 1H and 3L showed similar backbone (z-normalized) B' factors with distinct foci of differences (Figures 3A and S3A). Modeling a single copy of the 1H complex by molecular dynamics simulation showed backbone fluctuations that are in reasonable agreement with the experimental B factor profile (Figure S3B). To gain further insight into the B' factor profiles, we carried out a principal-component analysis that revealed a basis B' factor profile that segregated the high-affinity complexes (1H and 3H) from their low-affinity counterparts (Figures S3C and S3D). Residues whose B' factors segregated high- and low-affinity binding were mostly engaged either in crystal contacts with 3'-flanking DNA in a neighboring complex or with protein sidechains of a neighbor near its 3'-flanking DNA (Figures S3E and S3F). High-loading residues that were not crystal contacts consisted of N234 (Figure S3H) and those in the β sheet S3 (Figure S3I), which contacted the DNA backbone in the 5'-flanking region. In summary, observed differences in protein backbone B factors report on local contacts with DNA whose own B factors diverged in the high-vs. low-affinity complexes (c.f., Figure 2B). B' factor differences distal from the DNA in the asymmetric unit arise from crystal contacts near a neighboring 3'-flanking DNA.
Figure 3. Alternate conformations of a critical glutamine residue in the recognition helix marks high-affinity DNA binding by PU.1.

(A) Comparison of the backbone B factors for ΔN165 in the high- and low-affinity complexes 1H and 3L. B factors are normalized to Z scores (B' factors) and their differences mapped to the structure. Internal residues with the most divergent B' factors are labeled. See also Figure S3.
(B) Sidechain conformations of Q226 with 2mFo-DFc maps at the indicated cutoffs. In addition to excess disconnected electron densities, the density around Q226 in high-affinity complexes diminishes more markedly with increasing σ than low-affinity counterparts. See also Figure S4.
(C) Occupancy of the down conformation of the Q226 sidechain in four independent co-crystals of 1H. The dashed envelope is a binomial fit to the data.
(D) The solution NMR ensemble of the unbound ETS domain (PDB: 5W3G), consisting of 10 models ranging in conformation for Q226. The relative conformational energies of the models were estimated by molecular mechanics methods and sorted by energy.
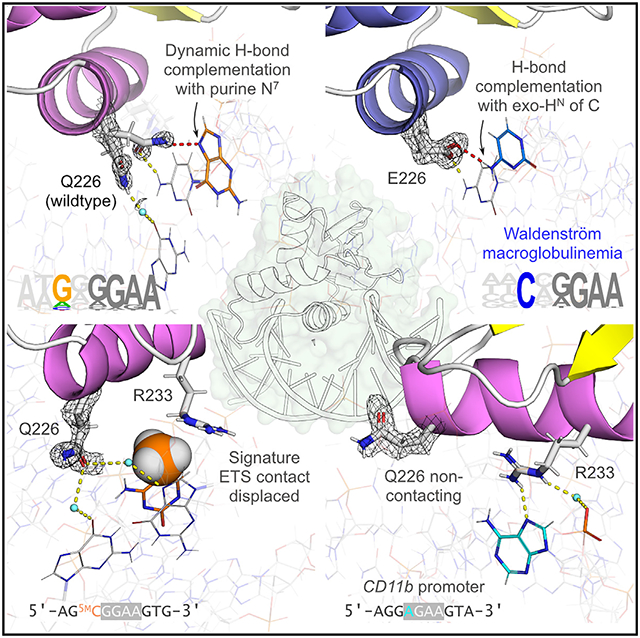
(E) Interactions of alternate Q226 conformations with DNA. In 1H, the up conformation connects both core and flanking bases in a network involving R233, but the down position does not present compatible geometry to interact with R233.
(F) Replacement of G at position −2 with 7-deaza-G in the 1H sequence, which denies H-bonding at position 7, reduced binding to low-affinity levels. Points represent mean ± SD of three technical replicates.
With respect to the sidechains, several residues involved in crystal contacts exhibited electron densities (2mFo-DFc maps) that indicated alternate occupancies. The standout exception was Q226, which was well isolated from crystal contacts and showed sidechain occupancies that varied in a strongly affinity-dependent manner. In the high-affinity complexes 1H and 3H, the 2mFo-DFc map near Q226 persistently showed excess electron densities in addition to the extended density of the sidechain (Figure 3B). In contrast, their low-affinity counterparts (1L and 3L) showed only single continuous densities for Q226 sidechains emanating from the backbone. Three more independently co-crystallized 1H complexes reproduced the partitioning in fitted conformations (0.52 ± 0.03 for the down conformation) (Figure 3C). The excess densities around Q226 were not geometrically compatible with ordered water (Figures S4A and S4B), and we eliminated the possibility of an acetate by solving an identical structure crystallized in an acetate-free solution (Figure S4C; PDB: 8E5Y). To assess whether the alternate occupancies in the high-affinity complexes represented innate conformational dynamics, we examined a structural ensemble of unbound PU.1 as resolved by solution NMR spectroscopy.38 The models presented a range of Q226 conformations that spanned the fitted alternate conformations from the high-affinity 2mFo-DFc maps (Figure 3D). An estimation of the relative energy of the NMR ensemble showed that an up-like conformation was preferred in the unbound state, implying that enforcement of down conformations in low-affinity complexes represents an energetic cost to DNA binding.
Proceeding to compare the contacts made by the alternate Q226 conformations (Figure 3E) in 1H and 3L, both complexes share one occupancy of Q226, extending down into the DNA major groove and contacting O6 of G at position −1 (on the 5'-CCTT-3' strand) via a bridging water. In contrast, the alternate up conformation in 1H directly contacts G (N7) and C (exocyclic NH2) at flanking positions −2 and −1 on the 5'-GGAA-3' strand, as well as a water-mediated contact with G (O6) in the core consensus (position 0). This core G is also contacted by R233, a signature residue of the ETS domain. These features suggested that the up conformation contributed to high-affinity binding by 1H. In support of this, we encountered a pair of complexes, 2H (PDB: 8E4H) and 2L (PDB: 8EJ6), with identical 3'-flanking variation as the 1 and 3 series. The 2mFo-DFc maps of Q226 in 2H and 2L were more similar, and their binding affinities were correspondingly less divergent than their 1- and 3-series counterparts (Figure S4D).
In addition to the coupling with R223, the hydrogen bond (H-bond) complementarity between the amide NH of Q226 and N7 of guanine (a strict H-bond acceptor) immediately suggested a basis for the selectivity for a purine at the 5'-flanking position −2 (G in 1H/L, A in 3H/L). To determine whether this N7 contact was essential, we measured binding by WT ΔN165 to a modified 1H sequence in which the G at position −2 was replaced by 7-deaza-dG (Figure 3F). Absolute denial of H-bonding at atomic position 7 of G−2 in an otherwise optimal DNA site reduced affinity to levels observed in 1L and 3L. This observation explains not only the preponderance of G at position −2 of class III motifs but also the relative preference over A.6 In the 3H complex, the excess electron densities around Q226 suggested an additional up conformation (Figure S4E), but only the 1H-like conformation is within direct H-bonding distance from the purine.
Q226 enforces DNA specificity of PU.1
In the extant PU.1/DNA structure (1PUE; Figure S5A), which harbors a Q226E mutation,39 the Glu sidechain occupies down conformations in complex with a high-affinity DNA site.40 In a ternary DNA complex with the DBD of IRF4,22 another PU.1 with the same mutation similarly adopts a down conformation in complex with the IB motif (i.e., 3H) (Figure S5B). As neither structure represents WT PU.1 but that of a pathogenic mutant,23 there is a need to clarify the properties of E226 vis-à-vis Q226.
To enable meaningful comparison with the WT complexes, we solved corresponding structures of the Q226E mutant of ΔN165 in complex with the high-affinity 1H and low-affinity 3L sequences. The Q226E co-crystals, 4H (PDB: 8EMD) and 4L (PDB: 8EK3), exhibited similarly high quality and identical packing to their WT counterparts (Table S2). The sidechains of E226 in 4H and 4L occupy exclusively down conformations but 4L did so in two roughly equal occupancies (Figure 4A). To add confidence in the absence of up conformations of E226, we solved another Q226E complex (4H2) bound to the high-affinity λB motif (3H), and again observed only down occupancy (Figure S5C). In both 4H and 4L, E226 contacted G at position −2 via ordered water and coupled with R233 as in 1H and 3H. The alternate down conformations in 4L neither contacted G−2 nor coupled with R223 in favor of a contact with a consensus C residue in the 5′-CCTT-3′ strand instead. The Q226E mutant thus formed sequence-dependent DNA interfaces that differed from WT. Modeling the 1H and 4H complexes by explicit-solvent MD simulations presented dynamics consistent with the crystallographic models: greater sidechain dynamics for Q226 and multimodal H-bonding histograms with G−2 absent in E226 (Figure S6).
Figure 4. The Q226E mutation fundamentally alters DNA selection by PU.1.

(A) ΔN165(Q226E) in complex with the high- and low-affinity DNA 1H and 1L, respectively. In 4L, E226 exhibited occupancies best fitted by down conformations. 2mFo-DFc maps are rendered at 1.0 σ. Arrows mark the N7 atom of G−2. See also Figures S5A, S5C, and S6.
(B) Direct DNA binding by WT ΔN165 and Q226E. Points represent mean ± SD of three technical replicates.
(C) Competition titrations comparing Q226E binding to high- and low-affinity DNA. Points represent mean ± SD of three technical replicates.
(D) Summary of genomic localization of full-length WT and Q226E PU.1 in HEK293T cells.
(E) The most highly enriched motifs bound by WT and Q226E from a de novo motif analysis. The −2 position flanking the 5' end of the core consensus is boxed. Affordance for cytosine at this position is characteristic of other ETS members such as the class II ETV subfamily.6
(F) Q226E in complex with 5'-flanking cytosines. The E226 sidechain shows full occupancy in the up conformation and contacts the exocyclic NH2 of cytosines. See also Figure S5D.
(G) Enrichment of sites containing 5'-GGAA-3' in WT-bound relative to Q226E-bound genomes. Unique sequences were sorted in decreasing order of abundance. The ordinate represents the difference of the ordered sequence counts for WT PU.1 over Q226E. The motifs summarize the subset of WT sequences indicated by the highlighted colors. The −2 position is marked with asterisks.
In direct binding assays, Q226E exhibited qualitatively identical behavior (i.e., negative cooperative two-site binding with respect to DNA site24,41) to WT PU.1 (Figure 4B). However, the low-affinity Q226E complex 4L showed ~10-fold stronger affinity than WT 1L (Figure 4C). The resultant specificity ratio (4H:4L) for Q226E was ~10, a window that was significantly narrower than the ~103-fold difference for WT ΔN165 toward the same DNA (1H:1L). The Q226E mutant thus presented binding and structural properties that were neither fully high nor low affinity as discerned by WT PU.1. This suggests that Q226 in the WT complex regulates specificity by suppressing binding to non-preferred class III sequences.
To resolve these possibilities in the genome, we carried out cleavage under targets and tagmentation (CUT&Tag) experiments in HEK293T cells following transient transduction with expression plasmids encoding Q226E or a WT PU.1 control. Both constructs achieved similar levels of binding with each occupying ~20% of sites that were excluded by the other (Figure 4D). De novo motif analysis revealed strong enrichment of cytosine at the −2 position in Q226E-bound DNA relative to WT (Figure 4E). To establish the structural basis of this switch, we solved a Q226E complex with 5'-flanking cytosines (4C; PDB: 8EQL). In this complex, the E226 sidechain presented a fully occupied up conformation in which the carboxylate, which lacked H-bond donors, was complemented by H-bond donors from the exocyclic NH2 of the cytosines (Figure 4F). In contrast, Q226 in the WT complex with the same sequence showed full occupancy in a down conformation and contacted C−2 via bridging water (complex 1C; PDB: 8EQK) Figure S5D). The specificity of DNA selection by PU.1 is thus strongly sensitive to the H-bond donor/acceptor polarity between Q226 and the 5'-flanking DNA residue at position −2. Bridging hydration, acting as H-bond adapters, compromises specificity by relaxing the stringency of H-bond complementation.
The altered genomic selectivity by Q226E in HEK293T cells recalled similar results in Q226E-transudced B cells (OCI-Ly10).23 Since HEK293T cells are not hematopoietic in origin, the motif analyses support the observed selectivity as intrinsic to PU.1, rather than modulation by other lineage-restricted binding partners. To gain further insight into the change in selectivity, we examined the distribution of decameric sequences containing a central 5'-GGAA-3' core to mimic the ensemble of PU.1-binding sites. Although the diversity of unique sequences for both species was equal to within 0.5% (total 9.8 × 10³), WT PU.1 was differentially enriched in the most abundant unique sequences relative to Q226E (Figure 4G). Resolution of these motifs revealed marked preference for purines at −2 among the most overall-enriched unique sequences bound by WT PU.1. Thus, the Q226E mutation relaxes DNA selectivity by diverting occupancy from purine-rich binding sites to secondary sites harboring cytosine at the −2 position.
Structural coupling of Q226 and R233 confers sequence discrimination
A distinctive feature in high-affinity complexes of WT PU.1 (1H and 3H) as well as the Q226E complexes (4H and 4L) is the linkage by ordered water of Q226 and R233. R233 is one of the two conserved Arg residues (the other being R230) found in all ETS domains. This linkage, which is absent in low-affinity complexes, suggests that the two residues might cooperate in DNA selection by PU.1. To test this hypothesis, we reasoned that the Q226-R233 linkage could be disrupted by a non-H-bonding steric substituent in the major groove, such as the 5-methyl of a pyrimidine in the 5'-flanking region. We therefore solved the structures of an isomeric variant of 3H (5T: 5'-AATGGAAGTG-3'; PDB: 8EKJ), which presents such an obstacle, and its non-methyl version, 5U: d(AAUGGAAGTG) (PDB: 8EQG) (Figure 5A).
Figure 5. Control of PU.1/DNA binding in the 5'-flanking region: Importance of the Q226-R233 couple.

(A) Paired structures of two complexes in which a 5-methyl substituent of one (5T) sterically displaces the water-mediated linkage of Q226 and R233, and its non-methyl counterpart (5U). The 5-methyl of T−1 and H of U−1 are rendered as van der Waals (vDW)-sized spheres. In 5T, the arrow marks O6 of the core G0 residue, which is normally contacted by R233. In 5U, the arrow marks O8 of U−1, which H-bonds with the ordered water otherwise contacted by Q226 in high-affinity complexes.
(B) DNA binding by 5T, 5L, and 5U. Points represent mean ± SD of three technical replicates.
(C) Structural alignment of 5T and 5U showing the local deformation in DNA structure at the methylated position in 5T. See also Figure S7.
(D) Co-crystal structures of hemi- (6F and 6R) and dimethylated CpG variants (two views of 6D) of the high-affinity 1H complex. The 5-methyl groups in the 5mC residues are rendered as spheres.
(E) DNA binding of the CpG-methylated complexes. Points represent mean ± SD of three technical replicates.
In 5T, the 5-methyl of the 5'-flanking T knocked R233 out of position and contact with O6 of leading G in the core consensus. The displacement was confirmed in the 5U complex, in which R233 maintained the usual conformation and contact with the same G residue. Interestingly, Q226 in 5U also assumed full occupancy in the down conformation and did not couple with R233. This might be due to stabilization by an unusual contact between U−1 and the ordered water connecting Q226 in high-affinity structures, which was absent in other models harboring pyrimidines at the −1 position. In binding assays, 5T was bound 10-fold more weakly than 5U (Figure 5B), and the steric impact of the 5-methyl substituent on the DNA backbone was evident around T−1 (Figure 5C). To directly interrogate the Q226-R233 linkage in affinity negotiation, we solved an analog of 5T with the same 3'-flanking variation (GTG → TGG) as the low-affinity complexes. The conformations and occupancies of Q226 and R233 in this complex (5L; PDB: 8EKU) were indistinguishable from 5T (Figure S7), with correspondingly similar binding affinities (Figure 5B). Coupling of Q226 and R233 was therefore essential to the recognition of 3'-flanking base variants.
Our observations of 5T suggest that the same principle might govern the chemically homologous situation with methylated CpG dinucleotides, which repress PU.1-dependent transactivation (Figure 1C). We and others42 have previously reported on the strand-specific effect of CpG methylation, without the benefit of experimental structures, on DNA binding by PU.1. The methylation-sensitive sequence 1H, which harbors a single CpG, could be hemi-methylated on one or the other strand (6F; PDB: 8ENG/6R; PDB: 8EO1), or be dimethylated on both strands (6D; PDB: 8EO4). The solved co-crystal structure of 6F recalled the scenario in 5T (Figure 5D): 5-methylcytosine forced R233 to flip out, breaking its coupling with Q226. The single down occupancy of Q226, notwithstanding the availability of the N7 of G−2 and the exocyclic NH2 of 5mC for H-bond complementation, recapitulated the requirement for coupling with R233 in enabling up conformations of Q226. In 6R, hemi-methylation of the reverse strand was far less perturbative, preserving the high-affinity pattern of contacts (including the Q226-R233 linkage) seen with the unmodified sequence 1H. These structural differences were reflected in the binding affinities for the two hemi-methylated DNAs (Figure 5E). In contrast, affinity for the dimethylated sequence, which was intermediate of the hemi-methylated counterparts, corresponded to a qualitatively different interface in 6D. With the linkage to the flipped-out R233 broken, the Q226 sidechain made novel DNA contacts in two major occupancies via strictly water-mediated interactions (Figure 5D). The sharp contrasts between 6D and 6R in structure and affinity showed that methylation of the reverse strand exerted pleiotropic effects through DNA structure, in contrast with the steric effects of methylation in the forward strand.
Non-canonical DNA targets of PU.1
Along-standing enigma in DNA selection by PU.1 and other type III factors are non-canonical complexes formed with sequences that do not contain the 5'-GGAA-3' consensus. Bioinformatically, DNA motifs attributed explicitly to PU.1 and other class III ETS members are generally more specific to the 5'-GGAA-3' consensus than other classes of ETS factors.6 The most common non-canonical ETS target is the relaxed core 5'-GGAT-3', which is common among non-class III motifs but is strongly disfavored by PU.1.6,43 To explain this difference, we solved a variant 1H complex harboring a 5'-GGAT-3' core, termed 7 (PDB: 8EKV). Compared with 1H, the Q226-R233 couple in 7 was unusually perturbed (Figure 6A). While Q226 occupied a single down conformation, R223 exhibited two occupancies at a ~3:1 ratio (Figure 6B). The major occupancy was canonical insofar as it contacted G0 in the core and maintained a water-mediated contact with Q226. However, in the minor occupancy, the R233 sidechain was retracted and beyond reach of Q226 or direct DNA readout, salt bridging only with a backbone phosphate. In-solution binding reported a loss of affinity over 102-fold relative to 1H, consistent with these structural defects. Importantly, a putative role for N234 in specifying a preference for the canonical core6,43 is refuted by complex 7 (Figure 6C). The Q226-R233 couple thus represents the key feature that over-sensitizes PU.1 to the 5'-GGAT-3' core relative to non-class III members.
Figure 6. DNA complexes of PU.1 with non-canonical DNA sites.

(A) Comparison of the key residues Q226 and R233 in complex with the non-canonical sequence 5'-AGCGGATGTG-3' (7) and canonical 1H. The DNA and ordered hydration are omitted for clarity.
(B) DNA contacts by the two resolved occupancies by R233 in complex 7, together with its titration profile. Points represent mean ± SD of three technical replicates.
(C) N234 determines affinity but not specificity in DNA recognition by PU.1. N234 in both 1H and its 5'-GGAT-3' analog (7) contacts the complement of the altered base via an ordered water molecule, acting as a universal H-bonding adapter. It has also been shown that the point mutation N234A is sufficient to abolish high-affinity binding by PU.1.56
(D) The proximal fragment (−35/−5) of the CD11b promoter. Brackets indicate the reported DNase I footprints for PU.1.44 Co-crystal structures of ΔN165 bound with DNA sequences sampling various windows of the full CD11b fragment were aligned by the proteins. Alignment of the protein-bound DNA sequences reveals the target sequence −24/−15: AGGAGAAGTA. Open boxes correspond to non-CD11b bases derived from the cassette needed for crystallography. In the aligned complexes, only the purine-rich strand was colored for clarity. See also Table S3.
(E) The 8-series of CD11b complexes. 2mFo-DFc maps are rendered at the 1.0 σ level. Co-crystal 8 exhibits two complexes per asymmetric unit. The electron density Q226 in one of the 8 complexes is very low and, considering the flipped-out conformation in the other complex as well as co-crystals 8A and 8B, its conformation in that complex should be considered indeterminate.
(F) Titration profiles for the full CD11b promoter and the localized site centered between positions −24/−15. Points represent mean ± SD of three technical replicates.
(G) Preference for purine-rich genomic DNA by WT PU.1 over Q226E, which exhibits increased pyrimidine tolerance in terms of length of purine tracks (left) or pyrimidine content in 10-bp tracks. Points represent the mean ± SD of a bootstrapping procedure that randomly sampled 10% of the data.
In addition to the 5'-GGAT-3' complex, a non-canonical PU.1 site is found in the CD11b promoter, another major myeloid target under PU.1 control. Like CSF1R, the essential PU.1-binding site in CD11b is located near the TSS. Previous biochemical investigations have localized PU.1 binding between −35 and −5 (Figure 6C), with 5'-AAAGGAGAAG-3' proposed as the putative binding sequence.44 Initial attempts to crystallize ΔN165 with DNA fragments encoding the reported sequence, termed 8 (PDB: 8EK8), yielded crystals that exhibited a different space group (P21 21 21) and significantly poorer resolution (2.6 Å). The resultant structure showed the protein engaging the DNA two bp downstream along the purine-rich strand, with an apparent 5'-AGAA-3' core. Following this clue, we shifted the binding site by 2 bp and obtained structure 8A (PDB: 8EKZ) with similar crystallographic properties as the other high-resolution structures. In searching for other potential binding sites (Table S3), we crystallized another structure 8B (PDB: 8EM9) in which the DNA sequence was shifted further downstream by 1 bp. The protein bound the DNA at the 5'-AGAA-3' core in yet another space group, P32 and with poorer resolution (2.3 Å). As an overlay of all three CD11b-based models and their co-crystallographic properties demonstrate (Figure 6D), the authentic PU.1-binding site in the proximal CD11b promoter was the highly non-canonical sequence: 5'-AGGAGAAGTA-3'.
Examination of the protein/DNA interface of 8A revealed yet again disruption of the Q226-R233 couple. In another unusual pose (Figure S13), the sidechain of Q226 was flipped completely out of the interface. Nevertheless, R233 remained essentially in canonical contact with the core, in this case with N7 of an A residue. The involvement of N7 may allow interchangeable purine residues at the 0 position. To evaluate non-canonical CD11b-based binding (Figure 6E), we determined the in-solution affinity of the full CD11b fragment (−35/−5). The full CD11b fragment exhibited high affinity (KD ~ 2 nM) that surpassed the 5'-GGAT-3' sequence (7). Binding to the truncated aligned site (in the sequence cassette used for other sites) yielded an affinity ~10-fold weaker and similar to the 5'-GGAT-3' site.
Together with the large DNase I footprint over the CD11b promoter (Figure 6C) indicating diffuse occupancy around the 5'-AGAA-3' site, the affinity difference between the full and truncated CD11b sequence suggests a significant contribution from more distal flanking sequences, which are highly enriched in purines. To test this hypothesis, we mined the CUT&Tag data on two measures of preference for flanking purines (Figure 6F). First, WT PU.1 was significantly more selective for consecutive purine tracks up to at least 50 bp than Q226E, the more pyrimidine-tolerant mutant (c.f., Figure 4E). In a second measure, WT PU.1 is markedly intolerant to even low levels of pyrimidine content in DNA compared with Q226E, becoming less selective than Q226E for DNA containing over just 20% pyrimidine. Affinity enhancement by flanking purines thus appears to be general and recalls the amplification in promoter transactivation at the POMP site vs. the λB motif (3H; Figure 1B). This property is intrinsic to the PU.1 ETS domain and requires no recruitment of protein partners, as demonstrated by titrations of purified ΔN165 in Figure 6F. Structurally, the 8 series of CD11b co-crystals argue against random flanking purines acting as other non-canonical sites, as they were discretely rejected in favor of a single well-bound site. Purine-rich flanking sequences may therefore promote translocation of the protein, and/or rebinding of dissociated protein, to the specific site.
DISCUSSION
Binding affinity is an essential attribute of PU.1 function. Not only does affinity correlate with genomic occupancy45 but we have now shown that it establishes the intrinsic threshold for factor-dependent transactivation in a CSF1R promoter model. A suite of 22 very-high-resolution structures has clarified the molecular mechanism of DNA selection by PU.1. DNA readout is gated by Q226, a class III innovation in the ETS family, which dynamically H-bonds with N7 of a purine at the −2 position. The nature of N7 as strictly an H-bond acceptor is uniquely complemented by the H-bond donor in the Gln amide sidechain. Abrogation of high-affinity binding by 7-deaza substitution at this 5′-flanking position confirms this essential contact. Although ordered water can substitute as H-bond adapters, such as observed in the Q226E mutants (including the extant PU.1/DNA structures), it alters the base preference at position −2 to a cytosine, which can supply the H-bond donor to E226 and engenders overlap with binding motifs of other classes in the ETS family. This breakdown in stringency of H-bond donor/acceptor complementation underpins altered DNA binding of Q226E in Waldenström macroglobulinemia.
A more general insight arising from the complementarity-based mechanism in PU.1 is the strict correspondence between an acidic homolog of Q226 in all non-class III members of the ETS family on the one hand (Figure 7A) and the preponderance of cytosine at the −2 and −1 positions in their DNA-binding motifs on the other (Figure 7B).6 As in the Q226E complex 4C, an NMR structural ensemble of the Ets1/DNA complex46 shows a glutamate (E387) dynamically H-bonding with one or more 5′-flanking cytosines (Figure 7C). Interestingly, ETS domains carrying aspartate, whose sidechain is one C atom shorter, also prefer 5′-flanking cytosines. Further DNA distortion to enable direct aspartate-cytosine H-bonding is not supported by available models such as the class IV member prostate-derived Ets factor (PDEF; Figure 7D).47 As bridging water does not enforce H-bonding polarity, we considered potential long-range charge-dipole interactions with nucleobases. As an estimate, quantum mechanical calculations of isolated deoxynucleosides show that the dipole moment of deoxycytidine is the strongest and most favorably directed (partially positive end) toward the Asp or Glu carboxylate in the major groove (Figure 7E). While the dipole moment magnitude and direction can be expected to be modified in a base pair and stacked in a helix, the large differences among the four bases suggest that acidic residues in non-class III members may favor cytosine as the default 5′-flanking bases through charge-dipolar interactions, reinforcing the importance of Q226 as an evolutionary innovation of the class III relatives.
Figure 7. Selection of 5′-flanking bases by non-class III members of the ETS family.

(A) Sequence alignment of the human ETS domains, sorted by the four classes.
(B) Binding motifs of the first listed member in each class as curated in the CIS-BP database.57
(C) One model in the NMR ensemble of the Ets1/DNA complex in which E387 H-bonds with the exocyclic NH2 of two 5′-flanking cytosines. Several other models show only one or the other cytosine being contacted.
(D) DNA-bound PDEF, whose aspartate (D303) does not reach 5′-flanking bases in the 5′-GGAA-3′ strand.
(E) Dipole moments (in debyes) of the four deoxynucleosides, which have been geometry optimized by density functional theory methods at the ωB97X-D/6-311+G(3df,2p) level. The tails of the arrow denote the partial-positive end.
The role of dynamics in the negotiation of binding affinity by ETS transcription factors continues to be elucidated. As ETS domains are non-uniformly stringent in base specification over their DNA motifs, a reasonable expectation is that binding affinity reflects the balance of distributed interactions over the bound DNA. Contrary to this expectation, sequence features are parsed locally but integrated centrally at a critical nexus by PU.1, consisting of a dynamic Q226 in cooperation with R233, as demonstrated by the matched pairs of 3'-flanking base variants, xH/xL (x = 1 to 3). The dynamics of the Q226 sidechain, as discerned through crystallographic disorder, were heterogeneous in intensity as well as conformation but nevertheless track with binding affinity, suggesting a high degree of fine-tuning. Steric disruption of the nexus, such as by the 5-methyl moiety of T at the −1 position, breaks down the transduction of sequence readout. An altogether different mechanism of negotiation of binding affinity by a nexus of residues was recently reported for Ets-1, a class I member.48 In that system, sequence information is transduced by a DNA-sensing Arg residue to an allosteric salt bridge that controls affinity by gating solvent exposure of an underlying hydrophobic patch.
DNA sequence-directed changes in bound protein have been suggested as the link to protein-protein partnerships in combinatorial control of gene expression.49-51 The structural diversity of sequence-directed protein conformations is well described for transcription factors with multipartite DBDs and quaternary structure, such as nuclear receptors52,53 and the Pit-Oct-Unc (POU) family.54 For monopartite DBDs lacking quaternary structures, which include most ETS-family proteins, their mechanisms of perturbations by DNA, particularly as a discrete function of DNA sequence, remain unresolved questions. Whole-genome and functional studies continue to highlight the qualitative non-equivalence of high- and low-affinity ETS/DNA complexes in binding partner recruitment at the molecular level55 and transcriptional outcome at the organismal level.12,13 These properties imply a divergence in high- and low-affinity binding that defies simple explanations based on thermodynamic mass action and heterotypic cooperativity. Beyond a definitive clarification of target selection, explicit studies on intrinsic affinity such as for PU.1 should therefore contribute foundationally to our understanding of gene regulation in humans and other high-order eukaryotes.
Limitations of the study
The constructs used in the crystals contained, in addition to the minimal ETS domain (residues 169–258), the 12-residue C terminus from full-length PU.1. Since the C terminus was not resolved in any of the structures, it was presumably disordered in the crystal. Disorder in this terminus was also observed in the NMR ensemble of the unbound ETS domain of murine PU.1, which differed from the human ortholog by a single residue in the fourth-to-last position (−LPPH instead of −HPPH). We have previously reported that this C-terminally disordered region couples homo-dimerization to DNA binding by ΔN165.24 Whether this behavior is mediated by purely entropic effects of intrinsic disorder or some interactions with the ordered ETS domain remains unresolved by the current structures.
STAR★METHODS
RESOURCE AVAILABILITY
Lead contact
Further information and requests for resources and reagents should be directed to and will be fulfilled by the lead contact, Gregory Poon (gpoon@gsu.edu).
Materials availability
Plasmids generated in this study are available upon request to the lead contact or Addgene after the date of publication pending deposition.
Data and code availability
Co-crystallographic PU.1/DNA structures and electron densities have been deposited at wwPDB and are publicly available as of the date of publication. Accession numbers (8E3K, 8EBH, 8E5Y, 8EQK, 8E4H, 8EJ6, 8E3R, 8EE9, 8EMD, 8EJ8, 8EK3, 8EQL, 8EKJ, 8EKU, 8EQG, 8ENG, 8EO1, 8EO4, 8EKV, 8EK8, 8EKZ, 8EM9) are listed in Table S2; CUT&Tag data of full-length wildtype PU.1 and Q226E in HEK293Thave been deposited at GEO and are publicly available (GSE211518) as of the date of publication.
This paper does not report original code.
Any additional information required to reanalyze the data reported in this paper is available from the lead contact upon request.
EXPERIMENTAL MODEL AND STUDY PARTICIPANT DETAILS
Cell lines
HEK293T cells were cultured in DMEM medium supplemented with 10% heat-inactivated FBS and 1% penicillin/streptomycin. MOLM13 and THP-1 cells were cultured in RPMI 1640 medium containing the same supplements. Cells were maintained at 37°C under saturated humidity and 5% CO2. All cell lines were used as received from ATCC or DSMZ without further authentication, and were regularly tested for mycoplasma contamination. These cells express, following transfection or lentiviral transduction, D2EGFP and CyOFP1 under the control of a modified CSF1R and PGK promoter, respectively, as detailed below.
METHOD DETAILS
Reporter experiments
A gene encoding D2EGFP under the control of the 5' flanking region of the CSF1R gene (GenBank: S68887.1) was cloned into the lentiviral transfer vector pLJM1 (Addgene plasmid # 19319).58 The authentic PU.1 binding site located between −54 and −38 was replaced by a cassette matching a panel of DNA sites used to measure the binding affinity in solution. A constitutive CyOFP1 marker59 was added for gating transduced cells and normalization of transduction efficiency. The modified vector was termed pLJM2a. Ten μg of pLJM2a plasmids were transfected into HEK293T cells seeded in 100 mm culture dish with helpers (10 μg psPAX2 and 4 μg pMD2.G) using Lipofectamine 2000 (Invitrogen) or JetPrime reagent (PolyPlus). Virus-containing supernatant was collected at 48 h after transfection, filtered, and transduced into MOLM13 or THP-1 cells using TransDux reagent (System Biosciences) or polybrene following the manufacturer’s instructions. Following 3 days of puromycin selection, cells were analyzed on an LSRII (BD) or Moxi GO II (Orflo) cytometer. FSC- and SSC-gated, DAPI-negative cells were quantified for GFP and CyOFP1 fluorescence using FlowJo (BD).
Nucleic acids
Unmodified deoxynucleotides and double-stranded fragments encoding wildtype and mutant PU.1 constructs were synthesized by Integrated DNA Technologies (Coralville, IA) Oligos harboring 7-deaza-G were synthesized by Eurogentec (Seraing, Belgium). Under our optimized crystallization conditions, standard desalted DNA gave diffraction-quality crystals and trials with reverse-phase HPLC-purified DNA did yield further improvement. Strands were annealed in Buffer H.15 (10 mM HEPES, pH 7.4, with 0.15 M NaCl) by heating to 95°C in a 2 L water bath followed by passive overnight cooling.
Protein purification
A double-stranded fragment encoding the C-terminal 106 residues of wildtype human PU.1 (hPU.1 residues 165 to 270), termed ΔN165 [Figure S1A],24 or a Q226E mutant was cloned into the NcoI/HindIII sites of pET28b(+) without any vector-encoded tag. The plasmids were transformed into BL21(DE3)pLysS Escherichia coli. Cultures in LB medium were induced with 0.5 mM isopropyl β-d-1-thiogalactopyranoside at an OD600 of 0.6 for 16 h at 22°C. Harvested cells were re-suspended in Buffer H.5 (10 mM HEPES, pH 7.4, with 0.5 M NaCl) containing 1 mM PMSF and lysed by sonication. The lysate was cleared by centrifugation and loaded onto a HiTrap SP HP column (Cytiva) equilibrated with Buffer H.5. After washing, the protein was eluted along a linear NaCl gradient under the control of a Bio-Rad NGC instrument. Samples for co-crystallization were concentrated in Amicon Ultra-15 centrifugal filters and then polished and exchanged into H.15 buffer on a HiLoad 16/600 Superdex 75 column (Cytiva). Following qualification by SDS-PAGE [Figure S1B] and MALDI-ToF mass spectrometry [Figure S1C], PU.1 and Q226E mutant concentrations were determined by UV absorption at 280 nm based on an extinction coefficient of 22460 M−1cm−1.24
X-Ray crystallography
Purified protein was concentrated in Amicon Ultra-15 centrifugal filters (10,000 MWCO) and mixed with duplex DNA at 400 μM each in Buffer H.15 to yield a complex concentration of 200 μM. The complex was subjected to two different screens (INDEX HT and JCSGplus) of 96 well conditions each using the ART Robbins Gryphon Robot. Hit conditions were further optimized against a PEG concentration gradient in a manual screen. Crystals were grown for 5 days by vapor diffusion at 293 K in a 2 μL hanging drop comprised of a 1:1 mixture of protein:DNA complex with mother liquor containing 100 mM sodium acetate, pH 4.6, and 2% PEG 3350 (Figure S1D). Co-crystals formed over a nominal pH range from 4.5 to 5.4 gave identical molecular models, although pH 4.6 produced the best-diffracting samples. Prior to freezing, 2 μL of cryoprotectant solution containing 100 mM sodium acetate, 2% PEG 3350, and 20% glycerol was laid on top of the hanging drop and the well closed for 1 h of incubation (4 μL total volume, 10% glycerol concentration). After 1 h, crystals were transferred to the above 20% glycerol solution prior to freezing. X-ray diffraction data sets were collected at SER-CAT at the Advanced Photon Source, Chicago, IL, the Advanced Light Source at Lawrence Berkeley National Laboratory, Berkeley, CA, and the National Synchrotron Light Source II at Brookhaven National Laboratory, Upton, NY. Information regarding specific beamlines, detectors, collection wavelengths, and oscillation angles can be found in Table S2.
The diffraction data were processed using the XDS package60 and was scaled using Aimless in the CCP4 package.61 Molecular replacement was performed using a previous PU.1 co-crystal complex (PDB: 1PUE_E) as the search coordinates in the PHENIX suite62 via the maximum-likelihood procedures in PHASER. Rounds of refinement were then carried out using phenix.refine62 followed by model building in Coot.63 Models were refined to final Rfree and Rwork values between 0.12 and 0.20, with minimal bond and angular violations (Figure S1E). DNA helical parameters were computed using 3DNA.64 Crystallographic protein B-factors were normalized using BANΔIT.65
Molecular dynamics simulations
Explicit-solvent simulations were performed with the Amber14SB/parmbsc1 forcefields66 in the GROMACS 2020.2 environment. The refined co-crystal structure was used as initial coordinates of the wildtype PU.1/DNA complex as well as to template any point mutant. The solution NMR structure of unbound PU.1 was used for the free state. Each system was set up dodecahedral boxes at least 1.0 nm wider than the longest dimension of the solute, solvated with TIP3P water, and neutralized with Na+ and Cl− to 0.15 M. Electrostatic interactions were handled by particle-mesh Ewald summation with a 1 nm distance cutoff. All simulations were carried out at an in silico temperature and pressure of 298 K (modified Berendsen thermostat)67 and 1 bar (Parrinello-Rahman ensemble). A timestep of 2 fs was used and H-bonds were constrained using LINCS. After the structures were energy-minimized by steepest descent, the NVT ensemble was equilibrated at 298 K for 1 ns to thermalize the system, followed by another 1 ns of equilibration of the NPT ensemble at 1 bar and 298 K. The final NPT ensemble was simulated without restraints for 2.0 μs, recording coordinates every 1 ps. Convergence of the trajectories were checked by RMSD from the energy-minimized structures, after corrections for periodic boundary effects. Triplicate production runs were carried out using different random seeds in the velocity distribution. For RMS fluctuation calculations, concatenated trajectories from the replicas were used. Other averages were expressed ±S.D.
Binding experiments
Affinities of protein/DNA binding in H.15 buffer at 25°C were determined by a fluorescence polarization assay as previously described.24 Fluorescence anisotropy measurements are computed as mean ± S.D. of triplicate or more experiments and fitted by non-linear least squares fit to binding models that have been extensively described.68 For convenience, details of the binding models are summarized in Supplemental Methods. Competitive binding was modeled to yield absolute dissociation constants, not IC50, with titrate (protein) concentrations and affinity for the labeled probe (measured in independent direct binding experiments) explicitly incorporated as inputs into the model.
CUT&Tag experiments
An expression plasmid encoding full-length hPU.1 as a C-terminal fusion with iRFP via a T2A peptide has been previously detailed.69 The Q226E mutant was cloned by replacing the hPU.1 component between the BshTI/BamHI sites of the wildtype plasmid. Plasmids were transfected into HEK293T cells and after 48 h cells (5 × 10⁵) were harvested and lightly fixed with 2% formaldehyde for 2 min in preparation for CUT&Tag.70 Briefly, cells were bound to Concanavalin A-coated beads (Bangs Laboratories) and incubated with the primary antibody (anti-PU.1) (Santa Cruz, sc-352) at 4°C overnight. Samples were then incubated with a secondary antibody (guinea pig α-rabbit (Antibodies Online, ABIN101961) followed by adding pre-loaded pA-Tn5 adapter complex (generated in house). Tagmentation buffer with MgCl2 was used to induce transposase fragmentation. DNA was extracted by phenol/chloroform/isoamyl alcohol and amplified with NEBNext HiFi 2× PCR Master mix and universal i5 and barcoded i7 primers for 13 cycles. AMPure XP beads (#A63880) were used for post-PCR clean-up of the libraries. Libraries were subject to 35 bp paired-end sequencing on the Illumina NextSeq 500 platform with 35 bp paired end reads on high output mode at the Einstein Epigenomics core. FASTQ files were generated using Picard Tools v2.17.1 with adapter trimming by Trim Galore! v0.3.7 and QC assessment using FASTQC v0.11.4. Motif analysis and peak annotation was performed using the HOMER package.71 Additional sequence analyses were performed and visualized as DNA logos using SeqKit72 and REDUCE,73 respectively. Data are publicly available at GSE211518.
QUANTIFICATION AND STATISTICAL ANALYSIS
OriginPro software was used for statistical analysis. Specific tests, sample sizes, and significance levels are specified in the figure legends and Results.
Supplementary Material
KEY RESOURCES TABLE
| REAGENT or RESOURCE | SOURCE | IDENTIFIER |
|---|---|---|
| Antibodies | ||
| Rabbit polyclonal anti-PU.1 | Santa Cruz | sc-352; RRID:AB_632289 |
| Guinea Pig anti-Rabbit IgG | Antibodies Online | ABIN101961; RRID:AB_10775589 |
| Bacterial and virus strains | ||
| E. coli Stable | New England Biolabs | C3040 |
| E. coli BL21(DE3)pLyS | ThermoFisher | C602003 |
| Chemicals, peptides, and recombinant proteins | ||
| hPU.1 ETS domain, residue 165 to 270 (ΔN165) | Addgene | 199796 |
| ΔN165 Q226E | This manuscript | N/A |
| Deposited data | ||
| CUT&Tag sequencing data for full-length wildtype PU.1 and Q226E in HEK293T cells | This manuscript | GEO: GSE211518 |
| Co-crystallographic PU.1/DNA structures and electron densities (mmCIF and MTZ) | This manuscript | For accession numbers, see main text or Table S2 |
| Experimental models: Cell lines | ||
| Human: MOLM-13 | DMSZ | ACC 554 |
| Human: THP-1 | ATCC | TIB-202; RRID:CVCL_0006 |
| Oligonucleotides | ||
| See Table S1 | Integrated DNA Technologies | N/A |
| 5′-d(GCGAATAA7–deazaGCGGAATGGAAACCG)-3′ | Eurogentec | N/A |
| Recombinant DNA | ||
| A2-csf1ra-cassette-pLJM2a | This manuscript | N/A |
| pMD2.G | Didier Trono | Addgene 12259 |
| psPAX2 | Didier Trono | Addgene 12260 |
| pLJM1-EGFP | Sancak et al.58 | Addgene 19319 |
| FL-hPU.1-wt-pcDNA3.1 | Munde et al.69 | N/A |
| FL-hPU.1-Q226E-pcDNA3.1 | This manuscript | N/A |
| Software and algorithms | ||
| CCP4 | CCP4 | https://www.ccp4.ac.uk/ |
| Phenix | Phenix Online | https://phenix-online.org |
| Coot | University of Cambridge | https://bernhardcl.github.io/coot/wincoot-download.html |
| PyMOL | Schrödinger | https://pymol.org |
| 3DNA | Lu et al.64 | http://web.x3dna.org/ |
| BANΔIT | Barthels et al.65 | https://bandit.uni-mainz.de/ |
| OriginPro | OriginLab | https://www.originlab.com/ |
| Spartan’20 | Wavefunction | https://www.wavefun.com/products |
| GROMACS | GROMACS | https://www.gromacs.org/index.html |
| FlowJo | BD Biosciences | https://www.bdbiosciences.com/en-us/products/software/flowjo-v10-software |
| Picard Tools | Broad Institute | https://broadinstitute.github.io/picard |
| Trim Galore! | Babraham Institute | https://www.bioinformatics.babraham.ac.uk/projects/trim_galore |
| Homer | UCSD | http://homer.ucsd.edu/homer |
| SeqKit | Shen et al.72 | https://bioinf.shenwei.me/seqkit |
| REDUCE | Roven et al.73 | http://reducesuite.bussemakerlab.org/ |
Highlights.
High-resolution PU.1 structures unveil the dynamic basis of DNA specificity
Single evolutionary innovation (Q226) determines PU.1’s distinct target profile
Basis of pathogenic Q226E mutation in Waldenstróm macroglobulinemia
The structures correct the crystallographic record on PU.1/DNA binding
ACKNOWLEDGMENTS
We thank the beamline staff at the Advanced Light Source at Lawrence Berkeley National Laboratory (Berkeley, CA), SER-CAT at the Advanced Photon Source (Lemont, IL), and NSLS-II at Brookhaven National Laboratory (Upton, NY) for their support during the X-ray data collections. S.J.T. was supported by a Leukemia and Lymphoma Society Fellowship, an NYSCF Druckenmiller Fellowship, and an Einstein Training Program in Stem Cell Research from the Empire State Stem Cell Fund through NYSDOH contract C3029266. U.S. holds the Edward P. Evans Endowed Professorship in Myelodysplastic Syndromes at Albert Einstein College of Medicine. The Endowed Professorship was supported by a grant from the Edward P. Evans Foundation. This investigation was supported by NIH grants GM111749 (to W.D.W.), CA253127 (to U.S.), GM137160 and HL155178 (to G.M.K.P.), and NSF grant MCB 2028902 to G.M.K.P.
INCLUSION AND DIVERSITY
We support inclusive, diverse, and equitable conduct of research.
Footnotes
DECLARATION OF INTERESTS
U.S. has received research funding from GlaxoSmithKline, Bayer Healthcare, Aileron Therapeutics, and Novartis; has received compensation for consultancy services and for serving on scientific advisory boards from GlaxoSmithKline, Bayer Healthcare, Celgene, Aileron Therapeutics, Stelexis Therapeutics, and Pieris Pharmaceuticals; and has equity ownership in and is serving on the board of directors of Stelexis Therapeutics.
SUPPLEMENTAL INFORMATION
Supplemental information can be found online at https://doi.org/10.1016/j.celrep.2023.112671.
REFERENCES
- 1.Jolma A, Yan J, Whitington T, Toivonen J, Nitta KR, Rastas P, Morgunova E, Enge M, Taipale M, Wei G, et al. (2013). DNA-binding specificities of human transcription factors. Cell 152, 327–339. 10.1016/j.cell.2012.12.009. [DOI] [PubMed] [Google Scholar]
- 2.Lambert SA, Jolma A, Campitelli LF, Das PK, Yin Y, Albu M, Chen X, Taipale J, Hughes TR, and Weirauch MT (2018). The human transcription factors. Cell 172, 650–665. 10.1016/j.cell.2018.01.029. [DOI] [PMC free article] [PubMed] [Google Scholar]
- 3.Vaquerizas JM, Kummerfeld SK, Teichmann SA, and Luscombe NM (2009). A census of human transcription factors: function, expression and evolution. Nat. Rev. Genet 10, 252–263. 10.1038/nrg2538. [DOI] [PubMed] [Google Scholar]
- 4.Rohs R, Jin X, West SM, Joshi R, Honig B, and Mann RS (2010). Origins of specificity in protein-DNA recognition. Annu. Rev. Biochem 79, 233–269. 10.1146/annurev-biochem-060408-091030. [DOI] [PMC free article] [PubMed] [Google Scholar]
- 5.Bushweller JH (2019). Targeting transcription factors in cancer - from undruggable to reality. Nat. Rev. Cancer 19, 611–624. 10.1038/s41568-019-0196-7. [DOI] [PMC free article] [PubMed] [Google Scholar]
- 6.Wei GH, Badis G, Berger MF, Kivioja T, Palin K, Enge M, Bonke M, Jolma A, Varjosalo M, Gehrke AR, et al. (2010). Genome-wide analysis of ETS-family DNA-binding in vitro and in vivo. EMBO J. 29, 2147–2160. 10.1038/emboj.2010.106. [DOI] [PMC free article] [PubMed] [Google Scholar]
- 7.Hollenhorst PC, Jones DA, and Graves BJ (2004). Expression profiles frame the promoter specificity dilemma of the ETS family of transcription factors. Nucleic Acids Res. 32, 5693–5702. 10.1093/nar/gkh906. [DOI] [PMC free article] [PubMed] [Google Scholar]
- 8.Hollenhorst PC, McIntosh LP, and Graves BJ (2011). Genomic and biochemical insights into the specificity of ETS transcription factors. Annu. Rev. Biochem 80, 437–471. 10.1146/annurev.biochem.79.081507.103945. [DOI] [PMC free article] [PubMed] [Google Scholar]
- 9.Delker RK, Ranade V, Loker R, Voutev R, and Mann RS (2019). Low affinity binding sites in an activating CRM mediate negative autoregulation of the Drosophila Hox gene Ultrabithorax. PLoS Genet. 15, e1008444. 10.1371/journal.pgen.1008444. [DOI] [PMC free article] [PubMed] [Google Scholar]
- 10.Kribelbauer JF, Rastogi C, Bussemaker HJ, and Mann RS (2019). Low-affinity binding sites and the transcription factor specificity paradox in eukaryotes. Annu. Rev. Cell Dev. Biol 35, 357–379. 10.1146/annurev-cellbio-100617-062719. [DOI] [PMC free article] [PubMed] [Google Scholar]
- 11.Wang J, Malecka A, Trøen G, and Delabie J (2015). Comprehensive genome-wide transcription factor analysis reveals that a combination of high affinity and low affinity DNA binding is needed for human gene regulation. BMC Genom. 16, S12. 10.1186/1471-2164-16-S7-S12. [DOI] [PMC free article] [PubMed] [Google Scholar]
- 12.Farley EK, Olson KM, Zhang W, Brandt AJ, Rokhsar DS, and Levine MS (2015). Suboptimization of developmental enhancers. Science 350, 325–328. 10.1126/science.aac6948. [DOI] [PMC free article] [PubMed] [Google Scholar]
- 13.Farley EK, Olson KM, Zhang W, Rokhsar DS, and Levine MS (2016). Syntax compensates for poor binding sites to encode tissue specificity of developmental enhancers. Proc. Natl. Acad. Sci. USA 113, 6508–6513. 10.1073/pnas.1605085113. [DOI] [PMC free article] [PubMed] [Google Scholar]
- 14.Hosokawa H, Ungerbäck J, Wang X, Matsumoto M, Nakayama KI, Cohen SM, Tanaka T, and Rothenberg EV (2018). Transcription factor PU.1 represses and activates gene expression in early T cells by redirecting partner transcription factor binding. Immunity 49, 782. 10.1016/j.immuni.2018.09.019. [DOI] [PMC free article] [PubMed] [Google Scholar]
- 15.Ungerbäck J, Hosokawa H, Wang X, Strid T, Williams BA, Sigvardsson M, and Rothenberg EV (2018). Pioneering, chromatin remodeling, and epigenetic constraint in early T-cell gene regulation by SPI1 (PU.1). Genome Res. 28, 1508–1519. 10.1101/gr.231423.117. [DOI] [PMC free article] [PubMed] [Google Scholar]
- 16.Wheat JC, Sella Y, Willcockson M, Skoultchi AI, Bergman A, Singer RH, and Steidl U (2020). Single-molecule imaging of transcription dynamics in somatic stem cells. Nature 583, 431–436. 10.1038/s41586-020-2432-4. [DOI] [PMC free article] [PubMed] [Google Scholar]
- 17.Antony-Debré I, Paul A, Leite J, Mitchell K, Kim HM, Carvajal LA, Todorova TI, Huang K, Kumar A, Farahat AA, et al. (2017). Pharmacological inhibition of the transcription factor PU.1 in leukemia. J. Clin. Invest 127, 4297–4313. 10.1172/JCI92504. [DOI] [PMC free article] [PubMed] [Google Scholar]
- 18.Bell CC, Fennell KA, Chan YC, Rambow F, Yeung MM, Vassiliadis D, Lara L, Yeh P, Martelotto LG, Rogiers A, et al. (2019). Targeting enhancer switching overcomes non-genetic drug resistance in acute myeloid leukaemia. Nat. Commun 10, 2723. 10.1038/s41467-019-10652-9. [DOI] [PMC free article] [PubMed] [Google Scholar]
- 19.McKenzie MD, Ghisi M, Oxley EP, Ngo S, Cimmino L, Esnault C, Liu R, Salmon JM, Bell CC, Ahmed N, et al. (2019). Interconversion between tumorigenic and differentiated states in acute myeloid leukemia. Cell Stem Cell 25, 258–272.e9. 10.1016/j.stem.2019.07.001. [DOI] [PubMed] [Google Scholar]
- 20.Wang S, Linde MH, Munde M, Carvalho VD, Wilson WD, and Poon GMK (2014). Mechanistic heterogeneity in site recognition by the structurally homologous DNA-binding domains of the ETS family transcription factors Ets-1 and PU.1. J. Biol. Chem 289, 21605–21616. 10.1074/jbc.M114.575340. [DOI] [PMC free article] [PubMed] [Google Scholar]
- 21.Pió F, Ni CZ, Mitchell RS, Knight J, McKercher S, Klemsz M, Lombardo A, Maki RA, and Ely KR (1995). Co-crystallization of an ETS domain (PU.1) in complex with DNA. Engineering the length of both protein and oligonucleotide. J. Biol. Chem 270, 24258–24263. 10.1074/jbc.270.41.24258. [DOI] [PubMed] [Google Scholar]
- 22.Escalante CR, Brass AL, Pongubala JMR, Shatova E, Shen L, Singh H, and Aggarwal AK (2002). Crystal structure of PU.1/IRF-4/DNA ternary complex. Mol. Cell 10, 1097–1105. 10.1016/s1097-2765(02)00703-7. [DOI] [PubMed] [Google Scholar]
- 23.Roos-Weil D, Decaudin C, Armand M, Della-Valle V, Diop MK, Ghamlouch H, Ropars V, Hérate C, Lara D, Durot E, et al. (2019). A recurrent activating missense mutation in waldenstrom macroglobulinemia affects the DNA binding of the ETS transcription factor SPI1 and enhances proliferation. Cancer Discov. 9, 796–811. 10.1158/2159-8290.CD-18-0873. [DOI] [PubMed] [Google Scholar]
- 24.Xhani S, Lee S, Kim HM, Wang S, Esaki S, Ha VLT, Khanezarrin M, Fernandez GL, Albrecht AV, Aramini JM, et al. (2020). Intrinsic disorder controls two functionally distinct dimers of the master transcription factor PU.1. Sci. Adv 6, eaay3178. 10.1126/sciadv.aay3178. [DOI] [PMC free article] [PubMed] [Google Scholar]
- 25.Rosenbauer F, Owens BM, Yu L, Tumang JR, Steidl U, Kutok JL, Clayton LK, Wagner K, Scheller M, Iwasaki H, et al. (2006). Lymphoid cell growth and transformation are suppressed by a key regulatory element of the gene encoding PU.1. Nat. Genet 38, 27–37. 10.1038/ng1679. [DOI] [PubMed] [Google Scholar]
- 26.Will B, Vogler TO, Narayanagari S, Bartholdy B, Todorova TI, da Silva Ferreira M, Chen J, Yu Y, Mayer J, Barreyro L, et al. (2015). Minimal PU.1 reduction induces a preleukemic state and promotes development of acute myeloid leukemia. Nat. Med 21, 1172–1181. 10.1038/nm.3936. [DOI] [PMC free article] [PubMed] [Google Scholar]
- 27.Carotta S, Dakic A, D’Amico A, Pang SHM, Greig KT, Nutt SL, and Wu L (2010). The transcription factor PU.1 controls dendritic cell development and Flt3 cytokine receptor expression in a dose-dependent manner. Immunity 32, 628–641. 10.1016/j.immuni.2010.05.005. [DOI] [PubMed] [Google Scholar]
- 28.Dahl R, Walsh JC, Lancki D, Laslo P, Iyer SR, Singh H, and Simon MC (2003). Regulation of macrophage and neutrophil cell fates by the PU.1:C/EBPalpha ratio and granulocyte colony-stimulating factor. Nat. Immunol 4, 1029–1036. 10.1038/ni973. [DOI] [PubMed] [Google Scholar]
- 29.Rosenbauer F, Koschmieder S, Steidl U, and Tenen DG (2005). Effect of transcription-factor concentrations on leukemic stem cells. Blood 106, 1519–1524. 10.1182/blood-2005-02-0717. [DOI] [PMC free article] [PubMed] [Google Scholar]
- 30.Zhou W, Gao F, Romero-Wolf M, Jo S, and Rothenberg EV (2022). Single-cell deletion analyses show control of pro-T cell developmental speed and pathways by Tcf7, Spi1, Gata3, Bcl11a, Erg, and Bcl11b. Sci. Immunol 7, eabm1920. 10.1126/sciimmunol.abm1920. [DOI] [PMC free article] [PubMed] [Google Scholar]
- 31.Tenen DG, Hromas R, Licht JD, and Zhang DE (1997). Transcription factors, normal myeloid development, and leukemia. Blood 90, 489–519. 10.1182/blood.V90.2.489. [DOI] [PubMed] [Google Scholar]
- 32.Roberts WM, Shapiro LH, Ashmun RA, and Look AT (1992). Transcription of the human colony-stimulating factor-1 receptor gene is regulated by separate tissue-specific promoters. Blood 79, 586–593. 10.1182/blood.V79.3.586.586. [DOI] [PubMed] [Google Scholar]
- 33.Zhang DE, Hetherington CJ, Chen HM, and Tenen DG (1994). The macrophage transcription factor PU.1 directs tissue-specific expression of the macrophage colony-stimulating factor receptor. Mol. Cell Biol 14, 373–381. 10.1128/mcb.14.1.373-381.1994. [DOI] [PMC free article] [PubMed] [Google Scholar]
- 34.Dickerson RE, and Chiu TK (1997). Helix bending as a factor in protein/DNA recognition. Biopolymers 44, 361–403. 10.1002/(SICI)1097-0282(1997)44:4<361::AID-BIP4>3.0.CO;2-X. [DOI] [PubMed] [Google Scholar]
- 35.Brukner I, Sánchez R, Suck D, and Pongor S (1995). Sequence-dependent bending propensity of DNA as revealed by DNase I: parameters for trinucleotides. EMBO J. 14, 1812–1818. 10.1002/j.1460-2075.1995.tb07169.x. [DOI] [PMC free article] [PubMed] [Google Scholar]
- 36.Packer MJ, Dauncey MP, and Hunter CA (2000). Sequence-dependent DNA structure: tetranucleotide conformational maps. J. Mol. Biol 295, 85–103. 10.1006/jmbi.1999.3237. [DOI] [PubMed] [Google Scholar]
- 37.Olson WK, Gorin AA, Lu XJ, Hock LM, and Zhurkin VB (1998). DNA sequence-dependent deformability deduced from protein-DNA crystal complexes. Proc. Natl. Acad. Sci. USA 95, 11163–11168. 10.1073/pnas.95.19.11163. [DOI] [PMC free article] [PubMed] [Google Scholar]
- 38.Perez-Borrajero C, Lin CSH, Okon M, Scheu K, Graves BJ, Murphy MEP, and McIntosh LP (2019). The biophysical basis for phosphorylation-enhanced DNA-binding autoinhibition of the ETS1 transcription factor. J. Mol. Biol 431, 593–614. 10.1016/j.jmb.2018.12.011. [DOI] [PubMed] [Google Scholar]
- 39.Kodandapani R, Pio F, Ni CZ, Piccialli G, Klemsz M, McKercher S, Maki RA, and Ely KR (1996). A new pattern for helix-turn-helix recognition revealed by the PU.1 ETS-domain-DNA complex. Nature 380, 456–460. 10.1038/380456a0. [DOI] [PubMed] [Google Scholar]
- 40.Poon GMK, and Macgregor RB Jr. (2003). Base coupling in sequence-specific site recognition by the ETS domain of murine PU.1. J. Mol. Biol 328, 805–819. 10.1016/s0022-2836(03)00362-0. [DOI] [PubMed] [Google Scholar]
- 41.Esaki S, Evich MG, Erlitzki N, Germann MW, and Poon GMK (2017). Multiple DNA-binding modes for the ETS family transcription factor PU.1. J. Biol. Chem 292, 16044–16054. 10.1074/jbc.M117.798207. [DOI] [PMC free article] [PubMed] [Google Scholar]
- 42.Minderjahn J, Schmidt A, Fuchs A, Schill R, Raithel J, Babina M, Schmidl C, Gebhard C, Schmidhofer S, Mendes K, et al. (2020). Mechanisms governing the pioneering and redistribution capabilities of the non-classical pioneer PU.1. Nat. Commun 11, 402. 10.1038/s41467-019-13960-2. [DOI] [PMC free article] [PubMed] [Google Scholar]
- 43.Pió F, Assa-Munt N, Yguerabide J, and Maki RA (1999). Mutants of ETS domain PU.1 and GGAA/T recognition: free energies and kinetics. Protein Sci. 8, 2098–2109. 10.1110/ps.8.10.2098. [DOI] [PMC free article] [PubMed] [Google Scholar]
- 44.Pahl HL, Scheibe RJ, Zhang DE, Chen HM, Galson DL, Maki RA, and Tenen DG (1993). The proto-oncogene PU.1 regulates expression of the myeloid-specific CD11b promoter. J. Biol. Chem 268, 5014–5020. 10.1016/S0021-9258(18)53496-7. [DOI] [PubMed] [Google Scholar]
- 45.Pham TH, Minderjahn J, Schmidl C, Hoffmeister H, Schmidhofer S, Chen W, Längst G, Benner C, and Rehli M (2013). Mechanisms of in vivo binding site selection of the hematopoietic master transcription factor PU.1. Nucleic Acids Res. 41, 6391–6402. 10.1093/nar/gkt355. [DOI] [PMC free article] [PubMed] [Google Scholar]
- 46.Werner MH, Clore GM, Fisher CL, Fisher RJ, Trinh L, Shiloach J, and Gronenborn AM (1997). Correction of the NMR structure of the ETS1/DNA complex. J. Biomol. NMR 10, 317–328. 10.1023/a:1018399711996. [DOI] [PubMed] [Google Scholar]
- 47.Wang Y, Feng L, Said M, Balderman S, Fayazi Z, Liu Y, Ghosh D, and Gulick AM (2005). Analysis of the 2.0 A crystal structure of the protein-DNA complex of the human PDEF Ets domain bound to the prostate specific antigen regulatory site. Biochemistry 44, 7095–7106. 10.1021/bi047352t. [DOI] [PubMed] [Google Scholar]
- 48.Huang K, Xhani S, Albrecht AV, Ha VLT, Esaki S, and Poon GMK (2019). Mechanism of cognate sequence discrimination by the ETS-family transcription factor ETS-1. J. Biol. Chem 294, 9666–9678. 10.1074/jbc.RA119.007866. [DOI] [PMC free article] [PubMed] [Google Scholar]
- 49.Reményi A, Schöler HR, and Wilmanns M (2004). Combinatorial control of gene expression. Nat. Struct. Mol. Biol 11, 812–815. 10.1038/nsmb820. [DOI] [PubMed] [Google Scholar]
- 50.Lefstin JA, and Yamamoto KR (1998). Allosteric effects of DNA on transcriptional regulators. Nature 392, 885–888. 10.1038/31860. [DOI] [PubMed] [Google Scholar]
- 51.Pan Y, Tsai CJ, Ma B, and Nussinov R (2010). Mechanisms of transcription factor selectivity. Trends Genet. 26, 75–83. 10.1016/j.tig.2009.12.003. [DOI] [PMC free article] [PubMed] [Google Scholar]
- 52.Weikum ER, Knuesel MT, Ortlund EA, and Yamamoto KR (2017). Glucocorticoid receptor control of transcription: precision and plasticity via allostery. Nat. Rev. Mol. Cell Biol 18, 159–174. 10.1038/nrm.2016.152. [DOI] [PMC free article] [PubMed] [Google Scholar]
- 53.Meijsing SH, Pufall MA, So AY, Bates DL, Chen L, and Yamamoto KR (2009). DNA binding site sequence directs glucocorticoid receptor structure and activity. Science 324, 407–410. 10.1126/science.1164265. [DOI] [PMC free article] [PubMed] [Google Scholar]
- 54.Malik V, Zimmer D, and Jauch R (2018). Diversity among POU transcription factors in chromatin recognition and cell fate reprogramming. Cell. Mol. Life Sci 75, 1587–1612. 10.1007/s00018-018-2748-5. [DOI] [PMC free article] [PubMed] [Google Scholar]
- 55.Mohaghegh N, Bray D, Keenan J, Penvose A, Andrilenas KK, Ramlall V, and Siggers T (2019). NextPBM: a platform to study cell-specific transcription factor binding and cooperativity. Nucleic Acids Res. 47, e31. 10.1093/nar/gkz020. [DOI] [PMC free article] [PubMed] [Google Scholar]
- 56.Albrecht AV, Kim HM, and Poon GMK (2018). Mapping interfacial hydration in ETS-family transcription factor complexes with DNA: a chimeric approach. Nucleic Acids Res. 46, 10577–10588. 10.1093/nar/gky894. [DOI] [PMC free article] [PubMed] [Google Scholar]
- 57.Weirauch MT, Yang A, Albu M, Cote AG, Montenegro-Montero A, Drewe P, Najafabadi HS, Lambert SA, Mann I, Cook K, et al. (2014). Determination and inference of eukaryotic transcription factor sequence specificity. Cell 158, 1431–1443. 10.1016/j.cell.2014.08.009. [DOI] [PMC free article] [PubMed] [Google Scholar]
- 58.Sancak Y, Peterson TR, Shaul YD, Lindquist RA, Thoreen CC, Bar-Peled L, and Sabatini DM (2008). The Rag GTPases bind raptor and mediate amino acid signaling to mTORC1. Science 320, 1496–1501. 10.1126/science.1157535. [DOI] [PMC free article] [PubMed] [Google Scholar]
- 59.Chu J, Oh Y, Sens A, Ataie N, Dana H, Macklin JJ, Laviv T, Welf ES, Dean KM, Zhang F, et al. (2016). A bright cyan-excitable orange fluorescent protein facilitates dual-emission microscopy and enhances bioluminescence imaging in vivo. Nat. Biotechnol 34, 760–767. 10.1038/nbt.3550. [DOI] [PMC free article] [PubMed] [Google Scholar]
- 60.Kabsch W (2010). Xds. Acta Crystallogr. D Biol. Crystallogr 66, 125–132. 10.1107/S0907444909047337. [DOI] [PMC free article] [PubMed] [Google Scholar]
- 61.Winn MD, Ballard CC, Cowtan KD, Dodson EJ, Emsley P, Evans PR, Keegan RM, Krissinel EB, Leslie AGW, McCoy A, et al. (2011). Overview of the CCP4 suite and current developments. Acta Crystallogr. D Biol. Crystallogr 67, 235–242. 10.1107/S0907444910045749. [DOI] [PMC free article] [PubMed] [Google Scholar]
- 62.Adams PD, Afonine PV, Bunkóczi G, Chen VB, Davis IW, Echols N, Headd JJ, Hung LW, Kapral GJ, Grosse-Kunstleve RW, et al. (2010). PHENIX: a comprehensive Python-based system for macromolecular structure solution. Acta Crystallogr. D Biol. Crystallogr 66, 213–221. 10.1107/S0907444909052925. [DOI] [PMC free article] [PubMed] [Google Scholar]
- 63.Emsley P, Lohkamp B, Scott WG, and Cowtan K (2010). Features and development of coot. Acta Crystallogr. D Biol. Crystallogr 66, 486–501. 10.1107/S0907444910007493. [DOI] [PMC free article] [PubMed] [Google Scholar]
- 64.Lu XJ, and Olson WK (2003). 3DNA: a software package for the analysis, rebuilding and visualization of three-dimensional nucleic acid structures. Nucleic Acids Res. 31, 5108–5121. 10.1093/nar/gkg680. [DOI] [PMC free article] [PubMed] [Google Scholar]
- 65.Barthels F, Schirmeister T, and Kersten C (2021). BANΔIT: B’-Factor analysis for drug Design and structural biology. Mol. Inform 40, e2000144. 10.1002/minf.202000144. [DOI] [PMC free article] [PubMed] [Google Scholar]
- 66.Ivani I, Dans PD, Noy A, Pérez A, Faustino I, Hospital A, Walther J, Andrio P, Goñi R, Balaceanu A, et al. (2016). Parmbsc1: a refined force field for DNA simulations. Nat. Methods 13, 55–58. 10.1038/nmeth.3658. [DOI] [PMC free article] [PubMed] [Google Scholar]
- 67.Bussi G, Donadio D, and Parrinello M (2007). Canonical sampling through velocity rescaling. J. Chem. Phys 126, 014101. 10.1063/1.2408420. [DOI] [PubMed] [Google Scholar]
- 68.Stephens DC, Kim HM, Kumar A, Farahat AA, Boykin DW, and Poon GM (2016). Pharmacologic efficacy of PU.1 inhibition by heterocyclic dications: a mechanistic analysis. Nucleic Acids Res. 44, 4005–4013. 10.1093/nar/gkw229. [DOI] [PMC free article] [PubMed] [Google Scholar]
- 69.Munde M, Wang S, Kumar A, Stephens CE, Farahat AA, Boykin DW, Wilson WD, and Poon GMK (2014). Structure-dependent inhibition of the ETS-family transcription factor PU.1 by novel heterocyclic diamidines. Nucleic Acids Res. 42, 1379–1390. 10.1093/nar/gkt955. [DOI] [PMC free article] [PubMed] [Google Scholar]
- 70.Kaya-Okur HS, Wu SJ, Codomo CA, Pledger ES, Bryson TD, Henikoff JG, Ahmad K, and Henikoff S (2019). CUT&Tag for efficient epigenomic profiling of small samples and single cells. Nat. Commun 10, 1930. 10.1038/s41467-019-09982-5. [DOI] [PMC free article] [PubMed] [Google Scholar]
- 71.Heinz S, Benner C, Spann N, Bertolino E, Lin YC, Laslo P, Cheng JX, Murre C, Singh H, and Glass CK (2010). Simple combinations of lineage-determining transcription factors prime cis-regulatory elements required for macrophage and B cell identities. Mol. Cell 38, 576–589. 10.1016/j.molcel.2010.05.004. [DOI] [PMC free article] [PubMed] [Google Scholar]
- 72.Shen W, Le S, Li Y, and Hu F (2016). SeqKit: a cross-platform and ultrafast toolkit for FASTA/Q file manipulation. PLoS One 11, e0163962. 10.1371/journal.pone.0163962. [DOI] [PMC free article] [PubMed] [Google Scholar]
- 73.Roven C, and Bussemaker HJ (2003). REDUCE: an online tool for inferring cis-regulatory elements and transcriptional module activities from microarray data. Nucleic Acids Res. 31, 3487–3490. 10.1093/nar/gkg630. [DOI] [PMC free article] [PubMed] [Google Scholar]
Associated Data
This section collects any data citations, data availability statements, or supplementary materials included in this article.
Supplementary Materials
Data Availability Statement
Co-crystallographic PU.1/DNA structures and electron densities have been deposited at wwPDB and are publicly available as of the date of publication. Accession numbers (8E3K, 8EBH, 8E5Y, 8EQK, 8E4H, 8EJ6, 8E3R, 8EE9, 8EMD, 8EJ8, 8EK3, 8EQL, 8EKJ, 8EKU, 8EQG, 8ENG, 8EO1, 8EO4, 8EKV, 8EK8, 8EKZ, 8EM9) are listed in Table S2; CUT&Tag data of full-length wildtype PU.1 and Q226E in HEK293Thave been deposited at GEO and are publicly available (GSE211518) as of the date of publication.
This paper does not report original code.
Any additional information required to reanalyze the data reported in this paper is available from the lead contact upon request.