Abstract
N-glycanase 1 (NGLY1) deficiency is a debilitating, ultra-rare autosomal recessive disorder caused by loss of function of NGLY1, a cytosolic enzyme that deglycosylates other proteins. It is characterized by severe global developmental delay and/or intellectual disability, hyperkinetic movement disorder, transient elevation of transaminases, (hypo)alacrima and progressive, diffuse, length-dependent sensorimotor polyneuropathy. A prospective natural history study (NHS) was conducted to elucidate clinical features and disease course. Twenty-nine participants were enrolled (15 onsite, 14 remotely) and followed for up to 32 months, representing ~29% of the ~100 patients identified worldwide. Participants exhibited profound developmental delays, with almost all developmental quotients below 20 on the Mullen Scales of Early Learning, well below the normative score of 100. Increased difficulties with sitting and standing suggested decline in motor function over time. Most patients presented with (hypo)alacrima and reduced sweat response. Pediatric quality of life was poor except for emotional function. Language/communication and motor skill problems including hand use were reported by caregivers as the most bothersome symptoms. Levels of the substrate biomarker, GlcNAc-Asn (aspartylglucosamine; GNA), were consistently elevated in all participants over time, independent of age. Liver enzymes were elevated for some participants but improved especially in younger patients and did not reach levels indicating severe liver disease. Three participants died during the study period. Data from this NHS informs selection of endpoints and assessments for future clinical trials for NGLY1 deficiency interventions. Potential endpoints include GNA biomarker levels, neurocognitive assessments, autonomic and motor function (particularly hand use), (hypo)alacrima and quality of life.
Introduction
N-glycanase 1 (NGLY1) deficiency (OMIM 615273) is a severely debilitating, ultra-rare and autosomal recessive neurodevelopmental disorder characterized by five core clinical features: global developmental delay and/or intellectual disability, a hyperkinetic movement disorder, transient elevation of transaminases, (hypo)alacrima, and a progressive, diffuse and length-dependent sensorimotor polyneuropathy (1–3). In addition to these five core features, individuals may experience seizures, reduced ability to sweat, skeletal problems such as contractures, scoliosis and skeletal deformities, hearing loss, vision impairment and adrenal insufficiency (3). There are approximately 100 individuals living with NGLY1 deficiency identified globally (4). Because so few cases have been identified, estimated lifespan is unknown. While some individuals survive into early adulthood, there have been reports of death during infancy and adolescence (3,5–7). Most affected individuals require constant daily care owing to difficulty performing activities such as feeding, toileting and bathing, and many are unable to walk or speak (3).
NGLY1 deficiency is caused by mutations in the NGLY1 gene that encodes the cytosolic protein N-glycanase 1 or NGLY1 (2). NGLY1 cleaves N-glycans from proteins targeted for degradation as part of the endoplasmic reticulum-associated degradation (ERAD) pathway. ERAD is a cellular quality control pathway in which misfolded or improperly processed proteins in the endoplasmic reticulum (ER) are translocated to the cytosol and delivered to the proteasome for degradation. NGLY1 cleaves N-linked glycans from ERAD substrate glycoproteins by hydrolyzing the proximal N-acetylglucosamine-asparagine (GlcNAc-Asn) amide bond prior to degradation by the proteasome. This cleavage results in two products, a free oligosaccharide and a deaminated protein (8). In the absence of NGLY1, glycans can be cleaved from the protein at alternate positions within the glycan, resulting in an incompletely deglycosylated protein that retains the proximal GlcNAc bound to Asn. This protein can then be degraded to peptides, which are hydrolyzed to amino acids. Because the substrate GlcNAc-Asn bond normally cleaved by NGLY1 remains intact, GlcNAc-Asn (GNA) accumulates in the cytosol in cells that lack NGLY1 activity (9,10). As a consequence, GNA levels are consistently elevated in NGLY1 deficient organisms and cells (10) and can be measured using a quantitative assay in dried blood spots, urine and plasma samples from patients with NGLY1 deficiency (9,10).
Restoration of NGLY1 activity in NGLY1 deficient cellular and animal models leads to a reduction of GNA levels. Thus measurement of GNA concentration directly reflects NGLY1 activity and could be expected to predict clinically meaningful restoration of NGLY1 activity in a therapeutic setting (9–11). A reliable biomarker for NGLY1 deficiency is critical given the small population of affected individuals, the slowly progressive nature of the disease, and the high degree of phenotypic variability (10).
The specific factors underlying the heterogenous presentation of NGLY1 deficiency are not known. Diagnosis of NGLY1 deficiency is based on a combination of genetic testing, a detailed medical history, and clinical examination to identify key clinical features, particularly (hypo)alacrima, which is only present in very few disorders. Increased levels of plasma or urine GNA may support a diagnosis of NGLY1 deficiency when genetic testing shows variants of uncertain significance (9,10). Given the rarity of the disease and its heterogenous nature, there is often a significant delay between onset of symptoms and diagnosis (1,2).
There are no approved treatments for NGLY1 deficiency; rather, symptoms must be managed daily by caretakers. Symptomatic treatments include feeding tubes to provide nutrients; lubricating eye drops or ointments for dry eyes related to poor tear production; anti-seizure medication; occupational, physical and speech therapy to assist with activities of daily living; and psychosocial support for families and caregivers (3,12). Nearly half of patients also require invasive procedures or surgery for musculoskeletal issues associated with NGLY1 deficiency (13).
To support the development of disease-modifying therapies, a full elucidation of the natural history and clinical manifestations of NGLY1 deficiency is needed. As the disorder was recently identified (14), a prospective natural history study (NHS) that enrolled a substantial portion of the known affected individuals was conducted to improve understanding of the presentation and course of the disorder.
This study reports on the findings of the NGLY1 deficiency prospective NHS described above (NCT03834987). The objectives of this study were to understand the clinical spectrum and progression of NGLY1 deficiency using standardized clinical and neurodevelopmental assessments, and to identify and define clinical and biomarker endpoints for use in therapeutic trials.
Results
Participant disposition and demographics
The study enrolled 29 participants with a confirmed diagnosis of NGLY1 deficiency, 15 onsite participants and 14 remote participants (Fig. 1). The data presented here expand on the baseline characteristics and on the disposition of those reported by Levy 2022 (15). Three participants died during the study (Table 1). All other patients remained in the study throughout its duration. Participants were followed for a median of 23 months, with a range of 8–32 months. Because participants entered the study at different times, they were followed for varying lengths of time up to the study end date. Thus, the number of patients at each time point is provided when describing the results.
Figure 1.
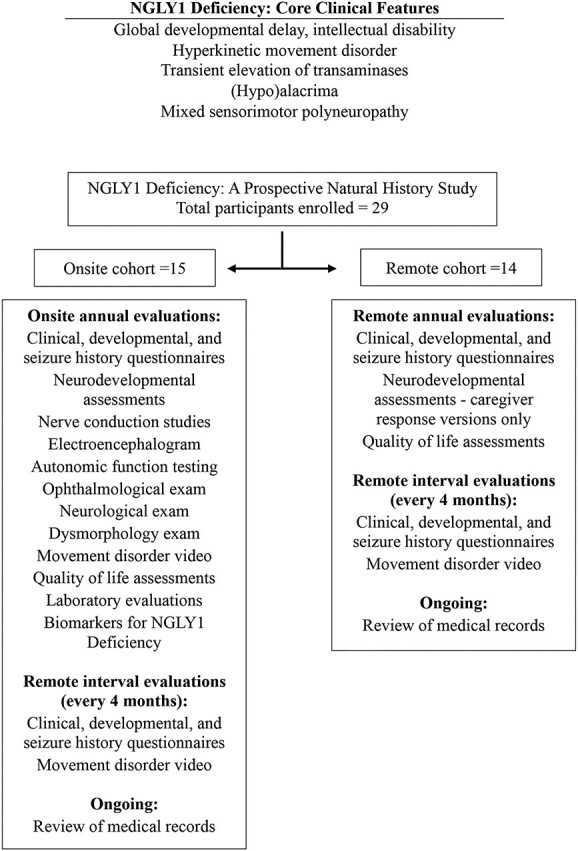
NGLY1 deficiency clinical features and summary of study protocol. Core clinical features of NGLY1 deficiency (1–3) are shown above. The study protocol is summarized below.
Table 1.
Participant disposition and demographics
| Demographic | |
|---|---|
Number of participants – n
|
29 15 (51.7) 14 (49.3) |
| Discontinuations during study—n (%) | None |
| Deaths during study—n (%) Age at death—years |
3 (10.3) 12, 15 and 22 years |
| Age at: mean (SD) [range]—years | |
|
9.93 (6.279) [1–27] 7.1 years (5.45) [0–16.1] |
Gender – n (%)
|
29 (100%) 15 (51.7) 14 (49.3) |
| Weight as Z-score—n (%) Mean (SD) [range] |
15 (52%) −2.1 (0.97) [−0.57 to −3.97] |
The mean age [range] of participants was 9.93 [1–27] years at entry and 7.1 [0–16.1] years at diagnosis. The mean weight [range] expressed as Z-score was −2.08 [−0.57 to 3.97], thus indicating for all participants body weights below the norm for age.
Developmental assessments
Mullen Scales of Early Learning
Participants who were given the Mullen Scales of Early Learning (MSEL) had profound global developmental delays, with most developmental quotient (DQ) scores below 20, indicating a developmental age much lower than the normative score of 100 ± 15 (Fig. 2). No participant showed improvement in DQ over time. Generally, the DQ scores were slightly declining over time for individual participants.
Figure 2.
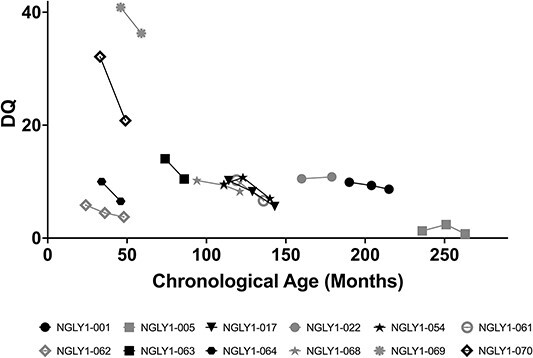
Scatter plot of Mullen-DQ vs chronological age. Individual participant DQ scores over time are shown. The normative value is 100 ± 15. Black symbols are female and gray symbols are male subjects.
All MSEL subscales were also profoundly impaired and generally without remarkable improvement; age equivalents were lowest in expressive language and highest in visual reception (data on file).
Almost all participants had profound global impairment in adaptive functioning at baseline as reflected in the Vineland Adaptive Behavior Composite (ABC) standard score where a value of 100 (SD 15) is considered normal (Fig. 3). The baseline mean (standard deviation [SD]) was 49.43 (22.076) with a range of 23.0–88.0 (n = 14). Annual Year 2 showed mean (SD) of 40.80 (16.825) with a range of 23.0–71.0 (n = 10), which was indicative of no improvement. Participants showed global impairment in all domains of the Vineland Adaptive Behavior Scales, 3rd edition (Vineland-3, data on file). While there were some fluctuations over time, the magnitudes of change were neither statistically significant nor clinically meaningful; participants generally remained severely impaired. There were two sibling participants, subjects NGLY1-011 and NGLY1-012, who were higher functioning in several subdomains relative to other participants.
Figure 3.
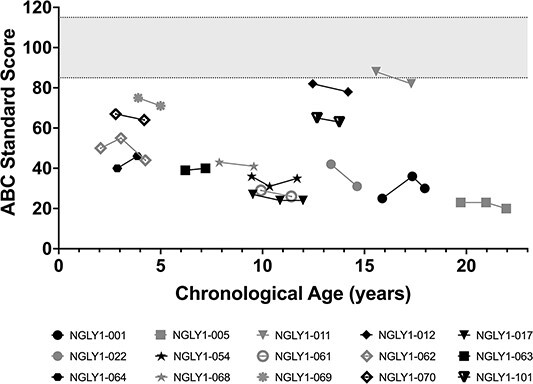
Vineland ABC. Individual participant Vineland ABC scores over time are shown. The normative value is 100 ± 15 (shaded area). Black symbols are female and gray symbols are male subjects.
Peabody Developmental Motor Scales—2nd Edition
Participants assessed for the Peabody Developmental Motor Scales—2nd Edition (PDMS-2) had clinically significant impairments in all subscales of gross and fine motor function. The PDMS-2 provides a more detailed analysis of gross and fine motor skills in children from birth to 71 months of age. All participants who could be assessed with PDMS-2 showed marked impairment in DQ for gross motor (Fig. 4A) and fine motor (Fig. 4B) function and had clinically significant impairments in all subscales of gross and fine motor function. For example, grasping age equivalence was at or below 8 months and object manipulation age equivalence was below or at 20 months (data on file), even though chronologic age was as high as 260 months (~21 years old). These data illustrate a profound impairment in upper extremity function in study participants. Profound motor impairment was also observed in all other PDMS-2 domains (data on file). While there were small changes over time for many participants, the profound motor impairments were generally stable or worsening over time.
Figure 4.
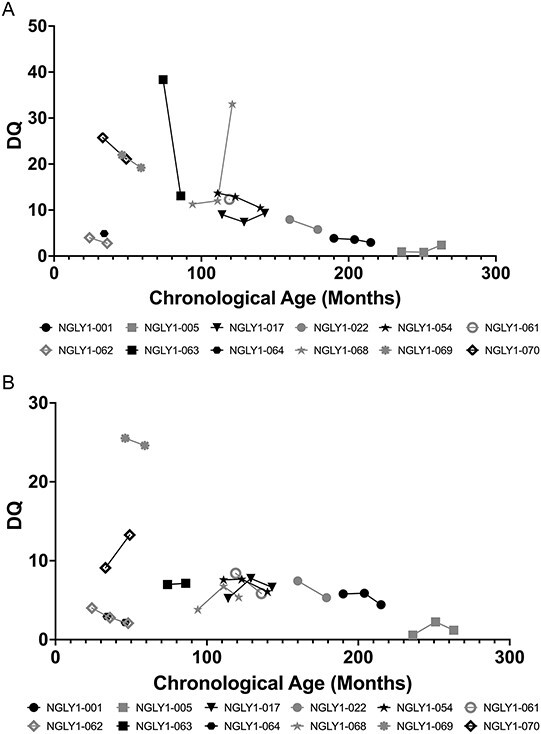
PDMS-2 gross motor (A) and fine motor (B) function. Individual participant PDMS-2 gross motor (A) and fine motor (B) function scores over time are shown. The normative values are 100 ±15. Black symbols are female and gray symbols are male subjects.
Clinical disease course over time
Motor function parameters (sitting and standing ability)
Motor function was significantly impaired and showed progression over time (Table 2). At baseline, 92.3% of participants were able to sit unaided, but by Year 2 this percentage declined to 60.0%. Correspondingly, the proportion of participants requiring support or who were unable to sit increased by Year 2. Less than half of participants (38.5%) were able to stand unaided at baseline, and the percentage declined further at Year 2 to 26.7%. In addition, the proportion of participants requiring maximal support or unable to stand increased by Year 2. Review of individual participant data confirmed that the worsening trends were owing to several participants whose function declined over time (Fig. 5).
Table 2.
Motor function parameters
| Parameter | Timeframe | |
|---|---|---|
| Baseline n/N (%) | First annual n/N (%) | |
| Sitting ability | ||
| Sits unaided | 12/13 (92.3) | 9/15 (60.0) |
| Sits with minimal support | 0/13 (0.0) | 4/15 (26.7) |
| Sits with maximal support | 0/13 (0.0) | 1/15 (6.7) |
| Unable to sit | 1/13 (7.7) | 1/15 (6.7) |
| Standing ability | ||
| Stands unaided | 5/13 (38.5) | 4/15 (26.7) |
| Stands with minimal support | 2/13 (15.4) | 2/15 (13.3) |
| Stands with maximal support | 5/13 (38.5) | 7/15 (46.7) |
| Unable to stand | 1/13 (7.7) | 2/15 (13.3) |
Figure 5.
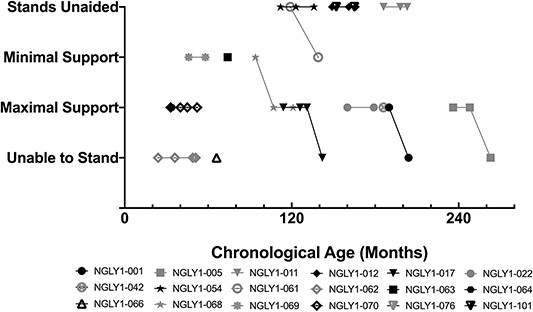
Motor function: Standing ability. Individual participant standing ability over time is shown. Black symbols are female and gray symbols are male subjects.
Ophthalmic Evaluations
The Schirmer’s test was used to evaluate (hypo)alacrima using calibrated filter paper to measure tear production. As shown in Figure 6, the mean distance traveled for tears in the Schirmer’s test was generally below normal (≤10 mm; (16)) and for many participants was near or below the threshold considered strongly positive for (hypo)alacrima (≤5 mm) (17). Because Schirmer’s test was introduced late in the study, many patients had only a single time point collected; longitudinal data for those participants tested more than once showed no consistent change over time. Results were generally similar between left and right eyes (data on file).
Figure 6.
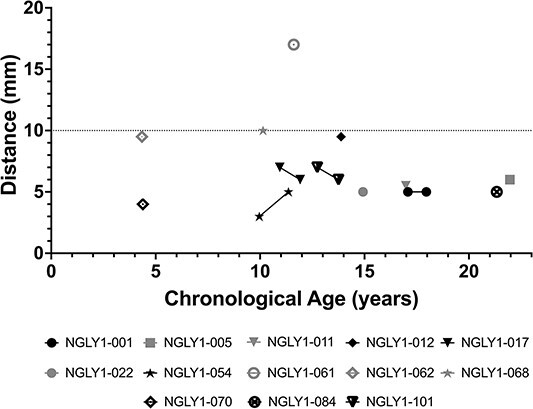
Schirmer’s lacrimation test. Results from left eye. Wetting of ≤5 mm per 5 min is considered a strong positive test for (hypo)alacrima (17). Greater than 10 mm is considered normal (gray line).
Other endpoints
10-Meter Walk Test
Only half of participants were able to attempt the 10-Meter Walk Test (10-MWT) twice or more at the comfortable speed at baseline, and the majority (84.6%) were not able to attempt the fast speed trial. As there were too few participants for the data to be clinically meaningful, the results are not shown here.
Nerve Conduction Studies
Interpretation of motor and sensory conduction studies showed a mixed polyneuropathy for most patients. Nerve conduction velocity of the median nerve for motor and sensory nerves generally showed values below normal values reported in the literature (18). Of the 18 participants with Nerve Conduction Studies (NCS) assessment, 8 (44%) had at least one median nerve assessment that was not measurable (data on file).
Quantitative measures of autonomic function: Quantitative Sudomotor Axon Reflex Test
The Quantitative Sudomotor Axon Reflex Test (QSART) measures postganglionic sympathetic sudomotor sweat response. Decreased sweat volume and increased latency (time to onset of sweating) is indicative of peripheral autonomic neuropathy. Participants showed a decreased sweat response (Table 3), with forearm latency and volume shown as a representative location. Mean sweat latency in the forearm was in the high normal to elevated range, indicating delayed sweating (normal values for sweat latency are 60–120 s (19)). Mean sweat volume in the forearm was in the low normal range at baseline and worsened to below normal at Year 2 (normal values for sweat volume are 0.38–2.86 μl in men and 0.10–1.99 μl in women (20)). Other body locations showed generally similar findings (data on file).
Table 3.
Summary statistics of QSART
| QSART domain | Timeframe | |
|---|---|---|
| Baseline Year 1 | Annual Year 2 | |
| Forearm latency (s) | ||
| n | 10 | 5 |
| Mean (SD) | 109.0 (52.05) | 173.0 (81.00) |
| Median | 100.5 | 173.0 |
| Min, Max | 20, 177 | 68, 290 |
| Forearm sweat volume (μl) | ||
| n | 10 | 5 |
| Mean (SD) | 0.5364 (0.45795) | 0.0801 (0.05811) |
| Median | 0.4363 | 0.0490 |
| Min, Max | 0.047, 1.638 | 0.042, 0.179 |
Quality of life
Caregiver self-reports for the caregiver’s quality of life (QoL) per short form health survey (SF-36) did not show change over time (data on file).
Pediatric Quality of Life Inventory
The Pediatric Quality of Life Inventory (PedsQL) is a measure of pediatric health-related quality of life (HRQoL) (21). Total scores for participants at baseline (Fig. 7) ranged from 33.7 to 95.7, with a mean of 50.5, which is lower than total scores for normal development (mean 82.5 to 95.2, depending on gender and age group; (22)). Scores by domain were lowest for the physical domain, with a mean (SD) score of 32.57 (24.924) and highest for the emotional domain, with a mean (SD) score of 68.75 (20.283) (data on file). The PedsQL total score (Fig. 7) and subdomain scores remained generally stable over time (data on file).
Figure 7.
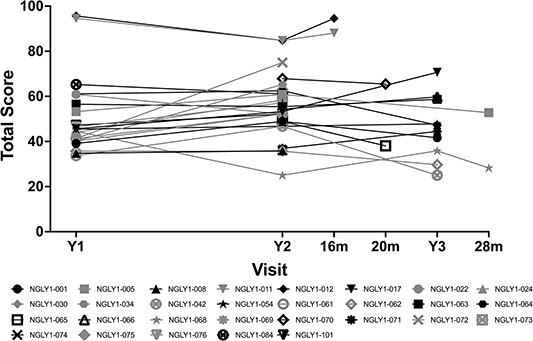
PedsQL (total score) vs. visit. Black symbols are female and gray symbols are male subjects.
Most bothersome symptom
When asked to describe the most bothersome symptom of NGLY1 deficiency, caregivers identified trouble with language/ communication (for 13 patients), followed by gross or fine motor deficits, including limited functional hand use (for caregivers of 11 patients) (data on file).
GNA levels
GNA levels were elevated in the plasma of all participants, did not correlate with age and showed minimal change over time (Fig. 8) There was no significant linear relationship between age and GNA levels, as indicated by the horizontal black line, suggesting GNA levels (GNA concentration in plasma) remain consistent over time. For onsite participants, mean (SD) GNA plasma concentration was 115 (28.4) ng/ml with range of 57.8–189.0 ng/ml, which was 4.3-fold over related controls (unaffected siblings and parents) and 8.5-fold over unrelated unaffected controls (10). Longitudinal GNA samples (n = 10) showed ≤ 37 ng/ml change over 2–3 years (max—min concentration; mean change 23.0 ± 10.8 ng/ml).
Figure 8.
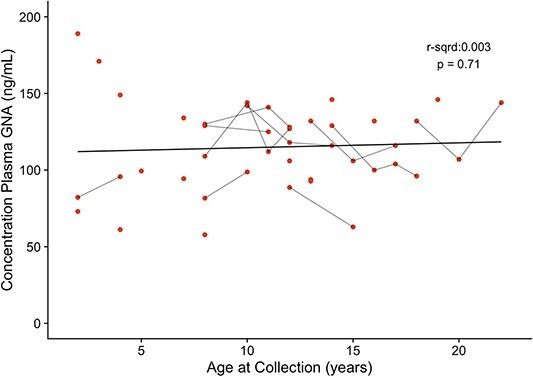
Plasma GNA concentration vs. age at collection for participants as measured over time. Age at sample collection and GNA concentration were compared to determine whether there was a significant relationship. The line is the trend line with statistical correlation shown. Each point represents a measurement, and points connected by short black lines are consecutive measurements for the same participant.
Laboratory studies
Laboratory study results were generally unremarkable, except for alanine transaminase (ALT; Fig. 9) and aspartate aminotransferase (AST; Fig. 10) levels, which were elevated in some participants. Those with elevated ALT/AST values showed improvement over time, especially among the younger patients. The liver transaminases were not associated with elevated total bilirubin levels and did not reach levels indicative of severe liver disease.
Figure 9.
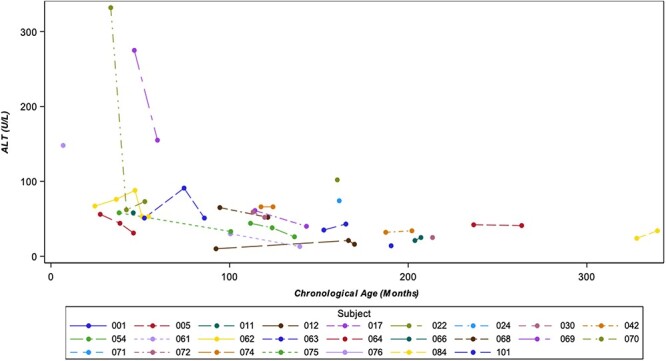
ALT (units per liter [U/L]) vs. chronological age. Legend: If participants had multiple laboratory measurements at the same visit, the highest value was selected for analysis.
Figure 10.
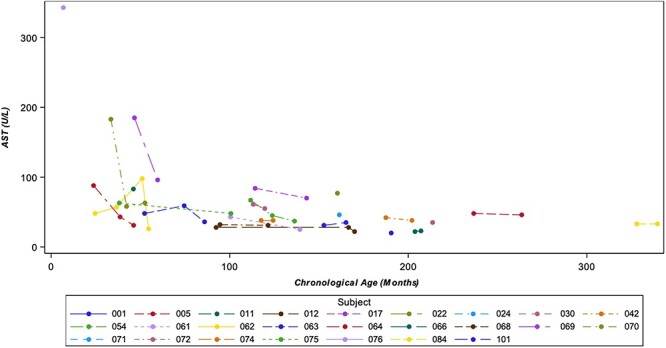
AST (U/L) vs chronological age. Legend: If participants had multiple laboratory measurements at the same visit, the highest value was selected for analysis.
Discussion
This prospective NHS was undertaken to characterize the clinical characteristics, disease course, and potential clinical trial endpoints for NGLY1 deficiency, a severely debilitating, ultra-rare, autosomal recessive and neurodevelopmental disorder. Consistent with previous publications, the core features of the disease, global developmental delay and/or intellectual disability, a hyperkinetic movement disorder, transient elevation of transaminases and (hypo)alacrima (1–3,15) were found to be profound and did not show spontaneous improvements, as with typical childhood development over time. The natural history was generally slowly progressive or at best stable over at least a 1-year period. This publication reports on neurodevelopmental outcomes, disease course over time, laboratory studies, HRQoL and biomarkers. Mortality is also reported, pointing to the urgency for development of treatments for this devastating disease. This report complements findings on seizures and electroencephalogram (EEG) results previously reported from this NHS (15). The data provided here report on 29 participants. While the accrual objective was up to 50 participants, this study reports on ~29% of the known patient population given there have been approximately 100 patients identified to date worldwide. Considering the imminent development of candidate therapies (11) and the progressive nature of this disorder, this characterization of patient phenotypes and trajectories has value as important guidance relevant to forthcoming interventional studies.
All participants in this NHS had profound neurodevelopmental impairment as demonstrated by developmental and adaptive skills assessments using standard validated instruments, the MSEL and Vineland-3. Profound impairment was observed in the composite score and in all domains, encompassing expressive and receptive language as well as coping skills and interpersonal relationships. There was a trend in neurodevelopmental outcomes, such that those participants with epilepsy (>50% of participants) had more severe developmental delay (15). While there were minor fluctuations over time with the neurocognitive instruments (MSEL and Vineland-3) across all domains assessed, these were not clinically significant and were generally within the expected variability of measurement. There was no evidence of spontaneous improvements and the participants failed to recover functional abilities typical for their chronological age. Rather, individuals with NGLY1 deficiency either slowly deteriorated further or remained at a level of profound impairment. In clinical trials of potential therapies for NGLY1 deficiency, improvements in neurocognitive assessments could signify treatment efficacy; however, even a stabilization or halting of decline based on these assessments could be considered a beneficial effect of treatment.
Nearly all participants exhibited failure to thrive, manifesting as low weight for age, and motor impairments consisting of delayed/absent attainment of motor milestones as shown on physical exam, PDMS-2, and motor subdomains of the MSEL and Vineland-3. Both gross and fine motor skills were severely impaired. Worsening of already poor gross motor function over time was indicated by the reduction in the proportion of participants who achieved unaided sitting or standing with concurrent increased proportions of participants who could not sit or stand. There were no spontaneous improvements in the ability to sit or stand even though participants were at or older than the ages where these gross motor milestones are expected to be achieved. The ability to sit and stand independently would be expected to greatly impact a patient’s and their caregiver’s quality of life. Overall, multiple assessment methods pointed toward slowly progressive declines in motor abilities required for self-care and activities of daily living. The motor function results of this NHS suggest that if motor abilities are used as an endpoint in future therapeutic trials, any improvements seen are more likely to be owing to the efficacy of the therapy rather than natural improvement with age, and that even a small improvement would be clinically important, given the profound impairment that begins early in life and may worsen over time.
Schirmer’s test for lacrimation (tear formation) and QSART assessments (sweat response) also indicated impaired functions in participants. These assessments are indicative of autonomic dysfunction in NGLY1 deficiency (3,23,24) and were generally stable or worsened over time. Insufficient tear production has an important impact on health in individuals with NGLY1 deficiency and is associated with corneal damage, including neovascularization, pannus formation and scarring (3). Reduced sweat response (hypohydrosis) requires protective measures against situations that could cause dangerous core body hyperthermia (12), such as cooling vests and adequate access to water and air conditioning (3).
The majority of participants had impaired HRQoL as measured by PedsQL that showed no clear change over time by total score or by subdomain. Symptoms that were most troublesome to caregivers included difficulties with language/communication and motor deficits (particularly limited functional hand use). The caregivers’ impressions are consistent with the deficits seen on the MSEL, which showed profound impairment in language and communication, the Vineland-3, which showed extensive impairment in gross and fine motor skills, and the PDMS-2, which showed clinically important impairment in all measures of gross and fine motor skills including grasp and object manipulation. Caregiver-reported improvement in the symptoms that most directly affect the HRQoL of participants and their families could represent meaningful secondary endpoints.
GNA has been identified as a substrate biomarker for NGLY1 deficiency (10). Unlike other potential biomarkers for NGLY1 deficiency (12,25,26), GNA is a substrate biomarker that directly results from the lack of NGLY1 function and consistently differentiates those individuals affected by NGLY1 deficiency from those without NGLY1 deficiency (10). Individuals with the inherited metabolic disease aspartylglucosaminuria also show elevated GNA levels but can be distinguished from those with NGLY1 deficiency through genetic testing and consideration of key clinical features. The data presented in this report demonstrate that GNA was elevated in all NHS participants and remained stable over time. In a rat model of NGLY1 deficiency, virally mediated delivery of a functional human copy of the NGLY1 gene led to a reduction in GNA levels that correlated with improvement of behavior and locomotor phenotypes (10,11). A similar restoration of NGLY1 function as assessed by normalization of GNA levels might be used as a key endpoint to measure treatment effect and be expected to predict clinical benefit in future NGLY1 gene therapy clinical trials.
Liver transaminases were mildly elevated at baseline and stable or, in the case of some younger patients, improved over time. This is consistent with previous reports of NGLY1 deficiency in which liver dysfunction has been identified as an important phenotype of the disease (14,27–30). Although AST/ALT levels were not high enough to be indicative of severe liver disease in this NHS, they should be followed over time during future interventional studies as part of safety monitoring and, concurrently, may be an important clinical measure to evaluate for treatment efficacy (4).
The current study has some limitations. Because patients entered the study at different times, they had different durations of follow-up data. Year 3 study data were only available for a small subset of patients, thus limiting statistical analyses and conclusions about long-term disease progression. The COVID-19 pandemic delayed or precluded some on-site study visits, which impacted the availability of some data. In addition, patients were not able to perform all of the planned assessments, such as the Beery–Buktenica Test of Visual Motor Integration and the 10-MWT, owing to the profound neurological and physical impairments associated with NGLY1 deficiency.
The data presented here provide valuable insights about the clinical course of NGLY1 deficiency. The sample size of 29 participants in this NHS represents a substantial proportion of the population of approximately 100 identified individuals with NGLY1 deficiency (2,4, data on file). This study demonstrates that the profound neurodevelopmental impairments, quality of life, and other outcomes of NGLY1 deficiency do not improve and often decline over at least a 1-year period, despite existing interventions like physical therapy and symptom management. This dataset informs endpoints, selection of assessment tools, and monitoring intervals for interventional clinical trials. Such assessments include GNA levels as a pharmacodynamic biomarker, instruments that measure language/communication and motor deficits (particularly improved hand use), HRQoL, clinical/caregiver global impressions of change, tear production and QSART. Seizures and neurophysiologic characterization are also relevant because, as previously described, almost all participants had EEG abnormalities, indicating increased risk of epilepsy (15). As the overall disease course shows a slow but progressive decline in neurocognitive and motor function, interventions that result in stabilization or a slowing of the decline in function could be considered as efficacious.
Materials and Methods
Study design
The NGLY1 NHS reported here was a prospective, longitudinal observational study conducted by Stanford University (http://clinicaltrials.gov, NCT03834987) and funded by the Grace Science Foundation (gracescience.org), a research and advocacy group for NGLY1 deficiency. The planned enrollment was up to 50 patients with a confirmed diagnosis of NGLY1 deficiency, with up to 15 time points per participant. Study procedures included annual in-person (‘onsite’ participants) or annual remote (‘remote’ participants) evaluations along with remote assessments for each group every 4 months between annual evaluations (Fig. 1). Established developmental and HRQoL measures as well as standardized laboratory and clinical assessments were employed.
Participants
Participants included males and females of any age with a suspected or confirmed diagnosis of NGLY1 deficiency based on the identification of (likely) pathogenic variants in both NGLY1 alleles and clinical characteristics consistent with the disease. Parent(s)/legal representative(s) of participants were required to give informed consent/assent for study participation and be willing for the participant to provide clinical data, provide biological samples, and participate in standardized assessments. Willingness to travel to Palo Alto, CA was favored, but not required.
Participants were excluded from the study if they had a second, confirmed disorder affecting neurodevelopment or with overlapping symptoms of NGLY1 deficiency.
Participants were permitted to be enrolled as ‘onsite’ or ‘remote’ participants. Onsite participants were scheduled to visit the clinical site once per year for the study duration, with two telephone/video visits in between each annual visit at 4-month intervals. Remote participants were scheduled for annual telephone/video visit with two telephone/video visits in between each annual visit at 4-month intervals. Most assessments began at baseline, except for SSDS, Schirmer’s test, and the question about the most bothersome symptom, which began in Year 2. These assessments therefore have a lower number of data points.
Participants enrolled in the study at different times (between February 15, 2019 and October 14, 2020); however, the end date of the study was the same for all patients. For this reason, the number of participants with an assessment at each study time point was variable and generally decreased over time. This effect was compounded by the COVID-19 pandemic, which caused delays in enrollment and assessments.
Assessments
Primary objectives
There were two primary outcome measures for the NGLY1 deficiency NHS: (i) developmental assessment at baseline and longitudinally, as measured by the established scales and (ii) disease course over time as measured by standardized medical histories.
The following established scales were used for the primary outcome capturing development assessment: MSEL, Vineland-3, PDMS-2 and Beery–Buktenica Test of Visual Motor Integration (Beery VMI).
The MSEL is a direct assessment and provides a broad global assessment of development in children from birth to 68 months by examining five key subscales: gross motor, fine motor, visual reception, expressive language and receptive language. The DQ, which is calculated by averaging the five areas of the Mullen scale and dividing the developmental age by the chronological age × 100 (a DQ of 100 corresponds to an exact match between the developmental and chronological age), provides an overall approximation of the affected individual’s ability to function (31).
The Vineland-3 is a parent/caregiver-reported measure that uses a semi-structured interview to assess adaptive behavior across four domains: communication, daily living skills, socialization and motor skills. It is used to support the diagnosis of intellectual and developmental disabilities (32). The Vineland ABC is derived from the communication, daily living skills and socialization domains.
The PDMS-2 includes five subscales used to calculate two quotients: grasping and visual–motor integration (which are used to calculate the fine motor quotient [FMQ]); and stationary, locomotion and object manipulation, replaced by the reflexes subtest for children up to 11 months old (which are used to calculate the gross motor quotient [GMQ)]). FMQ and GMQ can also be combined to yield a total motor quotient (TMQ). FMQ, GMQ and TMQ are scored similarly to the DQ. They compare developmental age to chronological age; a score of 100 represents an exact match between developmental age and chronological age. Scores that are lower or higher than 100 represent a developmental age that is less or more than the chronological age, respectively (33).
The Beery VMI is administered by a clinician and assesses the ability to integrate visual and motor activities in individuals 2 years of age and older. It requires individuals to copy a sequence of geometric forms using paper and pencil. While the Beery VMI was a planned assessment for this NHS, participants in the study were too developmentally impaired to attempt this test (34).
The Bruininks–Oseretsky Test of Motor Proficiency Second Edition and Differential Ability Scales-II were used for higher functioning subjects but are not discussed in this paper because they were only conducted in three participants.
The primary outcome measure of disease course over time was measured by collecting standardized medical histories that included general physical evaluations, clinical neurologic evaluations, standardized dysmorphology evaluations, laboratory studies (comprehensive metabolic panel, liver function tests, creatine kinase, lactic acid, fasting lipid panel, adrenocorticotropic hormone, cortisol and biochemical studies), scoring of movement disorders (including 10-MWT), and standardized and Schirmer’s ophthalmologic evaluations.
Schirmer’s test was used to evaluate (hypo)alacrima. This test determines whether the eye produces sufficient tears by placing calibrated test strips of non-toxic filter paper within the lower eyelid of each eye for 5 min and measuring the distance traveled by the tears on the test strips (16).
The sitting and standing abilities were part of the neurologic exam and used to measure gross motor function (35). Minimal support was defined as hands only, and maximal support was the requirement for truncal support. The 10-MWT was used to measure walking speed in meters per second over a short walking distance at an individual’s usual walking speed (comfortable speed) and/or walking as quickly as possible (fast speed) (36).
Secondary objectives
Secondary objectives included identification of clinical endpoints or biomarkers for therapeutic trials, and caregiver and participant QoL at baseline and longitudinally. Participant QoL was measured through the PedsQL as reported by the caregiver. The PedsQL measures quality of life in children and adolescents; it includes 23 questions in four domains: physical, emotional, social and school functioning. Caregiver QoL was measured through self-report using SF-36. The SF-36 measures quality of life in adults, adolescents, and children and includes 36 questions in eight domains: vitality, physical functioning, bodily pain, general health perceptions, physical role functioning, emotional role functioning, social role functioning and mental health. Finally, a single question asking caregivers to identify the most bothersome symptom for the participant was included.
Other procedures completed at baseline and longitudinally as tolerated included: EEG, seizure diary (when applicable for those experiencing active seizures), NCS and quantitative studies of autonomic function (QSART). EEG and seizure diary results are reported in a separate paper (15).
Biomarker
The assay for GNA substrate biomarker has been described previously (10). This assay uses liquid chromatography/tandem mass spectrometry (LC/MS/MS) in positive electrospray ionization mode (ESI+) for the quantitation of GNA in human plasma. Test samples, calibration standards and QC samples were processed by protein precipitation with acetonitrile to enrich the analyte in the matrix samples. Samples were homogenized in phosphate-buffered saline (PBS) and mixed with three volumes of ice-cold Internal Standard (IS) Solution (acetonitrile containing 60 ng/ml d3-GNA, Omicron Biochemicals, Inc.; catalog number AAG-004, Lot# Q01-N0816). They were then centrifuged at 6100 g for 30 min. An aliquot of each supernatant was transferred to an autosampler plate. The supernatant was separated via high-performance liquid chromatography (HPLC; Shimadzu VP Series 10 System) and analyzed via MS/MS (Applied Biosystems/MDS SciEx API 4000). Detection and accuracy were assessed in surrogate matrices (PBS + bovine serum albumin, charcoal stripped serum). Each surrogate matrix was spiked with 30 and 300 ng/ml of GNA (Omicron Biochemicals, Inc.; catalog number AAG-003), processed and analyzed to determine recovery and accuracy. The processed samples were analyzed by LC/MS/MS using a HILIC column. GNA was quantified using d3-GNA (β-D-GlcN[2H3]Ac-(1,N)-Asn) as an IS. The calibration range was 5–2500 ng/ml using 20 μl of sample. The analyte/IS peak area ratios (y) versus the nominal analyte concentrations (×) of the calibration samples were used to fit a calibration curve by power regression (origin excluded). The analyte concentrations for the calibration standards, quality control samples, and unknown (study) samples were calculated using the established calibration equation.
Statistical methodology
This NHS was descriptive; thus, data were considered hypothesis-generating and not subjected to power analysis. Demographic data and baseline disease characteristics were summarized for all enrolled participants. Clinical and biological data were summarized over the study period. Data were presented descriptively, and regression and/or ANOVA analyses were performed to characterize disease course and any associated markers.
GNA biomarker data was analyzed using R (version 3.5.1 (2018-07-02)—‘Feather Spray’) Scripts available upon request.
Acknowledgements
Dr Maura Ruzhnikov contributed to protocol development and was the principal investigator of the study. Dr Stephen Maricich reviewed and analyzed preliminary data. Medical writing, editing, and design assistance was provided by Judy Wiles, Trish Rawn, and Selma Tse of Facet Communications Inc. Caroline Stanclift served as a liaison between GSF and the trial site; graphic presentations were provided by Alicia Newton.
Conflict of Interest statement. Authors S.S.D., S.T., W.F.M., B.J.B., and M.W. are employees of Grace Science, LLC. K.J.L. is a consultant for the Grace Science Foundation.
Contributor Information
Sandra Tong, Grace Science Foundation, Menlo Park, CA 94026, USA.
Pamela Ventola, Cogstate, New Haven, CT 06510, USA; Yale Child Study Center, New Haven, CT 06519, USA.
Christina H Frater, Department of Neurology, Stanford University, Stanford, CA 94305, USA.
Jenna Klotz, Department of Neurology, Stanford University, Stanford, CA 94305, USA.
Jennifer M Phillips, Department of Neurology, Stanford University, Stanford, CA 94305, USA.
Srikanth Muppidi, Department of Neurology, Stanford University, Stanford, CA 94305, USA.
Selina S Dwight, Grace Science Foundation, Menlo Park, CA 94026, USA.
William F Mueller, Grace Science Foundation, Menlo Park, CA 94026, USA.
Brendan J Beahm, Grace Science Foundation, Menlo Park, CA 94026, USA.
Matt Wilsey, Grace Science Foundation, Menlo Park, CA 94026, USA.
Kevin J Lee, Grace Science Foundation, Menlo Park, CA 94026, USA.
Data and Code Availability
The datasets that support this study are available from the corresponding author upon reasonable request, subject to institution ethical considerations for participant privacy and consent.
Ethical Approval
Informed consent was obtained from all study participants according to the study protocol approved by the Stanford Institutional Review Board (IRB Protocol # 47335). Parents gave written informed consent for their children or dependents.
Authors’ Contributions
Conceptualization: S.S.D., W.F.M., B.J.B., M.W., K.J.L., J.K.; Study coordination: M.W., C.H.F; Data curation: S.S.D., W.F.M.; Formal analysis: S.T., P.V., S.S.D., W.F.M., C.H.F., S.M; Investigation: S.D.D., W.R.M., J.K., J.P., C.H.F, S.M.; Visualization: S.T., W.F.M., K.J.L.; Writing-original draft: S.T., P.V., S.S.D., W.F.M; Writing-review & editing: S.T., P.V., S.S.D., W.F.M., B.J.B., M.W., K.J.L, J.K., J.P., C.H.F.
Funding
This study was supported by a grant from the Grace Science Foundation to Stanford University.
References
- 1. Adams, J. and Schaaf, C.P. (2018) Diagnosis and genetics of alacrima. Clin. Genet., 94, 54–60. [DOI] [PubMed] [Google Scholar]
- 2. Enns, G.M., Shashi, V., Bainbridge, M., Gambello, M.J., Zahir, F.R., Bast, T., Crimian, R., Schoch, K., Platt, J., Cox, R. et al. (2014) Mutations in NGLY1 cause an inherited disorder of the endoplasmic reticulum-associated degradation pathway. Genet Med., 16, 751–758. [DOI] [PMC free article] [PubMed] [Google Scholar]
- 3. Lam, C., Wolfe, L., Need, A., Shashi, V. and Enns, G. (2018) NGLY1-related congenital disorder of deglycosylation. In: Adam, M.P., Mirzaa, G.M., Pagon, R.A., Wallace, S.E., Bean, L.J.H., Gripp, K.W., and Amemiya, A. (ed.) GeneReviews® [Internet]. University of Washington, Seattle, WA, USA, 1993–2023. https://www.ncbi.nlm.nih.gov/sites/books/NBK481554/. [PubMed] [Google Scholar]
- 4. Pandey, A., Adams, J.M., Han, S.Y. and Jafar-Nejad, H. (2022) NGLY1 deficiency, a congenital disorder of deglycosylation: from disease gene function to pathophysiology. Cell, 11, 1155. [DOI] [PMC free article] [PubMed] [Google Scholar]
- 5. Dabaj, I., Sudrié-Arnaud, B., Lecoquierre, F., Raymond, K., Ducatez, F., Guerrot, A.-M., Snanoudj, S., Coutant, S., Sauger-Veber, P., Marret, S. et al. (2021) NGLY1 deficiency: a rare newly described condition with a typical presentation. Life., 11, 187. [DOI] [PMC free article] [PubMed] [Google Scholar]
- 6. Kalfon, L., Baydany, M., Samra, N., Heno, N., Segal, Z., Eran, A., Yulevich, A., Fellig, Y., Mandel, H. and Falik-Zaccai, T.C. (2022) Congenital hypotonia: cracking a SAGA of consanguineous kindred harboring four genetic variants. Mol. Genet. Genomic Med., 10, e1849. [DOI] [PMC free article] [PubMed] [Google Scholar]
- 7. Stuut, T., Popescu, O. and Oviedo, A. (2021) N-Glycanase 1 deficiency is a rare cause of pediatric neurodegeneration with neuronal inclusions and liver steatosis. Cureus, 13, e19126. [DOI] [PMC free article] [PubMed] [Google Scholar]
- 8. Suzuki, T., Huang, C. and Fujihira, H. (2016) The cytoplasmic peptide: N-glycanase (NGLY1) – structure, expression and cellular functions. Gene, 577, 1–7. [DOI] [PMC free article] [PubMed] [Google Scholar]
- 9. Haijes, H.A., de Sain-van der Velden, M.G.M., Prinsen, H.C.M.T., Willems, A.P., van der Ham, M., Gerrits, J., Couse, M.H., Friedman, J.M., van Karnebeek, C.D.M., Selby, K.A. et al. (2019) Aspartylglycosamine is a biomarker for NGLY1-CDDG, a congenital disorder of deglycosylation. Mol. Genet. Metab., 127, 368–372. [DOI] [PubMed] [Google Scholar]
- 10. Mueller, W.F., Zhu, L., Tan, B., Dwight, S., Beahm, B., Wilsey, M., Wechsler, T., Mak, J., Cowan, T., Pritchett, J. et al. (2022) GlcNAc-Asn is a biomarker for NGLY1 deficiency. J. Biochem., 171, 177–186. [DOI] [PMC free article] [PubMed] [Google Scholar]
- 11. Zhu, L., Tan, B., Dwight, S., Beahm, B., Wilsey, M., Crawford, B.E., Schweighardt, B., Cook, J.W., Wechsler, T. and Mueller, W.F. (2022) AAV9-NGLY1 gene replacement therapy improves phenotypic and biomarker endpoints in a rat model of NGLY1 deficiency. Meth. Clin. Dev., 27, 269–271. [DOI] [PMC free article] [PubMed] [Google Scholar]
- 12. Lam, C., Ferreira, C., Krasnewich, D., Toro, C., Latham, L., Zein, W.M., Lehky, T., Brewer, C., Baker, E.H., Thurm, A. et al. (2017) Prospective phenotyping of NGLY1-CDDG, the first congenital disorder of deglycosylation. Genet. Med., 19, 160–168. [DOI] [PMC free article] [PubMed] [Google Scholar]
- 13. Cahan, E.M. and Frick, S.L. (2019) Orthopaedic phenotyping of NGLY1 deficiency using an international, family-led disease registry. Orphanet. J. Rare. Dis., 14, 148. [DOI] [PMC free article] [PubMed] [Google Scholar]
- 14. Need, A.C., Shashi, V., Hitomi, Y., Schoch, K., Shianna, K.V., McDonald, M.T., Meisler, M.H. and Goldstein, D.B. (2012) Clinical application of exome sequencing in undiagnosed genetic conditions. J. Med. Genet., 49, 353–361. [DOI] [PMC free article] [PubMed] [Google Scholar]
- 15. Levy, R.J., Frater, C.H., Gallentine, W.B., Phillips, J.M. and Ruzhnikov, M.R. (2022) Delineating the epilepsy phenotype of NGLY1 deficiency. J. Inherit. Metab. Dis., 45, 571–583. [DOI] [PubMed] [Google Scholar]
- 16. Karampatakis, V., Karamitsos, A., Skriapa, A. and Pastiadis, G. (2010) Comparison between normal values of 2- and 5-minute Schirmer test without anesthesia. Cornea, 29, 497–501. [DOI] [PubMed] [Google Scholar]
- 17. Li, N., Deng, X.G. and He, M.F. (2012) Comparison of the Schirmer I test with and without topical anesthesia for diagnosing dry eye. Int. J. Ophthalmol., 5, 478–481. [DOI] [PMC free article] [PubMed] [Google Scholar]
- 18. Ryan, C.S., Conlee, E.M., Sharma, R., Sorenson, E.J., Boon, A.J. and Laughlin, R.S. (2019) Nerve conduction normal values for electrodiagnosis in pediatric patients. Muscle Nerve, 60, 155–160. [DOI] [PubMed] [Google Scholar]
- 19. Illigens, B.M.W. and Gibbons, C.H. (2009) Sweat testing to evaluate autonomic function. Clin. Auton. Res., 19, 79–87. [DOI] [PMC free article] [PubMed] [Google Scholar]
- 20. Novak, P. (2011) Quantitative autonomic testing. J. Vis. Exp., 53, 2502. [DOI] [PMC free article] [PubMed] [Google Scholar]
- 21. Hullmann, S.E., Ryan, J.L., Ramsey, R.R., Chaney, J.M. and Mullins, L.L. (2011) Measures of general pediatric quality of life. Arthritis Care Res., 63, S420–S430. [DOI] [PubMed] [Google Scholar]
- 22. Valier, A.R.S., Bacon, C.E.W., Bay, R.C., Molzen, E., Lam, K.C. and Valovich McLeod, T.C. (2017) Reference values for the pediatric quality of life scale inventory and the multidimensional fatigue scale in adolescent athletes by sport and sex. Am. J. Sports Med., 45, 2723–2729. [DOI] [PubMed] [Google Scholar]
- 23. Pinto, P.L., Machado, C., Janiero, P., Dupont, J., Quintas, S., Sousa, A.B. and Gaspar, A. (2020) NGLY1 deficiency – a rare congenital disorder of glycosylation. J. Inherit. Metab. Dis. Rep., 53, 2–9. [DOI] [PMC free article] [PubMed] [Google Scholar]
- 24. Willems, M., Wells, C.F., Coubes, C., Pequignot, M., Kouny, A. and Michon, F. (2022) Hypoalacrima and alacrima as diagnostic features for genetic or congenital conditions. Invest. Ophthalmol. Vis. Sci., 63, 3. [DOI] [PMC free article] [PubMed] [Google Scholar]
- 25. Hall, P.L., Lam, C., Alexander, J.J., Asif, G., Berry, G.T., Ferreira, C., Freeze, H.H., Gahl, W.A., Nickander, K.K., Sharer, J.D. et al. (2018) Urine oligosaccharide screening by MALDI-TOF for the identification of NGLY1 deficiency. Mol. Genet. Metab., 124, 82–86. [DOI] [PMC free article] [PubMed] [Google Scholar]
- 26. Chang, C.A., Wei, X.C., Martin, S.R., Sinasac, D.S. and Al-Hertani, W. (2019) Transiently elevated plasma methionine, S-adenosylmethionine and S-adenosylhomocysteine: unreported laboratory findings in a patient with NGLY1 deficiency, a congenital disorder of deglycosylation. JIMD. Rep., 49, 21–29. [DOI] [PMC free article] [PubMed] [Google Scholar]
- 27. Heeley, J. and Shinawi, M. (2015) Multi-systemic involvement in NGLY1-related disorder caused by two novel mutations. Am. J. Med. Genet. A, 167A, 816–820. [DOI] [PubMed] [Google Scholar]
- 28. Lipiński, P., Cielecka-Kuszyk, J., Socha, P. and Tylki-Szymanska, A. (2020) Liver involvement in NGLY1 congenital disorder of deglycosylation. Pol. J. Pathol., 71, 66–68. [DOI] [PubMed] [Google Scholar]
- 29. Rios-Flores, I.M., Bonal-Perez, M.A., Castellanos-Gonzalez, A., Velez-Gomez, E., Bertoli-Avella, A.M., Bobadilla-Morales, L., Pena-Padilla, C., Appendini-Andrade, V., Corona-Rivera, A., Romero-Valenzuela, I. et al. (2020) Acute liver failure in a male patient with NGLY1-congenital disorder of deglycosylation. Eur. J. Med. Genet., 63, 103952. [DOI] [PubMed] [Google Scholar]
- 30. Lipari Pinto, P., Machado, C., Janeiro, P., Dupont, J., Quintas, S., Sousa, A.B. and Gaspar, A. (2020) NGLY1 deficiency—a rare congenital disorder of deglycosylation. J. Inherit. Metab. Dis. Rep., 53, 2–9. [DOI] [PMC free article] [PubMed] [Google Scholar]
- 31. Aylward, G.P. and Stanchin, T. (2008) Chapter 7: Screening and assessment tools. In Wolraich, M.L. (ed), Developmental-Behavioral Pediatrics. Mosby Elsevier, Philadelphia, PA, pp. 123–201. [Google Scholar]
- 32. Farmer, C., Adedipe, D., Bal, V., Chlebowski, C. and Thurm, A. (2020) Concordance of the Vineland adaptive behaviour scales, second and third editions. J. Intellect. Disabil. Res., 64, 18–26. [DOI] [PMC free article] [PubMed] [Google Scholar]
- 33. Rebelo, M., Serrano, J., Duarte-Mendes, P., Monteiro, D., Paulo, R. and Marinho, D.A. (2021) Evaluation of the psychometric properties of the Portuguese Peabody developmental motor Scales-2 edition: a study with children aged 12 to 48 months. Children (Basel), 8, 1049. [DOI] [PMC free article] [PubMed] [Google Scholar]
- 34. Spencer, T.D. and Kruse, L. (2010) Beery-Buktenica Developmental Test of Visual Motor Integration. In Volkmar, F.R. (ed), Encyclopedia of Autism Spectrum Disorders. Springer, New York, NY. [Google Scholar]
- 35. Pereira, A.C., Ribeiro, M.C. and Araujo, A.P.Q.C. (2016) Timed motor function tests capacity in healthy children. Arch. Dis. Child., 101, 147–151. [DOI] [PMC free article] [PubMed] [Google Scholar]
- 36. de Baptista, C.R.J.A., Vicente, A.M., Souza, M.A., Cardoso, J., Ramalho, V.M. and Mattiello-Sverzut, A.C. (2020) Methods of 10-meter walk test and repercussions for reliability obtained in typically developing children. Rehabil. Res. Pract., 2020, 1–7. [DOI] [PMC free article] [PubMed] [Google Scholar]
Associated Data
This section collects any data citations, data availability statements, or supplementary materials included in this article.
Data Availability Statement
The datasets that support this study are available from the corresponding author upon reasonable request, subject to institution ethical considerations for participant privacy and consent.


