

 )
)Abstract
Objectives:
To determine the trends in incidence, prevalence, and mortality of systemic lupus erythematosus (SLE) in a US population over four decades.
Methods:
We identified all the patients with SLE in Olmsted County, Minnesota who fulfilled the EULAR/ACR criteria for SLE during 1976-2018. Age- and sex-specific incidence and prevalence dates were adjusted to the standard 2000 projected US population. The EULAR/ACR score was used as a proxy for disease severity. Standardized mortality ratio (SMR) was estimated.
Results:
There were 188 incident SLE cases in 1976-2018 (mean age 46.3 ± SD 16.9; 83% female). Overall age- and sex- adjusted annual SLE incidence per 100,000 population was 4.77 (95% confidence interval 4.09-5.46). Incidence was higher in women (7.58) than men (1.89]). The incidence rate increased from 3.32 during 1976-1988 to 6.44 during 2009-2018. Incidence rates were higher among the racial and ethnic minority populations than non-Hispanic Whites. The EULAR/ACR score did not change significantly over time. Overall prevalence increased from 30.6 in 1985 to 97.4 in 2015. During the study period there was no improvement in SMR over time (p = 0.31).
Conclusions:
The incidence and prevalence of SLE are increasing in this US population. The increase in incidence may be at least partially explained by the rising ethnic/racial diversity of the population. There was no evidence that the severity of SLE has changed over time. The survival gap between SLE and the general population remains unchanged. As the US grows more diverse, we might continue to see an increase in the incidence of SLE.
Keywords: Systemic lupus erythematosus, incidence, prevalence, mortality
INTRODUCTION
Systemic lupus erythematosus (SLE) is a chronic systemic autoimmune disease with heterogeneous clinical manifestations. Its complex clinical presentation and the pluralistic nature of the United States (US) health system have made it difficult to obtain accurate estimates of the incidence, prevalence, and mortality of SLE. The Centers for Disease Control and Prevention (CDC) five surveillance registries have provided estimates regarding the incidence and prevalence of SLE across different racial and ethnic groups. These registries have confirmed that SLE is more frequent in racial and ethnic minority populations compared with the White population.[1] Prior studies have reported discrepant results regarding the incidence trends of SLE, some reporting an increase while others reporting a decrease in SLE incidence. However, case ascertainment has been conducted in short periods of time, thus not providing long-term trends. In addition, prior studies have not explored potential explanations for the observed trends.
The aims of this study were to examine the trends in the incidence, prevalence, and mortality of SLE in a well-defined geographic area over four decades.
METHODS
Study design
The Lupus Midwest Network (LUMEN ) is a population-based study that utilizes the resources of the Rochester Epidemiology Project (REP), a record-linkage system. This epidemiologic study includes residents of Olmsted County, Minnesota, and has a >99% capture of the census population in the REP. This system ensures virtually complete ascertainment of all clinically recognized cases of SLE among the residents of Olmsted County, Minnesota.[2] The characteristics and strengths of the REP, as well as its generalizability have been described elsewhere.[3, 4] The population of Olmsted County was 144,248 in 2010, with 74.7% aged ≥18 years and a racial/ethnic distribution of 85.7% White, 4.2% Hispanic, 4.8% Black, 5.5% Asian/Native Hawaiian/Pacific Islander and 0.2% American Indian/Alaska Native.[5] The study was approved by the institutional review boards of the Mayo Clinic (20-006485) and Olmsted Medical Center (036-OMC-20). Patients and the Public were not involved in this study.
Case finding, definitions, and ascertainment
We screened potential SLE cases in Olmsted County using 1) the International Classification of Diseases (ICD)-9 and ICD-10 codes for SLE, cutaneous lupus erythematosus, and other associated diseases (supplemental material) and 2) laboratory measures associated with SLE such as anti-nuclear antibodies (≥1:80), low complement, anti-double stranded DNA, anti-Sm, lupus anticoagulant anticardiolipin (IgG, IgM, and IgA), and anti-beta 2 glycoprotein 1 (IgG, IgM and IgA) antibodies.
Clinical data for these criteria were thoroughly abstracted through medical record review (supplemental material). If a disease manifestation could be better explained by a condition other than SLE, it was not counted towards the criteria. We used the EULAR/ACR criteria because it classifies more patients with SLE in population-based studies than the SLICC and ACR97 criteria.[6, 7] The SLE incidence date was defined as the earliest date of criteria fulfillment. Only adults (age 18 and older) were included in this study. A case was considered to be incident if the patient was an Olmsted County resident prior to the SLE incidence date. Data regarding age, sex, self-reported race and ethnicity (Hispanic, and non-Hispanic White, Asian and Black), date of first documentation of each manifestation, clinical data from the EULAR/ACR, SLICC, and ACR97 and the estimated SLE damage index 2000 (SLEDAI-2K), date of diagnosis, date of last follow up, vital status, clinical characteristics and laboratory findings were recorded. To be considered a prevalent case, patients needed to reside in Olmsted County and meet the case definition prior to our four dates of point prevalence estimation: January 1st of 1985, 1995, 2005 and 2015. To fully capture the prevalent cases, those subjects who migrated to Olmsted County after diagnosis (and therefore were under treatment) were included in the prevalence estimation (in addition to those identified using the incidence case definition) if they had 7 EULAR/ACR points and a physician diagnosis. The first author performed an independent review of all patients who met the EULAR/ACR criteria to confirm that the disease manifestations were correctly attributed to SLE.
Statistical analysis
Descriptive statistics were used to summarize continuous and categorical data. Age- and sex-specific incidence rates were estimated by using the number of incident cases as the numerator and population counts from the REP census as the denominator.[2] Overall incidence rates were age- or age/sex-adjusted per 100,000 population to the standard 2000 projected US population.[8] To compute 95% confidence intervals (95% CI) for incidence rates, it was assumed that the number of incident cases followed a Poisson distribution. Trends in incidence rates were examined using Poisson regression methods with smoothing splines for age and calendar year. Sensitivity analyses were performed using the ACR97 and SLICC criteria. SLE incidence rates over the 1976-2018 study period were graphically illustrated for seven age groups. The relationship between age at SLE diagnosis and incidence date was also evaluated using linear regression.
To explore the increasing racial/ethnic diversity in the county potentially affecting the incidence of SLE, we estimated the overall incidence rates in the non-Hispanic White and racial and ethnic minority populations during the 1999-2018 timeframe and examined differences in incidence rates between the two groups using Poisson regression methods. Race-specific denominators were available starting in 1999. To investigate if milder cases were being identified over the years, the EULAR/ACR score points up to one year after classification were calculated as a proxy for disease severity, and its relationship to the corresponding SLE incidence date was assessed using linear regression and local polynomial regression fitting methods.[9] A sensitivity analysis using a retrospectively estimated SLEDAI-2K at time of classification was performed.[10, 11] (Further methods details in supplemental material.)
The point prevalence of SLE in 1985, 1995, 2005, and 2015 was determined using the number of prevalent cases on January 1 of the respective year as the numerator and the Olmsted County population based on the REP census in the corresponding year as the denominator adjusted to the standard 2000 projected US total population.
Mortality rates following the diagnosis of SLE were estimated using Kaplan-Meier methods and were compared to the expected survival rates in the Minnesota population. The standardized mortality ratio (SMR) was estimated as the ratio of the observed to the expected number of deaths. Trends in SMR over time were examined using Poisson regression models. Ninety-five percent confidence intervals for the SMR were calculated assuming that the expected rates are fixed, and the observed rates followed a Poisson distribution.
Analyses were performed using SAS software version 9.4 (SAS Institute) and R version 4.0.3 (R Foundation for Statistical Computing).
RESULTS
From January 1, 1976, to December 31, 2018, there were a total of 188 SLE incident cases in Olmsted County. The mean age at diagnosis was 46.3 (SD±16.9) years, and 83% of the patients were female. Eighty-two percent of the patients were non-Hispanic White, 5% were non-Hispanic Black, 3% were Hispanic and 10% were non-Hispanic Asian. Over the four decades of the study, the percentage of female patients decreased from 93% to 78%. Also, the percentage of non-Hispanic White patients decreased from virtually 100% to 70% in the most recent decade (Table 1).
Table 1.
Demographics of incident systemic lupus erythematosus patients between January 1, 1976, and December 31, 2018, Olmsted County, Minnesota.
| Timeframe | |||||
|---|---|---|---|---|---|
| 1976 to 1988 (N=28) |
1989 to 1998 (N=31) |
1999 to 2008 (N=53) |
2009 to 2018 (N=76) |
Total (N=188) |
|
| Sex, n (%) | |||||
| Female | 26 (93) | 28 (90) | 43 (81) | 59 (78) | 156 (83) |
| Male | 2 (7) | 3 (10) | 10 (19) | 17 (22) | 32 (17) |
| Age (years) | |||||
| Mean (SD) | 45.3 (16.7) | 41.0 (16.7) | 45.6 (16.7) | 49.4 (16.8) | 46.3 (16.9) |
| Race/Ethnicity, n (%) | |||||
| Hispanic | 0 (0) | 0 (0) | 2 (4) | 4 (5) | 6 (3) |
| Asian* | 0 (0) | 2 (7) | 4 (8) | 12 (16) | 18 (10) |
| Black* | 0 (0) | 1 (3) | 1 (2) | 7 (9) | 9 (5) |
| White* | 27 (100) | 27 (90) | 45 (85) | 53 (70) | 152 (82) |
| Other* | 0 (0) | 0 (0) | 1 (2) | 0 (0) | 1 (1) |
| Missing | 1 | 1 | 0 | 0 | 2 |
Abbreviations: SD= Standard deviation.
Non-Hispanic
Clinical characteristics of incident SLE.
At the time the 188 patients met the EULAR/ACR classification criteria, 100% were antinuclear antibody (ANA) positive. The most common clinical manifestations were arthritis (54%), leukopenia (44%) and acute cutaneous lupus (21%). Seven patients (4%) had biopsy proven lupus nephritis and 15 (8%) had proteinuria. Neurologic manifestations were rare at classification time. Most of the patients were positive for anti-dsDNA, anti-Sm or both, 13% were positive for at least one antiphospholipid antibody (aPL) and more than 30% had low complement levels (either C3, C4 or both) (Table 2).
Table 2.
Clinical manifestations at the time of meeting classification among 188 incident EULAR/ACR criteria-defined systemic lupus erythematosus cases, Olmsted County, Minnesota, 1976–2018. *
| EULAR/ACR Criteria | (N=188) |
|---|---|
|
| |
| n (%) | |
|
| |
| ANA positive | 188 (100) |
|
| |
| Clinical Criteria | |
|
| |
| Fever | 12 (6) |
| Leukopenia | 83 (44) |
| Thrombocytopenia | 32 (17) |
| Autoimmune hemolysis | 4 (2) |
| Delirium | 1 (1) |
| Psychosis | 0 (0) |
| Seizure | 2 (1) |
| Nonscarring alopecia | 5 (3) |
| Oral ulcers | 12 (6) |
| Subacute cutaneous OR discoid lupus | 21 (11) |
| Acute cutaneous lupus | 39 (21) |
| Pleural or pericardial effusion | 17 (9) |
| Acute pericarditis | 10 (5) |
| Arthritis | 102 (54) |
| Proteinuria | 15 (8) |
| Class II or V lupus nephritis | 3 (2) |
| Class III or IV lupus nephritis | 4 (2) |
|
| |
| Immunologic Criteria | |
|
| |
| Antiphospholipid antibodies | 24 (13) |
| Low C3 OR C4 | 41 (22) |
| Low C3 AND C4 | 27 (14) |
| Anti-dsDNA OR anti-Sm | 132 (70) |
Abbreviations: ANA=antinuclear antibodies; anti-dsDNA=anti-double-stranded DNA antibody; anti-Sm=anti-Smith antibody.
Systemic lupus erythematosus (SLE) cases were defined according to the European Alliance of Associations for Rheumatology (EULAR)/American College of Rheumatology (ACR) criteria (met at least ten points, and at least one clinical criterion and ANA positivity). The clinical manifestation included were at the time the case met classification criteria.
Incidence of SLE.
The overall age- and sex-adjusted incidence of SLE from 1976 to 2018 per 100,000 population was 4.77 (95% CI 4.09-5.46). The incidence was higher in females (7.58, 95% CI 6.38-8.78) than in males (1.89, 95% CI 1.23-2.55) (Table 3). The overall incidence rates were higher among females for those ages 18-79. Beyond age 80 the incidence rates for males and females were comparable (data not shown).
Table 3.
Estimated incidence and prevalence rates (per 100,000 population) and 95% confidence intervals of systemic lupus erythematosus, overall and by sex groups and decade over 43 years, Olmsted County, Minnesota, 1976–2018. *
| Calendar year | Rates (95% Confidence Interval) | ||
|---|---|---|---|
|
| |||
| Incidence | Females† | Males† | Overall‡ |
|
|
|||
| 1976-1988 | 5.89 (3.52 – 8.26) | 0.55 (0 – 1.33) | 3.32 (2.03 – 4.60) |
| 1989-1998 | 6.22 (3.88 – 8.57) | 0.95 (0 – 2.04) | 3.58 (2.29 – 4.87) |
| 1999-2008 | 8.08 (5.65 – 10.51) | 2.24 (0.84 – 3.64) | 5.19 (3.78 – 6.59) |
| 2009-2018 | 9.59 (7.10 – 12.09) | 3.18 (1.65 – 4.72) | 6.44 (4.97 – 7.91) |
|
| |||
| 1976-2018 | 7.58 (6.38 – 8.78) | 1.89 (1.23 –2.55) | 4.77 (4.09 – 5.46) |
|
| |||
| Prevalence | |||
| 1985 | 51.48 (30.08 – 72.87) | 7.93 (0.01 – 15.86) | 30.65 (18.86 – 42.44) |
| 1995 | 72.9 (50.79 – 95.0) | 10.79 (1.2 – 20.38) | 42.67 (30.41 – 54.94) |
| 2005 | 99.87 (76.68 – 123.06) | 19.14 (8.24 – 30.04) | 60.53 (47.51 – 73.55) |
| 2015 | 158.54 (130.5 – 186.59) | 32.83 (19.39 – 46.27) | 97.40 (81.61 – 113.19) |
Rates are per 100,000 population. Denominator data are based on the Rochester Epidemiology Project census (see reference in text).
Age adjusted to the 2000 projected US population
Age- and sex-adjusted to the 2000 projected US population
The overall incidence increased in each consecutive decade, from 3.32 (95% CI 2.03-4.60) per 100,000 during 1976-1988 to 6.44 (95% CI 4.97-7.91) per 100,000 during 2009-2018, an increase of 2% per year (95% CI: 1%,3%, p<0.001) (Table 3). These results were similar using the SLICC criteria (177 incident cases, increase of 2% per year [95% CI 0.4-3%, p=0.009]), but by the ACR97 criteria did not reach statistical significance (155 incident cases, increase of 1% per year [95 CI −0.3—2.4%, p=0.099] The rise in incidence was observed both in females and males and across age groups (Table 3; Figure 1). In females we observed over a 60% increase in the incidence of SLE over four decades (from 5.9 to 9.6/100,000), while in males we observed almost a six-fold increase (from 0.55 to 3.18 per 100,000). The female:male ratio changed from 11:1 in 1976-1988, to 3:1 in the most recent decade. However, there was no evidence that the increase over calendar time was significantly different between men and women (interaction p=0.27). The mean age at SLE diagnosis increased over time by 1.8 years (95% CI −0.3—3.9) per decade (Figure 2) (p=0.09)
Figure 1.
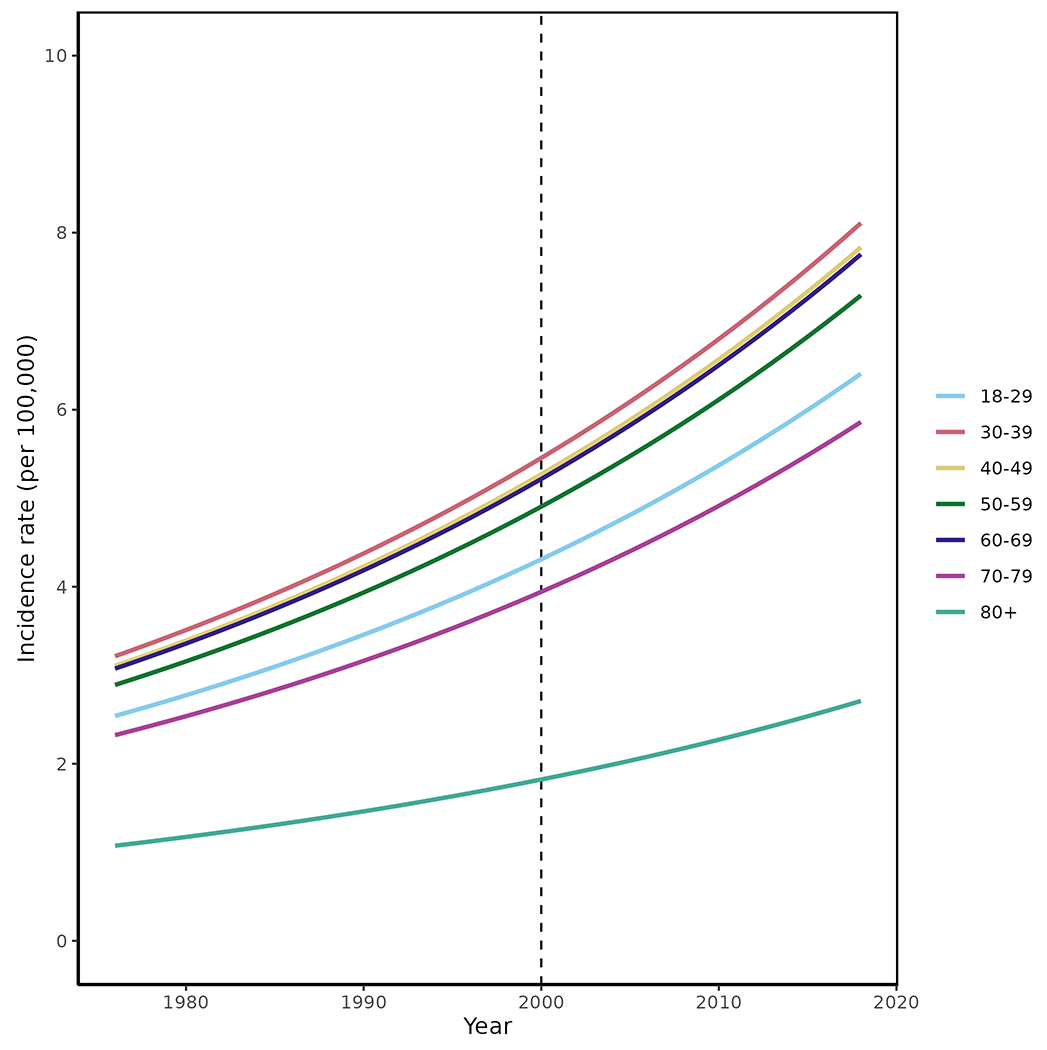
Trends in incidence of systemic lupus erythematosus among residents of Olmsted County, Minnesota in 1976-2018 according to age groups. Trends in incidence rates were examined using Poisson regression methods with smoothing splines for age and calendar year. SLE incidence rates over the 1976-2018.
Figure 2.
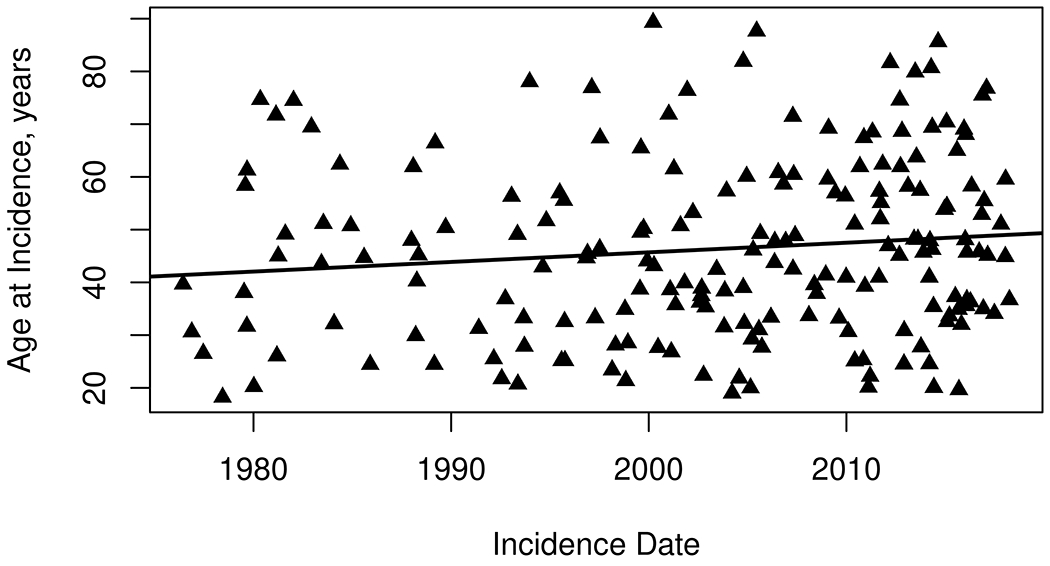
Trends in age at diagnosis of systemic lupus erythematosus among residents of Olmsted County, Minnesota in 1976–2018. The mean age at SLE diagnosis increased over time by 1.8 years (95% CI: −0.3, 3.9) per decade (p=0.09)
The overall incidence rate for SLE for the non-Hispanic White and racial and ethnic minority populations during 1999-2018 were 5.42 (95% CI: 4.34-6.51) per 100,000 and 8.17 (95% CI: 5.04-11.30) per 100,000, respectively; this difference was statistically significant (Rate ratio: 1.89, 95% CI: 1.25-2.84, p = 0.002).
The overall incidence rate of SLE increased 24% from 5.19/100,000 in the 1999-2008 decade to 6.44/100,000 in the 2009-2018 decade, but this increase did not reach statistical significance (Rate ratio: 1.25 per decade; 95% CI: 0.88-1.78; p=0.20). Among Whites, the incidence rate of SLE increased 4% from 5.27/100,000 in the 1999-2008 decade to 5.46/100,000 in the 2009-2018 decade, but this increase did not reach statistical significance (Rate ratio: 0.01 per decade; 95% CI: 0.68-1.51; p=0.95).
Figure 3 shows the EULAR/ACR score within one year of meeting classification criteria among all the incident cases. We observed that for each decade the EULAR/ACR points decreased by 0.9 (95% CI: −1.8—0.1; p=0.07). The sensitivity analysis using SLEDAI-2K showed a decrease of 0.3 points per decade (95% CI: −1.2—0.6; p=0.36).
Figure 3.
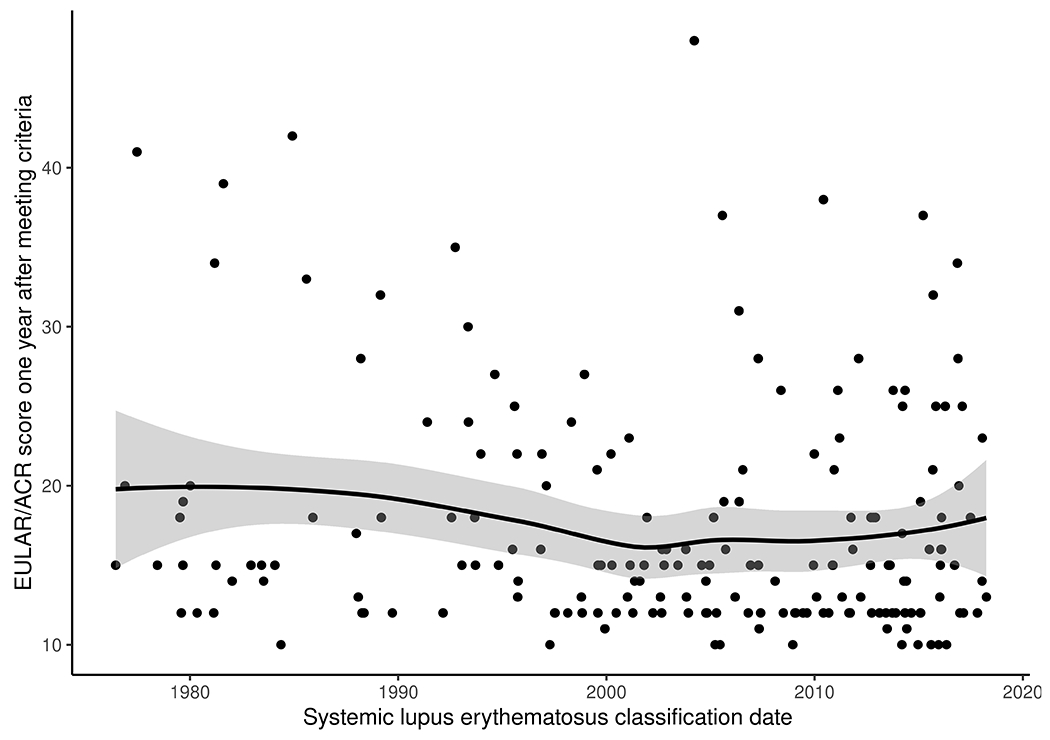
Trends in the systemic lupus erythematosus EULAR/ACR criteria score within one year of fulfilling criteria (as a proxy for disease severity) in Olmsted County, Minnesota 1976-2018. Per decade there is a decrease of 0.9 (95% CI: −1.8, 0.1) in the EULAR/ACR criteria one year after classification (p=0.07). Abbreviations: EULAR, European League against Rheumatism; ACR American College of Rheumatology.
Prevalence of SLE.
There were 28 prevalent cases with SLE on January 1, 1985 and 153 cases on January 1, 2015. The overall point prevalence per 100,000 increased from 30.65 (95% CI: 18.86 – 42.44) in 1985 to 97.4 (95% CI: 81.61-113.19) in 2015. As noted in Table 3, the prevalence in females had a threefold increase while the prevalence in males increased fourfold. To assess whether ascertainment bias may have impacted the prevalence rates over time, we examined the length of prior medical history, Olmsted County residence and SLE duration for each prevalence cohort. No trends were found in these assessments.
Mortality in SLE.
During a median follow-up of 9.7 years, 47 patients with incident SLE died. Survival in our cohort was 93% (95% CI: 89%-97%) at 5 years, 83% (95% CI: 77%-89%) at 10 years and 69% (95% CI: 61%-79%) at 20 years after diagnosis of SLE. The survival of patients with SLE was lower than the general population (Figure 4). There were no improvements in the mortality rate over the four decades of the study. The SMR of SLE patients compared to the general population between 1976 and 2018 was 2.2 (95% CI: 1.6, 3.0) and there was no improvement in the SMR over time (rate ratio: 1.01 per calendar year; 95% CI: 0.99-1.04; p = 0.31) (Table 4).
Figure 4.
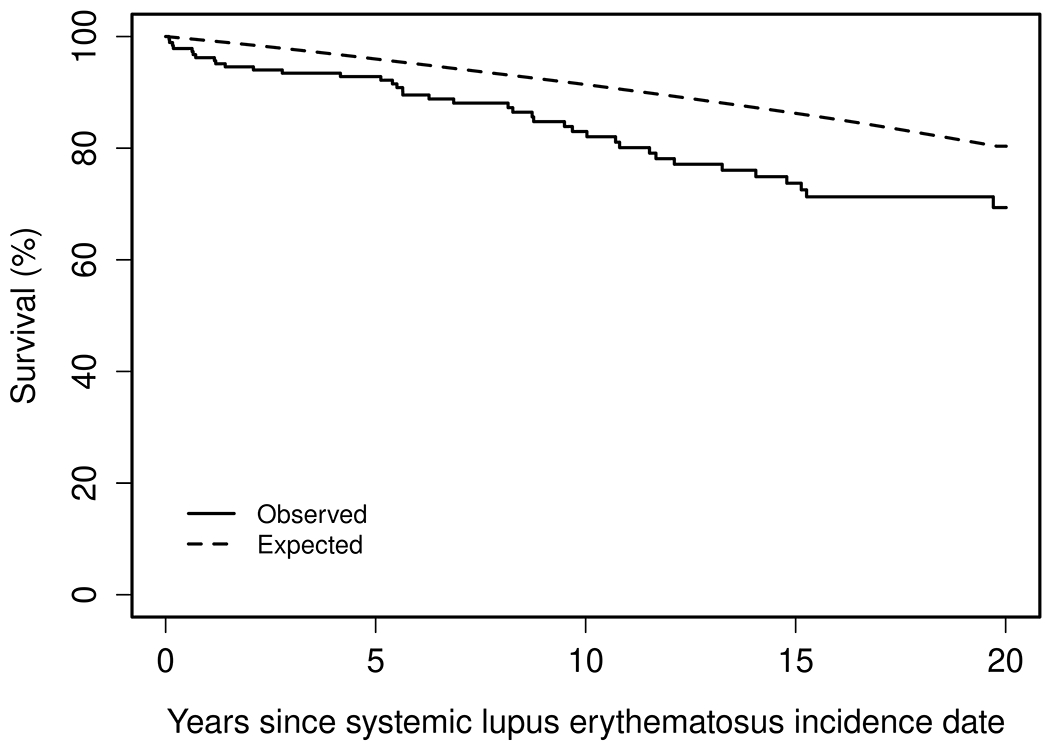
Overall survival among patients diagnosed with systemic lupus erythematosus residing in Olmsted County, Minnesota in 1976-2018.
Table 4.
Mortality rate and standardized mortality ratios (SMR) for 188 patients with incident systemic lupus erythematosus (SLE), by decade and by age group, Olmsted County, MN (1976-2018).
| Decade | Number of deaths | Expected number of deaths | SMR (95% CI) | 10-year mortality rate (%) (95% CI) |
|---|---|---|---|---|
| 1976-1988 | 15 | 8.38 | 1.79 (1.0, 2.95) | 12.2 (0.0, 24.3) |
| 1989-1998 | 10 | 3.33 | 3.00 (1.44, 5.52) | 16.9 (2.2, 29.5) |
| 1999-2008 | 11 | 5.67 | 1.94 (0.97, 3.47) | 13.7 (3.7, 22.6) |
| 2009-2018 | 11 | 3.80 | 2.89 (1.44, 5.18) | 24.4 (7.5, 38.3) |
| Total (1976-2018) | 47 | 21.18 | 2.22 (1.63, 2.96) | 17.0 (10.7, 22.9) |
|
| ||||
| Age | ||||
| <40 | 7 | 2.02 | 3.46 (1.39, 7.14) | 4.6 (0.0, 9.7) |
| ≥40 | 40 | 19.16 | 2.09 (1.49, 2.84) | 25.3 (15.5, 34) |
DISCUSSION
Since the mid-2000’s the CDC has funded a number of SLE registries that provided state-of-the-art epidemiologic estimates of SLE across different racial/ethnic populations in the US Among the CDC-funded SLE registries, our study provides estimates regarding the incidence, prevalence and mortality trends over four decades using the recently validated and endorsed EULAR/ACR criteria.
In our population-based study, we estimated an SLE incidence of 4.77 per 100,000 over the study period (1976-2018) and a prevalence of 97.4 per 100,000 on January 1, 2015. Our study showed that the incidence and prevalence of SLE have increased over the decades particularly in males. In our analysis of incidence by race/ethnicity (1999-2018), the incidence of SLE was higher in racial and ethnic minority population than non-Hispanic and has increased more rapidly in the general population than in the non-Hispanic White population only. While the latter did not reach statistical significance due to the rarity of SLE, it suggests that the increased incidence of SLE in recent decades may be driven at least in part due to the increased racial and ethnic diversity of the population in the same time period. During the study period, Olmsted County’s minority population went from <1% in the 1970’s to ~21% in the most recent census.[12, 13] There was no evidence that the severity of SLE has decreased over time. Our study also showed that the mortality of SLE has remained persistently elevated, with no improvement in SMR compared to the general population.
Earlier reports by the CDC showed an SLE incidence rate of 4.6-7.4/100,000, using the ACR 97 criteria.[14–18] Our study using the EULAR/ACR criteria had a similar overall incidence, however the ascertainment period of the previous CDC registries was 3 years compared to the 43 years of the current study. In addition, the demographics of the populations of each registry are different.
We are aware of only one prior study in the US that explored long-term SLE epidemiology. This study was performed in Rochester, Minnesota (a city within Olmsted county) and compared the incidence trends from 1980-1992 and those from an earlier study (1950-1979). In that study, the incidence increased from 1.51 to 5.56/100,000.[19] The study predates the development of ACR classification criteria, the widespread adoption of LE cell, ANA and specific autoantibody testing, which may explain the very low incidence in the 1950’s. Our study started in 1976 when the use of ANA, complement and anti-ds DNA was already available in clinical practice.
Several studies, predominantly in Europe, have examined SLE incidence trends. Studies performed in the United Kingdom using the UK General Practice Research Database have had discrepant results; from 1990 to 1999, there were no changes in the SLE incidence, however, from 1999 to 2012 they did observe a decline of 1.8% per year.[20, 21] These studies used different methodologies and the Read codes used for these studies were not validated against SLE classification criteria or physician diagnosis. Studies done in Denmark and Norway showed stable incidence over eight and ten years respectively.[22, 23] Southern European countries have had discrepant results. While a study from Crete, Greece reported an increase in SLE from 1999 to 2010 and then stabilization from 2010 to 2013, studies from Lugo, Spain showed that from 1987 to 2006 there was an initial increase in the incidence in the earlier years of the study and decrease in the latter portion, without an overall trend.[24, 25] A report from South Korea showed a decrease in incidence from 2005 to 2015.[26]
Our study showed that over a period of 43-years, the incidence of SLE increased 2% per year. Furthermore, this increase was observed both in females and males and across age groups. In contrast to prior studies, our study was able to capture long-term trends. By reviewing more than four decades of data from a population with access to exhaustive medical records (including autopsies), we were able to fully capture all SLE cases occurring during this period. Our finding agrees with what has been noted in the other registries, that the incidence of SLE is higher in racial and ethnic minorities than in non-Hispanic Whites, suggesting that the increasing racial and ethnic diversity in Olmsted County which became more pronounced in the last two decades is responsible at least in part for the increase in the incidence of SLE. This last point is of relevance in the US. The most recent census showed that from 2010-2020 the proportion of non-Hispanic Whites decreased from 63.7% to 57.8% in 2020.[27] This trend has persisted for decades and is likely going to continue, since the population under age 15 is even more diverse than the general population.[28] Thus, it is possible that as the US becomes more diverse, the incidence of SLE will continue increasing.
We observed an increase in SLE prevalence from 30.65 in 1985 to 97.4/100,000 in 2015. Our study agrees with multiple prior reports showing that the prevalence of SLE is rising.[29] This can be explained at least in part due to improved survival. While our study did not show improvement in mortality rates, perhaps due to the small number of events, a meta-analysis of SLE survival studies showed improvement in mortality up until the mid-1990’s, these gains in survival in recent decades might be driving the rise in prevalence of SLE.[30] We did not find evidence of ascertainment bias that could explain the increases in SLE prevalence. Our data shows that the gains in survival in SLE have not been enough to keep up with the gains in the general population or to close the survival gap.
Our study has several strengths. We ascertained cases for over 40 years, allowing us to provide a unique description of how the epidemiology of SLE is changing in the long-term. Through the record-linkage system of the REP, we identified all cases of SLE in a dynamic population that has been extensively characterized since 1966. We ascertained SLE cases using the newly endorsed EULAR/ACR classification criteria through detailed medical record review, thus minimizing misclassification.
Our study also has limitations. First, being a retrospective study, we relied on the completeness of medical record documentation and workup to ascertain SLE cases. Second, aPL started to be tested in the 1980’s. aPL only contributes 2 points of the total EULAR/ACR score and the impact in the incidence and prevalent estimate is minimal. We minimized the lack of aPL testing in the earlier decades by attributing the potential two points related to aPL to those patients who had a false positive serologic test for syphilis. Third, the EULAR/ACR score requires that the patients have a positive ANA, potentially missing ANA-negative lupus; however, in a prior study we showed that the EULAR/ACR criteria performed better in epidemiologic studies than other criteria.[6] In addition, in the SLICC cohort only 4% of their patients were ANA negative at a titer of 1:80, therefore is unlikely this would have an impact on our estimates.[31] Fourth, our data are based on a single US county, so differences in population distributions by age and race/ethnicity may not be generalizable, particularly to US regions that are highly diverse. Extrapolation of our results to other populations should be done with caution. Fifth, our study may be underpowered to detect subtle improvements in mortality trends.
In conclusion, the results of this population-based study showed that in this US population the incidence and prevalence of SLE is increasing. The increase in incidence may be at least partially explained by the increased ethnic and racial diversity in the population. The survival gap between SLE and the general population remains unchanged. As the US grows more diverse, we might continue to see an increase in the incidence of SLE.
Supplementary Material
Key Messages.
What is already known on this topic
Prior studies have reported discrepant results regarding the incidence trends of SLE, some reporting an increase while others reporting a decrease in SLE incidence. However, case ascertainment has been conducted in short periods of time, thus not providing long-term trends.
What this study adds
Our study shows increasing incidence and prevalence of SLE over the last four decades in this US population. Concomitant with the increased ethnic/racial diversity of the region.
The severity of SLE at diagnosis has remained the same from 1976 to 2018.
There have not been improvements in SLE survival in recent decades.
How this study might affect research, practice or policy
As the US grows more diverse, we might continue to see an increase in the incidence of SLE.
Financial support:
The Lupus Midwest Network (LUMEN) project is supported by the Centers for Disease Control and Prevention of the U.S. Department of Health and Human Services (HHS) under Grant number U01 DP006491 as part of a financial assistance award totaling $1,750,000 with 100 percent funded by CDC/HHS.
The findings and conclusions in this report are those of the authors and do not necessarily represent the official position of the Centers for Disease Control and Prevention or the National Institutes of Health.
The Rochester Epidemiology Project was supported by the National Institute on Aging of the National Institutes of Health under Award Number R01AG034676, and Grant Number UL1 TR002377 from the National Center for Advancing Translational Sciences (NCATS), a component of the National Institutes of Health.
Alí Duarte-García is supported by the Rheumatology Research Foundation Scientist Development Award and the Robert D. and Patricia E. Kern Center for the Science of Health Care Delivery.
Competing Interests:
Mehmet Hocaoglu is supported by the Rheumatology Research Foundation.
Cynthia S. Crowson is supported by the National Institutes of Health.
REFERENCES
- 1.Izmirly PM, Parton H, Wang L, McCune WJ, Lim SS, Drenkard C, et al. Prevalence of Systemic Lupus Erythematosus in the United States: Estimates From a Meta-Analysis of the Centers for Disease Control and Prevention National Lupus Registries. Arthritis Rheumatol. 2021. Jun; 73(6):991–996. [DOI] [PMC free article] [PubMed] [Google Scholar]
- 2.St Sauver JL, Grossardt BR, Yawn BP, Melton LJ 3rd, Rocca WA. Use of a medical records linkage system to enumerate a dynamic population over time: the Rochester epidemiology project. Am J Epidemiol. 2011. May 1; 173(9):1059–1068. [DOI] [PMC free article] [PubMed] [Google Scholar]
- 3.St Sauver JL, Grossardt BR, Yawn BP, Melton LJ 3rd, Pankratz JJ, Brue SM, et al. Data resource profile: the Rochester Epidemiology Project (REP) medical records-linkage system. Int J Epidemiol. 2012. Dec; 41(6):1614–1624. [DOI] [PMC free article] [PubMed] [Google Scholar]
- 4.St Sauver JL, Grossardt BR, Leibson CL, Yawn BP, Melton LJ 3rd, Rocca WA. Generalizability of epidemiological findings and public health decisions: an illustration from the Rochester Epidemiology Project. Mayo Clin Proc. 2012. Feb; 87(2):151–160. [DOI] [PMC free article] [PubMed] [Google Scholar]
- 5.Population of Olmsted County, Minnesota: Census 2010 and 2000 Interactive Map, Demographics, Statistics, Graphs, Quick Facts. [cited; Available from: http://censusviewer.com/county/MN/Olmsted
- 6.Duarte-García A, Hocaoglu M, Osei-Onomah SA, Dabit JY, Giblon RE, Helmick CG, et al. Population-Based Incidence and Time to Classification of Systemic Lupus Erythematosus by Three Different Classification Criteria. Rheumatology (Oxford). 2021. Oct 29. [DOI] [PMC free article] [PubMed] [Google Scholar]
- 7.Aringer M, Costenbader K, Daikh D, Brinks R, Mosca M, Ramsey-Goldman R, et al. 2019 European League Against Rheumatism/American College of Rheumatology Classification Criteria for Systemic Lupus Erythematosus. Arthritis Rheumatol. 2019. Sep; 71(9):1400–1412. [DOI] [PMC free article] [PubMed] [Google Scholar]
- 8.Klein RJ, Schoenborn CA. Age adjustment using the 2000 projected U.S. population. Healthy People 2010 Stat Notes. 2001. Jan(20):1–10. [PubMed] [Google Scholar]
- 9.Whittall Garcia LP, Gladman DD, Urowitz M, Touma Z, Su J, Johnson SR. New EULAR/ACR 2019 SLE Classification Criteria: defining ominosity in SLE. Ann Rheum Dis. 2021. Jan 15. [DOI] [PubMed] [Google Scholar]
- 10.Gladman DD, Ibañez D, Urowitz MB. Systemic lupus erythematosus disease activity index 2000. J Rheumatol. 2002. Feb; 29(2):288–291. [PubMed] [Google Scholar]
- 11.FitzGerald JD, Grossman JM. Validity and reliability of retrospective assessment of disease activity and flare in observational cohorts of lupus patients. Lupus. 1999; 8(8):638–644. [DOI] [PubMed] [Google Scholar]
- 12.United States Census Bureau. [cited 01/26/2022]; Available from: https://www.census.gov/quickfacts/olmstedcountyminnesota
- 13.Rochester Epidemiology Project Population Overview. [cited 01/26/2022]; Available from: https://rochesterproject.org/for-researchers/population-overview/
- 14.Dall’Era M, Cisternas MG, Snipes K, Herrinton LJ, Gordon C, Helmick CG. The Incidence and Prevalence of Systemic Lupus Erythematosus in San Francisco County, California: The California Lupus Surveillance Project. Arthritis Rheumatol. 2017. Oct; 69(10):1996–2005. [DOI] [PubMed] [Google Scholar]
- 15.Ferucci ED, Johnston JM, Gaddy JR, Sumner L, Posever JO, Choromanski TL, et al. Prevalence and incidence of systemic lupus erythematosus in a population-based registry of American Indian and Alaska Native people, 2007-2009. Arthritis Rheumatol. 2014. Sep; 66(9):2494–2502. [DOI] [PMC free article] [PubMed] [Google Scholar]
- 16.Izmirly PM, Wan I, Sahl S, Buyon JP, Belmont HM, Salmon JE, et al. The Incidence and Prevalence of Systemic Lupus Erythematosus in New York County (Manhattan), New York: The Manhattan Lupus Surveillance Program. Arthritis Rheumatol. 2017. Oct; 69(10):2006–2017. [DOI] [PMC free article] [PubMed] [Google Scholar]
- 17.Lim SS, Bayakly AR, Helmick CG, Gordon C, Easley KA, Drenkard C. The incidence and prevalence of systemic lupus erythematosus, 2002-2004: The Georgia Lupus Registry. Arthritis Rheumatol. 2014. Feb; 66(2):357–368. [DOI] [PMC free article] [PubMed] [Google Scholar]
- 18.Somers EC, Marder W, Cagnoli P, Lewis EE, DeGuire P, Gordon C, et al. Population-based incidence and prevalence of systemic lupus erythematosus: the Michigan Lupus Epidemiology and Surveillance program. Arthritis Rheumatol. 2014. Feb; 66(2):369–378. [DOI] [PMC free article] [PubMed] [Google Scholar]
- 19.Uramoto KM, Michet CJ Jr., Thumboo J, Sunku J, O’Fallon WM, Gabriel SE. Trends in the incidence and mortality of systemic lupus erythematosus, 1950-1992. Arthritis Rheum. 1999. Jan; 42(1):46–50. [DOI] [PubMed] [Google Scholar]
- 20.Somers EC, Thomas SL, Smeeth L, Schoonen WM, Hall AJ. Incidence of systemic lupus erythematosus in the United Kingdom, 1990–1999. Arthritis Care & Research. 2007; 57(4):612–618. [DOI] [PubMed] [Google Scholar]
- 21.Rees F, Doherty M, Grainge M, Davenport G, Lanyon P, Zhang W. The incidence and prevalence of systemic lupus erythematosus in the UK, 1999-2012. Ann Rheum Dis. 2016. Jan; 75(1):136–141. [DOI] [PMC free article] [PubMed] [Google Scholar]
- 22.Laustrup H, Voss A, Green A, Junker P. Occurrence of systemic lupus erythematosus in a Danish community: an 8-year prospective study. Scand J Rheumatol. 2009. Mar-Apr; 38(2):128–132. [DOI] [PubMed] [Google Scholar]
- 23.Lerang K, Gilboe I, Garen T, Thelle DS, Gran JT. High incidence and prevalence of systemic lupus erythematosus in Norway. Lupus. 2012. Oct; 21(12):1362–1369. [DOI] [PubMed] [Google Scholar]
- 24.Gergianaki I, Fanouriakis A, Repa A, Tzanakakis M, Adamichou C, Pompieri A, et al. Epidemiology and burden of systemic lupus erythematosus in a Southern European population: data from the community-based lupus registry of Crete, Greece. Annals of the Rheumatic Diseases. 2017; 76(12):1992–2000. [DOI] [PubMed] [Google Scholar]
- 25.Alonso MD, Llorca J, Martinez-Vazquez F, Miranda-Filloy JA, Diaz de Teran T, Dierssen T, et al. Systemic lupus erythematosus in northwestern Spain: a 20-year epidemiologic study. Medicine (Baltimore). 2011. Sep; 90(5):350–358. [DOI] [PubMed] [Google Scholar]
- 26.Bae EH, Lim SY, Han KD, Jung JH, Choi HS, Kim HY, et al. Trend of prevalence and incidence of systemic lupus erythematosus in South Korea, 2005 to 2015: a nationwide population-based study. Korean J Intern Med. 2020. May; 35(3):652–661. [DOI] [PMC free article] [PubMed] [Google Scholar]
- 27.Jensen E JN, Rabe M, Pratt B, Medina L, Orozco K, Spell L The Chance That Two People Chosen at Random Are of Different Race or Ethnicity Groups Has Increased Since 2010. [cited; Available from: https://www.census.gov/library/stories/2021/08/2020-united-states-population-more-racially-ethnically-diverse-than-2010.html
- 28.Fey WH. Declines in white youth population are countered by gains in other racial groups. 2019. [cited 2021 9/24/2021]; Available from: https://www.brookings.edu/research/less-than-half-of-us-children-under-15-are-white-census-shows/
- 29.Barber MRW, Drenkard C, Falasinnu T, Hoi A, Mak A, Kow NY, et al. Global epidemiology of systemic lupus erythematosus. Nat Rev Rheumatol. 2021. Sep; 17(9):515–532. [DOI] [PMC free article] [PubMed] [Google Scholar]
- 30.Tektonidou MG, Lewandowski LB, Hu J, Dasgupta A, Ward MM. Survival in adults and children with systemic lupus erythematosus: a systematic review and Bayesian meta-analysis of studies from 1950 to 2016. Ann Rheum Dis. 2017. Dec; 76(12):2009–2016. [DOI] [PubMed] [Google Scholar]
- 31.Choi MY, Clarke AE, St Pierre Y, Hanly JG, Urowitz MB, Romero-Diaz J, et al. Antinuclear Antibody-Negative Systemic Lupus Erythematosus in an International Inception Cohort. Arthritis Care Res (Hoboken). 2019. Jul; 71(7):893–902. [DOI] [PMC free article] [PubMed] [Google Scholar]
Associated Data
This section collects any data citations, data availability statements, or supplementary materials included in this article.