

Abstract
Endocytosis regulates the turnover of cell surface localized receptors, which are crucial for plants to rapidly respond to stimuli. The evolutionary ancient TPLATE complex (TPC) plays an essential role in endocytosis in Arabidopsis plants. Knockout or knockdown of single TPC subunits causes male sterility and seedling lethality phenotypes, complicating analysis of the roles of TPC during plant development. Partially functional alleles of TPC subunits however only cause mild developmental deviations. Here, we took advantage of the partially functional TPLATE allele, WDXM2, to investigate a role for TPC‐dependent endocytosis in receptor‐mediated signaling. We discovered that reduced TPC‐dependent endocytosis confers a hypersensitivity to very low doses of CLAVATA3 peptide signaling. This hypersensitivity correlated with the abundance of the CLAVATA3 receptor protein kinase CLAVATA1 at the plasma membrane. Genetic and biochemical analysis as well as live‐cell imaging revealed that TPC‐dependent regulation of CLAVATA3‐dependent internalization of CLAVATA1 from the plasma membrane is required for shoot stem cell homeostasis. Our findings provide evidence that TPC‐mediated endocytosis and degradation of CLAVATA1 is a mechanism to dampen CLAVATA3‐mediated signaling during plant development.
Keywords: clathrin‐mediated endocytosis, CLAVATA3‐CLAVATA1 signaling, shoot apical meristem maintenance, TPLATE complex
Subject Categories: Membranes & Trafficking, Plant Biology, Signal Transduction
TPLATE complex‐dependent endocytosis of the CLAVATA3 receptor protein kinase CLAVATA1 is required to attenuate CLAVATA3‐mediated signaling during plant development.

Introduction
Coordinating cellular responses to environmental stimuli largely relies on receptor‐like kinases (RLKs) or receptor‐like proteins (RLPs) localized on the plasma membrane (PM), that are activated by cognate peptide ligands (Hohmann et al, 2017; Claus et al, 2018; Olsson et al, 2019; Gou & Li, 2020). CLAVATA1(CLV1)‐type receptors are one of the most intensively studied groups of plant RLKs, and they are crucial for shoot apical meristem (SAM) and root apical meristem (RAM) maintenance (Clark et al, 1993, 1997; Dievart et al, 2003; DeYoung et al, 2006; Deyoung & Clark, 2008; Stahl et al, 2013). PM abundance and vacuolar targeting of CLV1 depend on the CLAVATA3 (CLV3) peptide (Nimchuk et al, 2011). However, how CLV1 signaling is modulated by its internalization remains unknown (Yamaguchi et al, 2016).
In plants, clathrin‐mediated endocytosis (CME) is the best‐characterized pathway by which cells internalize transporters, receptors, and their bound ligands from PM via transport vesicles (Zhang et al, 2015; Paez Valencia et al, 2016). Internalization of PM localized receptors can occur in a ligand‐independent or in a ligand‐dependent manner (Nimchuk et al, 2011; Beck et al, 2012; Irani et al, 2012; Ben Khaled et al, 2015; Mbengue et al, 2016; Ortiz‐Morea et al, 2016) and serves either to attenuate signaling by vacuolar degradation or to sustain signaling from endosomes (Paez Valencia et al, 2016; Claus et al, 2018).
The heterotetrameric adaptor protein complex 2 (AP‐2) and the octameric TPLATE complex (TPC) jointly function as adaptor complexes to execute CME in plants (Di Rubbo et al, 2013; Gadeyne et al, 2014; Zhang et al, 2015). Knockout or strong knockdown of single TPC subunits results in pollen and seedling lethality (Van Damme et al, 2006; Gadeyne et al, 2014; Wang et al, 2019). Mild knockdown of TPC subunits or destabilization of TPC by mutating the evolutionary most conserved domain (the WDX domain) in the TPLATE subunit, however, results in viable plants, allowing to address possible developmental functions for this complex (Van Damme et al, 2006; Bashline et al, 2015; Wang et al, 2021).
In this study, we took advantage of WDX domain‐dependent TPC destabilization to explore how reduced TPC‐dependent endocytic capacity affects receptor‐mediated signaling in plants. We compared the response of control plants (tplate −/− rescued with TPLATE‐GFP) with the response of plants expressing the partially functional allele (tplate −/− rescued with WDXM2‐GFP) upon exposure to different types of exogenous peptides.
Results and Discussion
Reduced TPC‐dependent endocytosis confers hypersensitivity to a subset of CLE peptides
In vitro bioassays comparing root growth in the presence or absence of exogenous peptide ligands provide an easy readout and are widely employed to evaluate how plants respond to peptide‐dependent signaling (Hazak et al, 2017; Poncini et al, 2017; Anne et al, 2018; Hu et al, 2018; Breda et al, 2019; Graeff et al, 2020; Blumke et al, 2021). To correlate peptide‐dependent receptor signaling with CME capacity, we selected several classes of peptide ligands. CME has been shown to internalize the pattern recognition receptors PEP RECEPTOR1 (PEPR1) and FLAGELLIN SENSING 2 (FLS2), which are the respective receptors of the Arabidopsis thaliana endogenous elicitor peptides (AtPEPs) and the bacterial peptide FLAGELLIN 22 (FLG22) (Mbengue et al, 2016; Ortiz‐Morea et al, 2016). We also included the C‐TERMINALLY ENCODED PEPTIDE 5 (CEP5), which impacts on primary root length and lateral root initiation via its proposed receptor XYLEM INTERMIXED WITH PHLOEM 1 (XIP1)/CEP RECEPTOR 1 (CEPR1) (Roberts et al, 2016). Finally, we included 14 CLV3/EMBRYO SURROUNDING REGION (CLE) peptides, which are essential for shoot and root meristem maintenance by activating various plasma membrane‐bound receptors (Yamaguchi et al, 2016).
TPLATE and WDXM2 rescued seedlings were grown in the presence of different CLE peptides. The majority of the tested CLE peptides, which were applied at nanomolar concentrations, elicited a similar response in WDXM2 and TPLATE seedlings (Fig EV1A and B). However, we observed a strong hypersensitivity of WDXM2 seedlings to CLV3, CLE10, and CLE40 (Fig EV1A and B). CLE40 is the closest homolog of CLV3 in Arabidopsis, and both peptides are crucial for root and shoot meristem maintenance (Clark et al, 1995; Fletcher et al, 1999; Brand et al, 2000; Hobe et al, 2003; Ito et al, 2006; Stahl et al, 2009, 2013; Yamaguchi et al, 2016; Schlegel et al, 2021). The specific hypersensitivity of the WDXM2‐expressing seedlings to these two closely related peptides hinted toward a connection between TPC‐dependent endocytosis and CLV1‐type receptor signaling.
Figure EV1. Impaired TPC‐dependent endocytic capacity confers hypersensitivity to a subset of CLE peptides.

-
A, BRepresentative images and quantification as box plot and jitter box graphs of the root growth between TPLATE_1 and WDXM2_1 seedlings grown for 8 days in the presence or absence of low doses (10 nM) of different CLE peptides. Scale bar = 1 cm. Primary root growth was quantified for a number of seedlings (16 ≤ N ≤ 28) and statistically significant differences were observed for CLE10, CLV3, and CLE40. ***P < 0.001 (selected pairs from Welch's ANOVA post hoc pairwise comparison with the Tukey contrasts). N.S., no significant difference. The experiment was performed twice with a similar outcome. The box plots extend from the 25th to 75th percentiles. The line inside the box marks the median. The whiskers go down and up to the 95% percentile. The red dots mark the average. The dots represent measurements of individual seedlings. The data represented are the quantification of one experiment where at least three sets of seedlings were grown on separate plates.
Source data are available online for this figure.
We subsequently treated TPLATE and WDXM2 rescued plants with CLV3, CLE40 at a concentration of 10 nM as well as with different doses of FLG22, AtPEP1, and CEP5 peptides, previously shown to affect root growth (Poncini et al, 2017), and we compared the effect between our two backgrounds that differ in their endocytic capacity (Wang et al, 2021). After a 5‐day exposure, both WDXM2 and TPLATE seedlings, grown in the presence of the peptides, showed reduced root growth compared to the control situation, indicating that they responded to the treatments. In contrast to the clearly differential effect observed for CLV3 and CLE40 (Fig 1A and B), both backgrounds responded similarly to FLG22 treatment and only a slight but statistically significant difference was found in response to the low dose of AtPEP1 but not to the higher dose (Fig 1C and D). We also did not observe any differential response between TPLATE and WDXM2 rescued plants to both low and high doses of CEP5, although the latter severely reduced root growth (Fig 1C and D). These results indicate that the differential endocytic capacity between both backgrounds elicits hypersensitivity to CLE peptides, but that the mild endocytic flux difference between both backgrounds is insufficient to generate a differential developmental effect due to FLG22‐, AtPEP1‐, or CEP5‐dependent receptor signaling at the concentrations used. We conclude that regulatory mechanisms controlling the activity of those receptors remain sufficiently active in both genetic backgrounds.
Figure 1. Impaired TPC‐dependent endocytic capacity confers hypersensitivity to CLV3 and CLE40 peptides.

-
A, BRepresentative images and quantification of the root growth ratios of TPLATE_1 and WDXM2_1 seedlings (see Table EV1 for the specifications of the lines) treated with or without (Con) low doses of CLV3 or CLE40 peptides.
-
C, DRepresentative images and quantification of the root growth ratios of TPLATE_1 and WDXM2_1 seedlings treated with or without (Con) different doses of FLG22, CEP5, and AtPEP1 peptides.
Data information: 5‐day‐old seedlings grown vertically on ½ MS medium plate were transferred to freshly prepared ½ MS medium plates supplemented with or without low doses of peptides and grown vertically for an extra 5 days. For each individual root, the primary root length after the transfer was divided by the root length of the seedling before the transfer. In (B) and (D), the numbers at the bottom of the box plot and jitter box graphs represent the number of individual roots measured. The box plot extends from the 25th to 75th percentiles. The line inside the box marks the median. The whiskers go down and up to the 95% percentile. The red dots mark the average. Differences as compared to TPLATE rescued lines are indicated (selected pairs from Welch's ANOVA post hoc pairwise comparison with the Tukey contrasts); N.S., no significant difference; *P < 0.05; **P < 0.01; ***P < 0.001. The data represented results from at least four sets of seedlings grown on separate plates. Scale bar in (A) and (C) = 1 cm.
Source data are available online for this figure.
To independently confirm the observed hypersensitivity to CLV3 and CLE40, we tested another genetic background affected in TPC function. The twd40‐2‐3 mutant is a mild knockdown allele of the TPC subunit TWD40‐2 (Bashline et al, 2015). Similar to our partially functional WDXM2 allele, twd40‐2‐3 mutant plants also exhibited a hypersensitive response to low doses of CLV3 and CLE40 treatment (Fig EV2A and B). Altogether, these results revealed that reduced TPC‐dependent endocytosis enhances CLV3 and CLE40 signaling in Arabidopsis roots.
Figure EV2. The weak TPC subunit mutant allele twd40‐2‐3 confirms the observed CLV3 and CLE40 hypersensitivity in the WDXM2_1 line.

-
A, BRepresentative images (A) and comparison (B) of the primary root growth ratios between TPLATE_1, WDXM2_1, and twd40‐2‐3 seedlings transferred to plates with or without 10 nM CLV3 or CLE40. Root growth for each root after transfer was divided by the root length before transfer. Numbers of seedlings used for the quantification are indicated at the bottom of the box plot and jitter box graphs. The box plots extend from the 25th to 75th percentiles. The line inside the box marks the median. The whiskers go down and up to the 95% percentile. The red dots mark the average. The dots represent measurements of individual seedlings. Scale bar = 1 cm.
Data information: In panel (B): Differences as compared to TPLATE rescued lines were evaluated by Welch's ANOVA post hoc pairwise comparison with the Tukey contrasts. Letters (a–c) represent significant difference between groups (P < 0.001). The quantification represented results from at least five sets of seedlings grown on separate plates.
Source data are available online for this figure.
TPC‐dependent endocytosis contributes to SAM maintenance through the WUSCHEL signaling pathway
Next to root meristem maintenance, CLV3‐dependent signaling is also essential to maintain SAM homeostasis. Long‐term synthetic CLV3 peptide treatment dampens cell proliferation and thus consumes the SAM (Ishida et al, 2014; Hu et al, 2018). To investigate the importance of TPC‐dependent endocytosis for SAM maintenance, we compared the sensitivity of TPLATE and WDXM2 rescued plants to long‐term CLV3 peptide treatment. Seedling morphologies indicated that TPLATE and WDXM2 seedlings were equally capable of maintaining their SAM in the presence of very low doses of exogenous CLV3 peptides (10 nM), even during long‐term treatment (Fig 2A and B). However, higher concentrations (100 nM and 1 μM) of CLV3 revealed hypersensitivity of WDXM2 seedlings and increasingly caused SAM termination in independent mutant WDXM2 lines (Figs 2A and B, and EV3A and B). The hypersensitivity of WDXM2 plants to CLV3 further correlated with the protein levels of the complementation constructs in the rescued tplate mutant lines (Fig EV3C). These results suggest that TPC‐dependent endocytic deficiency causes a dose‐dependent hypersensitivity to CLV3‐dependent receptor signaling.
Figure 2. Impaired TPC‐dependent endocytic capacity confers hypersensitivity to CLV3 in SAM.

-
APhenotypic comparison of 3‐ to 4‐week‐old TPLATE_1 and WDXM2_1 rosette stage plants grown on ½ MS with or without different doses of CLV3 peptide. Magenta arrows indicate terminated SAMs. Scale bar = 1 cm.
-
BQuantification of the amount of terminated shoot apical meristems in relation to the dose of CLV3 applied. The number of plants used for the quantification is indicated at the top of the bar chart.
-
C, DRepresentative images (C) and quantification (D) of WUS::GUS expression in the vegetative SAMs of 3‐day‐old TPLATE_1 and WDXM2_1 seedlings treated with or without different doses of CLV3 peptide. Intermediate (blue arrowhead) and weak (cyan arrowhead) WUS expression is indicated in the SAMs of WDXM2_1 seedlings after CLV3 treatment. Scale bar = 50 μm. WUS expression after CLV3 treatment was visually scored and quantified. The numbers of seedlings analyzed are indicated at the top of the bar chart.
Data information: The data represented in panel (B) result from at least five sets of seedlings grown on separate plates. The data represented in panel (D) are the combination of two independent repetitions.
Source data are available online for this figure.
Figure EV3. Impaired TPC‐dependent endocytic capacity confers CLV3 hypersensitivity in the SAM and this hypersensitivity correlates with the expression level of the rescue construct.

- Phenotypic comparison of 3‐ to 4‐week‐old independent TPLATE (TPLATE_1 and TPLATE_3) and WDXM2 (WDXM2_1 and WDXM2_3) lines (GFP and mSCARLET fusions, respectively) grown in the presence or absence of CLV3 peptide. Magenta arrows indicate terminated SAMs. Scale bars = 1 cm.
- Quantification of the number of plants with a terminated meristem induced by the CLV3 peptide. The numbers of plants used for the quantification are indicated at the top of the bar chart. The experiment was repeated twice, and the quantification in panel (B) combines both experiments.
- Anti‐TPLATE Western blot detecting the presence of endogenous TPLATE in Col‐0 (asterisk) as well as the full length of GFP (TPLATE _1, WDXM2_1, and WDXM2_2) or mSCARLET (TPLATE_3 and WDXM2_3) fusions of TPLATE and WDXM2 in the rescued tplate −/− homozygous mutant background that lacks endogenous TPLATE. For an unknown reason, the mSCARLET fusions give rise to several bands on the blot. The WDXM2_2 line showed a similar expression level as the WDXM2_1 and was not used further. The reduced expression in WDXM2_3 correlates with an increased hypersensitivity to the CLV3 treatment. The large subunit of RUBISCO (around 50 kDa) visualized via the stain‐free gel was used as loading control.
Source data are available online for this figure.
In the SAM, CLV3 signaling functions in a negative feedback circuit to dampen stem cell proliferation by regulating the expression of the homeodomain transcription factor WUSCHEL (WUS) (Hazak & Hardtke, 2016; Yamaguchi et al, 2016; Kitagawa & Jackson, 2019). To further examine whether TPC‐dependent endocytosis is involved in the CLV–WUS feedback loop to regulate SAM homeostasis, we analyzed the expression patterns of WUS in TPLATE and WDXM2 rescued plants following a 3‐day CLV3 peptide treatment. Both 10 and 100 nM CLV3 peptide treatment did not visibly impair WUS promoter activity in TPLATE vegetative SAMs at the seedling level compared to control conditions as visualized by GUS staining (Fig 2C and D). In WDXM2 vegetative SAMs, however, CLV3 application dampened WUS expression in a dose‐dependent manner (Fig 2C and D), which is coherent with the terminated SAM phenotype observed at the rosette stage level upon prolonged treatment (Fig 2A and B). These findings reveal that TPC‐dependent endocytosis is involved in the regulation of CLV3‐WUS signaling in the SAM.
TPC‐dependent endocytosis internalizes CLV1 to dampen CLV3‐dependent signaling
The receptor kinase CLV1 signals in response to CLV3 and plays a central role in shoot meristem maintenance (Clark et al, 1997; Fletcher et al, 1999; Brand et al, 2000; Ogawa et al, 2008; Shinohara & Matsubayashi, 2015; Somssich et al, 2015). CLV1 levels increase at PM in the absence of CLV3 and accumulate in the vacuole in the presence of CLV3 (Nimchuk et al, 2011). CLV3‐induced vacuolar accumulation of CLV1 suggests a negative regulation of CLV3/CLV1 signaling by internalization, yet this hypothesis remains to be experimentally tested (Yamaguchi et al, 2016).
To characterize whether TPC‐dependent endocytosis functions in CLV1 internalization, we evaluated whether the response of TPLATE and WDXM2 rescued plants to CLV3 treatment depended on the presence of CLV1. Combining the clv1‐101 null allele (Kinoshita et al, 2010) with our TPLATE and WDXM2 rescued plants largely suppressed the hypersensitivity to exogenous CLV3 leading to SAM termination in WDXM2, although not completely (Fig 3A and B). Combining the strong and dominant‐negative clv1 mutant allele clv1‐8 (Clark et al, 1997; Dievart et al, 2003) restored SAM maintenance in WDXM2 in the presence of 100 nM CLV3 (Fig 3A and B). The differential effect of exogenous CLV3 on SAM activity between WDXM2, WDXM2/clv1‐101, and WDXM2/clv1‐8 was also apparent in the number of leaves that the plants produced (Fig 3C).
Figure 3. CLV1 loss‐of‐function dampens CLV3 hypersensitivity in the SAMs of WDXM2 rescued plants.
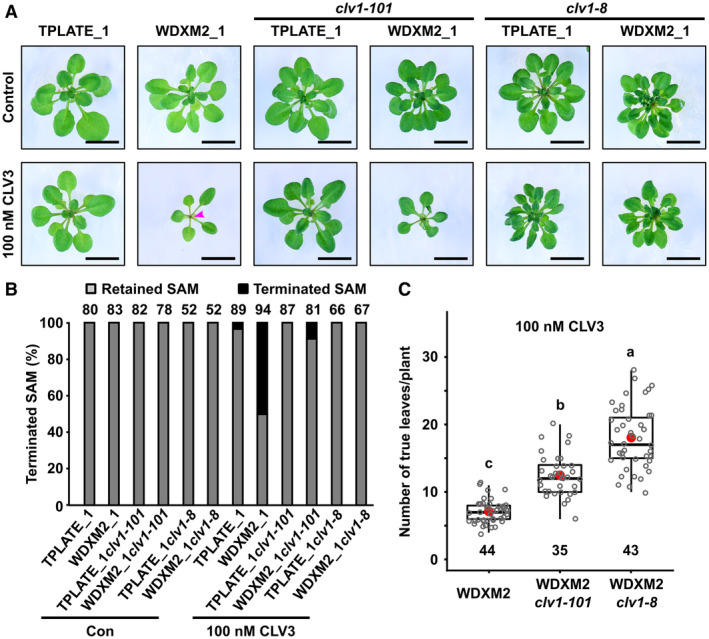
- Phenotypic comparisons of 3‐ to 4‐week‐old TPLATE_1 and WDXM2_1 plants as well as combinations of these with the clv1 null (clv1‐101) or dominant negative (clv1‐8) mutant backgrounds under control conditions or in the presence of 100 nM exogenous CLV3 peptide. The magenta arrowhead indicates a terminated SAM. Scale bar = 1 cm.
- Quantification of the amount of terminated meristems in relation to the dose of CLV3 peptide applied. Numbers of plants used for quantification are indicated at the top of the bar chart.
- Box plot and jitter box representation of the quantification of the number of leaves produced by WDXM2, WDXM2/clv1‐101, and WDXM2/clv1‐8 plants grown in vitro on medium supplemented with 100 nM CLV3. Numbers of biological samples are indicated at the bottom of the box plot and jitter box graphs. The box plot extends from the 25th to 75th percentiles. The line inside the box marks the median. The whiskers go down and up to the 95% percentile. The red dots mark the average. Letters (a–c) represent significantly different groups (P < 0.001) evaluated by Welch's ANOVA post hoc pairwise comparison with the Tukey contrasts.
Data information: The data represented in panel (B) result from at least six sets of seedlings grown on separate plates. The data in panel (C) are based on a random selection of 3–4 plates from panel (B).
Source data are available online for this figure.
These results reveal that CLV1 predominantly contributes to the hypersensitivity of CLV3‐dependent signaling in WDXM2 mutant plants. The different capacity of the clv1‐101 null allele and the clv1‐8 dominant negative allele to reduce the sensitivity of WDXM2 to CLV3 is likely attributed to genetic redundancy within the CLV1 receptor family (DeYoung et al, 2006; Deyoung & Clark, 2008; Nimchuk et al, 2015; Shinohara & Matsubayashi, 2015; Nimchuk, 2017).
The WDXM mutation destabilizes TPC and thereby negatively affects endocytic capacity (Wang et al, 2021). The entire TPC complex is required to execute CME at PM (Gadeyne et al, 2014; Wang et al, 2020, 2021; Johnson et al, 2021; Yperman et al, 2021b) and destabilizing TPC in WDXM2 rescued plants impairs endocytic capacity while it does not affect recruitment of the two AtEH/Pan1 subunits at PM, which are involved in promoting autophagy (Wang et al, 2019, 2021). It is therefore likely that the CLV1‐dependent hypersensitivity to CLV3 is linked to altered endocytosis of CLV1 in WDXM2. CLV1 is a master regulator of flower development (Clark et al, 1997; Schoof et al, 2000). Both TPLATE and WDXM2 are expressed in the inflorescence meristem at roughly similar levels, although in these tissues, WDXM2 appears to be slightly less PM‐associated compared to TPLATE (Fig EV4A). CLV1 undergoes CLV3‐mediated degradation in inflorescence meristems upon induction of CLV3 expression in the clv3‐2 mutant background (Nimchuk et al, 2011). We subsequently addressed whether we could visualize ligand‐dependent degradation of CLV1 in our background. Live‐cell imaging revealed a strong vacuolar accumulation of CLV1‐GFP in the inflorescence meristem of the control background (TPLATE_3) upon short time treatment with exogenous CLV3 peptide as well as a clear increase in vacuolar flux visualized by an increased ratio of free GFP over full‐length protein, which is a proxy for degradation, in the presence of CLV3. Moreover, our live‐cell imaging and biochemical analysis also showed that CLV1 degradation was dampened in inflorescence meristems in the WDXM2_3 background (Fig EV4B and C). In agreement with reduced internalization and degradation of CLV1 in WDXM2 inflorescence meristems, our live imaging analysis in vegetative meristems clearly showed increased levels of CLV1‐GFP in WDXM2 rescued plants compared to control plants (Fig 4).
Figure EV4. TPLATE and WDXM2 expression and localization in flower meristems and internalization of CLV1.

- Serial optical cross‐sections through the inflorescence meristem, showing localization of TPLATE and WDXM2 in layer 1–3 (L1‐L2‐L3). Left images are intensity scaled. Images on the right for each genotype represent the merged GFP and PI channels. Scale bar = 25 μm.
- Representative Z‐stack projections (three optical slices, ~3 μm) of flower meristems of TPLATE_3 and WDXM2_3 lines expressing pCLV1::CLV1‐GFP with or without (mock) short‐term exogenous CLV3 treatment (30 min; 100 μM). The quantification shows the relative number of meristems with strong or weak vacuolar accumulation of CLV1. n = 8 for TPLATE_3(mock); n = 8 for TPLATE_3(CLV3); n = 4 for WDXM2_3(mock) and n = 6 for WDXM2_3(CLV3). Scale bar = 20 μm.
- Western blots showing the bead fraction of two independent IP experiments of CLV1 from flower meristems of TPLATE_3 and WDXM2_3 lines with (+) or without (−) short‐term treatment with exogenous CLV3 (30 min; 100 μM). The quantification shows the fraction of the free GFP degradation band at 25 kDa over the total amount of signal. The line presents the mean, and the dots represent the results of the two independent experiments. MW, molecular weight marker (kDa).
Source data are available online for this figure.
Figure 4. Reduced TPC‐dependent endocytic capacity impairs internalization of CLV1 from the PM in SAM cells.

Confocal images and quantification of Arabidopsis seedlings showing enhanced PM localization of CLV1‐GFP in WDXM2_3 vegetative meristems compared to vegetative meristems of TPLATE_3 lines with or without exogenous CLV3 (100 nM) in the growing medium from germination onward. Left panels are merged channels (GFP and PI), and right panels are GFP‐only channels represented via an intensity scale. Scale bar = 20 μm. The box plot and jitter box representation graph shows the average fluorescence intensity (8‐bit gray values) of CLV1 over the entire SAM (indicated by a dotted line). The box plot extends from the 25th to 75th percentiles. The line inside the box marks the median. The whiskers go down and up to the 95% percentile. The red dots mark the average. Numbers of biological samples from two repeats are indicated at the bottom of the box plot and jitter box graphs. Differences of CLV1‐GFP intensity between WDXM2_3 and TPLATE_3 lines under both conditions were evaluated by Welch's ANOVA post hoc pairwise comparison with the Tukey contrasts. Letters (a–c) represent significant difference between groups (a–c; P < 0.001). The quantification is a combination of two independent experiments for each genotype and treatment.Source data are available online for this figure.
In vegetative meristems and in the presence of endogenous levels of CLV3 however, signal intensities of CLV1 varied before and after exogenous CLV3 application. Live‐cell imaging of the same vegetative meristem before and after CLV3 addition (Fig EV5A) as well as quantification of treated and untreated meristems however revealed that CLV1 levels significantly reduced upon long‐term (present in the medium from germination onward; Fig 4) or short‐term (10 and 30 min; Fig EV5B–E) exogenous CLV3 application in TPLATE seedlings, while this was not the case in WDXM2 seedlings (Figs 4 and EV5B–E).
Figure EV5. Reduced TPC‐dependent endocytic capacity impairs internalization of CLV1 from PM in vegetative SAM cells upon short‐term CLV3 treatment.

-
ARepresentative images of two vegetative SAMs in the TPLATE_3 background, with different levels of CLV1 expression, imaged before and after exogenous CLV3 treatment (1 μM for 30 min). Two different focal planes of a Z‐stack, visualizing different L3 cells per SAM, are represented for each timepoint. For both SAMs, the CLV1 intensity at PM reduces upon CLV3 treatment.
-
B–ERepresentative confocal images and quantification of Arabidopsis TPLATE_3 and WDXM2_3 expressing seedlings following short‐term CLV3 peptide treatment (1 μM for 10 min: (B, C) and 1 μM for 30 min: (D, E)). Similar to the long‐term treatment (Fig 4), PM localization of CLV1‐GFP reduces upon CLV3 peptide treatment, which is not the case in WDXM2_3 vegetative meristems. The box plot and jitter box representation graph represents the average fluorescence intensity (8‐bit gray values) of CLV1 over the entire SAM (indicated by a dotted line). Numbers of biological samples from two repeats are indicated at the bottom of the box plot and jitter box graphs. The box plots extend from the 25th to 75th percentiles. The line inside the box marks the median. The whiskers go down and up to the 95% percentile. The red dots mark the average. The dots represent measurements of individual seedlings. Differences of CLV1‐GFP intensity between WDXM2_3 and TPLATE_3 lines under both conditions were evaluated by Welch's ANOVA post hoc pairwise comparison with the Tukey contrasts. Letters (a–c) represent significant difference between groups (a and b, P < 0.001; b and c, P < 0.05). The quantification combines at least two independent experiments for each genotype, treatment, and duration of treatment. Left panels are merged channels (GFP and PI), right panels are GFP‐only channels represented via an intensity scale. Scale bar in (A), (B), and (D) = 20 μm.
These results strongly correlate the endocytosis deficiency in WDXM2 with impaired internalization of CLV1 in inflorescence and in vegetative meristems. Increased CLV1 levels at PM are also in accordance with the fact that WDXM2 rescued plants are hypersensitive to CLV3 peptide treatment, which correlates with strongly reduced WUS levels and therefore likely increased CLV1‐mediated transcriptional repression (Figs 2 and 3). Despite this hypersensitivity, vegetative SAMs in WDXM2 appear enlarged compared to those in TPLATE control seedlings (Figs 4 and EV5). How this relates to the abundance of CLV1 at PM and to altered WUS levels remains to be determined.
To establish a direct link between CLV1 and TPC, we examined the interaction between TPC and CLV1. TPC, visualized using an antibody against TPLATE, specifically co‐purified with CLV1 in Arabidopsis seedlings when CLV1‐2xGFP was used as bait (Fig 5A). Next, we aimed to confirm this interaction and to determine which adaptor complex subunits were involved. Tyrosine motif‐based cargo recognition involves the medium subunit of the adaptor protein 2 complex, AP‐2 M (Arora & Van Damme, 2021), whose counterpart in TPC is the TML subunit. Furthermore, TPLATE co‐purified with CLV1 (Fig 5A) and AtEH1/Pan1 was shown to interact with cargo (Yperman et al, 2021a). We therefore selected these proteins for ratiometric bimolecular fluorescence complementation (rBiFC) in N. benthamiana. Similar to previous experiments, the shaggy‐like kinase BIN2 served as negative control (Arora et al, 2020). We could not visualize interaction between CLV1 and TPLATE, TML, or AP‐2 M in this system (Fig 5B and C). Our confocal analysis, however, clearly linked CLV1 to the plant‐specific TPC subunit AtEH1/Pan1 (Gadeyne et al, 2014; Hirst et al, 2014) in the presence and absence of exogenous CLV3 peptide (Fig 5B and C). The interaction between CLV1 and AtEH1/Pan1 was further assessed via yeast‐two‐hybrid (Y2H) using the cytoplasmic part of CLV1 and the N‐terminal part of AtEH1/Pan1 ending just after the second EH domain (Yperman et al, 2021b). In total, 24 independent double transformations, combining CLV1 with AtEH1/Pan1, CLV1 with empty vector control, or AtEH1/Pan1 with empty vector control, were compared, alongside 8 double transformations of the empty vector control and the p53‐SV40 positive control (Fig 5D and E). The results clearly show a specific interaction between CLV1 and AtEH1/Pan1 (Fig 5D and E). Both rBiFC and Y2H therefore clearly link the cytoplasmic part of CLV1 to the N‐terminal part of AtEH1/Pan1. The N‐terminal located EH domains of AtEH1/Pan1 were previously also shown to be involved in membrane recruitment of TPC as well as in the internalization of the Secretory Carrier Membrane Protein 5 (SCAMP5) via its double NPF motif (Johnson et al, 2021; Yperman et al, 2021a). CLV1, in contrast to SCAMP5, does however not contain obvious NPF motifs. How CLV1 is recognized by AtEH1/Pan1 therefore remains to be determined.
Figure 5. TPC interacts with CLV1 through its AtEH1/Pan1 subunit.

-
ACo‐immunoprecipitation experiment comparing WT (Col‐0) Arabidopsis seedlings and seedlings expressing pCLV1::CLV1‐2xGFP (CLV1) and 35S::eGFP (GFP). CLV1 specifically co‐purifies with endogenous TPLATE. The blue arrow marks full‐length CLV1, and the magenta arrow marks full‐length TPLATE. Numbers next to the ladder represent the protein molecular weight (kDa). The experiment was independently performed twice with an identical result.
-
B, CRepresentative confocal images and quantification of ratiometric BiFC analyses exploring the interaction between TPC subunits TPLATE, TML, and AtEH1/Pan1, the AP‐2 complex subunit AP2M, and CLV1. The identified interaction between CLV1 and AtEH1/Pan1 was also performed in the presence of exogenous CLV3 peptide application (1 μM in infiltration buffer). CC and NC refer to the orientation of the nYFP and cYFP halves of YFP fused to both proteins. CLV1 was always tagged C‐terminally. Left panels in (C) represent the YFP channel, shown via an intensity scale, whereas the right panels represent the RFP control channel (free RFP, magenta) against which the intensity of the YFP BiFC channel was normalized. Scale bars = 25 μm. (C) Box plot and jitter box representation showing the quantification of the YFP/RFP fluorescence ratios from two independent experiments. The box plot extends from the 25th to 75th percentiles. The line inside the box marks the median. The whiskers go down and up to the 95% percentile. The red dots mark the average. Numbers of biological samples from at least two independent transformations are indicated at the bottom of the graph. Letters (a–c) represent significantly different groups (P < 0.001) evaluated by Welch's ANOVA post hoc pairwise comparison with the Tukey contrasts.
-
D, EYeast two‐hybrid analysis (D) and respective quantification (E) between the cytoplasmic part of CLV1 (AA 671–980) and the N‐terminal part of AtEH1/Pan1, which ends after the second EH domain (AA 1–527). Combining CLV1 in pGADT7 (AD) with AtEH1/Pan1 in pGBKT7 (BD) allowed growth on selective medium (‐L‐T‐H; strong in 12/24 and weak in 1/24 independent double transformations), whereas only 2/24 transformations showed strong and 2/24 showed weak growth on selective medium in the controls, likely caused by some level of auto‐activation of AtEH1/Pan1. The negative control consisted of both empty pGBKT7 and pGADT7 vectors (8 independent double transformations) and the positive control (eight independent double transformations) combined pGADT7‐SV40 T‐Ag with pGBKT7‐p53. No: no growth observed on ‐L‐T‐H. The data shown represent individual double transformants, and the assay was technically repeated twice.
Source data are available online for this figure.
Taken together, our findings reveal that the hypersensitivity of WDXM2 rescued plants to CLV3 is most likely a consequence of sustained signaling from the PM, which is caused by impaired internalization of CLV1 due to reduced TPC‐dependent endocytosis. TPC‐dependent endocytosis, therefore, serves to internalize CLV1 to attenuate CLV3 signaling to prevent meristem termination. Our work thus identifies TPC‐dependent CME as a mechanism to control the availability of CLV1 at the PM and to tune the activity of the shoot stem cell niche during plant development.
Materials and Methods
Molecular cloning
mSCARLET (Bindels et al, 2017) was amplified with a stop codon from plasmid pEB2‐mSCARLET (Addgene, 104006), introduced into pDONRP2R‐P3 via a Gateway BP reaction (Invitrogen), and confirmed by sequencing. To generate mSCARLET‐fused expression constructs of TPLATE and WDXM2, the pDONR221‐TPLATE and pDONR221‐WDXM2 motif substituted entry clones (Wang et al, 2021) were combined with pHm34GW (Karimi et al, 2007), pDONRP4‐P1r‐Lat52 (Van Damme et al, 2006), and pDONRP2R‐P3‐mSCARLET in triple gateway LR reactions (Invitrogen).
The pBiFCt‐2in1 BiFC vectors, which allow quantification of the observed bimolecular YPF fluorescence complementation by measuring the ratio between the intensity of the YPF signal for a specific pair of interacting proteins and the intensity of the constitutively expressed RFP which is present on the backbone of the vector, were used to generate CLV1 related rBiFC constructs (Grefen & Blatt, 2012). The CLV1 entry clone for rBiFC reactions was amplified from a published plasmid (Schlegel et al, 2021), while TPLATE, TML, AtEH1/Pan1, and AP2M were obtained from previously reported rBiFC experiments (Arora et al, 2020; Liu et al, 2020; Yperman et al, 2021a). Entry clones were assembled in an empty rBiFC destination vector (pBiFCt‐2in1‐CC, Addgene 105114 or pBiFCt‐2in1‐NC, Addgene 105112) with a Gateway LR recombination reaction and selected using LB containing spectinomycin and XgalI. The final rBIFC vectors were checked by restriction digestion and sequencing of the recombination borders. For Y2H, the N‐terminal domain of AtEH1/Pan1 (AA 1–527) was amplified using the following primer pairs (AtEH1_1‐527_GBD_F GCCATGGAGGCCGAATTCCCAATGGCGGGTCAGAATCCTAACATGG and AtEH1_1‐527_GBD_R CTGCAGGTCGACGGATCCCCTTATGCAGAATATCCATT ACCTAGGTGATTAGC) and cloned into the pGBKT7 vector (Clontech). The cytoplasmic part of CLV1 (AA 671–980, corresponding to the end of the transmembrane helix, from amino acids LAWKL to the end of the UniProt sequence Q9SYQ8), was amplified using following primer pairs (CLV1_671‐980_GAD_F GAGGCCAGTGAATTCCACCCACTCG CCTGGAAACTAACCGCCTTC and CLV1_671‐980_GAD_R TCCCGTATCGATGCCC ACCCTTAGAACGCGATCAAGTTCGCCACGG) and cloned into pGADT7 (Clontech). Both vectors were generated via Gibson assembly following SmaI‐dependent linearization of the vectors. Plasmids were verified using sequencing.
Arabidopsis transgenic lines and growth conditions
All plant materials used in this research are in the Columbia‐0 (Col‐0) ecotype background. Information on plant materials is listed in Table EV1. To generate the mSCARLET fusions of transgenic lines, tplate heterozygous mutant plants were identified by genotyping PCR and were transformed with expression constructs of TPLATE and WDXM2 fused to mSCARLET under the control of LAT52 promoter as described before (Van Damme et al, 2006; Wang et al, 2021; Yperman et al, 2021b). Primary transformants were selected with Hygromycin, and those carrying the tplate T‐DNA insertion were identified via genotyping PCR. The rescued lines in the T2 generation were further genotyped to identify homozygous tplate mutants (Wang et al, 2021).
For all the crosses, the same reporter line or mutant plant was used as male to cross with TPLATE and WDXM2 rescued lines respectively. The pWUS::GUS (Su et al, 2009) reporter line was crossed into TPLATE_1 and WDXM2_1 rescued mutant backgrounds. In the progeny, F2 plants were genotyped to obtain homozygous tplate mutant backgrounds. The F3 or F4 generation plants were screened to identify homozygous plants for pWUS::GUS expression by GUS staining. The clv1 null mutant clv1‐101 (Kinoshita et al, 2010) and the dominant‐negative clv1‐8 mutant (Dievart et al, 2003) were crossed into the TPLATE_1 and WDXM2_1 rescued lines. The F2 or F3 generation plants were genotyped or sequenced to identify the tplate/clv1‐101 or tplate/clv1‐8 double mutant backgrounds. To introduce the CLV1 marker line into TPLATE and WDXM2 rescued lines, a wild‐type Col‐0 plant expressing the functional pCLV1::CLV1‐GFP (Schlegel et al, 2021) was backcrossed to Col‐0, and a single locus expression F2 line was identified by segregation using Basta (20 mg/l) selection. Then, the F2 Basta‐resistant CLV1‐GFP expressing plant was used to cross with the TPLATE_3 and WDXM2_3 rescued plants. In the progeny, plants homozygous for the tplate mutant background were identified by genotyping PCR while homozygous expression of CLV1‐GFP was selected by segregation on BASTA. For co‐IP experiments, the pCLV1::CLV1‐2xGFP line was used (Nimchuk et al, 2011).
Seeds were sterilized by chlorine gas sterilization and sown on ½ MS medium plates without sugar following a 3‐day vernalization period at 4°C. Seedlings were grown in a growth chamber under continuous light conditions at 21°C.
Phenotypic analysis
Sequences of CLE peptides described before (Yamaguchi et al, 2016) were ordered from GenScript. Information on the peptides is listed in Table EV2. For shoot treatments, seedlings were grown horizontally on ½ MS medium supplemented with or without the indicated concentration of CLV3 peptide for 3 weeks. Plants with terminated shoots were counted manually. For root growth assays, seedlings were initially grown on ½ MS medium supplemented with or without CLE peptides for a certain duration (data depicted in Fig EV1). For the FLG22, AtPEP, CEB5, CLV3, and CLE40 peptides depicted in Figs 1 and 2, seedlings were grown on ½ MS plates and then transferred to plates with and without the indicated amount of peptides. Plates with seedlings were scanned, and root lengths were measured with the Fiji software package (https://imagej.net/software/fiji/) equipped with the NeuronJ plugin (Meijering et al, 2004). Quantification of the number of leaves in Fig 3C was done manually using the cell counter plugin in Fiji.
GUS staining
GUS staining was performed as described before (Lammens et al, 2008). Seedlings (3 days after putting the plates in continuous light, that is roughly 1 day after germination) expressing pWUS::GUS grown on ½ MS with or without CLV3 peptide were harvested and incubated with 80% cold acetone for 30 min. After that, seedlings were washed with phosphate buffer (pH = 7.2), incubated in GUS staining solution (1 mg/ml of 5‐bromo‐4‐chromo‐3‐indolyl β‐D‐glucuronide, 2 mM ferricyanide, and 0.5 mM ferrocyanide in 100 mM phosphate buffer pH 7.2) and kept at 37°C in the dark for 3 h. After GUS staining, seedlings were cleared with lactic acid and visualized between slide and coverslip on a BX51 light microscope (Olympus) using a 10× or 20× magnification.
Nicotiana benthamiana infiltration
Three‐ to four‐week‐old Nicotiana benthamiana plants grown in greenhouse under long‐day conditions (06–22 h light, 100 PAR, 21°C) were used for infiltration as described before (Arora et al, 2020). Three days after infiltration, N. benthamiana leaves were imaged with an SP8X confocal microscope. CLV3 peptide (1 μM) in infiltration buffer (10 mM MgCl2 and 10 mM MES, pH 5.6) was applied via leaf infiltration. After 5 min incubation, the injected samples were imaged within 30 min.
Live‐cell imaging and analysis
A Leica SP8X confocal microscope equipped with a white laser was used for all confocal imaging via a 40× (HC PL APO CS2, NA = 1.10) water‐immersion corrected objective except the flower meristem imaging.
Ratiometric bimolecular fluorescence complementation images were acquired with hybrid detectors (HyDTM) using a time‐gated window between 0.3 and 6.0 ns and in line sequential mode. YFP signals were acquired using WLL 514 nm excitation and an emission window of 520–550 nm, and RFP signals were detected using WLL 561 nm excitation and an emission window of 580–650 nm. All images were taken using the same settings for YFP and RFP detection and saturation was avoided in order not to interfere with the ratiometric quantification.
For CLV1‐GFP imaging in vegetative SAMs in Figs 4 and EV5B–E, seeds expressing CLV1‐GFP in TPLATE and WDXM2 rescued mutant backgrounds were germinated on ½ MS plates supplemented with or without 100 nM of CLV3 peptide. Seedlings were imaged following 3‐days after putting the plates in continuous light, which roughly equals 1 day after germination. For CLV1‐GFP imaging upon short‐term CLV3 peptide treatment in Fig EV5, seedlings grown on ½ MS plates (3 days in light) were used. After removal of the cotyledons, seedlings were incubated in ½ MS medium containing 1 μM CLV3 peptide and 0.1% Tween 20 (v/v) for 10 or 30 min and washed with water shortly three times. Prior to imaging, seedlings expressing CLV1‐GFP were stained with PI solution (10 μg/ml) for 1–2 min. The HyDTM were employed to image PI (excitation at 561 nm, emission between 600 and 700 nm) and CLV1‐GFP (excitation at 488 nm, emission between 500 and 540 nm) without (PI) or with (GFP) a time‐gated window between 0.3 and 6.0 ns. To achieve sufficient signal when imaging CLV1‐GFP in the vegetative SAMs of TPLATE‐3 and WDXM2_3 seedlings, accumulative imaging was used. Images were acquired using eight times line accumulation and two times frame averaging.
For the flower SAM imaging in Fig EV4A, Arabidopsis plants were grown in soil for 4 weeks at 21°C under long day condition (16 h light:8 h dark, LED 150 μmol/m2/s). Primary inflorescence shoot apical meristems were dissected, mounted in ACM, and then stained with 100 μM propidium iodide (PI; Merck) for 5 min prior to imaging (Brunoud et al, 2020). Meristems were imaged with a Zeiss LSM 710 spectral microscope using the following settings: GFP (excitation at 488 nm, emission between 510 and 558 nm) and propidium iodide (excitation 488 nm, emission between 605 and 650 nm).
For CLV1‐GFP imaging in vegetative SAMs in Fig EV5A, vegetative shoot apices at 3 DAG were manually dissected under a stereo microscope by removing the leaf primordia. The cell wall was stained with propidium iodide (PI). After removal of the leaf primordia, vegetative SAMs were treated with ½ MS medium containing 1 μM CLV3 peptide and 0.1% Tween 20 and imaged at 0 min and 30 min after treatment. Z‐stacks of vegetative SAMs were acquired using a Zeiss LSM 780 confocal microscope (40× water immersion objective, Zeiss C‐PlanApo, NA 1.2). GFP was excited with an Argon laser at 488 nm and emission was detected using a 490–530 nm window. PI was excited at 561 nm by a DPSS laser and detected using a 590–650 nm window.
For the flower SAM imaging in Fig EV4B, IFMs from the pCLV1:CLV1‐GFP reporter line were dipped for 1 min into a peptide solution containing 100 μM CLV3 peptide, 0.1% DMSO, and 0.01% Silwet and then incubated for 30 min before imaging. For the mock treatment, IFMs were dipped for 1 min into a solution containing 0.1% DMSO and 0.01% Silwet and then incubated for 30 min before imaging.
To image IFMs, inflorescences were cut off and fixed to double‐sided adhesive tape on an objective slide and then dissected. The cell walls were stained with 5 mM PI for 2 min. Inflorescences were then washed three times with water and covered with a cover slide before being placed under the microscope. All IFM imaging was acquired using a Zeiss LSM 880 confocal microscope equipped with a 40× water immersion objective (Zeiss C‐PlanApo, NA 1.2). GFP was excited with an Argon laser at 488 nm, and emission was detected using a 490–530 nm window. PI was excited at 561 nm by a DPSS laser and detected using a 590–650 nm window.
The quantification of rBiFC and SAM images was performed using Fiji. For rBiFC, a region of interest (ROI) on PM of the cells was selected, and the intensities of YFP and RFP signals were measured. The ratios between YFP and RFP signals per cell were then calculated and plotted. For the quantification of CLV1‐GFP in TPLATE and WDXM2 vegetative SAMs, a region of interest (ROI) covering the meristem was defined and the CLV1‐GFP signal intensities were measured. Only images with less than 1% saturated pixels were quantified. The histogram function in Fiji was used to generate intensity values (8‐bit gray values) for each pixel, and the top 10% highest intensity pixels were used to calculate the mean fluorescence intensities using an in‐house designed script in Microsoft Excel. Using a selection of the strongest intensity pixels for the calculations omits background noise that otherwise reduces the average fluorescence intensities of the quantifications and follows from the rationale that the fluorescence is linked to the endomembrane system and therefore not continuously present throughout the selected ROI. Similar approaches are also used to calculate ratios of endocytic flux between PM and endosomal compartments (Dejonghe et al, 2016; Mishev et al, 2018).
Protein extraction and Western blotting
Arabidopsis seedlings were grown for 5 days on ½ MS medium without sugar under continuous light conditions. Seedlings were harvested, flash‐frozen, and ground in liquid nitrogen. Proteins were extracted in a 1:1 ratio, buffer (ml):seedlings (g), in HB+ buffer, as described before (Van Leene et al, 2015). Protein extracts were incubated for 30 min at 4°C on a rotating wheel before spinning down twice at 20,000 g for 20 min. The supernatant concentration was measured using the Bradford Protein Assay (Invitrogen), and equal amounts of proteins were loaded on 4–20% gradient gels (Bio‐Rad). Gels were transferred to nitrocellulose membranes using the Trans‐Blot Turbo system (Bio‐Rad). Blots were incubated with α‐TPLATE appendage antibodies (rabbit) (Dejonghe et al, 2019) and imaged on a ChemiDoc Imaging System (Bio‐Rad).
Co‐immunoprecipitation
For experiments performed on 5‐day‐old seedlings, entire seedlings of Col‐0, pCLV1::CLV1‐2xGFP, and 35S::eGFP were ground to a fine powder using liquid nitrogen. For experiments performed on inflorescence meristems of lines expressing pCLV1::CLV1‐GFP in TPLATE_3 and WDXM2_3 backgrounds, the inflorescence meristems were dipped into a solution of 100 μM CLV3 peptide and 0.01% Silwet L‐77. After 30 min, the flower meristems were harvested and ground to a fine powder using liquid nitrogen. Finely ground material was suspended in homogenization extraction buffer [150 mM Tris–HCl, 150 mM NaCl, 0.5 mM EDTA, 10% glycerol, 1 mM sodium molybdate, 1 mM NaF, 10 mM DTT, 1% IGEPAL CA‐630 (Sigma‐Aldrich, USA) with Complete Ultra EDTA‐free Protease Inhibitor Cocktail Tablets (Roche, Switzerland; 1 tablet per 10 ml)]. After 30 min of rotation at 4°C, cell debris was removed from the samples by centrifugation for 15 min at 2,000 g at 4°C. Supernatant was transferred to a new tube through Miracloth (Millipore Sigma, USA). Then, 50 μl pre‐equilibrated GFP‐Trap®_MA beads (ChromoTek, Germany) was added into each sample, and samples were incubated for 2 h at 4°C to maximize the protein binding. Afterward, the beads were washed two times with wash buffer (20 mM Tris–HCl pH 7.5, 150 mM NaCl). Protein was eluted from the beads by adding Laemmli sample buffer (Bio‐Rad, Laboratories, Inc., USA), Sample Reducing Agent (Invitrogen, USA) and incubating at 70°C for 10 min.
The proteins were separated on 4–15% SDS–PAGE stain‐free protein gel (Bio‐Rad Laboratories, Inc., USA), followed by transferring onto a Trans‐Blot® Turbo™ Mini PVDF Transfer Packs (Bio‐Rad Laboratories, Inc., USA). After blocking with 5% Skim Milk (Difco, USA) for 1 h at room temperature, blots were incubated with α GFP‐HRP (ChromoTek, Germany) (1:2,000) or α TPLATE2 (rabbit) (Dejonghe et al, 2019) overnight at 4°C. Imaging was done using Chemiluminescent substrate (Thermo Fisher Scientific, USA) and detected by ChemiDoc™ MP Imaging System (Bio‐Rad Laboratories, Inc., USA).
The quantification of the band intensities on the WB from the CLV1 IP (Fig EV4C) was performed using ImageJ, by marking the region of the band with an ROI and measuring the mean signal intensity.
Yeast two‐hybrid analysis
The N‐terminal part of AtEH1/Pan1 (AA 1–527) up to the coiled‐coil domain in pGBKT7 and the cytoplasmic part of CLV1 (AA 671–980) in pGADT7 were combined with each other and with empty control plasmids using the Matchmaker™ Gold Yeast Two‐Hybrid System (Clontech). The vectors were co‐transformed into the Y2Hgold MATa Yeast strain. Auto‐activation was tested by co‐transforming each vector with the corresponding empty pGADT7 and pGBKT7 vectors. The empty pGADT7 and pGBKT7 were also co‐transformed as a negative control and as a positive control, we used the pGADT7‐SV40 T‐Ag and pGBKT7‐p53 supplied with the Matchmaker system (Clontech).
Colonies of double‐transformed yeasts were first selected on SD‐Leu‐Trp plates. After 3 days at 30°C, colonies were picked and grown for 3 days in liquid‐Leu–Trp medium at 30°C 200 rpm. Fully grown cultures were diluted 1/5 in ‐L‐T‐H and 10 μl was spotted on SD‐Leu‐Trp and SD‐Leu‐Trp‐His plates. Pictures were taken after 3 days at 30°C.
Statistical analysis
The R package in R studio (www.rstudio.com) was used. Data were tested for normality and heteroscedasticity, after which the multcomp package was used (Herberich et al, 2010).
Author contributions
Jie Wang: Conceptualization; formal analysis; validation; investigation; methodology; writing – original draft; writing – review and editing. Qihang Jiang: Formal analysis; visualization; methodology; writing – review and editing. Roman Pleskot: Conceptualization; data curation; software; supervision; methodology; writing – original draft; writing – review and editing. Peter Grones: Conceptualization; formal analysis; supervision; methodology; writing – review and editing. Elmehdi Bahafid: Conceptualization; resources; formal analysis; methodology; writing – review and editing. Gregoire Denay: Resources. Carlos Galván‐Ampudia: Resources; formal analysis; methodology; writing – review and editing. Xiangyu Xu: Resources; formal analysis; methodology; writing – review and editing. Michael Vandorpe: Conceptualization; formal analysis; validation; investigation; methodology; writing – review and editing. Evelien Mylle: Formal analysis; validation; methodology; writing – review and editing. Ive De Smet: Resources; supervision; funding acquisition; methodology; writing – review and editing. Teva Vernoux: Conceptualization; resources; data curation; supervision; writing – review and editing. Rüdiger Simon: Resources; supervision; methodology; writing – review and editing. Moritz K Nowack: Resources; supervision; funding acquisition; writing – review and editing. Daniel Van Damme: Conceptualization; resources; supervision; funding acquisition; writing – original draft; project administration; writing – review and editing.
Disclosure and competing interests statement
The authors declare that they have no conflict of interest.
Supporting information
Expanded View Figures PDF
Table EV1
Table EV2
Source Data for Expanded View
PDF+
Source Data for Figure 1
Source Data for Figure 2
Source Data for Figure 3
Source Data for Figure 4
Source Data for Figure 5
Acknowledgements
We would like to thank Elliot Meyerowitz, Marcus Heisler, and Thomas Laux for constructive discussions. This work was supported by the European Research Council, Grant 682436 to DVD; the Research Foundation–Flanders, Grant 1226420N to PG; The China Scholarship Council, grant 201508440249 to JW; grant 201906760018 to QJ and grant 201706350153 to XX; Ghent University Special Research co‐funding, grant ST01511051 to JW and the DFG, grant CRC1208 to RS.
EMBO reports (2023) 24: e54709
Data availability
This study includes no data deposited in external repositories. Data used for quantifications as well as full Western blots can be found in the source data file. All material will be made available upon reasonable request to the corresponding author (daniel.vandamme@psb.vib-ugent.be).
References
- Anne P, Amiguet‐Vercher A, Brandt B, Kalmbach L, Geldner N, Hothorn M, Hardtke CS (2018) CLERK is a novel receptor kinase required for sensing of root‐active CLE peptides in Arabidopsis . Development 145: 1–10 [DOI] [PMC free article] [PubMed] [Google Scholar]
- Arora D, Abel NB, Liu C, Van Damme P, Yperman K, Eeckhout D, Vu LD, Wang J, Tornkvist A, Impens F et al (2020) Establishment of proximity‐dependent biotinylation approaches in different plant model systems. Plant Cell 32: 3388–3407 [DOI] [PMC free article] [PubMed] [Google Scholar]
- Arora D, Van Damme D (2021) Motif‐based endomembrane trafficking. Plant Physiol 186: 221–238 [DOI] [PMC free article] [PubMed] [Google Scholar]
- Bashline L, Li S, Zhu X, Gu Y (2015) The TWD40‐2 protein and the AP2 complex cooperate in the clathrin‐mediated endocytosis of cellulose synthase to regulate cellulose biosynthesis. Proc Natl Acad Sci USA 112: 12870–12875 [DOI] [PMC free article] [PubMed] [Google Scholar]
- Beck M, Zhou J, Faulkner C, MacLean D, Robatzek S (2012) Spatio‐temporal cellular dynamics of the Arabidopsis flagellin receptor reveal activation status‐dependent endosomal sorting. Plant Cell 24: 4205–4219 [DOI] [PMC free article] [PubMed] [Google Scholar]
- Ben Khaled S, Postma J, Robatzek S (2015) A moving view: subcellular trafficking processes in pattern recognition receptor‐triggered plant immunity. Annu Rev Phytopathol 53: 379–402 [DOI] [PubMed] [Google Scholar]
- Bindels DS, Haarbosch L, van Weeren L, Postma M, Wiese KE, Mastop M, Aumonier S, Gotthard G, Royant A, Hink MA et al (2017) mScarlet: a bright monomeric red fluorescent protein for cellular imaging. Nat Methods 14: 53–56 [DOI] [PubMed] [Google Scholar]
- Blumke P, Schlegel J, Gonzalez‐Ferrer C, Becher S, Pinto KG, Monaghan J, Simon R (2021) Receptor‐like cytoplasmic kinase MAZZA mediates developmental processes with CLAVATA1 family receptors in Arabidopsis . J Exp Bot 72: 4853–4870 [DOI] [PubMed] [Google Scholar]
- Brand U, Fletcher JC, Hobe M, Meyerowitz EM, Simon R (2000) Dependence of stem cell fate in Arabidopsis on a feedback loop regulated by CLV3 activity. Science 289: 617–619 [DOI] [PubMed] [Google Scholar]
- Breda AS, Hazak O, Schultz P, Anne P, Graeff M, Simon R, Hardtke CS (2019) A cellular insulator against CLE45 peptide signaling. Curr Biol 29: 2501–2508 [DOI] [PubMed] [Google Scholar]
- Brunoud G, Galvan‐Ampudia CS, Vernoux T (2020) Methods to visualize auxin and cytokinin signaling activity in the shoot apical meristem. Methods Mol Biol 2094: 79–89 [DOI] [PubMed] [Google Scholar]
- Clark SE, Running MP, Meyerowitz EM (1993) CLAVATA1, a regulator of meristem and flower development in Arabidopsis . Development 119: 397–418 [DOI] [PubMed] [Google Scholar]
- Clark SE, Running MP, Meyerowitz EM (1995) CLAVATA3 is a specific regulator of shoot and floral meristem development affecting the same processes as CLAVATA1. Development 121: 2057–2067 [Google Scholar]
- Clark SE, Williams RW, Meyerowitz EM (1997) The CLAVATA1 gene encodes a putative receptor kinase that controls shoot and floral meristem size in Arabidopsis . Cell 89: 575–585 [DOI] [PubMed] [Google Scholar]
- Claus LAN, Savatin DV, Russinova E (2018) The crossroads of receptor‐mediated signaling and endocytosis in plants. J Integr Plant Biol 60: 827–840 [DOI] [PubMed] [Google Scholar]
- Dejonghe W, Kuenen S, Mylle E, Vasileva M, Keech O, Viotti C, Swerts J, Fendrych M, Ortiz‐Morea FA, Mishev K et al (2016) Mitochondrial uncouplers inhibit clathrin‐mediated endocytosis largely through cytoplasmic acidification. Nat Commun 7: 11710 [DOI] [PMC free article] [PubMed] [Google Scholar]
- Dejonghe W, Sharma I, Denoo B, De Munck S, Lu Q, Mishev K, Bulut H, Mylle E, De Rycke R, Vasileva M et al (2019) Disruption of endocytosis through chemical inhibition of clathrin heavy chain function. Nat Chem Biol 15: 641–649 [DOI] [PMC free article] [PubMed] [Google Scholar]
- Deyoung BJ, Clark SE (2008) BAM receptors regulate stem cell specification and organ development through complex interactions with CLAVATA signaling. Genetics 180: 895–904 [DOI] [PMC free article] [PubMed] [Google Scholar]
- DeYoung BJ, Bickle KL, Schrage KJ, Muskett P, Patel K, Clark SE (2006) The CLAVATA1‐related BAM1, BAM2 and BAM3 receptor kinase‐like proteins are required for meristem function in Arabidopsis . Plant J 45: 1–16 [DOI] [PubMed] [Google Scholar]
- Di Rubbo S, Irani NG, Kim SY, Xu ZY, Gadeyne A, Dejonghe W, Vanhoutte I, Persiau G, Eeckhout D, Simon S et al (2013) The clathrin adaptor complex AP‐2 mediates endocytosis of brassinosteroid insensitive1 in Arabidopsis . Plant Cell 25: 2986–2997 [DOI] [PMC free article] [PubMed] [Google Scholar]
- Dievart A, Dalal M, Tax FE, Lacey AD, Huttly A, Li J, Clark SE (2003) CLAVATA1 dominant‐negative alleles reveal functional overlap between multiple receptor kinases that regulate meristem and organ development. Plant Cell 15: 1198–1211 [DOI] [PMC free article] [PubMed] [Google Scholar]
- Fletcher JC, Brand U, Running MP, Simon R, Meyerowitz EM (1999) Signaling of cell fate decisions by CLAVATA3 in Arabidopsis shoot meristems. Science 283: 1911–1914 [DOI] [PubMed] [Google Scholar]
- Gadeyne A, Sanchez‐Rodriguez C, Vanneste S, Di Rubbo S, Zauber H, Vanneste K, Van Leene J, De Winne N, Eeckhout D, Persiau G et al (2014) The TPLATE adaptor complex drives clathrin‐mediated endocytosis in plants. Cell 156: 691–704 [DOI] [PubMed] [Google Scholar]
- Gou X, Li J (2020) Paired receptor and coreceptor kinases perceive extracellular signals to control plant development. Plant Physiol 182: 1667–1681 [DOI] [PMC free article] [PubMed] [Google Scholar]
- Graeff M, Rana S, Marhava P, Moret B, Hardtke CS (2020) Local and systemic effects of brassinosteroid perception in developing phloem. Curr Biol 30: 1626–1638 [DOI] [PubMed] [Google Scholar]
- Grefen C, Blatt MR (2012) A 2in1 cloning system enables ratiometric bimolecular fluorescence complementation (rBiFC). Biotechniques 53: 311–314 [DOI] [PubMed] [Google Scholar]
- Hazak O, Hardtke CS (2016) CLAVATA 1‐type receptors in plant development. J Exp Bot 67: 4827–4833 [DOI] [PubMed] [Google Scholar]
- Hazak O, Brandt B, Cattaneo P, Santiago J, Rodriguez‐Villalon A, Hothorn M, Hardtke CS (2017) Perception of root‐active CLE peptides requires CORYNE function in the phloem vasculature. EMBO Rep 18: 1367–1381 [DOI] [PMC free article] [PubMed] [Google Scholar]
- Herberich E, Sikorski J, Hothorn T (2010) A robust procedure for comparing multiple means under heteroscedasticity in unbalanced designs. PloS One 5: e9788 [DOI] [PMC free article] [PubMed] [Google Scholar]
- Hirst J, Schlacht A, Norcott JP, Traynor D, Bloomfield G, Antrobus R, Kay RR, Dacks JB, Robinson MS (2014) Characterization of TSET, an ancient and widespread membrane trafficking complex. Elife 3: e02866 [DOI] [PMC free article] [PubMed] [Google Scholar]
- Hobe M, Muller R, Grunewald M, Brand U, Simon R (2003) Loss of CLE40, a protein functionally equivalent to the stem cell restricting signal CLV3, enhances root waving in Arabidopsis . Dev Genes Evol 213: 371–381 [DOI] [PubMed] [Google Scholar]
- Hohmann U, Lau K, Hothorn M (2017) The structural basis of ligand perception and signal activation by receptor kinases. Annu Rev Plant Biol 68: 109–137 [DOI] [PubMed] [Google Scholar]
- Hu C, Zhu Y, Cui Y, Cheng K, Liang W, Wei Z, Zhu M, Yin H, Zeng L, Xiao Y et al (2018) A group of receptor kinases are essential for CLAVATA signalling to maintain stem cell homeostasis. Nat Plants 4: 205–211 [DOI] [PubMed] [Google Scholar]
- Irani NG, Di Rubbo S, Mylle E, Van den Begin J, Schneider‐Pizon J, Hnilikova J, Sisa M, Buyst D, Vilarrasa‐Blasi J, Szatmari AM et al (2012) Fluorescent castasterone reveals BRI1 signaling from the plasma membrane. Nat Chem Biol 8: 583–589 [DOI] [PubMed] [Google Scholar]
- Ishida T, Tabata R, Yamada M, Aida M, Mitsumasu K, Fujiwara M, Yamaguchi K, Shigenobu S, Higuchi M, Tsuji H et al (2014) Heterotrimeric G proteins control stem cell proliferation through CLAVATA signaling in Arabidopsis . EMBO Rep 15: 1202–1209 [DOI] [PMC free article] [PubMed] [Google Scholar]
- Ito Y, Nakanomyo I, Motose H, Iwamoto K, Sawa S, Dohmae N, Fukuda H (2006) Dodeca‐CLE peptides as suppressors of plant stem cell differentiation. Science 313: 842–845 [DOI] [PubMed] [Google Scholar]
- Johnson A, Dahhan DA, Gnyliukh N, Kaufmann WA, Zheden V, Costanzo T, Mahou P, Hrtyan M, Wang J, Aguilera‐Servin J et al (2021) The TPLATE complex mediates membrane bending during plant clathrin‐mediated endocytosis. Proc Natl Acad Sci USA 118: e2113046118 [DOI] [PMC free article] [PubMed] [Google Scholar]
- Karimi M, Depicker A, Hilson P (2007) Recombinational cloning with plant gateway vectors. Plant Physiol 145: 1144–1154 [DOI] [PMC free article] [PubMed] [Google Scholar]
- Kinoshita A, Betsuyaku S, Osakabe Y, Mizuno S, Nagawa S, Stahl Y, Simon R, Yamaguchi‐Shinozaki K, Fukuda H, Sawa S (2010) RPK2 is an essential receptor‐like kinase that transmits the CLV3 signal in Arabidopsis . Development 137: 3911–3920 [DOI] [PubMed] [Google Scholar]
- Kitagawa M, Jackson D (2019) Control of meristem size. Annu Rev Plant Biol 70: 269–291 [DOI] [PubMed] [Google Scholar]
- Lammens T, Boudolf V, Kheibarshekan L, Zalmas LP, Gaamouche T, Maes S, Vanstraelen M, Kondorosi E, La Thangue NB, Govaerts W et al (2008) Atypical E2F activity restrains APC/CCCS52A2 function obligatory for endocycle onset. Proc Natl Acad Sci USA 105: 14721–14726 [DOI] [PMC free article] [PubMed] [Google Scholar]
- Liu D, Kumar R, Claus LAN, Johnson AJ, Siao W, Vanhoutte I, Wang P, Bender KW, Yperman K, Martins S et al (2020) Endocytosis of BRASSINOSTEROID INSENSITIVE1 is partly driven by a canonical Tyr‐based motif. Plant Cell 32: 3598–3612 [DOI] [PMC free article] [PubMed] [Google Scholar]
- Mbengue M, Bourdais G, Gervasi F, Beck M, Zhou J, Spallek T, Bartels S, Boller T, Ueda T, Kuhn H et al (2016) Clathrin‐dependent endocytosis is required for immunity mediated by pattern recognition receptor kinases. Proc Natl Acad Sci USA 113: 11034–11039 [DOI] [PMC free article] [PubMed] [Google Scholar]
- Meijering E, Jacob M, Sarria JC, Steiner P, Hirling H, Unser M (2004) Design and validation of a tool for neurite tracing and analysis in fluorescence microscopy images. Cytometry A 58: 167–176 [DOI] [PubMed] [Google Scholar]
- Mishev K, Lu Q, Denoo B, Peurois F, Dejonghe W, Hullaert J, De Rycke R, Boeren S, Bretou M, De Munck S et al (2018) Nonselective chemical inhibition of Sec7 domain‐containing ARF GTPase exchange factors. Plant Cell 30: 2573–2593 [DOI] [PMC free article] [PubMed] [Google Scholar]
- Nimchuk ZL (2017) CLAVATA1 controls distinct signaling outputs that buffer shoot stem cell proliferation through a two‐step transcriptional compensation loop. PLoS Genet 13: e1006681 [DOI] [PMC free article] [PubMed] [Google Scholar]
- Nimchuk ZL, Tarr PT, Ohno C, Qu X, Meyerowitz EM (2011) Plant stem cell signaling involves ligand‐dependent trafficking of the CLAVATA1 receptor kinase. Curr Biol 21: 345–352 [DOI] [PMC free article] [PubMed] [Google Scholar]
- Nimchuk ZL, Zhou Y, Tarr PT, Peterson BA, Meyerowitz EM (2015) Plant stem cell maintenance by transcriptional cross‐regulation of related receptor kinases. Development 142: 1043–1049 [DOI] [PMC free article] [PubMed] [Google Scholar]
- Ogawa M, Shinohara H, Sakagami Y, Matsubayashi Y (2008) Arabidopsis CLV3 peptide directly binds CLV1 ectodomain. Science 319: 294 [DOI] [PubMed] [Google Scholar]
- Olsson V, Joos L, Zhu S, Gevaert K, Butenko MA, De Smet I (2019) Look closely, the beautiful may Be small: precursor‐derived peptides in plants. Annu Rev Plant Biol 70: 153–186 [DOI] [PubMed] [Google Scholar]
- Ortiz‐Morea FA, Savatin DV, Dejonghe W, Kumar R, Luo Y, Adamowski M, Van den Begin J, Dressano K, Pereira de Oliveira G, Zhao X et al (2016) Danger‐associated peptide signaling in Arabidopsis requires clathrin. Proc Natl Acad Sci USA 113: 11028–11033 [DOI] [PMC free article] [PubMed] [Google Scholar]
- Paez Valencia J, Goodman K, Otegui MS (2016) Endocytosis and endosomal trafficking in plants. Annu Rev Plant Biol 67: 309–335 [DOI] [PubMed] [Google Scholar]
- Poncini L, Wyrsch I, Denervaud Tendon V, Vorley T, Boller T, Geldner N, Metraux JP, Lehmann S (2017) In roots of Arabidopsis thaliana, the damage‐associated molecular pattern AtPep1 is a stronger elicitor of immune signalling than flg22 or the chitin heptamer. PloS One 12: e0185808 [DOI] [PMC free article] [PubMed] [Google Scholar]
- Roberts I, Smith S, Stes E, De Rybel B, Staes A, van de Cotte B, Njo MF, Dedeyne L, Demol H, Lavenus J et al (2016) CEP5 and XIP1/CEPR1 regulate lateral root initiation in Arabidopsis . J Exp Bot 67: 4889–4899 [DOI] [PMC free article] [PubMed] [Google Scholar]
- Schlegel J, Denay G, Wink R, Pinto KG, Stahl Y, Schmid J, Blumke P, Simon RG (2021) Control of Arabidopsis shoot stem cell homeostasis by two antagonistic CLE peptide signalling pathways. Elife 10: e70934 [DOI] [PMC free article] [PubMed] [Google Scholar]
- Schoof H, Lenhard M, Haecker A, Mayer KF, Jurgens G, Laux T (2000) The stem cell population of Arabidopsis shoot meristems in maintained by a regulatory loop between the CLAVATA and WUSCHEL genes. Cell 100: 635–644 [DOI] [PubMed] [Google Scholar]
- Shinohara H, Matsubayashi Y (2015) Reevaluation of the CLV3‐receptor interaction in the shoot apical meristem: dissection of the CLV3 signaling pathway from a direct ligand‐binding point of view. Plant J 82: 328–336 [DOI] [PubMed] [Google Scholar]
- Somssich M, Ma Q, Weidtkamp‐Peters S, Stahl Y, Felekyan S, Bleckmann A, Seidel CA, Simon R (2015) Real‐time dynamics of peptide ligand‐dependent receptor complex formation in planta. Sci Signal 8: ra76 [DOI] [PubMed] [Google Scholar]
- Stahl Y, Wink RH, Ingram GC, Simon R (2009) A signaling module controlling the stem cell niche in Arabidopsis root meristems. Curr Biol 19: 909–914 [DOI] [PubMed] [Google Scholar]
- Stahl Y, Grabowski S, Bleckmann A, Kuhnemuth R, Weidtkamp‐Peters S, Pinto KG, Kirschner GK, Schmid JB, Wink RH, Hulsewede A et al (2013) Moderation of Arabidopsis root stemness by CLAVATA1 and ARABIDOPSIS CRINKLY4 receptor kinase complexes. Curr Biol 23: 362–371 [DOI] [PubMed] [Google Scholar]
- Su YH, Zhao XY, Liu YB, Zhang CL, O'Neill SD, Zhang XS (2009) Auxin‐induced WUS expression is essential for embryonic stem cell renewal during somatic embryogenesis in Arabidopsis . Plant J 59: 448–460 [DOI] [PMC free article] [PubMed] [Google Scholar]
- Van Damme D, Coutuer S, De Rycke R, Bouget FY, Inze D, Geelen D (2006) Somatic cytokinesis and pollen maturation in Arabidopsis depend on TPLATE, which has domains similar to coat proteins. Plant Cell 18: 3502–3518 [DOI] [PMC free article] [PubMed] [Google Scholar]
- Van Leene J, Eeckhout D, Cannoot B, De Winne N, Persiau G, Van De Slijke E, Vercruysse L, Dedecker M, Verkest A, Vandepoele K et al (2015) An improved toolbox to unravel the plant cellular machinery by tandem affinity purification of Arabidopsis protein complexes. Nat Protoc 10: 169–187 [DOI] [PubMed] [Google Scholar]
- Wang P, Pleskot R, Zang J, Winkler J, Wang J, Yperman K, Zhang T, Wang K, Gong J, Guan Y et al (2019) Plant AtEH/Pan1 proteins drive autophagosome formation at ER‐PM contact sites with actin and endocytic machinery. Nat Commun 10: 5132 [DOI] [PMC free article] [PubMed] [Google Scholar]
- Wang J, Mylle E, Johnson A, Besbrugge N, De Jaeger G, Friml J, Pleskot R, Van Damme D (2020) High temporal resolution reveals simultaneous plasma membrane recruitment of TPLATE complex subunits. Plant Physiol 183: 986–997 [DOI] [PMC free article] [PubMed] [Google Scholar]
- Wang J, Yperman K, Grones P, Jiang Q, Dragwidge J, Mylle E, Mor E, Nolf J, Eeckhout D, De Jaeger G et al (2021) Conditional destabilization of the TPLATE complex impairs endocytic internalization. Proc Natl Acad Sci USA 118: e2023456118 [DOI] [PMC free article] [PubMed] [Google Scholar]
- Yamaguchi YL, Ishida T, Sawa S (2016) CLE peptides and their signaling pathways in plant development. J Exp Bot 67: 4813–4826 [DOI] [PubMed] [Google Scholar]
- Yperman K, Papageorgiou AC, Merceron R, De Munck S, Bloch Y, Eeckhout D, Jiang Q, Tack P, Grigoryan R, Evangelidis T et al (2021a) Distinct EH domains of the endocytic TPLATE complex confer lipid and protein binding. Nat Commun 12: 3050 [DOI] [PMC free article] [PubMed] [Google Scholar]
- Yperman K, Wang J, Eeckhout D, Winkler J, Vu LD, Vandorpe M, Grones P, Mylle E, Kraus M, Merceron R et al (2021b) Molecular architecture of the endocytic TPLATE complex. Sci Adv 7: eabe7999 [DOI] [PMC free article] [PubMed] [Google Scholar]
- Zhang Y, Persson S, Hirst J, Robinson MS, Van Damme D, Sanchez‐Rodriguez C (2015) Change your TPLATE, change your fate: plant CME and beyond. Trends Plant Sci 20: 41–48 [DOI] [PubMed] [Google Scholar]