

Abstract
How cells coordinate their metabolism with division determines the rate of cell proliferation. Dynamic patterns of metabolite synthesis during the cell cycle are unexplored. We report the first isotope tracing analysis in synchronous, growing budding yeast cells. Synthesis of leucine, a branched‐chain amino acid (BCAA), increases through the G1 phase of the cell cycle, peaking later during DNA replication. Cells lacking Bat1, a mitochondrial aminotransferase that synthesizes BCAAs, grow slower, are smaller, and are delayed in the G1 phase, phenocopying cells in which the growth‐promoting kinase complex TORC1 is moderately inhibited. Loss of Bat1 lowers the levels of BCAAs and reduces TORC1 activity. Exogenous provision of valine and, to a lesser extent, leucine to cells lacking Bat1 promotes cell division. Valine addition also increases TORC1 activity. In wild‐type cells, TORC1 activity is dynamic in the cell cycle, starting low in early G1 but increasing later in the cell cycle. These results suggest a link between BCAA synthesis from glucose to TORC1 activation in the G1 phase of the cell cycle.
Keywords: BCAA, BCAT, cell size, isotope tracing, TORC1
Subject Categories: Cell Cycle; Metabolism; Microbiology, Virology & Host Pathogen Interaction
Branched‐chain amino acid (BCAA) synthesis by Bat1 regulates the activity of TORC1, the master regulator of anabolism, as yeast cells progress in the cell cycle. This provides new insights into how cells coordinate their metabolism with division.

Introduction
How metabolism is coupled to cell division underpins the control of cell proliferation. Except for early embryonic cell divisions, the rate at which cells can divide usually depends not on how fast they can duplicate their genome but on how fast they can synthesize everything else that makes up a newborn cell. Since the discovery of cdc mutants in S. cerevisiae decades ago, it has been known that cells continue to grow if cell division is blocked (Hartwell & Unger, 1977; Johnston et al, 1977). On the contrary, stopping cell growth blocked cell division. In some instances, the cell cycle machinery does trigger specific metabolic pathways, especially in lipid and carbohydrate mobilization (Kurat et al, 2009; Ewald et al, 2016). By and large, however, metabolism controls division and not the other way around. Similarly, inhibiting the target of rapamycin (TOR) kinase, the “master regulator” of multiple anabolic pathways, including protein synthesis, arrests cells in early G1 with a small size (Barbet et al, 1996).
Early reports of cell cycle‐dependent metabolic changes in a variety of organisms were later shown to be artifacts of synchronization (Creanor & Mitchison, 1979; Creanor et al, 1983). Popular methods to synchronize cells rely on first blocking them at some point in the cell cycle and, after some time, releasing the block so cells can progress synchronously in the subsequent phases of the cell cycle. But cells continue to grow during arrest, perturbing the physiological coupling between cell growth and division. In recent years, several studies monitored the steady‐state levels of metabolites in the cell cycle in yeast (Ewald et al, 2016; Blank et al, 2020), green alga (Jüppner et al, 2017), fly (Sanchez‐Alvarez et al, 2015), and human cells (Atilla‐Gokcumen et al, 2014; Scaglia et al, 2014).
However, metabolite abundances do not reveal material flow per unit time through a metabolic pathway (Jang et al, 2018). One can infer that information through the use of isotope tracers and the appropriate computational analyses (Weindl et al, 2015). Isotope tracing in the cell cycle to monitor the flow through metabolic pathways has remained unexplored. Only one study reported Kreb's cycle flux in dividing human HeLa cells (Ahn et al, 2017), synchronized with a double thymidine block, which arrests cells at the G1/S transition (Polymenis, 2022). When the cells were released from their arrest, glucose oxidation peaked late in the subsequent G1 phase, followed by oxidative and reductive glutamine metabolic fluxes in S phase (Ahn et al, 2017). It is unknown whether these metabolic changes extend to other systems and how they are connected to molecular pathways that govern cell growth and division.
Here, we queried for the first time with isotope tracing highly synchronous, unarrested, dividing yeast cells. We identified an increase in the synthesis of the branched‐chain amino acid (BCAA) leucine in the G1 phase of the cell cycle, and peaking later in the S phase. We found that cells lacking the mitochondrial BCAA aminotransferase Bat1 were smaller, had a much longer G1 phase, and very low TOR complex 1 (TORC1) activity. In newborn wild‐type daughter cells, TORC1 activity was also low in early G1 but increased as cells progressed in the cell cycle. These results provide the first picture of cell cycle‐dependent metabolic fluxes in yeast, potentially linking BCAA synthesis to TORC1 activation in the cell cycle.
Results and Discussion
Experimental design of isotope tracing in the cell cycle
We used a prototrophic strain, CEN.PK (see Materials and Methods), cultured in synthetic minimal medium (SMM) to avoid biases that could arise from exogenous nutrient supplementation. To minimize arrest‐related artifacts, we used centrifugal elutriation to isolate unarrested, small, early G1 cells (Polymenis, 2022). Using uniformly labeled 13C‐glucose, we generated a sliding pulse‐chase window over the entire cell cycle (see Fig 1A and Materials and Methods).
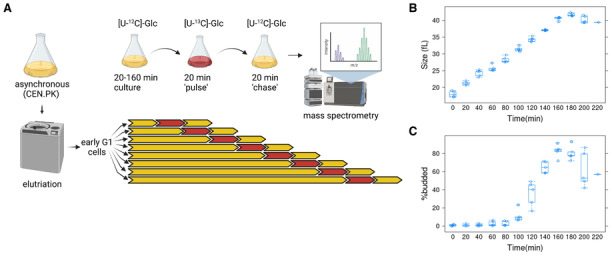
Figure 1. Overview of the approach to obtain samples for metabolic flux analysis in highly synchronous, dividing, budding yeast cells.
-
AFor each experiment, early G1 daughter cells of a prototrophic strain (CEN.PK; see Materials and Methods) were obtained by centrifugal elutriation. The elutriated culture was split into eight aliquots and cultured for a varying amount of time, from 20 to 160 min, in minimal, [U‐12C]‐glucose medium. They were then transferred to a medium with [U‐13C]‐glucose for 20 min (pulse) and then incubated for another 20 min in [U‐12C]‐glucose medium (chase). Metabolite extracts from these cells were analyzed by mass spectrometry. Five such independent experiments were performed. The figure was generated with Biorender.com.
-
BBoxplots showing the cell size (y‐axis) over time (x‐axis) of all the samples as they progressed in the cell cycle.
-
CBoxplots showing the percentage of budded cells (y‐axis) from the same samples shown in (B). The boxplot graphs were generated with R language functions. Each box is drawn from the first to the third quartile, with a horizontal line drawn in the middle to denote the median. The whiskers show the interquartile range (IQR), and they were drawn at 1.5xIQR. The replicates were all biological ones.
Source data are available online for this figure.
To gauge cell cycle progression and synchrony, we measured cell size with a channelyzer (Fig 1B) and the percentage of budded cells with microscopy (Fig 1C). In S. cerevisiae, the appearance of a bud on the cell surface correlates with the timing of initiation of DNA replication (Hartwell & Unger, 1977; Pringle & Hartwell, 1981). Cells progressed synchronously in the cell cycle, increasing in size at a constant rate (Fig 1B), with buds appearing at ~ 100 min, while by 160–180 min, the vast majority of cells were budded and had doubled in size (to > 40 fL; Fig 1C). By 180 min, new G1 daughter cells were generated, leading to a drop in the percentage of budded cells and cell size (Fig 1B and C). These data suggest that the metabolically labeled samples we prepared were from highly synchronous cells, querying all cell cycle phases.
Synthesis of leucine from glucose changes in the cell cycle
Analyzing the metabolically labeled cell extract samples by gas chromatography–mass spectrometry (GC–MS) revealed changes in the mass isotopomer distributions (MIDs) in some of the species we detected (Fig 2; Dataset EV1). Mass isotopomer distribution changes reflect patterns in the synthesis and turnover of the relevant metabolites. Trends of dynamic changes in isotopomer abundance were evident for several species (e.g., pyruvate [M2], succinate [M3], Fig 2). However, based on ANOVA statistical analysis, leucine (M6) and pyruvate (M1) were the most significantly affected metabolites we detected (Fig 2; Dataset EV1/Sheet2). Pyruvate (M1) likely arises from breakdown pathways. For the synthesis of leucine, two molecules of 13C‐labeled pyruvate and one molecule of 13C‐labeled acetyl‐CoA provide the carbon input from the glycolytic breakdown of the 13C‐labeled glucose to the leucine (M6) isotopomer (see Appendix Fig S1). The levels of leucine (M6) were the lowest at the earliest time point in early G1 but increased (> 4‐fold) by 100 min, peaking at ~ 150 min in the S phase (Fig 2), when more than half the cells in that experiment were budded (Fig 1C). These results are consistent with an increase in newly synthesized leucine from glucose as cells progress through the G1 phase of the cell cycle.
Figure 2. Relative abundance of intracellular metabolite isotopomers in the cell cycle.
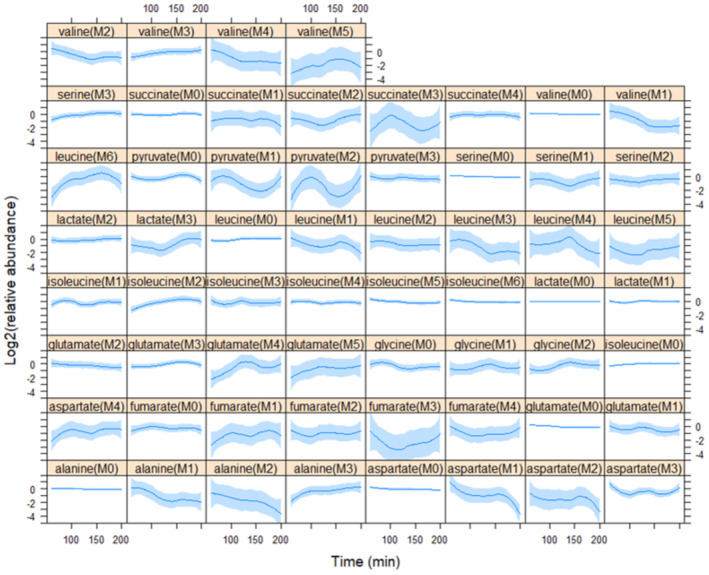
Each plot shows the relative mass isotopomer distribution (MID) values for metabolite species detected from cell extracts in each of the five independent experiments shown in Fig 1. Each value was divided by the average value of the entire time series (x‐axis) for that species from the same experiment, and Log2‐transformed (y‐axis). Loess curves and the std errors at a 0.95 level are shown. The Log2(relative abundance) values of pyruvate(M1) and leucine(M6) showed the most significant changes (P < 0.1, see Dataset EV1/Sheet2) in cells across the cell cycle. Source data are available online for this figure.
We also measured the MID values from the media of the same cultures used to prepare the cell extracts (Dataset EV1/Sheet3). The levels of the glutamate (M4) and glutamine (M2) forms in the media were significantly changed in the cell cycle (Dataset EV1/Sheet4). Still, these changes were due to a single time point of the experiment (e.g., glutamate [M4] levels in the media were the highest at the first time point we measured, compared to all subsequent time points), making interpretations difficult. All the MID measurements and data collected on selected ion monitoring (SIM) mode are in Dataset EV1.
Whether changes in the synthesis of metabolites identified from isotope tracing experiments are reflected in their steady‐state levels depends on several variables. These variables include the metabolite turnover, partition in different pools inside cells, and their generation from the breakdown of macromolecules (e.g., from proteins, in the case of amino acids). We measured the intracellular levels of amino acids under the same experimental conditions as in Fig 1. Based on a phenylthiohydantoin (PTH)‐based detection method (see Materials and Methods), the steady‐state levels of several amino acids changed in the cell cycle, but in no case varying > 2‐fold (Fig EV1). For example, arginine and asparagine, which were not detected in our isotope tracing experiment, peaked at different times in the cell cycle, in G2/M vs. G1, respectively (Fig EV1). The levels of the BCAA amino acids (Ile, Leu, Val) start high but decline in late G1, when the cells reach ~ 35 fL, then increase by ~ 30–40% in G2/M (Fig EV1). Although the same trend was evident for all BCAAs, these differences were significant only for valine (P < 0.05, based on robust ANOVA analysis) because the variance in the measurements of leucine and isoleucine was higher.
Figure EV1. Steady‐state amino acid levels in the cell cycle.

Intracellular amino acid levels were measured as described in Materials and Methods from synchronous, elutriated cultures in SMM media. The relative abundance of each amino acid is on the y‐axis. Source data are available online for this figure.
In the remainder of this manuscript, we focus on the role of BCAA synthesis in proliferating cells. We note that although leucine (M6) levels changed the most significantly in the cell cycle, valine (M5) levels also showed a similar trend, peaking when cells were in the S phase (see Fig 2, top right panel).
Cells lacking Bat1 grow slowly
The BCAA aminotransferases Bat1 and Bat2 catalyze the synthesis of all BCAAs from the corresponding alpha‐keto acids (Fig 3A; Eden et al, 1996; Kispal et al, 1996). Bat1 is mitochondrial, while Bat2 is cytoplasmic (Eden et al, 1996; Kispal et al, 1996; Prohl et al, 2000). We deleted BAT1 or BAT2 in the same prototrophic strain background (CEN.PK; see Materials and Methods) we used in the isotope tracing experiments. There are conflicting reports in the literature about the growth rate of bat1Δ cells. One of the studies that identified BAT1 reported that bat1Δ cells grew and divided faster (Schuldiner et al, 1996). However, other studies reported that loss of Bat1 reduced growth rate, especially in minimal media (Kispal et al, 1996; Takpho et al, 2018; Koonthongkaew et al, 2020). We found that cells lacking Bat1, but not Bat2, grew poorly on minimal media (Fig 3B). Exogenous supplementation of BCAAs suppressed the growth defect of bat1Δ cells, mostly when valine was present (Fig 3B), in agreement with a proposal that valine synthesis in yeast is primarily a mitochondrial process regulated by Bat1 (Takpho et al, 2018). Supplementation with the corresponding alpha‐keto acids did not suppress the growth defect of bat1Δ cells (Fig EV2).
Figure 3. BCAA supplementation suppresses the growth defect of bat1Δ mutants.

-
ADiagram of the reactions leading to BCAAs from the corresponding alpha‐keto (α‐k) acids, catalyzed by Bat1,2p. A more detailed diagram leading to the of valine (M5) and leucine (M6) isotopomers is in Fig EV1.
-
BThe indicated strains (all in the prototrophic CEN.PK background; see Materials and Methods) were spotted at 10‐fold serial dilutions on solid Synthetic Minimal Medium (SMM) agar plates. Exogenous amino acids were added at 1 mM final concentration, as indicated in each case. The plates were incubated at 30°C and photographed after 3‐days.
-
CDNA content profiles of BAT1 and bat1Δ cells from asynchronous cultures, in SMM medium. Where indicated, exogenous amino acids were added at 1 mM final concentration. On the x‐axis of the histograms is fluorescence per cell, while on the y‐axis is the cell number. Peaks corresponding to cells in G1 with unreplicated (1 N) and cells in G2 and M phases with fully replicated (2 N) DNA are indicated. The percentage of cells with G1 DNA content (%G1) from 3 independent measurements is shown in each case (mean and sd).
Source data are available online for this figure.
Figure EV2. Alpha‐keto acid supplementation does not suppress the growth defect of bat1Δ mutants.

The experiment was done as in Fig 3. Exogenous alpha‐keto acids were added at 1 mM final concentration, as indicated in each case. Source data are available online for this figure.
However, even when all three BCAAs were added exogenously, they did not fully restore the growth of bat1Δ cells (Fig 3B). There are several possibilities to explain these results: First, de novo BCAA synthesis by the Bat1 mitochondrial enzyme may be required for optimal growth. Second, Bat1 may have novel roles. It has been speculated that Bat1 may be enzymatically involved in synthesizing iron–sulfur clusters in mitochondria, which are then exported to the cytoplasm (Prohl et al, 2000), or even that Bat1 has an unknown nonenzymatic role (Kingsbury et al, 2015).
To link the poor growth of bat1Δ cells with specific metabolic alterations in these cells, we examined their steady‐state metabolite levels using several approaches. First, we measured the intracellular levels of amino acids via the PTH‐based detection method, as in Fig EV1. With this assay, the intracellular levels of isoleucine and, especially, valine were significantly lower in bat1Δ compared to BAT1 + cells (Fig EV3). Interestingly, the levels of Gly and Ala were also lower in bat1Δ cells (Fig EV3). We next compared metabolite levels between BAT1 + and bat1Δ cells using two different MS‐based approaches. Primary metabolites were measured with GC‐TOF MS, while biogenic amines with HILIC‐QTOF MS/MS (see Materials and Methods). Using mass spectrometry, the levels of all three BCAAs, including leucine, were significantly lower (P < 0.05) in cells lacking Bat1 (Fig EV4). Overall, however, from the > 300 compounds detected and assigned from the mass spectrograms, the levels of only 15 compounds changed significantly by > 1.5‐fold between BAT1 + and bat1Δ cells (Fig EV4). Some dipeptides were enriched in either BAT1 + or bat1Δ cells (P < 0.0001 with Holm–Bonferroni correction, based on the MetaboAnalyst platform; Chong et al, 2019), while the “amino acids” metabolite group was enriched in BAT1 + vs. bat1Δ cells (P < 0.02 with Holm–Bonferroni correction, based on the MetaboAnalyst platform). Alterations in TCA cycle metabolites have been reported for double bat1,2Δ cells (Kingsbury et al, 2015), but these changes were not evident in the single, prototrophic bat1Δ cells we evaluated here. In summary, the above results suggest that a drop in intracellular BCAAs, and not widespread global metabolite changes, is at least in part responsible for the slow growth of bat1Δ cells.
Figure EV3. Amino acid levels in BAT1 + and bat1Δ cells.

Intracellular amino acid levels were measured as described in Materials and Methods and Fig EV1, from exponentially growing cultures in SMM media. The fraction of each amino acid is on the y‐axis. The four amino acids (Gly, Ile, Val, Ala) with significantly altered fractional abundance (> 2‐fold, P < 0.05; from six independent samples in each case) are indicated. The boxplot graphs were generated with R language functions. Each box is drawn from the first to the third quartile, with a horizontal line drawn in the middle to denote the median. The whiskers show the interquartile range (IQR), and they were drawn at 1.5xIQR. The replicates were all biological ones. Source data are available online for this figure.
Figure EV4. Changes in primary and biogenic amine metabolites in cells lacking Bat1.

Metabolites whose levels changed were identified from the magnitude of the difference (x‐axis; Log2‐fold change in BAT1 +: bat1Δ cells) and statistical significance (y‐axis), indicated by the red lines. The analytical and statistical approaches are described in Materials and Methods. The labels indicate selected metabolites. Source data are available online for this figure.
Bat1‐deficient cells are small and delayed in the G1 phase of the cell cycle
To see how the slow growth of bat1Δ cells manifests during cell division, we first looked at the DNA content of asynchronously dividing BAT1 + and bat1Δ cells. Asynchronous bat1Δ cultures had at least twice as many cells in the G1 phase than BAT1 + cells (Fig 3C). Exogenously added BCAAs (at 1 mM final concentration) had varying effects. Isoleucine did not modify the DNA content profile, but leucine (P = 0.023) and valine (P < 0.0004; based on a robust bootstrap ANOVA) reduced the fraction of cells with 1 N DNA content (Fig 3C). The effect was much more substantial for valine (51% of cells with 1 N DNA content, vs. 71% for mock‐treated cells) but still far from the distribution seen in wild‐type cells (30% of cells with 1 N DNA content; compare the left histogram to the right one in Fig 3C). These results mirror the results from the growth assays in Fig 3B, arguing that exogenous BCAAs, especially valine, suppress the phenotypes of bat1Δ cells, but they do not fully restore their growth and cell cycle progression.
We next examined cell cycle‐associated phenotypes in more detail. In budding yeast, changes in the kinetics of cell cycle progression are often accompanied by cell size changes. As nutrient availability and quality are reduced, the birth and mean size of cells are reduced, the rate at which cells increase in size is lowered, and the duration of the G1 phase increases disproportionately compared with the duration of subsequent cell cycle phases (Johnston et al, 1977; Soma et al, 2014). Loss of Bat1 significantly reduced both the birth and mean cell size in asynchronous cultures in SMM medium (Fig EV5A). We then used centrifugal elutriation to obtain highly synchronous, early G1 daughter cell populations. Wild‐type and bat2Δ cells progressed in the cell cycle with similar kinetics (Fig EV5B, compare the left and right panels). They had a critical size (defined as the size at which half the cells are budded) of ~ 37 fL. On the contrary, the slow growth of bat1Δ cells made elutriation very challenging, and only around 60% of the elutriated cells in the population eventually budded (Fig EV5B, middle panel). The small elutriated bat1Δ cells increased in size very slowly, having a specific rate of size increase (k) of 0.15 vs. 0.23 h−1 for wild‐type cells (Fig EV5C). From all these measurements, knowing the birth size (Vb), the size at which cells enter the S phase (critical size, Vc), and the rate at which they increase in size (k), we can obtain accurate estimates of the absolute length of the G1 phase (TG1), from the equation TG1 = (LN(Vc/Vb))/k. While BAT1 + daughter cells stay in G1 for ~ 2.3 h, in bat1Δ daughters, the G1 phase lasts ~ 4.5 h. We conclude that bat1Δ cells have a pronounced G1 delay, resembling nutrient‐limited cells.
Figure EV5. Cells lacking Bat1 are smaller, increase in size slower, and are delayed in the G1 phase of the cell cycle.

-
ABoxplots showing the size of the cells (in fL). The measurements were taken from asynchronous cultures in synthetic minimal media (SMM) without amino acid supplementation. The boxplot graphs were generated with R language functions. Each box is drawn from the first to the third quartile, with a horizontal line drawn in the middle to denote the median. The whiskers show the interquartile range (IQR), and they were drawn at 1.5xIQR. The replicates were all biological ones.
-
BPlots of the percentage of budded cells (y‐axis) as a function of size (x‐axis). The measurements were from daughter cells of the indicated strains, obtained by centrifugal elutriation, progressing in the cell cycle in SMM medium. Loess curves and the std errors at a 0.95 level are shown.
-
CFrom the same experiments as in (B), the specific rate of the increase in size (k) was calculated, from the slope of the regression lines plotting the Ln‐transformed cell size values (y‐axis) against time (x‐axis).
Source data are available online for this figure.
Bat1 is functionally linked to TOR activation
It has been previously reported that TOR signaling is significantly reduced in loss‐of‐function bat mutants in yeast (Kingsbury et al, 2015). It is possible then that the growth defect of bat1Δ cells could at least in part reflect TOR inhibition. Since rapamycin inhibits the TOR complex 1 (TORC1), which drives cellular anabolic processes (Loewith & Hall, 2011), we queried the growth of bat1Δ cells in the presence of sublethal levels of rapamycin (Fig 4A). The growth of BAT1 + and bat1Δ cells was equalized by rapamycin added at 30 ng/ml (Fig 4A). These results suggest that the inhibition of TORC1 by rapamycin lies downstream of Bat1, and it is epistatic to the growth defects of bat1Δ cells. To further test this notion, we looked at a molecular output of TORC1 signaling. Phosphorylation of ribosomal protein S6 (Rps6) reports on TORC1 activation, and it can be detected in yeast using an antibody against the human phosphorylated S6 protein (González et al, 2015; Wallace et al, 2022). While phosphorylated Rps6 was readily detected in wild‐type cells in minimal medium (Fig 4B), it was barely so in bat1Δ cells (Fig 4B, top blot after prolonged exposure). We confirmed that the signal attributed to Rps6 phosphorylation is sensitive to TORC1 inhibition by rapamycin (Fig 4C, left) and phosphatase treatment (Fig 4C, right).
Figure 4. Bat1 is functionally linked to TORC1 activation in early G1.

-
AThe indicated strains were spotted at 10‐fold serial dilutions on solid Synthetic Minimal Medium (SMM) agar plates. Rapamycin was added at 30 ng/ml, as shown in each case. The plates were incubated at 30°C and photographed after 5 and 7 days, as indicated.
-
BImmunoblots of total cell extracts from asynchronous BAT1 and bat1Δ cells, from four independent experiments. The signal from Pgk1 (α‐Pgk1) is shown on the blot at the bottom, and from phosphorylated Rps6 (α‐Rps6‐P) is on the blot above, indicated for two exposures (2 min, top; 20 s, middle).
-
COn the left are immunoblots from wild‐type (CEN.PK) cells treated (+), or not (−), with rapamycin (Rapa) at 200 ng/ml for 1 h before cell extract preparation. On the right are immunoblots of wild‐type (CEN.PK) cell extracts. The extracts were treated (+), or not (−), with λ‐phosphatase for 1 h (see Materials and Methods). The levels of phosphorylated Rps6 (α‐Rps6‐P) and Pgk1 (α‐Pgk1) are shown in each case.
-
DExogenous addition of valine leads to sustained activation of TORC1 and phosphorylation of Rps6 in cells lacking Bat1. Wild type (BAT1 +) and bat1∆ (two independent isolates, #4, and #5) strains were grown overnight in minimal (SMM) medium, diluted to 1E+06 cells/ml in fresh SMM media containing the indicated amino acid (at 1 mM), and harvested when they reached 5E+06 cells/ml. The levels of phosphorylated Rps6 (α‐Rps6‐P) and Pgk1 (α‐Pgk1) are shown in immunoblots from total cell extracts in each case. The relative levels of Rps6‐P/Pgk1 are shown in each case at the bottom. The boxplot graphs were generated with R language functions. Each box is drawn from the first to the third quartile, with a horizontal line drawn in the middle to denote the median. The whiskers show the interquartile range (IQR), and they were drawn at 1.5xIQR. The replicates were all biological ones.
Source data are available online for this figure.
Since the exogenous addition of BCAAs suppressed the growth defect of bat1Δ cells (Fig 3B), albeit to varying degrees, we next measured the levels of phosphorylated Rps6 upon adding BCAAs. For this experiment, overnight cultures of BAT1 + and bat1Δ cells were diluted to the same cell density (1E+06 cells/ml) in fresh minimal media containing the indicated amino acid (at 1 mM) and harvested after they had completed at least two cell divisions when they reached 5E+06 cells/ml. In wild‐type cells, the magnitude of elevated levels of phosphorylated Rps6 by exogenous BCAAs was minimal (e.g., only ~ 10% in the case of leucine; Fig 4D). This agrees with other reports, which showed that adding BCAAs does not lead to sustained TORC1 activation in wild‐type cells (Stracka et al, 2014; Kingsbury et al, 2015). On the contrary, we found that bat1Δ cells exposed to valine had > 10‐fold higher phosphorylated Rps6 (Fig 4D). These results were evident in two independently derived bat1Δ strains (bat1Δ‐4 and bat1Δ‐5; Fig 4D), mirroring the ability of exogenous valine to suppress the slow growth of bat1Δ cells (Fig 3B and C) and their reduced TORC1 activity (Fig 4B). We note that exogenous valine has also been reported previously to activate TORC1 in some settings (Mirisola et al, 2014). Overall, the most straightforward interpretation of our results is that cells lacking Bat1 may represent a highly sensitized background of low TORC1 activity, enabling the display of effects (e.g., activation of TORC1 by exogenous BCAAs) that are difficult to detect in prototrophic wild type cells with high TORC1 activity.
TORC1 activity already is at a maximal level in wild type cells cultured with a preferred nitrogen (ammonium) and carbon (glucose) source (Hughes Hallett et al, 2014), making it difficult to enhance it further. It is mostly in the context of loss‐of‐function perturbations (e.g., TORC1 inhibition by rapamycin or nutrient withdrawal (Heitman et al, 1991; Barbet et al, 1996; Pedruzzi et al, 2003; De Virgilio & Loewith, 2006; Loewith & Hall, 2011; Hughes Hallett et al, 2014; Kingsbury et al, 2015; Moreno‐Torres et al, 2015), or upon Bat1 loss (Figs 3 and 4 and EV5) that proliferative effects become apparent.
TORC1 activity during cell division in wild type cells
Since we detected an increase in leucine synthesis as cells progress in the cell cycle in wild‐type cells (Fig 2), demonstrated a severe G1 delay (Figs 3 and EV5) and reduced TORC1 activity (Fig 4) in bat1Δ cells, we then examined TORC1 activity in the cell cycle in wild‐type cells. It has been known for decades that inhibition of TORC1 by rapamycin arrests budding yeast (Heitman et al, 1991) and mammalian (Albers et al, 1993) cells in the G1 phase of the cell cycle. But just because inhibition of TORC1 by genetic or chemical means leads to G1 arrest is not enough to conclude that in dividing, unperturbed cells, there is dynamic control of TORC1 activity in the cell cycle. On the contrary, one could argue that since bulk cell growth and protein synthesis appear to have a constant rate throughout the cell cycle in constant nutrients in budding yeast (Elliott & McLaughlin, 1978), perhaps TORC1 activity is also constant in these conditions. We had previously shown that the abundance of the Rps6 paralogs, Rps6A or Rps6B, or any other ribosomal protein, does not change at all in the cell cycle (Blank et al, 2020). Here, we found that Rps6 phosphorylation rises steadily in synchronous cultures of wild‐type prototrophic cells in minimal medium, increasing ~ 3–4‐fold by the time cells have exited the G1 phase when they are large (> 35 fL) and budded (> 50%) (Fig 5A, bottom blots; and 5B, for the quantification from multiple experiments). Similar results were obtained in a prototrophic strain (X2180‐5A) of the S288C background by looking at a different output of TORC1, phosphorylation of the Sch9 kinase, using an antibody that recognizes Sch9‐T737 phosphorylation (Kingsbury et al, 2015). We confirmed that this antibody recognized a protein whose signal disappeared when TORC1 activity was inhibited by rapamycin (Appendix Fig S2A). In synchronous cells from two independent elutriation experiments (Appendix Fig S2B), there was no signal in small, early G1 cells. The signal increased as cells progressed into late G1, peaking in the S phase (Appendix Fig S2B). These results provide evidence of cell cycle‐dependent changes in TOR signaling in budding yeast.
Figure 5. TORC1 activity increases as cells progress in the cell cycle.

- Immunoblots of total cell extracts from synchronous, elutriated wild‐type (CEN.PK) cells in minimal (SMM) medium with exogenous Leu or Val added at 1 mM immediately after elutriation. At the top, the percent of budded cells (%B), cell size (in fL), and time (in min) are indicated. The levels of phosphorylated Rps6 (α‐Rps6‐P) and Pgk1 (α‐Pgk1) are shown in each case.
- Quantification of the levels of phosphorylated Rps6 and Pgk1 from independent experiments done as in A. The relative levels of each protein across the cell cycle is shown on the y‐axis, as a function of cell size (x‐axis). Loess curves and the std errors at a 0.95 level are shown.
- Schematic of a possible model to explain our findings, linking BCAA synthesis to TORC1 activation early in the cell cycle.
Source data are available online for this figure.
Although exogenous BCAAs did not lead to a sustained increase in TORC1 activity in asynchronously proliferating wild‐type cells (Fig 4D), we next asked whether they might change the pattern of the temporal activation of TORC1 in the cell cycle. We isolated newborn daughter cells in early G1 phase, and resuspended them in media supplemented with 1 mM leucine (Fig 5A, middle blots) or valine (Fig 5A, top blots). A small acceleration of the rise in the levels of phosphorylated Rps6 was evident in both the leucine‐ and valine‐supplemented cells (Fig 5A and B). Nonetheless, there were no noticeable downstream consequences in the kinetics of cell cycle progression, in either the rate the cells increased in size or their critical size (Fig 5A; see values above the corresponding blots), consistent with the notion that TORC1 activity already is at a maximal level in these conditions (Hughes Hallett et al, 2014).
Conclusions
The experiments we described provide the first picture of changing BCAA synthesis in synchronous, proliferating yeast cells. Together, they point to a straightforward sequence of events, from glycolytic flux and generation of pyruvate, to BCAA synthesis by the Bat1 aminotransferase, and then TORC1 activation late in G1 and into the S phase (Fig 5C). In developing eye imaginal disks in flies, TORC1 activity scored by phosphorylation of Rps6 has also been reported to be the highest in S phase cells (Kim et al, 2017; Romero‐Pozuelo et al, 2017). Our isotope tracing results argue that despite the apparent constancy of overall cell growth, specific pathways of central metabolism, such as leucine biosynthesis, may show cell cycle‐dependent changes (Fig 2). This view of dynamic, cell cycle‐dependent control of metabolic pathways is consistent with recent findings in budding yeast using single‐cell microscopy, showing that ribosome biogenesis (Guerra et al, 2022) and protein synthesis (Takhaveev et al, 2023), known to be regulated by TORC1 and protein kinase A pathways, change in the cell cycle, peaking in G1 and then later also in G2/M. Lipid biosynthesis also strongly depends on cell cycle progression in yeast, peaking in the G2 and M phases (Blank et al, 2020; Takhaveev et al, 2023). As the assays develop further, both with isotope tracing and single‐cell approaches, more biosynthetic pathways will likely be found to display dynamic temporal control during cell division. Such advances may revise the long‐held view of cellular biosynthesis as a static, “housekeeping” process with few prominent landmarks during cell proliferation.
It is unknown how the activity of Bat1 may be regulated. The steady‐state levels of the BAT1 transcript (Spellman et al, 1998; Blank et al, 2017, 2020), and Bat1 protein (Blank et al, 2020), do not change in the cell cycle. On the contrary, Bat1 is heavily modified post‐translationally at multiple residues by phosphorylation (Albuquerque et al, 2008; Lanz et al, 2021; Zhou et al, 2021), acetylation (Henriksen et al, 2012), and succinylation (Weinert et al, 2013; Frankovsky et al, 2021), which could affect its enzymatic activity. Lastly, we note that the mammalian ortholog BCAT1 is activated and necessary for chronic myeloid leukemia (CML) development in humans and mice, exercising its oncogenic function through BCAA production in CML cells (Hattori et al, 2017). Interestingly, the therapeutic potential of rapamycin in CML was the objective of a recently completed clinical trial (NCT00780104), but the results are not available yet. Future work, perhaps in CML cell lines, incorporating synchronous cultures and isotope tracing, may test if our yeast results extend to mammals, including humans.
Materials and Methods
All reagents and materials are listed in the Reagent Table.
Reagents and Tools table
| Reagent/Resource | Reference or source | Identifier or catalog number |
|---|---|---|
| Experimental models | ||
| CEN.PK (S. cerevisiae) | PMID: 16254148 | |
| MSP247 (S. cerevisiae) | This study | |
| MSP248 (S. cerevisiae) | This study | |
| X2180‐5A (S. cerevisiae) | PMID: 3519363 | |
| Recombinant DNA | ||
| pFA6a‐kanMX6 | PMID: 9717241 | |
| Antibodies | ||
| Anti‐Pgk1p antibody, mouse monoclonal | ThermoFisher | 459250 |
| Anti‐Rps6 p antibody | Cell Signaling | 4858 |
| Goat Anti Mouse HRP antibody | ThermoFisher | 31431 |
| Goat Anti Rabbit HRP antibody | ThermoFisher | 31466 |
| Anti‐Sch9‐pT737, rabbit polyclonal | PMID: 24514902 | |
| Oligonucleotides and sequence‐based reagents | ||
| BAT1‐F1 (ACTACATGTTTTCGTTAGAATAAATCACCCTATAAACGCAAAATCAGCTAGAACCTTAGCATACTAAAACCGGATCCCCGGGTTAATTAA) | This study | |
| BAT1‐R1 (AACAGATCCTCTGAGAGGAATTCTCGTTTTTTTTTTTTGGGGGGGGAGGGGATGTTTACCTTCATTATCAGAATTCGAGCTCGTTTAAAC) | This study | |
| BAT2‐F1 (ATAAAAACAGACTAACTACTAAAATTTTAGAAATTTAAGGGAAAGCATCTCCACGAGTTTTAAGAACGATCGGATCCCCGGGTTAATTAA) | This study | |
| BAT2‐R1 (CTCAGTAGAAAAAACGCTCTAGTTTTATTCTTTTTAACTTTTAATTACTTTACGTAGCAATAGCGATACTGAATTCGAGCTCGTTTAAAC) | This study | |
| VIII:517387‐FWD (GGTACCGGCCTTTAAGCTTT) | This study | |
| VIII:518942‐REV (TGTGCCAAGTTGTTAGGTCA) | This study | |
| X:705443‐FWD (TCCCTCTCTGACACCTCTTG) | This study | |
| X:706939‐REV (TGACATGACCCCTTAACTCAGT) | This study | |
| Chemicals, enzymes and other reagents | ||
| G418 | ThermoFisher | 11811023 |
| Ammonium sulfate | Fisher Scientific | BP212R‐1 |
| Dextrose [U‐13C] | Cambridge Isotope Laboratories | CLM‐1396‐5 |
| Dextrose | Sigma‐Aldrich | D9434 |
| Urea | Sigma‐Aldrich | U5378‐1KG |
| Cycloheximide | Calbiochem | 239763‐M |
| Sodium fluoride | Sigma‐Aldrich | 201154 |
| Phenylmethylsulfonyl fluoride | Sigma‐Aldrich | 10837091001 |
| Sodium azide | Sigma‐Aldrich | S2002 |
| Tris(hydroxymethyl)aminomethane | Sigma‐Aldrich | 252859 |
| Tris base | Roche | TRIS‐RO |
| Sodium chloride | Sigma‐Aldrich | S7653 |
| Magnesium chloride hexahydrate | USP | 1374248 |
| DTT | Sigma‐Aldrich | D0632 |
| Sodium azide | Sigma‐Aldrich | S2002 |
| L‐Leucine | Sigma‐Aldrich | L8000 |
| L‐Isoleucine | Sigma‐Aldrich | I2752 |
| L‐Valine | Sigma‐Aldrich | V0500 |
| Sodium 4‐methyl‐2‐oxovalerate | Sigma‐Aldrich | K0629 |
| 3‐Methyl‐2‐oxopentanoic acid sodium salt | Sigma‐Aldrich | 198978 |
| Sodium 3‐methyl‐2‐oxobutyrate | Sigma‐Aldrich | 198994 |
| Trichloroacetic acid | Sigma‐Aldrich | T6399 |
| Acetone | Sigma‐Aldrich | 179124 |
| Protease inhibitor tablets | Roche | 4693159001 |
| Phosphatase inhibitor tabets | Roche | 4906845001 |
| λ‐phosphatase | New England Biolabs | P0753S |
| Taq DNA polymerase | New England Biolabs | M0273L |
| Yeast extract | Sigma‐Aldrich | Y1625 |
| Peptone | Sigma‐Aldrich | P5905 |
| Yeast nitrogen base without amino acids and ammonium sulfate | Fisher Scientific | DF0335‐15‐9 |
| Bacteriological agar | Sigma‐Aldrich | A5306 |
| Glass beads | Scientific Industries | SI‐BG05 |
| Rapamycin | Sigma‐Aldrich | R8781 |
| Software | ||
| AccuComp Z2 | Beckman Coulter | 383550 |
| ImageJ | https://imagej.net/ | RRID:SCR_003070 |
| Adobe Photoshop | https://www.adobe.com/products/photoshop.html | RRID:SCR_014199 |
| RStudio | http://www.rstudio.com/ | RRID:SCR_000432 |
| SGD | http://www.yeastgenome.org/ | RRID:SCR_004694 |
| R | https://www.r‐project.org | v3.6.3 RRID:SCR_001905 |
Methods and protocols
Strains and media
All the strains used in this study are shown in the Reagents and Tools Table. Unless indicated otherwise, the cells were cultivated in the standard synthetic minimal media (SMM), containing 0.17% w/v yeast nitrogen base without amino acids and ammonium sulfate, 0.5% w/v ammonium sulfate, 2% w/v glucose at 30°C (Kaiser et al, 1994). To generate the bat1Δ haploid strain, we used the single‐step gene replacement method of Longtine (Longtine et al, 1998). Briefly, a PCR product was generated using plasmid pFA6a‐kanMX6 as a template (Longtine et al, 1998), with primers BAT1‐F1 and BAT1‐R1, and used to transform strain CEN.PK. Positive colonies resistant to G418 (Geneticin) were identified and genotyped by PCR with primers VIII:517387‐FWD and VIII:518942‐REV, to confirm that BAT1 was absent and replaced by the kanMX marker. Similarly, using primers BAT2‐F1 and BAT2‐R1, we generated the bat2Δ strain and genotyped it with primers X:705443‐FWD and X:706939‐REV. During strain construction, the cells were grown in agar plates with the standard rich undefined medium YPD (1% w/v yeast extract, 2% w/v peptone, 2% w/v dextrose) containing G418 at 100 μg/ml.
Centrifugal elutriation, cell size, and DNA content measurements
General methods have been described previously (Hoose et al, 2012; Soma et al, 2014). Briefly, for each elutriation, we used ~ 250 ml of culture at 1‐2E+07 cells/ml, in SMM medium. The cells were loaded on the elutriator at a pump speed of 35 ml/min and centrifuge speed of 3,200 rpm. The cells were washed with 250 ml at 2,800 rpm, and another 250 ml at 2,400 rpm. They were then elutriated with 250 ml at a pump speed of 38 ml/min and centrifuge speed of 2,400 rpm. At all times, including during the washes, the cells were in SMM medium. For the isotope tracing experiments, the elutriated early G1 cells were split into eight samples and allowed to proceed in the cell cycle in a medium with 12C‐glucose for varying times, as indicated in Fig 1A. Then, to label newly synthesized metabolites, we switched the medium to one with uniformly labeled 13C‐glucose, and the cells were cultured for a 20‐min “pulse” period. The culture was then switched back to a 12C‐glucose medium for a 20‐min “chase” period, and the cells were harvested for metabolite extraction (He et al, 2014). The experiment was repeated four more times from independent elutriation experiments, generating separate pulse‐chase time courses.
To accurately quantify the percentage of cells with 1 N DNA content (%G1; see Fig 3C), we first measured the total area of the histogram. Then, we measured the area of the left half of the 1 N peak, multiplied it by two, and divided it by the total area value. This fraction was multiplied by 100 to obtain the %G1 values shown in each case (Fig 3C).
Metabolite extraction for isotope tracing
The lyophilized cell extracts were first quenched by adding to the sample microcentrifuge tubes 0.4 ml methanol (kept at −20°C) and 400 μl double‐distilled water (ddH2O) with 13C‐glutaric acid (1 μg/ml, 4°C) used as internal standard. Then, 400 μl chloroform (at −20°C) was added, and the samples were mixed on a rotating shaker (at 1,400 rpm) for 20 min at 4°C. The samples were centrifuged for 5 min at 16,000 g at 4°C, and 300 μl of the supernatant were transferred to GC glass vials (Klaus Trott Chromatographiezubehör, Germany) and dried under vacuum at 4°C overnight (Labconco, United States). The vials were then capped with magnetic caps (Klaus Ziemer GmbH, Germany) and stored at −80°C until measurements.
Before derivatizing the supernatant samples, 50 μl of a 13C glutaric acid solution (10 μg/ml) in ddH2O was added as an internal standard to each sample and dried under vacuum as described above.
Derivatization and GC–MS measurements
The sample derivatization was performed by adding 30 μl 2% methoxyamine hydrochloride (MeOX) in pyridine (Roth, Germany) for 90 min at 55°C, followed by the addition of 30 μl N‐tert‐butyldimethylsilyl‐N‐methyltrifluoroacetamide (MTBSTFA) and incubated for 60 min at 55°C. The tert‐butyldimethylsilyl (TBDMS) derivatized samples were analyzed with a gas chromatograph connected to a mass spectrometer (GC–MS) (Agilent 7890A and 5975C inert XL Mass Selective Detector). For each measurement, 1 μl of the sample was injected in splitless mode into an SSL injector at 270°C. The GC was equipped with a 30 m DB‐35MS + 5 m Duraguard capillary column (0.25 mm inner diameter, 0.25 μm film thickness). Helium was used as carrier gas at a flow rate of 1.0 ml/min, and the GC‐oven was run at the following temperatures and times per sample: 6 min 80°C; 6 min 80 to 300°C; 10 min 300°C; 2.5 min 300 to 325°C; 4 min 325°C. Each GC–MS run lasted 60 min. The transmission temperature from GC to MS was 280°C, and the MS and the quadrupole temperatures were 230 and 150°C, respectively. The ionization in the mass detector was performed at 70 eV. The detector was operated in SCAN‐mode for full scan spectra from 70 to 800 m/z with 2 scans/s. We used a C10‐C40 alkane standard mixture (Sigma‐Aldrich) to calibrate retention indices.
Isotope tracing data analysis
Data analysis was performed with the Metabolite Detector (Hiller et al, 2009), RStudio, and LibreOffice software packages. After calibration with the alkane mixture, a normalization by the internal standard 13C‐Ribitol was performed to eliminate variations in sample volumes. Batch quantifications were performed with Metabolite Detector. Non‐targeted analysis was performed with an in‐house library and the following settings: Peak threshold 5; minimum peak height 5; 10 bins per scan; deconvolution with 5; no baseline adjustment; compound reproducibility 1.00; maximum peak discrimination index 100.00; min # ions 20.
All the data from these experiments are in Dataset EV1. To normalize and display the data in the cell cycle as shown in Fig 2, we processed the values as described previously (Spellman et al, 1998), yielding their “relative abundance” in the cell cycle. Briefly, the value of a species at any one time point in a cell cycle series was divided by the average of all values of that species at all time points in that series. These normalized values were then Log2‐transformed and used to generate the graphs in Fig 2.
Statistical analysis, sample‐size, and replicates
For sample‐size estimation, no explicit power analysis was used. All the replicates in every experiment shown were biological ones, from independent cultures. A minimum of three biological replicates was analyzed in each case, as indicated in each corresponding figure's legend. The robust bootstrap ANOVA was used to compare different populations via the t1waybt function, and the posthoc tests via the mcppb20 function, of the WRS2 R language package (Wilcox, 2011; Mair & Wilcox, 2020). The non‐parametric Kruskal‐Wallis and posthoc Nemenyi tests were done with the posthoc.kruskal.nemenyi.test function of the PMCMR R language package. No data or outliers were excluded from any analysis.
Immunoblot analysis
For protein surveillance, protein extracts were made as described (Wallace et al, 2022), and resolved on 12% Tris‐Glycine SDS–PAGE gels, unless indicated otherwise. Loading was measured with an anti‐Pgk1p primary antibody (at 1:5,000; ThermoFisher; Cat#: 459250), followed by a secondary antibody (at 1:5,000; ThermoFisher; Cat#: 31431). Ribosomal protein S6 phosphorylation was detected by a specific rabbit monoclonal antibody against Ser235/236 of the human protein (at 1:5,000; Cell Signaling, Cat#: 4858), followed by a secondary antibody (at 1:5,000; ThermoFisher; Cat#: 31466). To detect phosphorylated Sch9, we used an antibody described previously (Kingsbury et al, 2015), and generously given to us by Dr. Cardenas‐Corona. The anti‐Sch9‐pT737 antibody was used at a 1:2,000 dilution, followed by a secondary antibody (at 1:5,000; ThermoFisher; Cat#: 31466). Imaging and quantification were performed as described previously (Blank et al, 2017, 2020; Maitra et al, 2020, 2022). Signal intensities in the cell cycle (see Fig 5A) are shown as Log2‐transformed relative abundance ratios, as described above (Spellman et al, 1998).
PTH‐based amino acid analysis
The HPLC‐based measurements of PTH‐derivatized amino acid levels was taken at the Protein Chemistry Laboratory of the Department of Biochemistry and Biophysics, as described previously (He et al, 2014; Maitra et al, 2020).
Steady‐state metabolite profiling
The untargeted, primary metabolite, and biogenic amine analyses were performed at the NIH‐funded West Coast Metabolomics Center at the University of California at Davis, according to their established mass spectrometry protocols, from 1‐2E+07 cells, as described previously (Blank et al, 2020; Maitra et al, 2020, 2022). Primary metabolites were measured with GC‐TOF MS, while biogenic amines with HILIC‐QTOF MS/MS. The raw data for the primary metabolite measurements are in Dataset EV2. The raw data for the biogenic amine measurements are in Dataset EV3. To identify significant differences in the comparisons among the different strains, we used the robust bootstrap ANOVA, as described above. The input values we used were first scaled‐normalized for input intensities per sample. Detected species that could not be assigned to any compound were excluded from the analysis.
Author contributions
Heidi M Blank: Formal analysis; investigation; writing – original draft; writing – review and editing. Carsten Reuse: Data curation; formal analysis; funding acquisition; investigation; writing – original draft; writing – review and editing. Kerstin Schmidt‐Hohagen: Investigation; writing – review and editing. Staci E Hammer: Investigation; writing – review and editing. Karsten Hiller: Conceptualization; resources; data curation; software; supervision; funding acquisition; methodology; project administration; writing – review and editing. Michael Polymenis: Conceptualization; resources; data curation; formal analysis; supervision; funding acquisition; investigation; visualization; writing – original draft; project administration; writing – review and editing.
Disclosure and competing interests statement
The authors declare that they have no conflict of interest.
Supporting information
Appendix S1
Expanded View Figures PDF
Dataset EV1
Dataset EV2
Dataset EV3
Source Data for Expanded View and Appendix
PDF+
Source Data for Figure 1
Source Data for Figure 2
Source Data for Figure 3
Source Data for Figure 4
Source Data for Figure 5
Acknowledgments
We thank Maria Cardenas‐Corona (NIH) for reagents. This work was supported by the National Institutes of Health (NIH, grant R01 GM123139) and by the German Research Foundation (DFG, Project‐ID 34509606—TRR 51).
EMBO reports (2023) 24: e57372
Contributor Information
Karsten Hiller, Email: karsten.hiller@tu-bs.de.
Michael Polymenis, Email: michael.polymenis@ag.tamu.edu.
Data availability
Strains are available upon request. The authors affirm that all data necessary for confirming the conclusions of the article are present within the article, figures, and tables. The isotope tracing mass spectrometry datasets produced in this study are available in the following database: doi.org/10.24355/dbbs.084‐202306151052‐0.
References
- Ahn E, Kumar P, Mukha D, Tzur A, Shlomi T (2017) Temporal fluxomics reveals oscillations in TCA cycle flux throughout the mammalian cell cycle. Mol Syst Biol 13: 953 [DOI] [PMC free article] [PubMed] [Google Scholar]
- Albers MW, Williams RT, Brown EJ, Tanaka A, Hall FL, Schreiber SL (1993) FKBP‐rapamycin inhibits a cyclin‐dependent kinase activity and a cyclin D1‐Cdk association in early G1 of an osteosarcoma cell line. J Biol Chem 268: 22825–22829 [PubMed] [Google Scholar]
- Albuquerque CP, Smolka MB, Payne SH, Bafna V, Eng J, Zhou H (2008) A multidimensional chromatography technology for in‐depth phosphoproteome analysis. Mol Cell Proteomics 7: 1389–1396 [DOI] [PMC free article] [PubMed] [Google Scholar]
- Atilla‐Gokcumen GE, Muro E, Relat‐Goberna J, Sasse S, Bedigian A, Coughlin ML, Garcia‐Manyes S, Eggert US (2014) Dividing cells regulate their lipid composition and localization. Cell 156: 428–439 [DOI] [PMC free article] [PubMed] [Google Scholar]
- Barbet NC, Schneider U, Helliwell SB, Stansfield I, Tuite MF, Hall MN (1996) TOR controls translation initiation and early G1 progression in yeast. Mol Biol Cell 7: 25–42 [DOI] [PMC free article] [PubMed] [Google Scholar]
- Blank HM, Perez R, He C, Maitra N, Metz R, Hill J, Lin Y, Johnson CD, Bankaitis VA, Kennedy BK et al (2017) Translational control of lipogenic enzymes in the cell cycle of synchronous, growing yeast cells. EMBO J 36: 487–502 [DOI] [PMC free article] [PubMed] [Google Scholar]
- Blank HM, Papoulas O, Maitra N, Garge R, Kennedy BK, Schilling B, Marcotte EM, Polymenis M (2020) Abundances of transcripts, proteins, and metabolites in the cell cycle of budding yeast reveal coordinate control of lipid metabolism. Mol Biol Cell 31: 1069–1084 [DOI] [PMC free article] [PubMed] [Google Scholar]
- Chong J, Yamamoto M, Xia J (2019) MetaboAnalystR 2.0: from raw spectra to biological insights. Metabolites 9: 57 [DOI] [PMC free article] [PubMed] [Google Scholar]
- Creanor J, Mitchison J (1979) Reduction of perturbations in leucine incorporation in synchronous cultures of Schizosaccharomyces pombe made by elutriation. J Gen Microbiol 112: 385–388 [Google Scholar]
- Creanor J, Elliott SG, Bisset YC, Mitchison JM (1983) Absence of step changes in activity of certain enzymes during the cell cycle of budding and fission yeasts in synchronous cultures. J Cell Sci 61: 339–349 [DOI] [PubMed] [Google Scholar]
- De Virgilio C, Loewith R (2006) The TOR signalling network from yeast to man. Int J Biochem Cell Biol 38: 1476–1481 [DOI] [PubMed] [Google Scholar]
- Eden A, Simchen G, Benvenisty N (1996) Two yeast homologs of ECA39, a target for c‐Myc regulation, code for cytosolic and mitochondrial branched‐chain amino acid aminotransferases. J Biol Chem 271: 20242–20245 [DOI] [PubMed] [Google Scholar]
- Elliott SG, McLaughlin CS (1978) Rate of macromolecular synthesis through the cell cycle of the yeast Saccharomyces cerevisiae. Proc Natl Acad Sci USA 75: 4384–4388 [DOI] [PMC free article] [PubMed] [Google Scholar]
- Ewald JC, Kuehne A, Zamboni N, Skotheim JM (2016) The yeast cyclin‐dependent kinase routes carbon fluxes to fuel cell cycle progression. Mol Cell 62: 532–545 [DOI] [PMC free article] [PubMed] [Google Scholar]
- Frankovsky J, Keresztesová B, Bellová J, Kunová N, Čanigová N, Hanakova K, Bauer JA, Ondrovičová G, Lukáčová V, Siváková B et al (2021) The yeast mitochondrial succinylome: implications for regulation of mitochondrial nucleoids. J Biol Chem 297: 101155 [DOI] [PMC free article] [PubMed] [Google Scholar]
- González A, Shimobayashi M, Eisenberg T, Merle DA, Pendl T, Hall MN, Moustafa T (2015) TORC1 promotes phosphorylation of ribosomal protein S6 via the AGC kinase Ypk3 in Saccharomyces cerevisiae . PLoS One 10: e0120250 [DOI] [PMC free article] [PubMed] [Google Scholar]
- Guerra P, Vuillemenot L‐APE, van Oppen YB, Been M, Milias‐Argeitis A (2022) TORC1 and PKA activity towards ribosome biogenesis oscillates in synchrony with the budding yeast cell cycle. J Cell Sci 135: jcs260378 [DOI] [PMC free article] [PubMed] [Google Scholar]
- Hartwell LH, Unger MW (1977) Unequal division in Saccharomyces cerevisiae and its implications for the control of cell division. J Cell Biol 75: 422–435 [DOI] [PMC free article] [PubMed] [Google Scholar]
- Hattori A, Tsunoda M, Konuma T, Kobayashi M, Nagy T, Glushka J, Tayyari F, McSkimming D, Kannan N, Tojo A et al (2017) Cancer progression by reprogrammed BCAA metabolism in myeloid leukaemia. Nature 545: 500–504 [DOI] [PMC free article] [PubMed] [Google Scholar]
- He C, Tsuchiyama SK, Nguyen QT, Plyusnina EN, Terrill SR, Sahibzada S, Patel B, Faulkner AR, Shaposhnikov MV, Tian R et al (2014) Enhanced longevity by ibuprofen, conserved in multiple species, occurs in yeast through inhibition of tryptophan import. PLoS Genet 10: e1004860 [DOI] [PMC free article] [PubMed] [Google Scholar]
- Heitman J, Movva NR, Hall MN (1991) Targets for cell cycle arrest by the immunosuppressant rapamycin in yeast. Science 253: 905–909 [DOI] [PubMed] [Google Scholar]
- Henriksen P, Wagner SA, Weinert BT, Sharma S, Bacinskaja G, Rehman M, Juffer AH, Walther TC, Lisby M, Choudhary C (2012) Proteome‐wide analysis of lysine acetylation suggests its broad regulatory scope in Saccharomyces cerevisiae. Mol Cell Proteomics 11: 1510–1522 [DOI] [PMC free article] [PubMed] [Google Scholar]
- Hiller K, Hangebrauk J, Jäger C, Spura J, Schreiber K, Schomburg D (2009) MetaboliteDetector: comprehensive analysis tool for targeted and nontargeted GC/MS based metabolome analysis. Anal Chem 81: 3429–3439 [DOI] [PubMed] [Google Scholar]
- Hoose SA, Rawlings JA, Kelly MM, Leitch MC, Ababneh QO, Robles JP, Taylor D, Hoover EM, Hailu B, McEnery KA et al (2012) A systematic analysis of cell cycle regulators in yeast reveals that most factors act independently of cell size to control initiation of division. PLoS Genet 8: e1002590 [DOI] [PMC free article] [PubMed] [Google Scholar]
- Hughes Hallett JE, Luo X, Capaldi AP (2014) State transitions in the TORC1 signaling pathway and information processing in Saccharomyces cerevisiae . Genetics 198: 773–786 [DOI] [PMC free article] [PubMed] [Google Scholar]
- Jang C, Chen L, Rabinowitz JD (2018) Metabolomics and isotope tracing. Cell 173: 822–837 [DOI] [PMC free article] [PubMed] [Google Scholar]
- Johnston GC, Pringle JR, Hartwell LH (1977) Coordination of growth with cell division in the yeast Saccharomyces cerevisiae . Exp Cell Res 105: 79–98 [DOI] [PubMed] [Google Scholar]
- Jüppner J, Mubeen U, Leisse A, Caldana C, Brust H, Steup M, Herrmann M, Steinhauser D, Giavalisco P (2017) Dynamics of lipids and metabolites during the cell cycle of Chlamydomonas reinhardtii . Plant J Cell Mol Biol 92: 331–343 [DOI] [PubMed] [Google Scholar]
- Kaiser C, Michaelis S, Mitchell A, Laboratory CSH (1994) Methods in yeast genetics: a Cold Spring Harbor Laboratory course manual, 1994 edn. Cold Spring Harbor, NY: Cold Spring Harbor Laboratory Press; [Google Scholar]
- Kim W, Jang Y‐G, Yang J, Chung J (2017) Spatial activation of TORC1 is regulated by Hedgehog and E2F1 signaling in the Drosophila eye. Dev Cell 42: 363–375.e4 [DOI] [PubMed] [Google Scholar]
- Kingsbury JM, Sen ND, Cardenas ME (2015) Branched‐chain aminotransferases control TORC1 signaling in Saccharomyces cerevisiae . PLoS Genet 11: e1005714 [DOI] [PMC free article] [PubMed] [Google Scholar]
- Kispal G, Steiner H, Court DA, Rolinski B, Lill R (1996) Mitochondrial and cytosolic branched‐chain amino acid transaminases from yeast, homologs of the myc oncogene‐regulated Eca39 protein. J Biol Chem 271: 24458–24464 [DOI] [PubMed] [Google Scholar]
- Koonthongkaew J, Toyokawa Y, Ohashi M, Large CRL, Dunham MJ, Takagi H (2020) Effect of the Ala234Asp replacement in mitochondrial branched‐chain amino acid aminotransferase on the production of BCAAs and fusel alcohols in yeast. Appl Microbiol Biotechnol 104: 7915–7925 [DOI] [PubMed] [Google Scholar]
- Kurat CF, Wolinski H, Petschnigg J, Kaluarachchi S, Andrews B, Natter K, Kohlwein SD (2009) Cdk1/Cdc28‐dependent activation of the major triacylglycerol lipase Tgl4 in yeast links lipolysis to cell‐cycle progression. Mol Cell 33: 53–63 [DOI] [PubMed] [Google Scholar]
- Lanz MC, Yugandhar K, Gupta S, Sanford EJ, Faça VM, Vega S, Joiner AMN, Fromme JC, Yu H, Smolka MB (2021) In‐depth and 3‐dimensional exploration of the budding yeast phosphoproteome. EMBO Rep 22: e51121 [DOI] [PMC free article] [PubMed] [Google Scholar]
- Loewith R, Hall MN (2011) Target of rapamycin (TOR) in nutrient signaling and growth control. Genetics 189: 1177–1201 [DOI] [PMC free article] [PubMed] [Google Scholar]
- Longtine MS, McKenzie A 3rd, Demarini DJ, Shah NG, Wach A, Brachat A, Philippsen P, Pringle JR (1998) Additional modules for versatile and economical PCR‐based gene deletion and modification in Saccharomyces cerevisiae . Yeast 14: 953–961 [DOI] [PubMed] [Google Scholar]
- Mair P, Wilcox R (2020) Robust statistical methods in R using the WRS2 package. Behav Res Methods 52: 464–488 [DOI] [PubMed] [Google Scholar]
- Maitra N, He C, Blank HM, Tsuchiya M, Schilling B, Kaeberlein M, Aramayo R, Kennedy BK, Polymenis M (2020) Translational control of one‐carbon metabolism underpins ribosomal protein phenotypes in cell division and longevity. Elife 9: e53127 [DOI] [PMC free article] [PubMed] [Google Scholar]
- Maitra N, Hammer S, Kjerfve C, Bankaitis VA, Polymenis M (2022) Translational control of lipogenesis links protein synthesis and phosphoinositide signaling with nuclear division in Saccharomyces cerevisiae . Genetics 220: iyab171 [DOI] [PMC free article] [PubMed] [Google Scholar]
- Mirisola MG, Taormina G, Fabrizio P, Wei M, Hu J, Longo VD (2014) Serine‐ and threonine/valine‐dependent activation of PDK and Tor orthologs converge on Sch9 to promote aging. PLoS Genet 10: e1004113 [DOI] [PMC free article] [PubMed] [Google Scholar]
- Moreno‐Torres M, Jaquenoud M, De Virgilio C (2015) TORC1 controls G1‐S cell cycle transition in yeast via Mpk1 and the greatwall kinase pathway. Nat Commun 6: 8256 [DOI] [PMC free article] [PubMed] [Google Scholar]
- Pedruzzi I, Dubouloz F, Cameroni E, Wanke V, Roosen J, Winderickx J, De Virgilio C (2003) TOR and PKA signaling pathways converge on the protein kinase Rim15 to control entry into G0. Mol Cell 12: 1607–1613 [DOI] [PubMed] [Google Scholar]
- Polymenis M (2022) Two from one: a short introduction to cell division mechanisms. Hoboken, NJ: John Wiley & Sons; [Google Scholar]
- Pringle JR, Hartwell LH (1981) The Saccharomyces cerevisiae cell cycle. In The molecular and cellular biology of the yeast Saccharomyces, Strathern JD, Jones EW, Broach JR (eds), pp 97–142. Cold Spring Harbor, NY: Cold Spring Harbor Laboratory Press; [Google Scholar]
- Prohl C, Kispal G, Lill R (2000) Branched‐chain‐amino‐acid transaminases of yeast Saccharomyces cerevisiae . Methods Enzymol 324: 365–375 [DOI] [PubMed] [Google Scholar]
- Romero‐Pozuelo J, Demetriades C, Schroeder P, Teleman AA (2017) CycD/Cdk4 and discontinuities in Dpp signaling activate TORC1 in the Drosophila wing disc. Dev Cell 42: 376–387.e5 [DOI] [PubMed] [Google Scholar]
- Sanchez‐Alvarez M, Zhang Q, Finger F, Wakelam MJO, Bakal C (2015) Cell cycle progression is an essential regulatory component of phospholipid metabolism and membrane homeostasis. Open Biol 5: 150093 [DOI] [PMC free article] [PubMed] [Google Scholar]
- Scaglia N, Tyekucheva S, Zadra G, Photopoulos C, Loda M (2014) De novo fatty acid synthesis at the mitotic exit is required to complete cellular division. Cell Cycle 13: 859–868 [DOI] [PMC free article] [PubMed] [Google Scholar]
- Schuldiner O, Eden A, Ben‐Yosef T, Yanuka O, Simchen G, Benvenisty N (1996) ECA39, a conserved gene regulated by c‐Myc in mice, is involved in G1/S cell cycle regulation in yeast. Proc Natl Acad Sci USA 93: 7143–7148 [DOI] [PMC free article] [PubMed] [Google Scholar]
- Soma S, Yang K, Morales MI, Polymenis M (2014) Multiple metabolic requirements for size homeostasis and initiation of division in Saccharomyces cerevisiae . Microb Cell 1: 256–266 [DOI] [PMC free article] [PubMed] [Google Scholar]
- Spellman PT, Sherlock G, Zhang MQ, Iyer VR, Anders K, Eisen MB, Brown PO, Botstein D, Futcher B (1998) Comprehensive identification of cell cycle‐regulated genes of the yeast Saccharomyces cerevisiae by microarray hybridization. Mol Biol Cell 9: 3273–3297 [DOI] [PMC free article] [PubMed] [Google Scholar]
- Stracka D, Jozefczuk S, Rudroff F, Sauer U, Hall MN (2014) Nitrogen source activates TOR (target of rapamycin) complex 1 via glutamine and independently of Gtr/Rag proteins. J Biol Chem 289: 25010–25020 [DOI] [PMC free article] [PubMed] [Google Scholar]
- Takhaveev V, Özsezen S, Smith EN, Zylstra A, Chaillet ML, Chen H, Papagiannakis A, Milias‐Argeitis A, Heinemann M (2023) Temporal segregation of biosynthetic processes is responsible for metabolic oscillations during the budding yeast cell cycle. Nat Metab 5: 294–313 [DOI] [PMC free article] [PubMed] [Google Scholar]
- Takpho N, Watanabe D, Takagi H (2018) Valine biosynthesis in Saccharomyces cerevisiae is regulated by the mitochondrial branched‐chain amino acid aminotransferase Bat1. Microb Cell 5: 293–299 [DOI] [PMC free article] [PubMed] [Google Scholar]
- Wallace RL, Lu E, Luo X, Capaldi AP (2022) Ait1 regulates TORC1 signaling and localization in budding yeast. Elife 11: e68773 [DOI] [PMC free article] [PubMed] [Google Scholar]
- Weindl D, Wegner A, Hiller K (2015) Non‐targeted tracer fate detection. Methods Enzymol 561: 277–302 [DOI] [PubMed] [Google Scholar]
- Weinert BT, Schölz C, Wagner SA, Iesmantavicius V, Su D, Daniel JA, Choudhary C (2013) Lysine succinylation is a frequently occurring modification in prokaryotes and eukaryotes and extensively overlaps with acetylation. Cell Rep 4: 842–851 [DOI] [PubMed] [Google Scholar]
- Wilcox RR (2011) Introduction to robust estimation and hypothesis testing. Cambridge, MA: Academic Press; [Google Scholar]
- Zhou X, Li W, Liu Y, Amon A (2021) Cross‐compartment signal propagation in the mitotic exit network. Elife 10: e63645 [DOI] [PMC free article] [PubMed] [Google Scholar]