

Abstract
The ability of stem cells to switch between quiescent and proliferative states is crucial for maintaining tissue homeostasis and regeneration. Drosophila quiescent neural stem cells (qNSCs) extend a primary protrusion that is enriched in acentrosomal microtubules and can be regenerated upon injury. Arf1 promotes microtubule growth, reactivation (exit from quiescence), and regeneration of qNSC protrusions upon injury. However, how Arf1 is regulated in qNSCs remains elusive. Here, we show that the microtubule minus‐end binding protein Patronin/CAMSAP promotes acentrosomal microtubule growth and quiescent NSC reactivation. Patronin is important for the localization of Arf1 at Golgi and physically associates with Arf1, preferentially with its GDP‐bound form. Patronin is also required for the regeneration of qNSC protrusion, likely via the regulation of microtubule growth. Finally, Patronin functions upstream of Arf1 and its effector Msps/XMAP215 to target the cell adhesion molecule E‐cadherin to NSC‐neuropil contact sites during NSC reactivation. Our findings reveal a novel link between Patronin/CAMSAP and Arf1 in the regulation of microtubule growth and NSC reactivation. A similar mechanism might apply to various microtubule‐dependent systems in mammals.
Keywords: Golgi, neural stem cells, Patronin, reactivation, regeneration
Subject Categories: Cell Adhesion, Polarity & Cytoskeleton; Neuroscience; Stem Cells & Regenerative Medicine
Drosophila Patronin promotes reactivation of quiescent neural stem cells (qNSCs) by regulating acentrosomal microtubule growth. It functions upstream of the Golgi‐resident small GTPase Arf1, and it is required for regeneration of the primary protrusion of qNSCs upon injury.
Introduction
Neural stem cells (NSCs) are important for the development, regeneration, and repair of the nervous system. The ability of stem cells to switch between quiescent and proliferative states is crucial in maintaining tissue homeostasis. Most NSCs in the mammalian adult brain exist in a quiescent or mitotically dormant state (Morshead et al, 1994; Doetsch et al, 1999). Quiescent NSCs can re‐enter the cell cycle (reactivate) to generate new neurons in response to various physiological stimuli, such as injury, the presence of nutrients, and physical exercise (Fabel & Kempermann, 2008). Conversely, stress, anxiety, and old age greatly reduce the proliferation capacity of NSCs (Lucassen et al, 2010). Dysregulation of NSC quiescence and reactivation severely affects tissue homeostasis which can be associated with neurogenesis defects and neurodevelopmental disorders (Cloetta et al, 2013; Baser et al, 2017).
Drosophila larval brain NSCs, also known as neuroblasts, have emerged as a powerful model to understand the mechanisms underlying NSC quiescence and reactivation in vivo (Ding et al, 2020; Otsuki & Brand, 2020). At the end of embryogenesis, Drosophila NSCs in the central nervous system shrink in size and enter quiescence (Truman & Bate, 1988; Ito & Hotta, 1992; Britton & Edgar, 1998). The quiescence entry is regulated by a combined function of temporal identity factors, homeobox genes, and a homeodomain transcription factor Prospero (Isshiki et al, 2001; Tsuji et al, 2008; Lai & Doe, 2014; Otsuki & Brand, 2018). After about 24 h after larval hatching (ALH), quiescent NSCs re‐enter the cell cycle to resume neurogenesis, in response to the presence of dietary amino acids (Truman & Bate, 1988; Ito & Hotta, 1992; Britton & Edgar, 1998; Fig 1A). The reactivation of quiescent NSCs depends on the activation of an evolutionarily conserved insulin/IGF signaling pathway in NSCs by insulin/IGF‐like peptides Dilp2 and Dilp6 secreted from the blood–brain barrier glia (Chell & Brand, 2010; Sousa‐Nunes et al, 2011; Speder & Brand, 2014). Interestingly, mammalian insulin‐like growth factor‐1 (IGF‐1) and IGF‐2 promote NSC proliferation (Arsenijevic et al, 2001; Yan et al, 2006; Mairet‐Coello et al, 2009), and human IGF1R mutations are associated with microcephaly, a neurodevelopmental disorder (Juanes et al, 2015). In the absence of nutrition, the Hippo pathway maintains the quiescence of NSCs, while in the presence of nutrition it is negatively regulated by an E3 ubiquitin ligase CRL4Mahj (Ding et al, 2016; Poon et al, 2016; Ly et al, 2019). NSC reactivation also requires intrinsic mechanisms involving the transcription factor Prospero, spindle matrix proteins, Hsp83/Hsp90, and striatin‐interacting phosphatase and kinase (STRIPAK) family proteins (Lai & Doe, 2014; Li et al, 2017; Huang & Wang, 2018; Gil‐Ranedo et al, 2019).
Figure 1. The microtubule minus‐end binding protein Patronin is required for quiescent NSC reactivation.
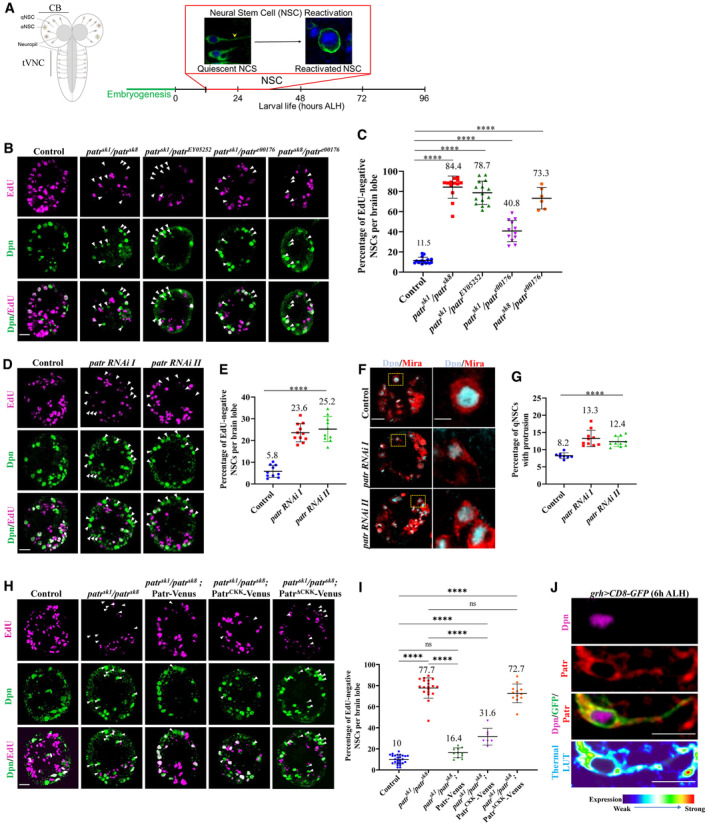
- Diagrammatic representation of Drosophila quiescent NSC reactivation time line.
- Larval brains at 24 h ALH from control, patr sk1 /patr sk8 , patr sk1 /patr EY05252 , patr sk1 /patr e00176 and patr sk8 /patr e00176 were analyzed for EdU incorporation. NSCs were marked by Dpn.
- Quantification graph of EdU‐negative NSCs per brain lobe (BL) for genotypes in (B). Control, 11.5%, average number of Dpn + cells, 82.1, n = 16 BL; patr sk1 /patr sk8 , 84.4%, average number of Dpn + cells, 72, n = 13 BL; patr sk1 /patr EY05252 , 78.7%, average number of Dpn + cells, 74.8, n = 15 BL; patr sk1 /patr e00176 , 40.8%, average number of Dpn + cells, 80, n = 12 BL; patrsk 8 /patr e00176 , 73.3%, average number of Dpn + cells, 85.2, n = 6 BL.
- Larval brains at 24 h ALH from control (grh‐Gal4; UAS‐dicer2/UAS‐β‐Gal RNAi), patr RNAi I (#18462 Ra‐1, NIG) and patr RNAi II (VDRC 108927KK) controlled under grh‐Gal4 were analyzed for EdU incorporation. NSCs were marked by Dpn.
- Quantification graph of EdU‐negative NSCs per brain lobe for genotypes in (D). Control, 5.8%, n = 10 BL; patr RNAi I, 23.6%, n = 11 BL and patr RNAi II, 25.2%, n = 10 BL.
- Larval brains at 24 h ALH from control (grh‐Gal4; UAS‐dicer2/UAS‐β‐Gal RNAi), patr RNAi I (#18462 Ra‐1, NIG) and patr RNAi II (VDRC 108927KK) controlled under grh‐Gal4 were analyzed for cellular extensions labeled by Miranda. NSCs were marked by Dpn and Mira.
- Quantification graph of quiescent NSCs with protrusions per brain lobe for genotypes in (F). Control, 8.2%, n = 8 BL; patr RNAi I, 13.3%, n = 10 BL and patr RNAi II, 12.4%, n = 10 BL.
- Larval brains at 24 h ALH from the control (UAS‐CD8‐GFP), patr sk1 /patr sk8 , patr sk1 /patr sk8 ; UAS‐Patr‐Venus, patr sk1 /patr sk8 ; UAS‐Patr CKK ‐Venus and patr sk1 /patr sk8 ; UAS‐Patr ΔCKK ‐Venus driven by grh‐Gal4 were analyzed for EdU incorporation. NSCs were marked by Dpn.
- Quantification graph of EdU‐negative NSCs per brain lobe for genotypes in (H). Control, 10.4%, n = 13; patr sk1 /patr sk8 , 78.3%, n = 11; patr sk1 /patr sk8 ; UAS‐Patr‐Venus, 16.4%, n = 11 BL, patr sk1 /patr sk8 ; UAS‐Patr CKK ‐Venus, 31.6%, n = 7 BL and patr sk1 /patr sk8 ; UAS‐Patr ΔCKK ‐Venus, 72.7%, n = 12.
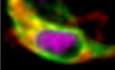
- A quiescent NSC expressing grh > CD8‐GFP at 6 h ALH were labeled with antibodies against Dpn, Patronin, and GFP. The panel at the bottom shows the enrichment of Patronin at the apical and PIS regions of the quiescent NSC by using a thermal LUT.
Data information: EdU incorporation was analyzed at 24‐h ALH by feeding larvae at 20 h ALH with food supplemented with 0.2 mM EdU for 4 h. White arrowheads point to NSCs without EdU incorporation. Data are presented as mean ± SD. In (C, E, G, and I), statistical significance was determined by one‐way ANOVA with multiple comparisons. ns, nonsignificant, ***P < 0.001 and ****P < 0.0001. Scale bars: 10 μm (B, D, F, and H) and 5 μm (F and J) for single quiescent NSC.
Source data are available online for this figure.
One distinct morphological feature of quiescent NSCs in Drosophila is their cellular extension that is attached to the cell body and extends toward the neuropil (Truman & Bate, 1988; Chell & Brand, 2010). These cellular protrusions of quiescent NSCs are thought to be removed presumably via retraction prior to cell cycle re‐entry (Chell & Brand, 2010). However, in a recent study, the protrusion was shown to be persistent in the division of reactivating NSCs followed by its inheritance by the Ganglion mother cell (GMC) daughter (Bostock et al, 2020). Although the primary protrusion is believed to be a hallmark of quiescent NSCs, the exact structure and function in NSC reactivation are poorly studied. Recent work from our lab reported that these cellular extensions of quiescent NSCs are microtubule‐enriched structures; microtubules within the cellular protrusion are oriented predominantly plus‐end‐out, similar to that seen in axons of neurons (Li et al, 2017; Deng et al, 2021). Interestingly, the centrosomes, the major microtubule organizing center (MTOC) in most other cell types, are immature and lack microtubule nucleation activity in quiescent NSCs from newly hatched larvae (Deng et al, 2021).
The Golgi apparatus has emerged as potential acentrosomal MTOCs in several cell types, such as neurons, epithelial, and muscle cells (De Camilli et al, 1986; Horton et al, 2005; Ori‐McKenney et al, 2012; Zhou et al, 2014; Yang & Wildonger, 2020). We showed recently that Golgi acts as the acentrosomal MTOC in quiescent NSCs (preprint: Gujar et al, 2022; Gujar et al, 2023). Remarkably, quiescent NSC cellular protrusions can be regenerated upon injury by laser severing, and this regeneration relies on Golgi and microtubule growth in quiescent NSCs (preprint: Gujar et al, 2022; Gujar et al, 2023). Two critical Golgi proteins, Arf1 and its GEF Sec71, are required for NSC reactivation and regeneration via the regulation of microtubule growth (preprint: Gujar et al, 2022; Gujar et al, 2023). Furthermore, Mini spindles (Msps)/MAP215, an XMAP215/ch‐TOG family protein and a key microtubule polymerase that regulates acentrosomal microtubule growth in quiescent NSCs (Deng et al, 2021), functions downstream of Arf1 as its new effector in reactivation and regeneration of quiescent NSCs (preprint: Gujar et al, 2022; Gujar et al, 2023). However, how Arf1 is regulated in quiescent NSCs remains elusive.
The CAMSAP/Patronin family of proteins have been identified as conserved microtubule minus‐end‐binding proteins and are essential for the stabilization and formation of non‐centrosomal microtubules by protecting the minus‐end from depolymerizing effects (Hendershott & Vale, 2014; Martin & Akhmanova, 2018). Mammalian CAMSAP2 and CAMSAP3 recognize and decorate growing microtubule minus ends, prevent microtubule depolymerization and serve as a source of microtubule plus‐end outgrowth (Tanaka et al, 2012; Jiang et al, 2014). In cultured hippocampal neurons, the reduction of CAMSAP2 destabilizes microtubules and reduces dendrite complexity (Yau et al, 2014). In Caenorhabditis elegans, Patronin/PTRN‐1 is required for the maintenance of normal neuronal morphology, neuronal microtubule stability, and axon regeneration (Chuang et al, 2014; Marcette et al, 2014; Richardson et al, 2014). In Drosophila fat body cells, the perinuclear MTOC is anchored by Msp300/Nesprin at the cytoplasmic surface of the nucleus, which then recruits Patronin/CAMSAP, to further recruit the microtubule polymerase Msps/XMAP215 to assemble non‐centrosomal microtubules and does so independently of the widespread microtubule nucleation factor γ‐tubulin (Zheng et al, 2020). Furthermore, Patronin plays an important role in governing minus‐end‐out orientation of dendritic microtubules in Drosophila ddaC sensory neurons to facilitate dendrite pruning (Martin & Akhmanova, 2018; Feng et al, 2019; Wang et al, 2019). However, the role of Patronin in NSC reactivation and regeneration in Drosophila is not established.
In this study, we have demonstrated, for the first time, that Patronin is important for the reactivation and regeneration of quiescent NSCs. We show that Patronin is required for the proper localization and function of critical Golgi proteins Arf1 and Sec71/Arf1GEF, to regulate acentrosomal microtubule growth in the cellular protrusion of quiescent NSCs. Moreover, Patronin physically associates with Arf1, preferentially with its GDP‐bound form. Finally, genetic analyses support our model that Patronin functions upstream of Arf1 in microtubule growth, NSC reactivation, and regeneration upon injury.
Results
The microtubule minus‐end binding protein Patronin is critical for NSC reactivation
As microtubule regulators are involved in quiescent NSC reactivation (Deng et al, 2021; preprint: Gujar et al, 2022; Gujar et al, 2023), we investigated whether Patronin plays a role in NSC reactivation. At 24 h ALH, the vast majority of wild‐type NSCs were reactivated and incorporated with EdU and only 11.5% of NSCs were quiescent and negative for EdU (Fig 1A–C). We examined various loss‐of‐function alleles of patronin including two protein null alleles patr sk1 and patr sk8 , a strong hypomorphic allele patr EY052052 , and a PiggyBac transposon allele patr e00176 . Trans‐heterozygous patronin animals survived to larval stages and were used for all following analyses. At 24 h ALH, 84.4% of NSCs in patr sk1 /patr sk8 failed to incorporate EdU, compared with only 11.5% of NSCs without EdU incorporation in wild type (Fig 1B and C), suggesting a severe reactivation defect. Similarly, all other trans‐heterozygotes of patronin mutants also displayed prominent NSC delayed reactivation phenotypes (Fig 1B and C). patronin trans‐heterozygote mutants still displayed prominent phenotypes in reactivation at both 36 and 48 h ALH, weaker phenotypes at 72 h ALH, and nearly no phenotype at 96 h ALH (Fig EV1A–C). These data suggest a delay in the reactivation of quiescent NSCs, rather than a blockage of reactivation. Moreover, the percentage of quiescent NSCs that were EdU‐negative was dramatically increased to 23.6% and 25.2% upon patronin knockdown in NSCs by two independent patronin RNAi lines (Fig 1D and E). To further understand whether knockdown of patronin exhibits defective NSC reactivation, we calculated the percentage of quiescent NSCs that still extend their cellular process, which is the hallmark of quiescent NSCs. Using Miranda (Mira) as a marker for the cellular extensions and Deadpan (Dpn) as an NSC nuclear marker, we found that there was a significant percentage of Miranda (Mira)‐positive NSCs that still extended their cellular processes upon patronin RNAi knockdown (Fig 1F and G), suggesting a delay of NSC reactivation. Moreover, the EdU incorporation defects in patr sk1 /patr sk8 were nearly fully restored by overexpressing Patronin‐Venus (Fig 1H and I). These observations indicate that Patronin is essential for NSC reactivation. Patronin contains a calponin homology (CH) domain at its amino terminus, three predicted coiled‐coil (CC) domains at its central region, and a CAMSAP/KIAA1078/KIA1543 (CKK) domain, which is the microtubule‐binding domain, at its carboxyl‐terminus (Fig EV1D; Baines et al, 2009). Overexpression of the CKK domain of Patronin significantly rescued the reactivation defects observed in patr sk1 /patr sk8 NSCs (Fig 1H and I). In contrast, Patronin lacking the CKK domain did not rescue the delayed reactivation phenotype caused by loss of patronin (Fig 1H and I). Overexpression of Patronin (UAS‐Patronin and UAS‐Patronin‐Venus) did not cause premature NSC reactivation at 6 h ALH (Fig EV1E and F). Therefore, Patronin acts intrinsically in NSCs to promote their reactivation, which depends on its microtubule‐binding CKK domain.
Figure EV1. Patronin is required for quiescent NSC reactivation.
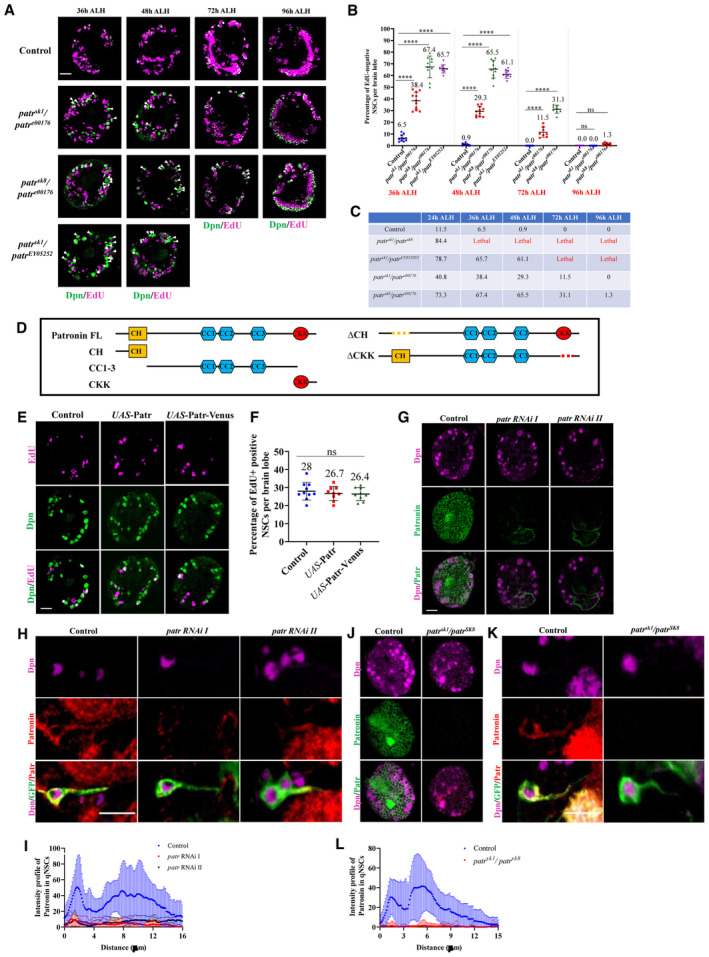
- Time course analysis of larval brains at 36 h, 48 h, 72 h, and 96 h ALH from control, patr sk1 /patr e00176 , patr sk8 /patr e00176 , and patr sk1 /patr EY05252 were analyzed for EdU incorporation. NSCs were marked by Dpn.
- Quantification graph of EdU‐positive NSCs per brain lobe for genotypes in (A). 36 h ALH, Control, 6.5%, n = 11 BL; patr sk1 /patr e00176 , 38.4%, n = 11 BL, patr sk8 /patr e00176 , 67.4%, n = 10 BL and patr sk1 /patr EY05252 , 65.7%, n = 9 BL. 48 h ALH, Control, 0.9%, n = 10 BL; patr sk1 /patr e00176 , 29.3%, n = 11 BL, patr sk8 /patr e00176 , 65.5%, n = 10 BL and patr sk1 /patr EY05252 , 61.1%, n = 9 BL. 72 h ALH, Control, 0%, n = 12 BL; patr sk1 /patr e00176 , 11.5%, n = 8 BL and patr sk8 /patr e00176 , 31.1%, n = 8 BL. 96 h ALH, Control, 0%, n = 10 BL; patr sk1 /patr e00176 , 0%, n = 10 BL and patr sk8 /patr e00176 , 1.3%, n = 9 BL.
- Tabled analysis of EdU time‐course experiments of larval brains at 24 h, 36 h, 48 h, 72 h, and 96 h ALH from control, patr sk1 /patr sk8 , patr sk1 /patr EY05252 , patr sk1 /patr e00176 , and patr sk8 /patr e00176 .
- A schematic representation of full‐length and truncated Patronin domains. Patronin contains multiple domains: a calponin homology (CH) domain at the N‐terminus, three coiled‐coil (CC) repeats at the central region, and a signature CKK domain at the C‐terminus.
- Larval brains at 6 h ALH from control (grh‐Gal4/UAS‐β‐Gal RNAi), UAS‐Patronin and UAS‐Patronin‐Venus controlled under grh‐Gal4 were analyzed for EdU incorporation. NSCs were marked by Dpn.
- Quantification graph of EdU‐positive NSCs per brain lobe for genotypes in (E). Control, 28%, n = 10 BL; UAS‐Patronin, 26.7%, n = 9 BL and UAS‐Patronin‐Venus, 26.4%, n = 9 BL.
- Larval brains at 24 h ALH from the control (grh‐Gal4, UAS‐Dcr2/ UAS‐β‐Gal RNAi), patr RNAi I (#18462 Ra‐1, NIG), and patr RNAi II (VDRC 108927KK) driven by grh‐Gal4 were labeled with antibodies against Patronin and Dpn.
- Images of single quiescent NSCs from larval brains at 16 h ALH from control (UAS‐mCD8‐GFP; UAS‐Dcr2/ UAS‐β‐Gal RNAi), patr RNAi I (#18462 Ra‐1, NIG) and patr RNAi II (VDRC 108927KK) driven by grh‐Gal4 were labeled with antibodies against Patronin, Dpn and GFP.
- Quantification of Patronin intensity in the primary protrusion of quiescent NSCs in control (n = 13), patr RNAi I (#18462 Ra‐1, NIG; n = 15 quiescent NSCs), and patr RNAi II (VDRC 108927KK; n = 15 quiescent NSCs) in central brain (CB) at 16 h ALH.
- Larval brains at 24 h ALH from the control (yw) and patr sk1 /patr sk8 were labeled with antibodies against Patronin and Dpn.
- Images of single quiescent NSCs from larval brains at 16 h ALH from control (UAS‐mCD8 GFP) and patr sk1 /patr sk8 driven by grh‐Gal4 were labeled with antibodies against Patronin, Dpn, and GFP.
- Quantification of Patronin intensity in the primary protrusion of quiescent NSCs in control (n = 20 quiescent NSCs) and patr sk1 /patr sk8 (n = 32 quiescent NSCs) in central brain (CB) at 16 h ALH.
Data information: EdU incorporation was analyzed at 6 h ALH by feeding larvae at 2 h ALH with food supplemented with 0.2 mM EdU for 4 h for (E‐F) and at 36 h/48 h/72 h/ 96 h ALH by feeding larvae at 32 h/44 h/68 h/92 h ALH with food supplemented with 0.2 mM EdU for 4 h for (A‐C). White arrowheads point to NSCs without EdU incorporation (A). Data are presented as mean ± SD. In (B and F), statistical significance was determined by one‐way ANOVA with multiple comparisons. Ns, non‐significant, ****P < 0.0001. Scale bars: 5 μm for single quiescent NSC (H and K) and 10 μm for whole BL (A, E, G, and J). All replicates were biological.
Source data are available online for this figure.
Patronin is distributed in the cytoplasm including the primary protrusion in quiescent NSCs
To test whether Patronin was expressed in qNSCs, we examined the localization of Patronin in qNSCs at 6 h ALH. In qNSCs with the primary cellular protrusion labeled by CD8‐GFP under the control of grh‐Gal4, we detected the cytoplasmic distribution of Patronin throughout the qNSCs, including the primary cellular protrusion (Fig 1J). This Patronin distribution observed in wild‐type quiescent NSCs is specific, as Patronin was undetectable in patronin sk1 /patronin sk8 NSCs and strongly reduced upon patronin RNAi knockdown at 24 h ALH (Fig EV1G–L).
Patronin is required for acentrosomal microtubule growth in quiescent NSCs
We previously showed acentrosomal microtubule organization in quiescent NSCs (Deng et al, 2021). Since Patronin/CAMSAP family proteins recognize and protect microtubule minus ends (Goodwin & Vale, 2010; Akhmanova & Hoogenraad, 2015), we sought to understand whether Patronin has a role in acentrosomal microtubule growth in quiescent NSCs. Remarkably, at 10 h ALH, the average velocity of EB1‐GFP comets was significantly reduced to 0.13 and 0.14 μm/s in the primary protrusion of quiescent NSCs from two trans‐heterozygote patronin mutants compared to 0.16 in the control (Fig 2A and B, Movies [Link], [Link]). In addition to reduced velocity, the total number of EB1‐GFP comets from two trans‐heterozygote patronin mutants was also dramatically reduced to 0.53 and 0.58 in folds as compared to 1 in the control (Fig 2A and C). In contrast, Patronin depletion did not affect overall microtubule orientation (Appendix Fig S1A). Interestingly, overexpressing full‐length Patronin and the CKK domain of Patronin, but not PatroninΔCKK form, significantly rescued the defects in the number and velocity of EB1‐GFP comets seen in loss of patronin (Fig 2D–F, Movies [Link], [Link]). These data indicate that Patronin is important for acentrosomal microtubule growth in the primary protrusion of quiescent NSCs.
Figure 2. Patronin is required for acentrosomal microtubule assembly in quiescent NSCs.
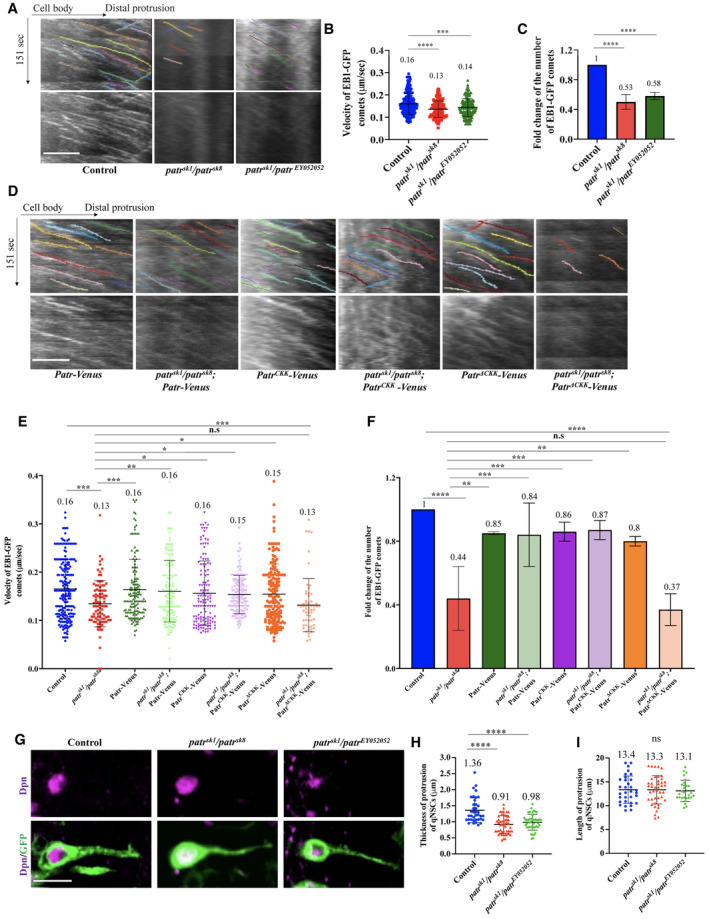
- Kymographs of EB1‐GFP comets movement in the primary protrusion of quiescent NSCs expressing EB1‐GFP under grh‐Gal4 from the control, patr sk1 /patr sk8 , and patr sk1 /patr EY052052 10‐h ALH. The horizontal arrow indicates anterograde movement direction from cell body to the tip of the primary protrusion in quiescent NSCs.
- Quantification graph of velocity of EB1‐GFP comets in the primary protrusion of quiescent NSCs at 10‐h ALH from various genotypes in (A). Control, 0.16 μm/s, n = 288 comets; patr sk1 /patr sk8 , 0.13 μm/s, n = 148 comets; and patr sk1 /patr EY052052 , 0.14 μm/s, n = 168 comets.
- Quantification graph of fold changes of number of EB1‐GFP comets in the primary protrusion of quiescent NSCs 10 h ALH from various genotypes in (A). Control, 1, n = 24 quiescent NSCs, n = 288 comets. patr sk1 /patr sk8 , fold = 0.53, n = 26 quiescent NSCs, n = 148 comets and patr sk1 /patr EY052052 , fold = 0.58, n = 29 quiescent NSCs, n = 168 comets.
- Kymographs of EB1‐GFP comets movement in the primary protrusion of quiescent NSCs expressing EB1‐GFP under grh‐Gal4 from UAS‐Patr‐Venus, patr sk1 /patr sk8 ; UAS‐Patr‐Venus, UAS‐PatrCKK‐Venus, patr sk1 /patr sk8 ; UAS‐PatrCKK‐Venus, UAS‐PatrΔCKK‐Venus and patr sk1 /patr sk8 ; UAS‐PatrΔCKK‐Venus 10 h ALH. The horizontal arrow indicates anterograde movement direction from cell body to the tip of the primary protrusion in quiescent NSCs.
- Quantification graph of velocity of EB1‐GFP comets in the primary protrusion of quiescent NSCs at 10‐h ALH from various genotypes in (D). Control, 0.16 μm/s, n = 213 comets; patr sk1 /patr sk8 , 0.13 μm/s, n = 91 comets UAS‐Patr‐Venus, 0.16 μm/s, n = 148 comets; patr sk1 /patr sk8 ; UAS‐Patr‐Venus, 0.16 μm/s, n = 131 comets; UAS‐PatrCKK‐Venus, 0.16 μm/s, n = 162 comets; patr sk1 /patr sk8 ; UAS‐PatrCKK‐Venus, 0.15 μm/s, n = 188 comets; UAS‐PatrΔCKK‐Venus, 0.15 μm/s, n = 208 comets and patr sk1 /patr sk8 ; UAS‐PatrΔCKK‐Venus, 0.13 μm/s, n = 60 comets.
- Quantification graph of fold changes of number of EB1‐GFP comets in the primary protrusion of quiescent NSCs 10‐h ALH from various genotypes in (D). Control, 1, n = 17 quiescent NSCs, n = 213 comets; patr sk1 /patr sk8 , fold = 0.44, n = 17 quiescent NSCs, n = 91 comets; comets UAS‐Patr‐Venus, fold = 0.85, n = 148 comets, n = 14 quiescent NSCs; patr sk1 /patr sk8 ; UAS‐Patr‐Venus, fold = 0.84, n = 131 comets, n = 18 quiescent NSCs; UAS‐PatrCKK‐Venus, fold = 0.86, n = 162 comets, n = 12 quiescent NSCs; patr sk1 /patr sk8 ; UAS‐PatrCKK‐Venus, fold = 0.87, n = 188 comets, n = 18 quiescent NSCs; UAS‐PatrΔCKK‐Venus, fold = 0.8, n = 208 comets, n = 18 quiescent NSCs and patr sk1 /patr sk8 ; UAS‐PatrΔCKK‐Venus, fold = 0.37, n = 60 comets, n = 16 quiescent NSCs.
- Larval brains at 16‐h ALH from control (grh‐Gal4 > UAS‐CD8‐GFP), patr sk1 /patr sk8 and patr sk1 /patr EY052052 expressing grh > CD8‐GFP were labeled with Dpn and GFP.
- Quantification graph for thickness of the primary protrusion of qNSCs from wild‐type, patr sk1 /patr sk8 and patr sk1 /patr EY052052 expressing grh > CD8‐GFP. The thickness was measured at the middle point of the primary protrusion. n = 38 NSCs for control; n = 51 NSCs for patr sk1 /patr sk8 ; and n = 45 NSCs for patr sk1 /patr EY052052 .
- Quantification graph for length of the primary protrusion of qNSCs from wild type, patr sk1 /patr sk8 and patr sk1 /patr EY052052 expressing grh > CD8‐GFP. The length was measured from the PIS region of the primary protrusion to its neuropil contact site. n = 32 NSCs for control; n = 42 NSCs for patr sk1 /patr sk8 ; and n = 23 NSCs for patr sk1 /patr EY052052 .
Data information: ns, nonsignificant, *P < 0.05, **P < 0.01, ***P < 0.001, and ****P < 0.0001. Data are presented as mean ± SD. In (B, E, H, and I), statistical significance was determined by one‐way ANOVA with multiple comparisons. In (C and F), statistical significance was determined by two‐tailed Student's t‐test. Scale bars: 10 μm.
Source data are available online for this figure.
Given that Patronin is required for microtubule growth in qNSCs, we examined whether patronin depletion resulted in morphological defects in the primary protrusion of qNSCs. The thickness of the primary protrusion was measured at the middle position of the protrusion marked by grh > CD8‐GFP. The thickness of the protrusion was significantly decreased to 0.91 ± 0.28 μm (n = 51) and 0.98 ± 0.25 μm (n = 45), respectively, in patr sk1 /patr sk8 and patr sk1 /patr EY052052 quiescent NSCs, compared with 1.36 ± 0.38 μm (n = 38) in the control (Fig 2G and H). However, the length of the primary protrusion in qNSCs (VNC) upon loss of patronin at 16 h ALH was not significantly different from that of the control (Fig 2I), which is likely due to the relatively constant distance between the cell body of qNSCs and neuropil. Therefore, loss of patronin resulted in thinning of the primary protrusion in qNSCs. The protrusion of qNSCs was long thought to retract prior to cell cycle re‐entry (Chell & Brand, 2010). However, with an improved imaging condition for long‐term live imaging, the protrusion of qNSCs was reported to be retained throughout the first post‐reactivation division (although it appeared to be shorter and weaker in signal during division) and is inherited by the basal daughters following the division (Bostock et al, 2020). In our live imaging, we have also observed a similar retention of the protrusion during NSC reactivation (Appendix Fig S1B; Movie EV10). In this experiment, we labeled F‐actin (Utrophin‐actin binding domain fused with GFP) to mark the cell outline. Interestingly, the qNSC went on the first division while retaining the protrusion, although the signal on the protrusion became very weak at this stage (Appendix Fig S1B; Movie EV10) and was unlikely to be labeled by immunofluorescence. This new observation would suggest that microtubule growth in the protrusion may continue during qNSC reactivation. Therefore, Patronin may positively regulate both microtubule growth and cell cycle re‐entry in qNSCs.
Patronin is required for the regeneration of primary protrusion of quiescent NSCs upon injury
Recently, we have established quiescent NSCs as a new regeneration model and reported that the cellular protrusion of quiescent NSCs is capable of regenerating after injury by laser severing (preprint: Gujar et al, 2022; Gujar et al, 2023). To understand whether Patronin is important for the regeneration of quiescent NSCs protrusion after injury, we performed laser ablation on patr sk1 /patr sk8 trans‐heterozygote mutants. At 6‐8 h ALH, following laser ablation at the middle region of primary protrusion of patr sk1 /patr sk8 quiescent NSCs in ex vivo larval brains, in 75% of quiescent NSCs failed to fully regenerate their primary protrusion within 30 min of imaging as compared to 28.6% in the control (Fig 3A and B, Movies EV11 and EV12, Methods). Similarly, at 16‐18 h ALH, the injured primary protrusion of patr sk1 /patr sk8 quiescent NSCs failed to regenerate in 66.6% of quiescent NSCs after 30 min of imaging as compared to 33.3% in the control (Fig 3C and D, Movies EV13 and EV14).
Figure 3. Patronin is required for the regeneration of quiescent NSCs.
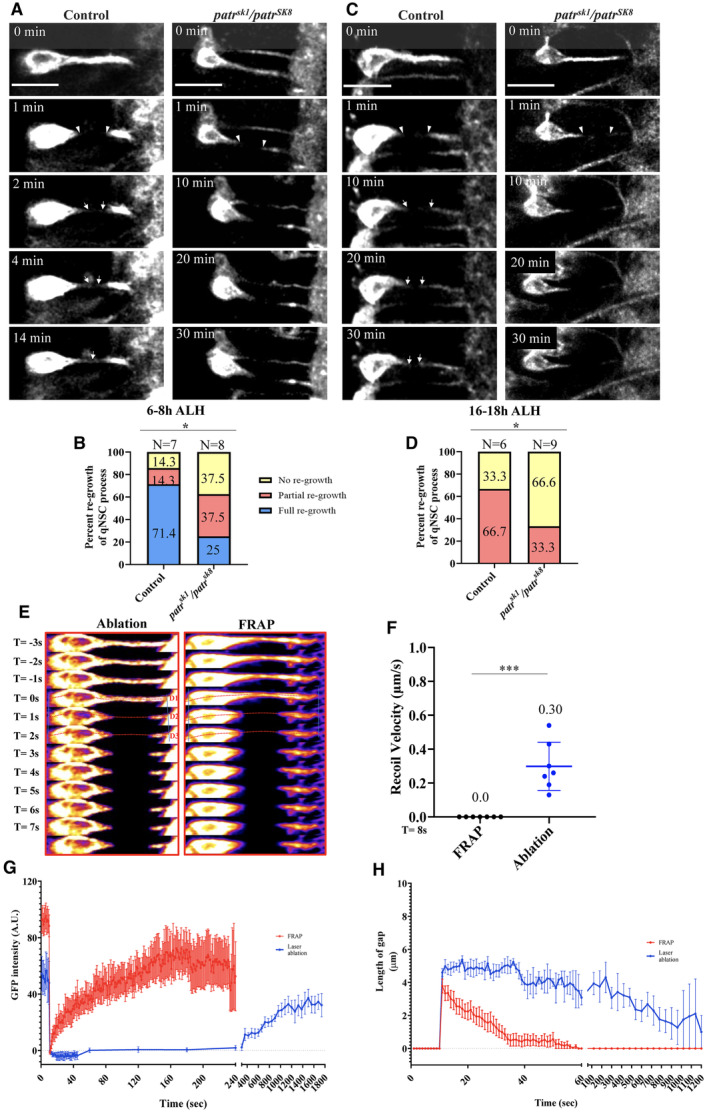
- Time series of a quiescent NSC in ex vivo larval brain at 6‐8 h ALH labeled by grh‐Gal4; UAS‐mCD8‐GFP in control and patr sk1 /patr sk8 ablated at the middle region of the protrusion (arrowheads). Arrows in control indicate regeneration of the protrusion.
- Quantification graph of percentage of regeneration of control (grh > CD8‐GFP) and patr sk1 /patr sk8 quiescent NSCs expressing grh > CD8‐GFP at 6‐8 h ALH after laser ablation. Control, complete regeneration = 71.4%, partial regeneration = 14.3%, no regeneration = 14.3%, n = 7. patr sk1 /patr sk8 , complete regeneration = 25%, partial regeneration = 37.5%, and no regeneration = 37.5%, n = 8.
- Time series of a quiescent NSC in ex vivo larval brain at 16–18 h ALH labeled by grh‐Gal4; UAS‐mCD8‐GFP in control and patr sk1 /patr sk8 ablated at the middle region of the protrusion (arrowheads). Arrows in control indicate partial regeneration of the protrusion.
- Quantification graph of the percentage of primary protrusion of quiescent NSCs that are able to regenerate after injury from various genotypes in (C). Control, no regeneration = 33.3%, partial regeneration = 66.7% n = 6; patr sk1 /patr sk8 , no regeneration = 66.7%, partial regeneration = 33.3%, n = 9.
- Time series montage of quiescent NSCs in ex vivo larval brain at 6‐8 h ALH labeled by grh‐Gal4; UAS‐mCD8‐GFP after ablation (panel 1) and bleaching (panel 2) at the middle region of the protrusion. Dotted lines indicate distance before and after ablation or bleaching.
- Quantification graph for recoil velocity after florescence recovery after photobleaching (FRAP) and ablation in quiescent NSCs in ex vivo larval brain at 6–8 h ALH labeled by grh‐Gal4; UAS‐mCD8‐GFP. After FRAP, recoil velocity = 0 μm/s, n = 7 quiescent NSCs and after ablation, recoil velocity = 0.3 μm/s, n = 7 quiescent NSCs.
- Quantification graph for intensity recovery over time in the primary protrusion of quiescent NSCs after FRAP or Ablation at the middle region of the protrusion. FRAP, n = 5 quiescent NSCs and Ablation, n = 5 quiescent NSCs.
- Quantification graph for length of gap over time in the primary protrusion of quiescent NSCs after FRAP or Ablation at the middle region of the protrusion. FRAP, n = 7 quiescent NSCs and Ablation, n = 6 quiescent NSCs.
Data information: *P < 0.05, ***P < 0.001. Data are presented as mean ± SD. In (B, D, and F), statistical significance was determined by two‐tailed Student's t‐test. Scale bars: 10 μm. All replicates were biological.
Source data are available online for this figure.
To exclude the possibility that regeneration is merely due to fluorescence recovery of CD8‐GFP following photobleaching, we performed fluorescence recovery after photobleaching (FRAP) using CD8‐GFP and calculated recoil velocity, GFP intensity recovery over time, as well as gap length over time for our laser ablation and FRAP experiments (Fig 3E–H). The following lines of evidence indicate that the regeneration was not due to photobleaching effect. Firstly, recoil is typically observed within a few seconds following laser ablation due to cell and tissue tension but not following photobleaching. Indeed, we observed recoil of the protrusion (0.3 μm/s, n = 7) immediately after laser ablation (based on the position of the signal on the edges; blue lines), but no recoil for CD8‐GFP (n = 7) after photobleaching (Fig 3E and F). Secondly, following photobleaching at the protrusion, the fluorescence was seen to recover rapidly within 1 min (Fig 3G, Movie EV15). This rapid fluorescence recovery is distinct from that of the regeneration, which takes 8–10 min on average (Fig 3G). Thirdly, the gap after photobleaching was filled much faster as compared to our laser ablation experiments (Fig 3H, Movie EV15). Taken together, our data suggest that the minus‐end binding protein Patronin is required for the regeneration of primary protrusion of Drosophila quiescent NSCs upon injury.
Arf1 and Sec71 localization at Golgi in quiescent NSCs is dependent on the Patronin function
Our recent work demonstrated that the Golgi apparatus is localized predominantly to the protrusion initial segment (PIS) and apical regions of quiescent NSCs, functioning as an acentrosomal MTOC (preprint: Gujar et al, 2022; Gujar et al, 2023). Interestingly, Patronin intensity was slightly enriched in the apical and PIS regions of quiescent NSCs (Fig 1J). Moreover, co‐staining Patronin with Golgi proteins (Arf1 and cis‐Golgi marker GM130) suggested that increased Patronin intensity at the apical and PIS regions correlates with Golgi puncta localization in the same areas (Fig 4A–D). Therefore, Patronin is distributed in the cytoplasm of quiescent NSCs, with a slight enrichment at the Golgi vicinity.
Figure 4. Patronin is required for Arf1 and Sec71 localization at Golgi in quiescent NSCs.
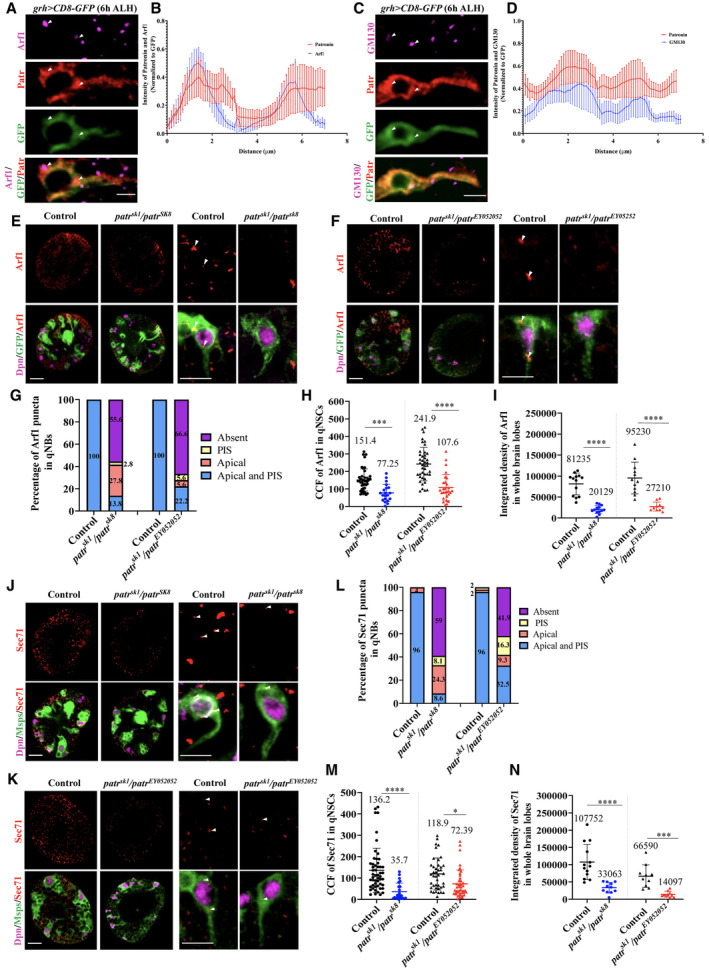
- A quiescent NSC expressing grh > CD8‐GFP at 6‐h ALH was labeled with antibodies against Arf1, Patronin, and GFP.
- Quantification graph showing intensity of Patronin and Arf1 (normalized to Dpn) along the entire quiescent NSC. N = 8 quiescent NSCs.
- A quiescent NSC expressing grh > CD8‐GFP at 6‐h ALH was labeled with antibodies against GM130, Patronin, and GFP.
- Quantification graph showing intensity of Patronin and GM130 (normalized to Dpn) along the entire quiescent NSC. N = 8 quiescent NSCs.
- Larval brains and a quiescent NSC with primary protrusions labeled by Msps at 16‐h ALH from control (yw) and patr sk1 /patr sk8 was labeled with antibodies against Arf1, Dpn, and GFP.
- Larval brains and a quiescent NSC with primary protrusions labeled by Msps at 16‐h ALH from control (yw) and patr sk1 /patr EY052052 was labeled with antibodies against Arf1, Dpn, and Msps.
- Quantification graph of the percentage of Arf1 puncta present per quiescent NSC for genotypes in (E and F). (E) Control = Apical + PIS = 100%, n = 43; patr sk1 /patr sk8 , Apical + PIS = 13.8%, Apical = 27.8%, PIS = 2.8%, Absent = 55.6%, n = 36. **P < 0.01. (F) Control = Apical + PIS = 100%, n = 60; patr sk1 /patr EY052052 , Apical + PIS = 22.2%, Apical = 5.6%, PIS = 5.6%, Absent = 66.6%, n = 36.
- Quantification graph of the corrected total cell fluorescence (CCF) of Arf1 for genotypes in (E and F). CCF = Integrated Density – (area of selected cell × mean fluorescence of background readings). In (E): Control, 151.4 A.U., n = 41 quiescent NSCs; patr sk1 /patr sk8 , 77.25 A.U., n = 20 quiescent NSCs. In (F): Control, 241.9 A.U., n = 42 quiescent NSCs; patr sk1 /patr EY052052 , 107.6 A.U., n = 28 quiescent NSCs.
- Quantification graph of intensity of Arf1 in whole‐brain lobes from genotypes in (E and F). (E). Control, 81,235 A.U., n = 13 BL; patr sk1 /patr sk8 , 20,129 A.U., n = 13 BL. (F) Control, 95,230 A.U., n = 12 BL; patr sk1 /patr EY052052 , 27,210 A.U., n = 10 BL.
- Larval brains and a quiescent NSC expressing grh > CD8‐GFP in control and patr sk1 /patr sk8 at 16 h ALH were labeled with antibodies against Sec71, Dpn and GFP.
- Larval brains with quiescent NSCs labeled by Msps at 16 h ALH from control (yw) and patr sk1 /patr EY052052 was labeled with antibodies against Sec71, Dpn and Msps.
- Quantification graph of the percentage of Sec71 dots present per quiescent NSC for genotypes in (J and K). (J) Control = Apical + PIS = 96%, Apical = 4%, n = 25; patr sk1 /patr sk8 Apical + PIS = 8.6%, Apical = 24.3%, PIS = 8.1%, Absent = 59%, n = 37. **P < 0.01. (K) Control = Apical + PIS = 96%, Apical = 2%, PIS = 2%, n = 50; patr sk1 /patr EY052052 , Apical + PIS = 32.5%, Apical = 9.3%, PIS = 16.3%, Absent = 41.9%, n = 43.
- Quantification graph of the corrected total cell fluorescence (CCF) of Sec71 for quiescent NSCs in genotypes in (J and K). CCF = Integrated Density – (area of selected cell × mean fluorescence of background readings). (J) Control, 136.2 A.U., n = 52 quiescent NSCs; patr sk1 /patr sk8 , 35.7 A.U., n = 23 quiescent NSCs. (K) Control, 118.9 A.U., n = 41 quiescent NSCs; patr sk1 /patr EY052052 , 72.4 A.U., n = 41 quiescent NSCs.
- Quantification graph of fluorescence intensity of Sec71 in whole‐brain lobes from genotypes in (J and K). In (J): Control, 107,752 A.U., n = 13 BL; patr sk1 /patr sk8 , 33,063 A.U., n = 11 BL. In (K): Control, 66,590 A.U., n = 10 BL; patr sk1 /patr EY052052 , 14,097, n = 10 BL.
Data information: *P < 0.05, ***P < 0.001, and ****P < 0.0001. Data are presented as mean ± SD. In (G, H, I, L, M, and N), and statistical significance was determined by two‐tailed Student's t‐test. Scale bars: 5 μm for single quiescent NSC (A, C, E, F, J, and K) and 10 μm for whole BL (E, F, J, and K). In (A), arrowheads point to Arf1 and Patronin localization at Golgi in quiescent NSCs.in quiescent NSCs. In (C), arrowheads point to GM130 and Patronin localization at Golgi in quiescent NSCs. In (E–F), arrowheads point to Arf1 localization at Golgi in quiescent NSCs. In (J–K), arrowheads point to Sec71 localization at Golgi in quiescent NSCs. All replicates were biological.
Source data are available online for this figure.
Next, we investigated whether Patronin is required for the proper localization of Golgi proteins, including Arf1, the Arf1GEF Sec71, and GM130. In all control quiescent NSCs at 16 h ALH, Arf1 is localized to the PIS of quiescent NSCs and the apical region distal to the protrusion (Fig 4E–G). In contrast, Arf1 intensity at PIS and the apical regions was diminished in 86.2% of patr sk1 /patr sk8 quiescent NSCs (Fig 4E and G). Further, Arf1 puncta that remained at the apical or PIS regions of quiescent NSCs in patr sk1 /patr sk8 mutants had significantly lower intensity as compared to the control (Fig 4E and H). Consistent with these observations, there was a significant reduction in the integrated intensity of Arf1 in whole‐brain lobes as compared to the control (Fig 4E and I). Similar delocalization of Arf1 was observed in patr sk1 /patr EY052052 quiescent NSCs at 16 h ALH (Fig 4F–I). Likewise, Sec71 localization was significantly diminished in patr sk1 /patr sk8 mutants with 59% of Sec71 puncta absent in quiescent NSCs as compared to control (Fig 4J and L). Sec71 intensity in quiescent NSCs and whole‐brain lobes was also significantly reduced in patr sk1 /patr sk8 mutants (Fig 4J, M and N). Sec71 puncta were also diminished at the PIS or apical region in 67.5% of quiescent NSCs with a significant decrease in Sec71 intensity in patr sk1 /patr EY052052 quiescent NSCs and whole‐brain lobes as compared to the control (Fig 4K–N). The localization of GM130 was also diminished in patr sk1 /patr sk8 and patr sk1 /patr EY052052 mutant quiescent NSCs (Appendix Fig S1C–G). We next examined Arf1 localization in sec71 RNAi and Sec71DN and found that Arf1 localization was unaffected by any of them (Appendix Fig S1H–J). As both sec71 RNAi and Sec71DN qNSCs had strong defects in microtubule assembly in qNSCs (preprint: Gujar et al, 2022; Gujar et al, 2023), microtubule loss does not seem to result in obvious Golgi disorganization and Arf1 delocalization in qNSCs.
These observations indicate that the localization of Arf1 and Sec71 at Golgi in quiescent NSCs depends on the Patronin function.
Patronin physically associates with Arf1
Next, we explored whether Patronin and Arf1 can physically associate with each other by biomolecular fluorescence complementation (BiFC) assay, which can detect transient or weak protein–protein interactions due to the irreversibility of the BiFC complex formation (Shyu & Hu, 2008; Gohl et al, 2010). For our in vitro BiFC experiments in S2 cells, we generated the following chimeric proteins: CYFP‐HA‐Patronin (Patronin with C‐terminal YFP tagged with HA), NYFP‐Myc‐Arf1WT, NYFP‐Myc‐Arf1Q71L, and NYFP‐Myc‐Arf1T31N (various Arf1 fusion proteins with N‐terminal YFP tagged with Myc) driven by actin‐Gal4 driver. We quantified the average pixel intensity per cell as well as the fold change in the YFP signal, normalized to the control which was NYFP‐Myc and CYFP‐HA. As expected, almost no YFP signal was detected in S2 cells that were transfected with either of these two chimeric constructs and their respective controls, NYFP‐Myc and CYFP‐HA (Fig 5A–C). By contrast, a strong YFP signal with an average pixel intensity of 9.8 A.U. and fold change of 795 was detected when cells were transfected with both NYFP‐Myc‐Arf1WT and CYFP‐HA‐Patronin (Fig 5A–C). Similarly, a strong YFP signal, with an average pixel intensity of 13.4 A.U. and fold change of 1,000, was detected in cells co‐expressing NYFP‐Myc‐Arf1T31N and CYFP‐HA‐Patronin (Fig 5A–C). Interestingly, a weaker YFP signal with an average pixel intensity of 2.2 A.U. and fold change of 177 was detected in cells co‐expressing NYFP‐Myc‐Arf1Q71L and CYFP‐HA‐Patronin (Fig 5A–C), suggesting that Patronin preferentially physically associates with the GDP‐bound form of Arf1.
Figure 5. Patronin physically associates with Arf1 in BiFC both in vitro and in vivo .
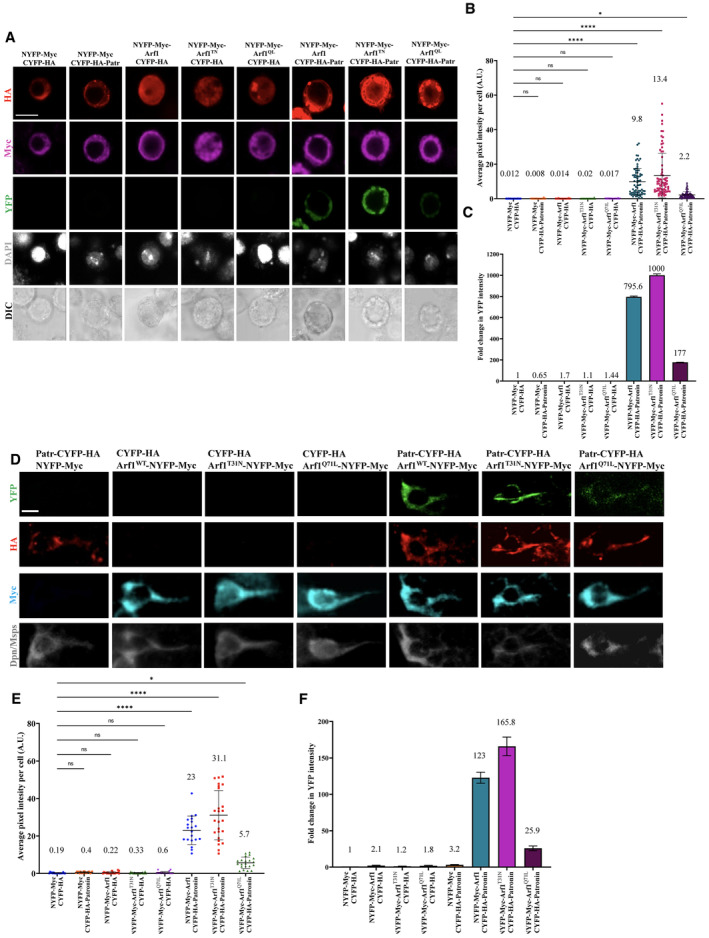
- In vitro BiFC assay between Patronin, Arf1WT, and Arf1 (Q71L and T31N). S2 cells that were triple transfected with actin‐Gal4, UAS‐CYFP‐HA‐Patronin (or UAS‐CYFP‐HA as a control), and UAS‐NYFP‐Myc‐Arf1, UAS‐NYFP‐Myc‐Arf1Q71L or UAS‐NYFP‐Myc‐Arf1T31N (UAS‐NYFP‐Myc as a control) were stained with Myc (magenta) and HA (red) and detected for YFP fluorescence (green). Cell outlines were observed using differential interference contrast (DIC) imaging.
- Quantification graph of the average pixel intensity of YFP (A.U.) in S2 cells for (A). NYFP‐Myc and CYFP‐HA, 0.012, n = 103; NYFP‐Myc and CYFP‐HA‐Patronin, 0.008, n = 94; NYFP‐Myc‐Arf1WT and CYFP‐HA, 0.014, n = 93; NYFP‐Myc‐Arf1T31N and CYFP‐HA, 0.02, n = 88; NYFP‐Myc‐Arf1Q71L and CYFP‐HA, 0.017, n = 94; NYFP‐Myc‐Arf1WT and CYFP‐HA‐Patronin, 9.8, n = 73; NYFP‐Myc‐Arf1T31N and CYFP‐HA‐Patronin, 13.4, n = 76 and NYFP‐Myc‐Arf1Q71L and CYFP‐HA‐Patronin, 2.2, n = 89.
- Quantification graph of fold change in YFP intensity in S2 cells for (A). NYFP‐Myc and CYFP‐HA, 1, n = 103; NYFP‐Myc and CYFP‐HA‐Patronin, 0.65, n = 94; NYFP‐Myc‐Arf1WT and CYFP‐HA, 1.7, n = 93; NYFP‐Myc‐Arf1T31N and CYFP‐HA, 1.1, n = 88; NYFP‐Myc‐Arf1Q71L and CYFP‐HA, 1.44, n = 94; NYFP‐Myc‐Arf1WT and CYFP‐HA‐Patronin, 795.6, n = 73; NYFP‐Myc‐Arf1T31N and CYFP‐HA‐Patronin, 1,000, n = 76 and NYFP‐Myc‐Arf1Q71L and CYFP‐HA‐Patronin, 177, n = 89.
- In vivo BiFC assay between Patronin, Arf1WT and Arf1 (Q71L and T31N). UAS‐CYFP‐HA‐Patronin, and UAS‐NYFP‐Myc‐Arf1, UAS‐NYFP‐Myc‐Arf1Q71L or UAS‐NYFP‐Myc‐Arf1T31N were co‐expressed in neuroblasts by insc‐Gal4, stained with HA (red), Myc (blue) and Dpn/Msps (gray), and detected for YFP fluorescence (green). Controls were NYFP‐Myc‐Arf1/ NYFP‐Myc ‐Arf1Q71L or UAS‐NYFP‐Myc‐Arf1T31N with CYFP‐HA control and CYFP‐HA‐Patr with NYFP‐Myc Control.
- Quantification graph of the average pixel intensity of YFP (A.U.) in quiescent NSCs for (D). NYFP‐Myc and CYFP‐HA, 0.19, n = 18; NYFP‐Myc and CYFP‐HA‐Patr, 0.4, n = 21; NYFP‐Myc‐Arf1WT and CYFP‐HA, 0.22, n = 20; NYFP‐Myc‐Arf1T31N and CYFP‐HA, 0.33, n = 20; NYFP‐Myc‐Arf1Q71L and CYFP‐HA, 0.6, n = 18; NYFP‐Myc‐Arf1WT and CYFP‐HA‐Patronin, 23, n = 20; NYFP‐Myc‐Arf1T31N and CYFP‐HA‐Patronin; 31.1, n = 25 and NYFP‐Myc‐Arf1Q71L and CYFP‐HA‐Patronin, 5.7, n = 21.
- Quantification graph of fold change in YFP intensity in quiescent NSCs for (D). NYFP‐Myc and CYFP‐HA, 1, n = 18; NYFP‐Myc and CYFP‐HA‐Patr, 3.2, n = 21; NYFP‐Myc‐Arf1WT and CYFP‐HA, 2.1, n = 20; NYFP‐Myc‐Arf1T31N and CYFP‐HA, 1.2, n = 20; NYFP‐Myc‐Arf1Q71L and CYFP‐HA, 1.8, n = 18; NYFP‐Myc‐Arf1WT and CYFP‐HA‐Patronin, 123, n = 20; NYFP‐Myc‐Arf1T31N and CYFP‐HA‐Patronin; 165.8, n = 25 and NYFP‐Myc‐Arf1Q71L and CYFP‐HA‐Patronin, 25.9, n = 21.
Data information: ns, nonsignificant, *P < 0.05, and ****P < 0.0001. Data are presented as mean ± SD. In (B, C, E, and F), statistical significance was determined by one‐way ANOVA with multiple comparisons. Scale bars: 5 μm.
Source data are available online for this figure.
To examine whether Patronin and Arf1 associate in vivo, we generated transgenes expressing NYFP‐Myc‐Arf1, NYFP‐Myc‐Arf1T31N, NYFP‐Myc‐Arf1Q71L, or CYFP‐HA‐Patronin. Co‐expression of NYFP‐Myc (control) with CYFP‐HA‐Patronin in NSCs at 16 h ALH under the NSC driver, insc‐Gal4, did not result in YFP fluorescence (Fig 5D–F). Similarly, co‐expression of NYFP‐Myc‐Arf1, NYFP‐Myc‐Arf1T31N, or NYFP‐Myc‐Arf1Q71L with CYFP‐HA (control) did not result in any significant YFP fluorescence as measured by average pixel intensity or fold change normalized with control NYFP‐Myc with CYFP‐HA (Fig 5D–F). By contrast, co‐expression of both NYFP‐Myc‐Arf1 and CYFP‐HA‐Patronin resulted in strong YFP fluorescence with an average pixel intensity of 23 A.U and a fold change of 123 as compared to control (Fig 5D and E; n = 20). Remarkably, quiescent NSCs (n = 25) co‐expressing NYFP‐Myc‐Arf1T31N and CYFP‐HA‐Patronin showed strong YFP signal (average pixel intensity = 31.1, fold change in YFP = 165.8) often in the filamentous structure along the primary protrusion (Fig 5D–F). Co‐expression of NYFP‐Myc‐Arf1 Q71L and CYFP‐HA‐Patronin resulted in weaker average pixel intensity of YFP signal (5.7 A.U., fold change = 25.9; n = 21) in quiescent NSCs, which supports our in vitro BiFC data that Patronin preferentially physically associates with the GDP‐bound form of Arf1 (Fig 5D–F).
To further validate the association between Patronin and Arf1, we employed another assay, namely proximity ligation assay (PLA), a technique that enables the detection of protein–protein interactions with high specificity and sensitivity (Fredriksson et al, 2002). We co‐expressed various proteins tagged with Myc or Flag in S2 cells and quantified PLA foci that indicated protein interactions (Fig EV2A–C). The vast majority of S2 cells co‐expressing both Flag and Myc controls had no PLA signals, except for a small number of the cells displaying a weak PLA fluorescence signal of no more than 10 foci (Fig EV2A–C). Similarly, the vast majority of cells (79.6–90.2%) co‐expressing Flag‐Arf1WT with control Myc or Myc‐Patronin with control Flag had no PLA signal (Figs EV2A–C; 0.23 and 0.45 PLA foci per cell, respectively). By contrast, 69.3% of cells co‐expressing Flag‐Arf1WT and Myc‐Patronin displayed PLA signal (8.5 PLA foci per cell on average), of which 6.3% displayed strong signal (> 30 foci), 26.7% displayed moderate signal (11–30 foci), and 36.3% displayed weak signal (1–10 foci; Fig EV2B and C). Further, we tested whether Patronin associates with the GTP‐ or GDP‐bound form of Arf1. In controls expressing either Myc and HA, Myc‐Patronin and HA, Myc and HA‐Arf1Q71L (Arf1‐GTP) or Myc and HA‐Arf1T31N (Arf1‐GDP), we observed that the majority of cells had no PLA signal (Fig EV2D–F). Remarkably, 56.8% of S2 cells co‐expressing Myc‐Patronin and HA‐Arf1T31N showed PLA signals (Fig EV2D–F). In contrast, Myc‐Patronin was only weakly associated with HA‐Arf1Q71L in PLA (Fig EV2D–F). These observations further support our conclusion that Patronin preferentially associates with the GDP‐bound form of Arf1.
Figure EV2. Patronin associates with Arf1 in proximity ligation assay (PLA).
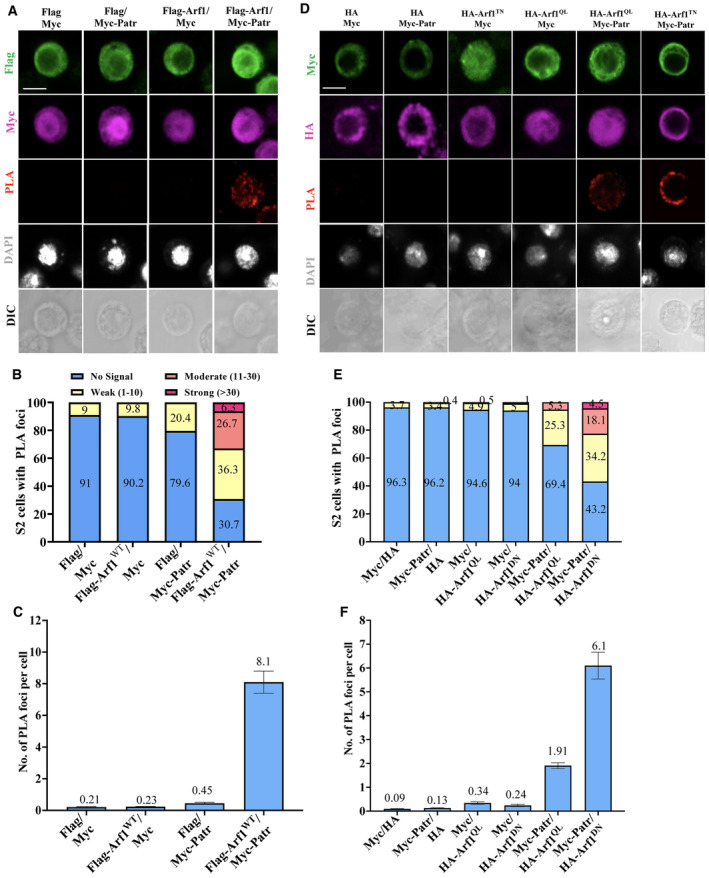
- In situ PLA between Arf1WT and Patronin in S2 cells. S2 cells transfected with two of the indicated plasmids (Myc, Flag, Flag‐Arf1WT, Myc‐Patronin) were stained for Flag, Myc, and DNA and detected for PLA signal. Cell outlines were determined by differential interference contrast (DIC) images.
- Quantification graphs showing the percentage of S2 cells with no PLA signal, weak (≤ 10 foci), moderate (11–30 foci), and strong (> 30 foci) PLA signals for (A). Myc and Flag, no signal = 91%, weak signal = 9%, n = 88; Flag‐Arf1WT and Myc, no signal = 90.2%, weak = 9.8%, n = 111; Flag and Myc‐Patronin, no signal = 79.6%, weak = 20.4%, n = 108; Flag‐Arf1WT and Myc‐Patronin, no signal = 30.7%, weak = 36.3%, moderate = 26.7%, and strong = 6.3%, n = 114.
- Quantification graph of the average number of PLA foci per cell in (A). Myc and Flag, 0.21, n = 88; Flag‐Arf1WT and Myc, 0.23, n = 111; Flag and Myc‐Patronin, 0.45, n = 108; Flag‐Arf1WT and Myc‐Patronin, 8.1, n = 114.
- In situ PLA among Arf1Q71L, Arf1T31N, and Patronin in S2 cells. S2 cells transfected with two of the indicated plasmids (Myc, HA, Myc‐Patronin, HA‐Arf1Q71L and HA‐Arf1T31N) were stained for HA, Myc, and DNA and detected for PLA signal. Cell outlines were determined by differential interference contrast (DIC) images.
- Quantification graph showing the percentage of S2 cells with no PLA signal, or weak (1–10 foci), moderate (11–30 foci), or strong (> 30 foci) PLA signals for (D). Myc and HA, no signal = 96.3%, weak signal = 3.7%, n = 135; Myc‐Patronin and HA, no signal = 96.2%, weak = 3.4%, moderate signal = 0.4, n = 239; Myc and HA‐Arf1Q71L, no signal = 94.6%, weak = 4.9%, moderate = 0.5%, n = 205; Myc and HA‐Arf1T31N, no signal = 94%, weak = 5%, moderate = 1%, n = 199; Myc‐Patronin and HA‐Arf1Q71L, no signal = 69.4%, weak = 25.3%, moderate = 5.3%, n = 289; Myc‐Patronin and HA‐Arf1T31N, no signal = 43.2%, weak = 34.2%, moderate = 18.1%, strong = 4.5%, n = 199.
- Quantification graph of the average number of PLA foci per cell in (D). Myc and HA, 0.09, n = 135; HA and Myc‐Patronin, 0.13, n = 239; Myc and HA‐Arf1Q71L, 0.34, n = 205; Myc and HA‐ Arf1DN (Arf1T31N), 0.24, n = 199; Myc‐Patronin and HA‐Arf1Q71L, 1.9, n = 289; Myc‐Patronin and HA‐Arf1T31N, 6.1, n = 199.
Data information: Data are presented as mean ± SD. Scale bars: 5 μm.
Source data are available online for this figure.
Arf1 physically associates with the microtubule‐binding CKK domain of Patronin
Patronin/CAMSAP/PTRN‐1 contains a CH domain at its amino terminus, three predicted coiled‐coil (CC) domains at its central region, and a CKK domain at its carboxyl‐terminus (Baines et al, 2009; Fig EV1D). To understand which domains of Patronin are required for the physical association with Arf1, we tested the physical association between Arf1WT and various truncated Patronin proteins in BiFC (Fig EV3A–C). The following chimeric proteins were generated: CYFP‐HA‐PatroninCC, CYFP‐HA‐PatroninCH, CYFP‐HA‐PatroninCCK, CYFP‐HA‐PatroninΔCH and CYFP‐HA‐PatroninΔCCK along with NYFP‐Myc‐Arf1WT, NYFP‐Myc‐Arf1Q71L, and NYFP‐Myc‐Arf1T31N. No YFP was detected in S2 cells transfected with control or chimeric proteins with their respective controls as calculated by average pixel intensity or the fold change in the YFP signal when normalized to control NYFP‐Myc and CYFP‐HA (Fig EV3A–I). Interestingly, we find that cells co‐expressing CYFP‐HA‐PatroninCKK and NYFP‐Myc‐Arf1WT displayed a YFP signal with an average pixel intensity of 0.84 A.U. and a fold change of 104.7 as compared to control (0.008 A.U., fold = 1; Fig EV3A–C). Consistent with this observation, CYFP‐HA‐PatroninΔCH containing the CKK domain and CC domains also physically associated with NYFP‐Myc‐Arf1T31N in BiFC (average pixel intensity = 0.46, fold change = 58.1; Fig EV3D–F) but not with NYFP‐Myc‐Arf1Q71L (average pixel intensity = 0.004, fold change = 0.6; Fig EV3G–I). These data suggest that Arf1WT and Arf1T31N, but not Arf1Q71L, are physically associated with the Patronin CCK domain in BiFC.
Figure EV3. Patronin associates with Arf1 via the CKK domain in BiFC assay.
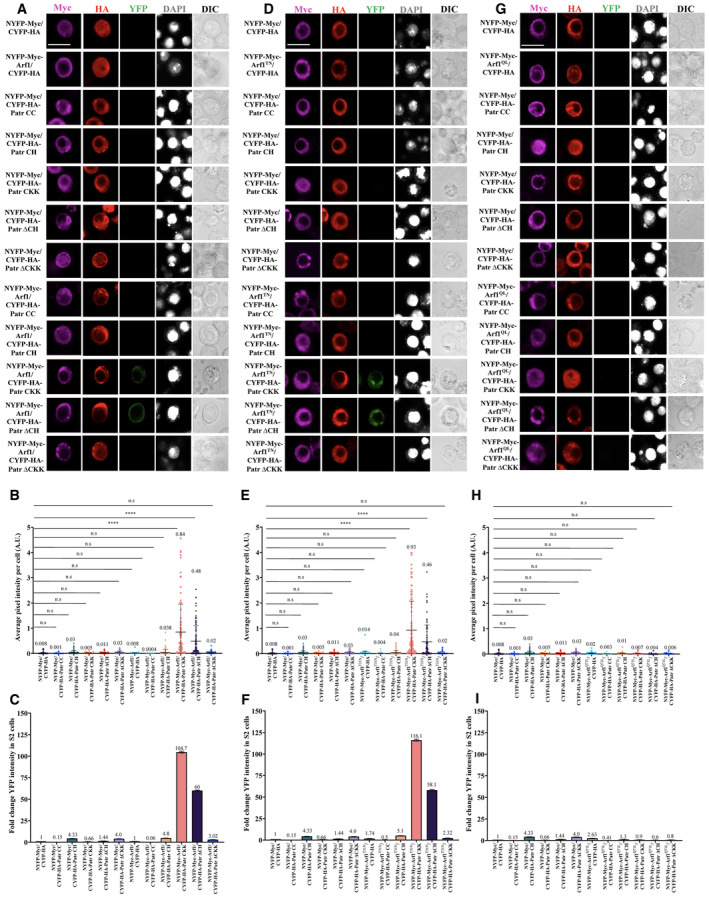
- In vitro BiFC assay between Patronin domains and Arf1. S2 cells that were triple transfected with actin‐Gal4, UAS‐CYFP‐HA‐PatroninCC (or UAS‐CYFP‐HA‐PatroninCH, UAS‐CYFP‐HA‐PatroninCKK, UAS‐CYFP‐HA‐PatroninΔCH, UAS‐CYFP‐HA‐PatroninΔCKK, or UAS‐CYFP‐HA as a control), and UAS‐NYFP‐Myc‐Arf1WT (or UAS‐NYFP‐Myc as a control) were stained with Myc (magenta) and HA (red) and detected for YFP fluorescence (green). Cell outlines were observed using differential interference contrast (DIC) imaging.
- Quantification graph of average pixel intensity (A.U.) of YFP signal in S2 cells in (A). NYFP‐Myc and CYFP‐HA, 0.008, n = 70; NYFP‐Myc and CYFP‐HA‐PatroninCC, 0.001, n = 81; NYFP‐Myc and UAS‐CYFP‐HA‐PatroninCH, 0.03, n = 104; NYFP‐Myc and UAS‐CYFP‐HA‐PatroninCKK, 0.005, n = 85; NYFP‐Myc and UAS‐CYFP‐HA‐PatroninΔCH, 0.011, n = 97; NYFP‐Myc and UAS‐CYFP‐HA‐PatroninΔCKK, 0.03, n = 81; NYFP‐Myc‐Arf1 and CYFP‐HA, 0.008, n = 76; NYFP‐Myc‐Arf1 and CYFP‐HA‐PatroninCC, 0.0004, n = 76; NYFP‐Myc‐Arf1 and CYFP‐HA‐PatroninCH, 0.038, n = 87; NYFP‐Myc‐Arf1 and CYFP‐HA‐PatroninCKK;0.84, n = 88; NYFP‐Myc‐Arf1 and CYFP‐HA‐PatroninΔCH, 0.48, n = 89; NYFP‐Myc‐Arf1 and CYFP‐HA‐PatroninΔCKK, 0.02, n = 98.
- Quantification graph for fold change of YFP signal in S2 cells in (A). NYFP‐Myc and CYFP‐HA, 1, n = 70; NYFP‐Myc and CYFP‐HA‐PatroninCC, 0.15, n = 81; NYFP‐Myc and UAS‐CYFP‐HA‐PatroninCH, 4.3, n = 104; NYFP‐Myc and UAS‐CYFP‐HA‐PatroninCKK, 0.66, n = 85; NYFP‐Myc and UAS‐CYFP‐HA‐PatroninΔCH, 1.44, n = 97; NYFP‐Myc and UAS‐CYFP‐HA‐PatroninΔCKK, 4, n = 81; NYFP‐Myc‐Arf1 and CYFP‐HA, 1, n = 76; NYFP‐Myc‐Arf1 and CYFP‐HA‐PatroninCC, 0.06, n = 76; NYFP‐Myc‐Arf1 and CYFP‐HA‐PatroninCH, 4.8, n = 87; NYFP‐Myc‐Arf1 and CYFP‐HA‐PatroninCKK; 104.7, n = 88; NYFP‐Myc‐Arf1 and CYFP‐HA‐PatroninΔCH, 60, n = 89; NYFP‐Myc‐Arf1 and CYFP‐HA‐PatroninΔCKK, 3.02, n = 98.
- In vitro BiFC assay between Patronin domains and Arf1T31N. S2 cells that were triple transfected with actin‐Gal4, UAS‐CYFP‐HA‐PatroninCC (or UAS‐CYFP‐HA‐PatroninCH, UAS‐CYFP‐HA‐PatroninCKK, UAS‐CYFP‐HA‐PatroninΔCH, UAS‐CYFP‐HA‐PatroninΔCKK or UAS‐CYFP‐HA as a control), and UAS‐NYFP‐Myc‐Arf1T31N (or UAS‐NYFP‐Myc as a control) were stained with Myc (magenta) and HA (red) and detected for YFP fluorescence (green). Cell outlines were observed using differential interference contrast (DIC) imaging.
- Quantification graph of average pixel intensity (A.U.) of YFP signal in S2 cells in (D). NYFP‐Myc and CYFP‐HA, 0.008, n = 70; NYFP‐Myc and CYFP‐HA‐PatroninCC, 0.001, n = 81; NYFP‐Myc and UAS‐CYFP‐HA‐PatroninCH, 0.03, n = 104; NYFP‐Myc and UAS‐CYFP‐HA‐PatroninCKK, 0.005, n = 85; NYFP‐Myc and UAS‐CYFP‐HA‐PatroninΔCH, 0.011, n = 97; NYFP‐Myc and UAS‐CYFP‐HA‐PatroninΔCKK, 0.03, n = 81; NYFP‐Myc‐Arf1 T31N and CYFP‐HA, 0.014, n = 88; NYFP‐Myc‐Arf1T31N and CYFP‐HA‐PatroninCC, 0.0004, n = 83; NYFP‐Myc‐Arf1T31N and CYFP‐HA‐PatroninCH0.04, n = 65; NYFP‐Myc‐Arf1T31N and CYFP‐HA‐PatroninCKK;0.93, n = 98; NYFP‐Myc‐Arf1T31N and CYFP‐HA‐PatroninΔCH, 0.46, n = 75; NYFP‐Myc‐Arf1T31N and CYFP‐HA‐PatroninΔCKK, 0.02, n = 84.
- Quantification graph for fold change of YFP signal in S2 cells in (D). NYFP‐Myc and CYFP‐HA, 1, n = 70; NYFP‐Myc and CYFP‐HA‐PatroninCC, 0.15, n = 81; NYFP‐Myc and UAS‐CYFP‐HA‐PatroninCH, 4.3, n = 104; NYFP‐Myc and UAS‐CYFP‐HA‐PatroninCKK, 0.66, n = 85; NYFP‐Myc and UAS‐CYFP‐HA‐PatroninΔCH, 1.44, n = 97; NYFP‐Myc and UAS‐CYFP‐HA‐PatroninΔCKK, 4, n = 81; NYFP‐Myc‐Arf1T31N and CYFP‐HA, 1.74, n = 88; NYFP‐Myc‐Arf1T31N and CYFP‐HA‐PatroninCC, 0.5, n = 83; NYFP‐Myc‐Arf1T31N and CYFP‐HA‐PatroninCH, 5.1, n = 65; NYFP‐Myc‐Arf1T31N and CYFP‐HA‐PatroninCKK; 116.1, n = 98; NYFP‐Myc‐Arf1T31N and CYFP‐HA‐PatroninΔCH, 58.1, n = 75; NYFP‐Myc‐Arf1T31N and CYFP‐HA‐PatroninΔCKK, 2.32, n = 84.
- In vitro BiFC assay between Patronin domains and Arf1Q71L. S2 cells that were triple transfected with actin‐Gal4, UAS‐CYFP‐HA‐PatroninCC (or UAS‐CYFP‐HA‐PatroninCH, UAS‐CYFP‐HA‐PatroninCKK, UAS‐CYFP‐HA‐PatroninΔCH, UAS‐CYFP‐HA‐PatroninΔCKK or UAS‐CYFP‐HA as a control), and UAS‐NYFP‐Myc‐Arf1Q71L (or UAS‐NYFP‐Myc as a control) were stained with Myc (magenta) and HA (red) and detected for YFP fluorescence (green). Cell outlines were observed using differential interference contrast (DIC) imaging.
- Quantification graph of average pixel intensity (A.U.) of YFP signal in S2 cells in (G). NYFP‐Myc and CYFP‐HA, 0.008, n = 70; NYFP‐Myc and CYFP‐HA‐PatroninCC, 0.001, n = 81; NYFP‐Myc and UAS‐CYFP‐HA‐PatroninCH, 0.03, n = 104; NYFP‐Myc and UAS‐CYFP‐HA‐PatroninCKK, 0.005, n = 85; NYFP‐Myc and UAS‐CYFP‐HA‐PatroninΔCH, 0.011, n = 97; NYFP‐Myc and UAS‐CYFP‐HA‐PatroninΔCKK, 0.03, n = 81; NYFP‐Myc‐Arf1Q71L and CYFP‐HA, 0.02, n = 94; NYFP‐Myc‐Arf1Q71L and CYFP‐HA‐PatroninCC, 0.003, n = 66; NYFP‐Myc‐Arf1Q71L and CYFP‐HA‐PatroninCH, 0.01, n = 77; NYFP‐Myc‐Arf1Q71L and CYFP‐HA‐PatroninCKK; 0.007, n = 64; NYFP‐Myc‐Arf1Q71L and CYFP‐HA‐PatroninΔCH, 0.004, n = 70; NYFP‐Myc‐Arf1Q71L and CYFP‐HA‐PatroninΔCKK, 0.006, n = 77.
- Quantification graph for fold change of YFP signal in S2 cells in (G). NYFP‐Myc and CYFP‐HA, 1, n = 70; NYFP‐Myc and CYFP‐HA‐PatroninCC, 0.15, n = 81; NYFP‐Myc and UAS‐CYFP‐HA‐PatroninCH, 4.3, n = 104; NYFP‐Myc and UAS‐CYFP‐HA‐PatroninCKK, 0.66, n = 85; NYFP‐Myc and UAS‐CYFP‐HA‐PatroninΔCH, 1.44, n = 97; NYFP‐Myc and UAS‐CYFP‐HA‐PatroninΔCKK, 4, n = 81; NYFP‐Myc‐Arf1Q71L and CYFP‐HA, 1.74, n = 88; NYFP‐Myc‐Arf1Q71L and CYFP‐HA, 2.63, n = 94; NYFP‐Myc‐Arf1Q71L and CYFP‐HA‐PatroninCC, 0.41, n = 66; NYFP‐Myc‐Arf1Q71L and CYFP‐HA‐PatroninCH, 1.3, n = 77; NYFP‐Myc‐Arf1Q71L and CYFP‐HA‐PatroninCKK; 0.9, n = 64; NYFP‐Myc‐Arf1Q71L and CYFP‐HA‐PatroninΔCH, 0.6, n = 70; NYFP‐Myc‐Arf1Q71L and CYFP‐HA‐PatroninΔCKK, 0.8, n = 77.
Data information: ns, nonsignificant and ****P < 0.0001. Data are presented as mean ± SD. Statistical significance was determined by one‐way ANOVA with multiple comparisons. Scale bars: 5 μm.
Source data are available online for this figure.
Similar results were obtained in the PLA, as 33.4% of cells co‐expressing Flag‐Arf1WT and Myc‐PatroninCKK domain displayed PLA signal (3 PLA foci per cell on average), of which 1.2% displayed strong signal (> 30 foci), 12.3% displayed moderate signal (11–30 foci), and 22.2% displayed weak signal (1–10 foci; Appendix Fig S2A–C). Consistent with this observation, Myc‐PatroninΔCH containing the CKK domain and CC domains also physically associated with Flag‐Arf1WT in PLA (Appendix Fig S2A–C). As expected, the majority of S2 cells co‐expressing various control combinations had no PLA signals (Appendix Fig S2A–C). Moreover, Myc‐PatroninΔCKK did not associate with Arf1 in PLA (Appendix Fig S2A–C), further supporting that the CKK domain of Patronin is important for the physical association with Arf1. Similar to our BiFC results cells co‐expressing Flag‐Arf1T31N and Myc‐PatroninCKK domain or Myc‐PatroninΔCH displayed PLA signal (Appendix Fig S2D–F), but no PLA signal was observed in cells co‐expressing Flag‐Arf1Q71L and Myc‐PatroninCKK domain or Myc‐PatroninΔCH (Appendix Fig S2G–I), suggesting that Arf1WT and Arf1T31N, but not Arf1Q71L, physically associated with the Patronin CCK domain in PLA experiments.
Patronin is required for E‐cadherin localization at NSC‐neuropil contact sites
Recently, we showed that the cell adhesion molecule E‐cadherin/Shotgun localizes to the NSC‐neuropil contact sites in an Arf1 and Msps‐dependent manner and is required for NSC reactivation (Deng et al, 2021; preprint: Gujar et al, 2022; Gujar et al, 2023). We next analyzed whether Patronin was also required for proper E‐cad localization at NSC‐neuropil contact sites. Strikingly, at 16 h ALH, E‐cad localization at NSC‐neuropil contact sites was lost in 68.7% of patr sk1 /patr sk8 and 50.9% of patr sk1 /patr EY052052 quiescent NSCs, respectively, compared with 15.8% in control quiescent NSCs (Fig EV4A and B). The intensity of E‐cad at NSC‐neuropil contact sites normalized to Dpn was also significantly reduced in these patronin mutants (Fig EV4A and C). Interestingly, in patronin knockdown brains overexpressing E‐cad, the expression level of E‐cad at the NSC‐neuropil contact sites was significantly suppressed to 0.75 (n = 38) as compared to 0.45 in loss of patronin alone (Fig EV4D–F; n = 41). Therefore, E‐cad localization to NSC‐neuropil contact sites requires functional Patronin.
Figure EV4. Patronin regulates E‐cadherin localization and functions upstream of Arf1 and Sec71 to promote NSC reactivation.
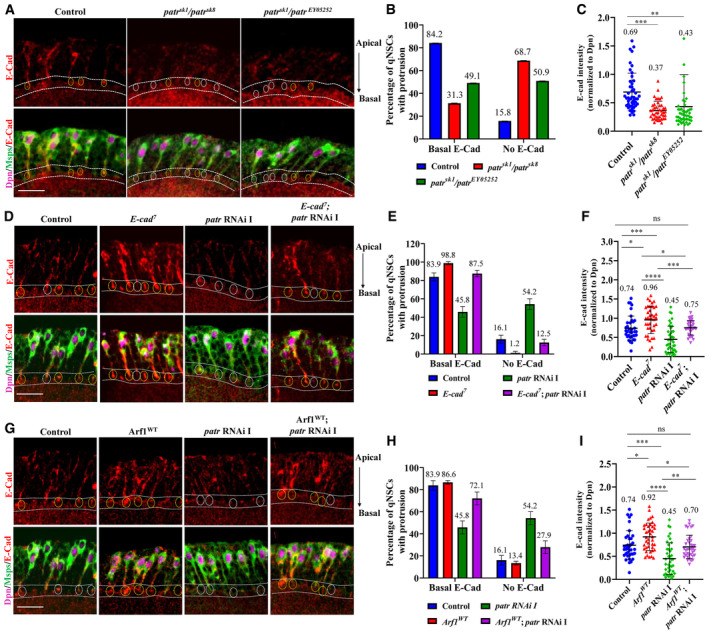
- The larval ventral nerve cord (VNC) at 16 h ALH from control, patr sk1 /patr sk8 and patr sk1 /patr EY052052 were labeled with E‐cad, Dpn, and Msps. Primary protrusion of quiescent NSCs were marked by Msps.
- Quantification of E‐Cadherin basal localization at putative NSC‐neuropil contact sites in quiescent NSCs from genotypes in (A). “No E‐cad” means absent or strongly reduced E‐cad observed at NSC‐neuropil contact sites. Basal E‐cad localization: control, 84.2%, n = 95 NSCS. patr sk1 /patr sk8 , 31.3%, n = 48 NSCs and patr sk1 /patr EY052052 , 49.1%, n = 55 NSCs. No E‐cad localization: control, 15.8%, n = 95 NSCS. patr sk1 /patr sk8 , 68.7%, n = 48 NSCs and patr sk1 /patr EY052052 , 50.9%, n = 55 NSCs.
- Quantification graph of basal E‐Cadherin intensity (normalized to Dpn) at putative NSC‐neuropil contact sites in quiescent NSCs from genotypes in (A). Control = 0.69, n = 46 NSCs, patr sk1 /patr sk8 = 0.37, n = 43 NSCs, patr sk1 /patr EY052052 = 0.43, n = 49 NSCs.
- The larval ventral nerve cord (VNC) at 16 h ALH from control, UAS‐E‐cad 7 , UAS‐patr RNAi I (#18462 Ra‐1, NIG) and UAS‐E‐cad 7 , UAS‐patr RNAi I were labeled with E‐cad, Dpn, and Msps. Primary protrusion of quiescent NSCs were marked by Msps.
- Quantification of E‐Cadherin basal localization at putative NSC‐neuropil contact sites in quiescent NSCs from genotypes in (D). “No E‐cad” means absent or strongly reduced E‐cad observed at NSC‐neuropil contact sites. Basal E‐cad localization: control, 83.9%, n = 61 NSCS. UAS‐E‐cad 7 , 98.8%, n = 72 NSCs; UAS‐patr RNAi I, 45.8%, n = 100 NSCs and UAS‐E‐cad 7 , UAS‐patr RNAi I, 87.5%, n = 80 NSCs. No E‐cad localization: control, 16.1%, n = 61 NSCS. UAS‐ UAS‐E‐cad 7 1.2%, n = 72 NSCs; UAS‐patr RNAi I, 54.2%, n = 100 NSCs and UAS‐E‐cad 7 , UAS‐patr RNAi I, 12.5%, n = 80 NSCs.
- Quantification graph of basal E‐Cadherin intensity (normalized to Dpn) at putative NSC‐neuropil contact sites in quiescent NSCs from genotypes in (D). Control = 0.74, n = 37 NSCs, UAS‐E‐cad 7 = 0.96, n = 40 NSCs, UAS‐patr RNAi I = 0.45, n = 41 NSCs and UAS‐E‐cad 7 , UAS‐patr RNAi I = 0.75, n = 38 NSCs.
- The larval ventral nerve cord (VNC) at 16 h ALH from control, UAS‐Arf1 WT , UAS‐patr RNAi I (#18462 Ra‐1, NIG) and UAS‐Arf1 WT , UAS‐patr RNAi I were labeled with E‐cad, Dpn, and Msps. Primary protrusion of quiescent NSCs were marked by Msps.
- Quantification of E‐Cadherin basal localization at putative NSC‐neuropil contact sites in quiescent NSCs from genotypes in (G). “No E‐cad” means absent or strongly reduced E‐cad observed at NSC‐neuropil contact sites. Basal E‐cad localization: control, 83.9%, n = 61 NSCS. UAS‐Arf1 WT , 86.6%, n = 89 NSCs; UAS‐patr RNAi I, 45.8%, n = 100 NSCs and UAS‐Arf1 WT , UAS‐patr RNAi I, 72.1%, n = 92 NSCs. No E‐cad localization: control, 16.1%, n = 61 NSCS. UAS‐Arf1 WT , 13.4%, n = 89 NSCs; UAS‐patr RNAi I, 54.2%, n = 100 NSCs and UAS‐Arf1 WT , UAS‐patr RNAi I, 27.9%, n = 92 NSCs.
- Quantification graph of basal E‐Cadherin intensity (normalized to Dpn) at putative NSC‐neuropil contact sites in quiescent NSCs from genotypes in (G). Control = 0.74, n = 37 NSCs, UAS‐Arf1 WT = 0.92, n = 41 NSCs, UAS‐patr RNAi I = 0.45, n = 41 NSCs and UAS‐Arf1 WT , UAS‐patr RNAi I = 0.70, n = 37NSCs.
Data information: Arrows indicate apical–basal axis, where basal is toward the neuropil. Yellow circles indicate basal E‐Cad localization, white circles indicate weak or no basal E‐Cad localization. Data are presented as mean ± SD. Statistical significance was determined by one‐way ANOVA with multiple comparisons. ns, nonsignificant, *P < 0.05, **P < 0.01, ***P < 0.001 and ****P < 0.0001. Scale bars: 10 μm.
Source data are available online for this figure.
To assess whether E‐cadherin delocalization due to loss of patronin occurs in an Arf1‐dependent manner, we overexpressed Arf1 WT in loss of patronin larval brains. We found that Arf1 WT could significantly suppress the E‐cad delocalization (percentage of basal E‐cad in Arf1 WT ; patr RNAi = 72.1% compared to 45.8% in patr RNAi; Fig EV4G and H). There was also a significant increase in E‐cad intensity at the basal contact sites when Arf1 was overexpressed in patronin loss‐of‐function brains (0.70; n = 37) as compared to patronin knockdown alone (0.45; n = 41; Fig EV4G and I). This suggests that impaired E‐cadherin localization in loss of patronin brains is Arf1‐dependent.
The Patronin‐Arf1‐Msps‐E‐cad pathway promotes NSC reactivation
Recently, we demonstrated that the Golgi protein Arf1 physically associates with Msps, a microtubule polymerase, and is a new effector of Arf1 during acentrosomal microtubule growth and NSC reactivation (preprint: Gujar et al, 2022; Gujar et al, 2023). Patronin was shown to co‐immunoprecipitate with Msps and recruits it to assemble non‐centrosomal microtubules in Drosophila fat body cells (Zheng et al, 2020). Since we demonstrate that Arf1 and Msps are also required for NSC reactivation and E‐cad localization to the NSC‐neuropil contact sites reactivation (Deng et al, 2021; preprint: Gujar et al, 2022; Gujar et al, 2023), we sought to investigate the epistasis of these genes along with Patronin during NSC reactivation. First, we overexpressed arf1 in patronin‐depleted brains and found a strong suppression of NSC reactivation phenotypes. At 24‐h ALH, the number of EdU‐negative NSCs in patronin‐depleted brains overexpressing Arf1 WT was dramatically reduced to 12.6% compared with 26.7% in patr RNAi control brains (Fig 6A and B). In contrast, overexpression of Arf1 DN in patronin mutants showed no suppression of NSC reactivation phenotypes (Fig EV5A and B). Next, we assessed whether overexpression of the Arf1GEF Sec71 (Sec71 WT ) in patronin mutants could suppress the NSC reactivation defects. At 24 h ALH, only 34.7% of EdU‐negative NSCs were observed in patr sk1 /patr sk8 with Sec71 overexpression compared with 75.8% in patronin mutant brains alone (Fig 6C and D). By contrast, overexpression of Sec71 DN in patronin RNAi brains showed no suppression of NSC reactivation phenotypes (Fig EV5C and D). Consistent with the above‐described suppression by Arf1 WT , the knockdown of arf1 by RNAi in patr sk1 /patr e00176 significantly enhanced the NSC reactivation defects than that in single depletions (Fig EV5E and F). In contrast, overexpressing Patronin in arf1‐ or sec71‐depleted brains did not suppress the NSC reactivation phenotypes (Fig EV5G–J). Our results suggest that Patronin functions upstream of both Arf1 and Sec71 during NSC reactivation.
Figure 6. Patronin functions upstream of Arf1 to promote NSC reactivation.
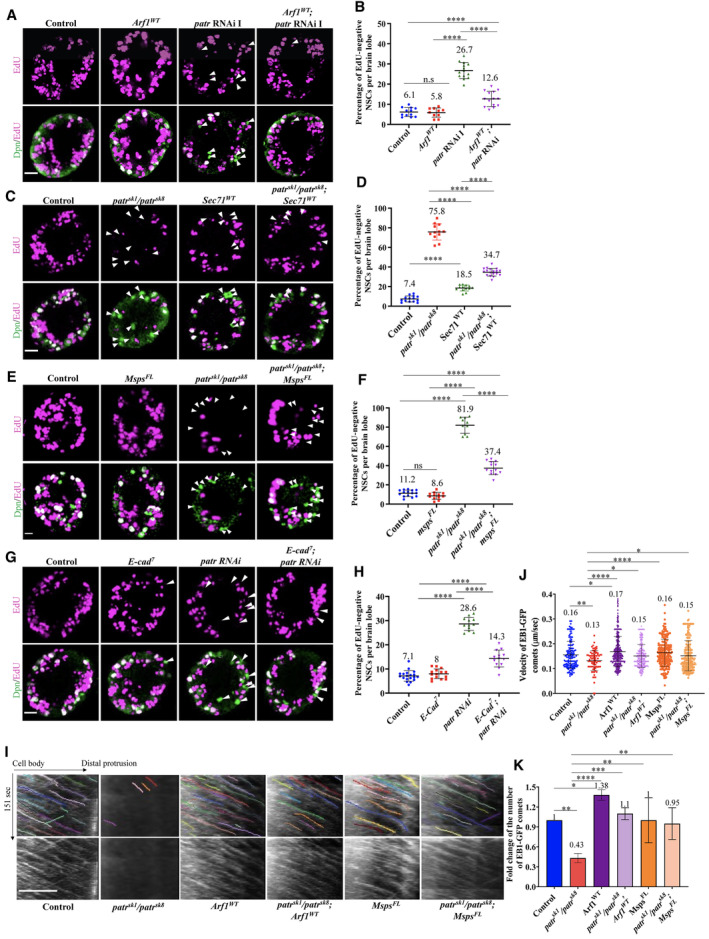
- Larval brains at 24 h ALH from the control (grh‐Gal4, UAS mCD8‐GFP; UAS‐Dcr2/UAS‐β‐Gal RNAi), UAS‐Arf1 WT , UAS‐patr RNAi I (NIG, 18462 Ra‐1), and UAS‐Arf1 WT ; UAS‐patr RNAi I were analyzed for EdU incorporation. NSCs were marked by Dpn.
- Quantification graph of EdU‐negative NSCs per brain lobe for genotypes in (A). Control, 6.1%, n = 12 BL; UAS‐Arf1 WT , 5.8%, n = 10 BL; UAS‐patr RNAi I, 26.7%, n = 14 and UAS‐Arf1 WT ; UAS‐patr RNAi I, 12.6%, n = 14 BL.
- Larval brains at 24 h ALH from the control (grh‐Gal4/UAS‐β‐Gal RNAi), patr sk1 /patr sk8 , UAS‐Sec71 WT , and patr sk1 /patr sk8 ; UAS‐Sec71 WT were analyzed for EdU incorporation. NSCs were marked by Dpn.
- Quantification graph of EdU‐negative NSCs per brain lobe for genotypes in (C). Control, 7.4%, n = 14 BL; patr sk1 /patr sk8 , 75.8, n = 12; UAS‐Sec71 WT , 18.5%, n = 13 BL and, patr sk1 /patr sk8 ; UAS‐Sec71WT 34.7%, n = 18 BL.
- Larval brains at 24 h ALH from the control (grh‐Gal4/UAS‐β‐Gal RNAi), patr sk1 /patr sk8 , UAS‐Msps FL , and patr sk1 /patr sk8 ; UAS‐Msps FL were analyzed for EdU incorporation. NSCs were marked by Dpn.
- Quantification graph of EdU‐negative NSCs per brain lobe for genotypes in (E). Control, 11.2%, n = 15 BL; patr sk1 /patr sk8 , 81.9, n = 10; UAS‐Msps FL , 8.6%, n = 12 BL and, patr sk1 /patr sk8 ; UAS‐Msps FL , 37.4%, n = 13 BL.
- Larval brains at 24 h ALH from the control (grh‐Gal4, UAS mCD8‐GFP; UAS‐Dcr2/UAS‐β‐Gal RNAi), UAS‐E‐cad 7 , UAS‐patr RNAi I (NIG, 18462 Ra‐1) and UAS‐E‐cad 7 ; UAS‐patr RNAi I were analyzed for EdU incorporation. NSCs were marked by Dpn.
- Quantification graph of EdU‐negative NSCs per brain lobe for genotypes in (G). Control, 7.1%, n = 19 BL; UAS‐E‐cad 7 , 8%, n = 15 BL; UAS‐patr RNAi I, 28.6, n = 12 and UAS‐E‐cad 7 ; UAS‐patr RNAi I, 14.3%, n = 13 BL.
- Kymographs of EB1‐GFP comets movement in the primary protrusion of quiescent NSCs expressing EB1‐GFP under grh‐Gal4 from Control, patr sk1 /patr sk8 , UAS‐Arf1 WT , patr sk1 /patr sk8 ; UAS‐Arf1 WT , UAS‐Msps FL and patr sk1 /patr sk8 ; UAS‐Msps FL at 10 h ALH. The horizontal arrow indicates anterograde movement direction from cell body to the tip of the primary protrusion in quiescent NSCs.
- Quantification graph of velocity of EB1‐GFP comets in the primary protrusion of quiescent NSCs at 10 h ALH from various genotypes in (I). Control, 0.16 μm/s, n = 175 comets; patr sk1 /patr sk8 , 0.13 μm/s, n = 85 comets; UAS‐Arf1 WT , 0.17 μm/s, n = 367 comets; patr sk1 /patr sk8 ; UAS‐Arf1 WT , 0.15 μm/s, n = 228 comets; UAS‐Msps FL , 0.16 μm/s, n = 210 comets and patr sk1 /patr sk8 ; UAS‐Msps FL , 0.15 μm/s, n = 201 comets.
- Quantification graph of fold changes of number of EB1‐GFP comets in the primary protrusion of quiescent NSCs 10 h ALH from various genotypes in (I). Control, 1, n = 14 quiescent NSCs, n = 175 comets; patr sk1 /patr sk8 , fold = 0.43, n = 15 quiescent NSCs, n = 85 comets; comets UAS‐Arf1 WT , fold = 1.38, n = 367 comets, n = 22 quiescent NSCs; patr sk1 /patr sk8 ; UAS‐Arf1 WT , fold = 1.1, n = 228 comets, n = 16 quiescent NSCs; UAS‐Msps FL , fold = 1, n = 210 comets, n = 17 quiescent NSCs and patr sk1 /patr sk8 ; UAS‐Msps FL , fold = 0.95, n = 201 comets, n = 17 quiescent NSCs.
Data information: EdU incorporation was analyzed at 24 h ALH by feeding larvae at 20 h ALH with food supplemented with 0.2 mM EdU for 4 h. White arrowheads point to NSCs without EdU incorporation (A, C, E and G). Data are presented as mean ± SD. Statistical significance was determined by one‐way ANOVA with multiple comparisons. ns, nonsignificant, *P < 0.05, **P < 0.01, ***P < 0.001, and ****P < 0.0001. Scale bars: 10 μm.
Source data are available online for this figure.
Figure EV5. Patronin functions upstream of Msps and E‐cad to promote NSC reactivation.
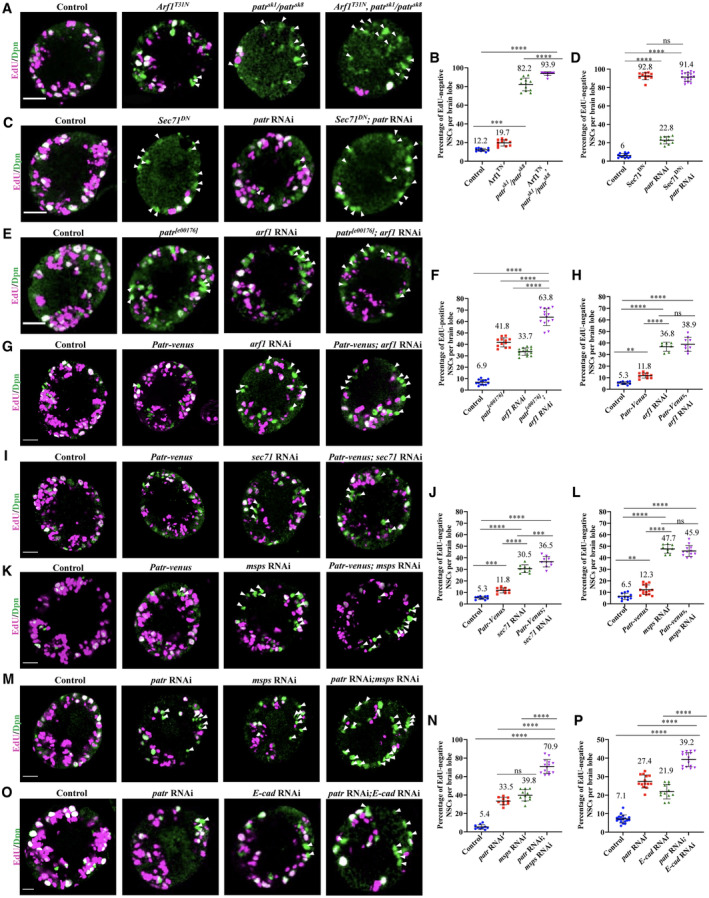
- Larval brains at 24 h ALH from control (grh‐Gal4/UAS‐β‐Gal RNAi), UAS‐Arf1 T31N , patr sk1 /patr sk8 and UAS‐Arf1 T31N , patr sk1 /patr sk8 were analyzed for EdU incorporation. NSCs were marked by Dpn.
- Quantification graph of EdU‐negative NSCs per brain lobe for genotypes in (A). Control, 12.2%, n = 10 BL; UAS‐Arf1 T31N , 19.7%, n = 10 BL; patr sk1 /patr sk8 , 82.2, n = 12 and UAS‐Arf1 T31N , patr sk1 /patr sk8 , 93.9%, n = 14 BL.
- Larval brains at 24 h ALH from control (grh‐Gal4, UAS mCD8‐GFP; UAS‐Dcr2/UAS‐β‐Gal RNAi), UAS‐Sec71 DN , UAS‐patr RNAi I (NIG, 18462 Ra‐1) and UAS‐Sec71 DN ; UAS‐patr RNAi I were analyzed for EdU incorporation. NSCs were marked by Dpn.
- Quantification graph of EdU‐negative NSCs per brain lobe for genotypes in (C). Control, 6%, n = 14 BL; UAS‐Sec71 DN , 92.8, n = 11; UAS‐patr RNAi I, 22.8%, n = 11 BL and, UAS‐Sec71 DN ; UAS‐patr RNAi I, 91.4%, n = 18 BL.
- Larval brains at 24 h ALH from the control (UAS‐β‐Gal RNAi), patr e00176 , UAS‐arf1 RNAi I (VDRC#23082GD) and patr e00176 ; UAS‐arf1 RNAi were analyzed for EdU incorporation. NSCs were marked by Dpn.
- Quantification graph of EdU‐negative NSCs per brain lobe for genotypes in (E). Control, 6.9%, n = 18 BL; patr e00176 , 41.8%, n = 15 BL; UAS‐arf1 RNAi, 33.7, n = 16 and patr e00176 ; UAS‐arf1 RNAi I, 63.8%, n = 12 BL.
- Larval brains at 24 h ALH from control (grh‐Gal4, UAS mCD8‐GFP; UAS‐Dcr2/UAS‐β‐Gal RNAi), UAS‐Patr‐venus, UAS‐arf1 RNAi (VDRC#103572KK) and UAS‐Patr‐venus; UAS‐arf1 RNAi I were analyzed for EdU incorporation. NSCs were marked by Dpn.
- Quantification graph of EdU‐negative NSCs per brain lobe for genotypes in (G). Control, 5.3%, n = 10 BL; UAS‐Patr‐venus, 11.8, n = 10; UAS‐arf1 RNAi, 36.8%, n = 7 BL and, UAS‐Patr‐venus; UAS‐arf1 RNAi, 38.9%, n = 9 BL.
- Larval brains at 24 h ALH from control (grh‐Gal4, UAS mCD8‐GFP; UAS‐Dcr2/UAS‐β‐Gal RNAi), UAS‐Patr‐venus, UAS‐sec71 RNAi I (VDRC#100300KK) and UAS‐Patr‐venus; UAS‐sec71 RNAi I were analyzed for EdU incorporation. NSCs were marked by Dpn.
- Quantification graph of EdU‐negative NSCs per brain lobe for genotypes in (I). Control, 5.3%, n = 10 BL; UAS‐Patr‐venus, 11.8, n = 10; UAS‐sec71 RNAi I, 30.5%, n = 9 BL and, UAS‐Patr‐venus; UAS‐sec71 RNAi I, 36.5%, n = 9 BL.
- Larval brains at 24 h ALH from control (grh‐Gal4, UAS mCD8‐GFP; UAS‐Dcr2/UAS‐β‐Gal RNAi), UAS‐Patr‐venus, UAS‐msps RNAi (VDRC#21982GD) and UAS‐Patr‐venus, UAS‐msps RNAi were analyzed for EdU incorporation. NSCs were marked by Dpn.
- Quantification graph of EdU‐negative NSCs per brain lobe for genotypes in (K). Control, 6.5%, n = 11 BL; UAS‐Patr‐venus, 12.3, n = 15; UAS‐msps RNAi, 47.7%, n = 9 BL and, UAS‐Patr‐venus, UAS‐msps RNAi, 45.9%, n = 12 BL.
- Larval brains at 24 h ALH from control (grh‐Gal4, UAS mCD8‐GFP; UAS Dcr2/UAS‐β‐Gal RNAi), UAS‐patr RNAi II (VDRC#108927KK), UAS‐msps RNAi (VDRC#21982GD) and UAS‐patr RNAi; UAS‐msps RNAi were analyzed for EdU incorporation. NSCs were marked by Dpn.
- Quantification graph of EdU‐negative NSCs per brain lobe for genotypes in (M). Control, 5.4%, n = 10 BL; UAS‐patr RNAi II, 33.5%, n = 10 BL; UAS‐msps RNAi, 39.8%, n = 11 and UAS‐patr RNAi; UAS‐msps RNAi, 70.9%, n = 14 BL.
- Larval brains at 24 h ALH from control (grh‐Gal4, UAS mCD8‐GFP; UAS Dcr2/UAS‐β‐Gal RNAi), UAS‐patr RNAi II (VDRC#108927KK), UAS‐E‐cad RNAi II (BDSC#39204) and UAS‐patr RNAi; UAS‐E‐cad RNAi were analyzed for EdU incorporation. NSCs were marked by Dpn.
- Quantification graph of EdU‐negative NSCs per brain lobe for genotypes in (O). Control, 7.1%, n = 18 BL; UAS‐patr RNAi II, 27.4%, n = 14 BL; UAS‐E‐cad RNAi II, 21.9%, n = 12 and UAS‐patr RNAi; UAS‐E‐cad RNAi, 39.2%, n = 16 BL.
Data information: EdU incorporation was analyzed at 24 h ALH by feeding larvae at 20 h ALH with food supplemented with 0.2 mM EdU for 4 h. White arrowheads point to NSCs without EdU incorporation. Data are presented as mean ± SD. In (B, D, F, H, J, L, N, and P) statistical significance was determined by one‐way ANOVA with multiple comparisons. ns, nonsignificant, **P < 0.01, ***P < 0.001, and ****P < 0.0001. Scale bars: 10 μm.
Source data are available online for this figure.
Similarly, in patr sk1 /patr sk8 mutant brains overexpressing Msps FL , the number of EdU‐negative NSCs was significantly reduced to 38.4% compared with 78.9% in patronin mutant brains (Fig 6E and F). In contrast, overexpressing Patronin in msps‐depleted brains did not suppress the NSC reactivation phenotypes (Fig EV5K and L), suggesting that Msps functions downstream of Patronin. Consistently, knockdown of msps by RNAi in patr knockdown significantly enhanced the NSC reactivation defects than that in single depletions (Fig EV5M and N). Finally, we overexpressed E‐cad in NSCs in patronin‐depleted brains and tested its ability to suppress NSC reactivation defects. At 24 h ALH, E‐cad overexpression significantly suppressed NSC reactivation defects in patr RNAi brains (Fig 6G and H). Further, at 24‐h ALH, in double knockdown of patronin and E‐cad, significantly more EdU‐negative NSCs were observed compared with single knockdowns (Fig EV5O and P). Taken together, these data strongly support the role of the Patronin‐Arf1‐Msps‐E‐cad genetic pathway in promoting NSC reactivation.
To further examine the epistasis of Arf1 and Msps along with Patronin during acentrosomal microtubule growth in quiescent NSCs, we first overexpressed arf1 in patronin‐depleted brains and found that Arf WT could significantly suppress the defects in the number and velocity of EB1‐GFP comets caused by the loss of patronin (Fig 6I–K; Movies [Link], [Link]). Similarly, overexpressing Msps FL could significantly rescue the EB1‐GFP number and velocity defects caused by patronin loss (Fig 6I–K; Movies EV20 and EV21). These data suggest that the Patronin‐Arf1‐Msps pathway drives acentrosomal MT growth in qNSCs.
The Patronin‐Arf1‐Msps pathway regulates the microtubule network in S2 cells
Previous work has shown that loss of patronin in S2 cells results in decreased microtubule density and a higher percentage of free microtubules moving through the cytoplasm (Goodwin & Vale, 2010). To further elucidate the role of the Patronin‐Arf1‐Msps pathway in microtubule growth and maintenance, we analyzed the effect of various proteins in suppressing microtubule assembly defects caused by patronin knockdown in Drosophila S2 cells by time‐lapse imaging of GFP‐tubulin. In wild‐type cells, “free” microtubules (where both the plus and minus ends of the same microtubule are clearly observed) are rarely found (Goodwin & Vale, 2010; Fig 7A and C; Movie EV22). In contrast, when patronin was depleted by RNAi, the microtubule cytoskeleton became less dense and the vast majority of cells had free microtubules visible at the cell periphery as previously reported (Goodwin & Vale, 2010; Fig 7A and C, Movie EV23). Similar to our in vivo data we found that overexpressing the full‐length Patronin, or the CKK domain of Patronin, but not the PatroninΔCKK form significantly suppressed the free microtubule phenotype that was caused by patronin knockdown (Fig 7B and C, Movies [Link], [Link]). Similarly, while overexpressing Arf1 or Msps alone were indistinguishable from the control (Fig 7D and E, Movies EV30 and EV31), overexpressing Arf1 or Msps could significantly suppress the number of free microtubules as well as rescue the loss of microtubule density caused by patronin‐depletion in S2 cells (Fig 7D and E, Movies EV32 and EV33). Our results suggest that Patronin functions upstream of both Arf1 and Msps in regulating microtubule growth in S2 cells.
Figure 7. Patronin functions upstream of Arf1 to regulate microtubule assembly in S2 cells.
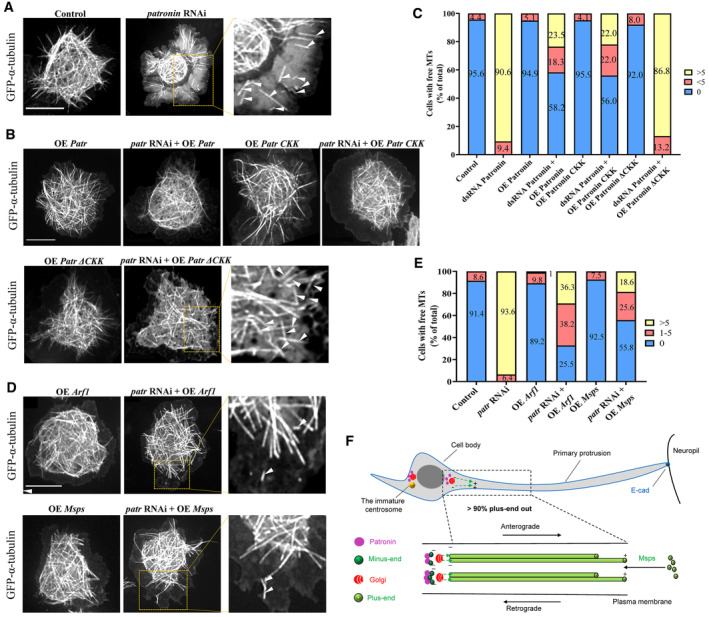
- Time‐lapse microscopy of GFP‐α‐tubulin in Drosophila S2 cells show that patronin‐depleted cells have numerous “free” microtubules (white arrow heads) and sparser microtubule network.
- Time‐lapse microscopy of GFP‐α‐tubulin in overexpression Patr, patronin‐depleted + overexpression Patr, overexpression Patr CKK , patronin‐depleted + overexpression Patr CKK , overexpression Patr ΔCKK and patronin‐depleted + overexpression Patr ΔCKK Drosophila S2 cells.
- Quantification graph of free microtubules per cell for genotypes in (A‐B). Control, 0 free MTs = 95.6%, 1–5 free MTs = 4.4%, n = 90; patr RNAi, 0 free MTs = 0%, 1–5 free MTs = 9.4%, > 5 free MTs = 90.6%, n = 106; OE Patr, 0 free MTs = 94.9%, 1–5 free MTs = 5.1%, n = 78; patr RNAi + OE Patr, 0 free MTs = 58.2%, 1–5 free MTs = 18.3%, > 5 free MTs = 23.5%, n = 98; OE Patr CKK , 0 free MTs = 95.9%, 1–5 free MTs = 4.1%, n = 98; patr RNAi + OE Patr CKK , 0 free MTs = 56%, 1–5 free MTs = 22%, > 5 free MTs = 12%, n = 91; OE Patr ΔCKK , 0 free MTs = 92%, 1–5 free MTs = 8%, n = 100 and patr RNAi + OE Patr ΔCKK , 0 free MTs = 0%, 1–5 free MTs = 13.2%, > 5 free MTs = 86.8%, n = 91.
- Time‐lapse microscopy of GFP‐α‐tubulin in Drosophila S2 cells with Arf1 overexpression, patronin‐knockdown + Arf1 overexpression, Msps overexpression, and patronin‐knockdown + Msps overexpression.
- Quantification graph of free microtubules per cell for genotypes in (D). Control, 0 free MTs = 91.4%, 1–5 free MTs = 8.6%, n = 105; patr RNAi, 0 free MTs = 0%, 1–5 free MTs = 6.4%, > 5 free MTs = 93.6%, n = 94; OE Arf1, 0 free MTs = 89.2%, 1–5 free MTs = 9.8%, > 5 free MTs = 1%, n = 102; patr RNAi + OE Arf1, 0 free MTs = 25.5%, 1–5 free MTs = 38.2%, > 5 free MTs = 36.3%, n = 110; OE Msps, 0 free MTs = 92.5%, 1–5 free MTs = 7.5%, n = 93 and patr RNAi + OE Msps, 0 free MTs = 55.8%, 1–5 free MTs = 25.6%, > 5 free MTs = 18.6%, n = 86.
- A working model. Microtubule arrays in the primary protrusion of Drosophila qNSCs are predominantly acentrosomal with plus‐end‐out orientation. Patronin regulates the proper localization of Golgi proteins including Arf1 in quiescent NSCs. Patronin physically associates with the Golgi protein Arf1 and microtubule polymerase Msps to regulate acentrosomal microtubule growth and quiescent NSC reactivation. Patronin functions upstream of Arf1 and Msps to regulate acentrosomal microtubule assembly during quiescent NSC regeneration and reactivation. Patronin along with Arf1 and Msps is required to target E‐cadherin to the NSC‐neuropil contact for NSC reactivation.
Data information: Data are presented as mean. White arrowheads point to free microtubules. Scale bars: 10 μm.
Source data are available online for this figure.
Discussion
In this study, we have identified microtubule minus‐end binding protein Patronin/CAMSAP as a key regulator of acentrosomal microtubule assembly, quiescent NSC reactivation, and regeneration upon injury. We have also shown that functional Patronin is required for the proper localization of Golgi proteins including Arf1 in quiescent NSCs. We propose that Patronin physically associates with the Golgi protein Arf1 and microtubule polymerase Msps to regulate acentrosomal microtubule growth and quiescent NSC reactivation. Patronin functions upstream of Arf1 and Msps to regulate acentrosomal microtubule assembly during quiescent NSC reactivation. Similar to Arf1 and Msps, Patronin is also required for the regeneration of quiescent NSC protrusion upon injury. Lastly, Patronin, Arf1 and Msps‐dependent acentrosomal microtubules enable NSC‐neuropil contact sites during NSC reactivation by targeting E‐cad to the NSC‐neuropil contact sites (Fig 7F).
Patronin is required for the regeneration of quiescent NSC cellular protrusion after injury
We have recently shown a novel regeneration model of Drosophila quiescent NSCs, wherein the hallmark cellular protrusion of Drosophila NSCs is capable of regeneration after injury (preprint: Gujar et al, 2022; Gujar et al, 2023). We also demonstrated that the microtubule regulators Arf1, Sec71, and Msps are required for the regeneration of Drosophila quiescent NSCs upon injury, highlighting the significance of microtubule growth in the regeneration process (preprint: Gujar et al, 2022; Gujar et al, 2023). In this study, we demonstrate that Patronin plays an important role in the regeneration of Drosophila quiescent NSCs, likely through promoting acentrosomal microtubule growth. In C. elegans, axon regeneration is also dependent on the function of PTRN‐1, a member of the Patronin/CAMSAP family (Chuang et al, 2014). Interestingly, PTRN‐1 appears to function specifically in non‐centrosomal microtubule minus ends, as regenerative axon regrowth may be specifically dependent on non‐centrosomal microtubule pathways (Chuang et al, 2014). The potential role of CAMSAP proteins in mammalian regeneration models is currently unknown and warrants further study.
Functional Patronin is required for proper Golgi protein localization in quiescent NSCs
Recently, we showed that Golgi at the PIS region of quiescent NSCs may act as the potential MTOC in quiescent NSCs and identified a novel role for Golgi proteins Arf1 and its GEF Sec71/Arf1GEF in regulating acentrosomal microtubule growth in Drosophila quiescent NSCs (preprint: Gujar et al, 2022; Gujar et al, 2023). Patronin and CAMSAPs are essential for the stabilization and formation of non‐centrosomal microtubules by protecting the minus end from depolymerizing effects of the kinesin‐13 family depolymerases (Hendershott & Vale, 2014). In this study, we demonstrate the importance of functional Patronin for the proper function/localization of Golgi proteins Arf1 and Sec71 at the apical and PIS regions of quiescent NSCs. Patronin physically associates with Arf1 and Msps; upon patronin‐depletion, Arf1 and Sec71 are delocalized, likely causing the delocalization of other Golgi proteins. These observations suggest that Patronin is important for Golgi protein localization and/or acentrosomal MTOC maintenance in quiescent NSCs. Does Patronin depletion cause Golgi disorganization via microtubule loss? This is unlikely since microtubule loss does not seem to result in obvious Golgi disorganization and Arf1 delocalization in qNSCs (Appendix Fig S1H–J). Thus, we favor the model that Patronin directs Arf1 localization in qNSCs. Since both Msps and Patronin are slightly enriched at the PIS and apical Golgi regions (Figs 1J and 4A–D; Deng et al, 2021), they can potentially associate with each other at the microtubule minus ends near Golgi.
It is currently unclear how microtubule‐nucleating and ‐stabilizing proteins work together at the Golgi to organize acentrosomal microtubules. Would Patronin promote the GEF activity of Sec71/Arf1GEF to regulate Arf1 function? This is unlikely, since Patronin preferentially binds to the GDP‐bound form of Arf1, while Sec71 preferentially binds to the Arf1‐GTP form (Wang et al, 2017). Recent work in mammalian cells has shown that CAMSAP2 stabilizes and attaches microtubule minus ends to the Golgi through a complex of AKAP450 and myomegalin (Wu et al, 2016). However, Drosophila Pericentrin‐like protein (PLP), an AKAP450 homolog, is only observed at the centrosomes, but not Golgi in quiescent NSCs, suggesting that PLP is not essential for acentrosomal microtubule organization in quiescent NSCs (our unpublished observation). It would be of great interest to understand whether the Patronin‐Arf1‐Msps axis might be a conserved mechanism for Golgi to organizes acentrosomal microtubules.
Patronin regulates microtubule growth in quiescent NSCs via Arf1 and Msps/XMAP215
The CAMSAP/Patronin family plays an essential role in organizing/patterning microtubule cytoskeleton in several differentiated cells including neurons that organize non‐centrosomal microtubules (Akhmanova & Hoogenraad, 2015; Nashchekin et al, 2016; Zhou et al, 2020; Panzade & Matis, 2021). In this study, we uncovered a new role for Patronin as a key regulator of acentrosomal microtubule nucleation and growth in the primary protrusion of Drosophila quiescent NSCs. Patronin depletion in quiescent NSCs led to a reduction in the number and velocity of EB1‐GFP comets, however, does not affect overall microtubule orientation (Figure 2A–C and Appendix Fig S1A). In contrast to our findings, in Drosophila ddaC neurons, loss of patronin results in mixed dendritic microtubule polarity but not gross loss of EB1 comets (Feng et al, 2019; Wang et al, 2019), suggesting distinct Patronin functions in different cell types. Previously, we showed that E‐cadherin localization is kinesin‐2 dependent in qNSCs (Deng et al, 2021), suggesting a microtubule‐dependent transport mechanism. In addition, coatomer complex proteins and clathrin adaptor proteins AP‐1 had no or subtle effects on NSC reactivation (preprint: Gujar et al, 2022; Gujar et al, 2023). These findings suggest that E‐cadherin delocalization upon patronin loss is unlikely caused by global membrane trafficking defects.
The following lines of evidence support our conclusion that Patronin, Arf1, and Msps function in the same pathway in regulating acentrosomal growth and reactivation in quiescent NSCs. Firstly, depletion of patronin, arf1, sec71 or msps led to similar phenotypes in acentrosomal microtubule organization and NSC reactivation. Secondly, Patronin, Arf1, Sec71, and Msps were all required for quiescent NSC regeneration upon injury. Thirdly, Patronin can physically associate with both Arf1 and Msps. Finally, our epistasis analyses established the Patronin‐Arf1/Sec71‐Msps in microtubule growth and NSC reactivation. However, we could not formally rule out the possibility that they might function in parallel pathways, for example, Patronin and Arf1 might independently regulate microtubule assembly in qNSC. Given that Patronin is physically associated with Arf1 and Msps and that overexpression Patronin could not suppress reactivation phenotypes caused by loss of arf1 or sec71 DN, Patronin, Arf1 and Msps are unlikely to function in parallel pathways.
Taken together, our study has identified a critical role for Patronin in promoting acentrosomal microtubule growth, reactivation, and regeneration of quiescent NSCs. Furthermore, our work has identified a novel molecular link between Patronin and Golgi proteins Arf1 and Sec71 in Golgi‐dependent acentrosomal microtubule organization and reactivation of quiescent NSCs. This new paradigm may apply to numerous microtubule‐dependent systems in mammals.
Materials and Methods
Fly stocks and genetics
Fly stocks and genetic crosses were raised at 25°C unless otherwise stated. Fly stocks were kept in vials or bottles containing standard fly food (0.8% Drosophila agar, 5.8% Cornmeal, 5.1% Dextrose, and 2.4% Brewer's yeast). The following fly strains were used in this study: insc‐Gal4 (BDSC#8751; 1,407‐Gal4), grh‐Gal4 (A. Brand), insc‐Gal4 tub‐Gal80ts, msps 924 (F. Yu), UASt‐Arf1 Q71L (F. Yu), UASt‐ArfI WT (F. Yu), UASt‐ArfI T31N (F. Yu), UASt‐Sec71 DN (F. Yu), UASt‐Sec71 WT (F. Yu), UASt‐Arf1‐GFP (F. Yu), UASt‐ManII‐Venus (F. Yu), UASt‐Msps FL , UAS‐patronin RNAi (18,462 (Ra‐1); F.Yu), patronin sk1 (F. Yu), patronin sk8 (F. Yu), patronin EY05252 (F. Yu), patronin e00176 (F. Yu), UAS‐Venus‐Patronin (F. Yu), UASp‐Venus‐Patronin ΔCKK (F. Yu), UASp‐Venus‐Patronin CKK (F. Yu), and UASp‐EBI‐GFP (F. Yu).
The following stocks were obtained from Bloomington Drosophila Stock Center (BDSC): UAS‐sec71 RNAi (BDSC#32366), UAS‐E‐cad RNAi (BDSC#32904) and UAS‐E‐cad RNAi (BDSC#38207). The following stocks were obtained from Vienna Drosophila Resource Center (VDRC): UAS‐arf1 RNAi (23082GD), UAS‐arf1 RNAi (103572KK), UAS‐sec71 RNAi (100300KK), UAS‐msps RNAi (21982GD), and UAS‐patronin RNAi (108927KK). UAS‐ β‐Gal RNAi (BDSC#50680) is often used as a control UAS element to balance the total number of UAS elements in each genotype. All arf1, sec71, msps, and patronin RNAi lines knockdown efficiency in larval brains was verified by immunostaining of anti‐Arf1, anti‐Sec71, anti‐Msps, and anti‐Patronin antibodies. Various RNAi knockdown or overexpression constructs were induced using grh‐Gal4 or insc‐Gal4 unless otherwise stated.
All experiments were carried out at 25°C, except for RNAi knockdown or overexpression studies that were performed at 29°C, unless otherwise indicated.
EdU (5‐ethynyl‐2′‐deoxyuridine) incorporation assay
Larvae of various genotypes were fed with food supplemented with 0.2 mM EdU from ClickiT® EdU Imaging Kits (Invitrogen) for 4 h. The larval brains were dissected in PBS and fixed with 4% EM‐grade formaldehyde in PBS for 22 min, followed by washing thrice (each wash for 10 min) with 0.3% PBST, and blocked with 3% BSA in PBST for 30 min. The incorporated EdU was detected by Alexa Fluor azide, according to the Click‐iT EdU protocol (Invitrogen). The brains were rinsed twice and subjected to standard immunohistochemistry.
Immunohistochemistry
Drosophila larvae were dissected in PBS, and the larval brains were fixed in 4% EM‐grade formaldehyde in PBT (PBS + 0.3% Triton‐100) for 22 min. The samples were processed for immunostaining as previously described (Li et al, 2017). For α‐tubulin immunohistochemistry, the larvae were dissected in Shield and Sang M3 medium (Sigma‐Aldrich) supplemented with 10% FBS, followed by fixation in 10% formaldehyde in Testis buffer (183 mM KCl, 47 mM NaCl, 10 mM Tris–HCl, and 1 mM EDTA, pH 6.8) supplemented with 0.01% Triton X‐100. The fixed brains were washed once in PBS and twice in 0.1% Triton X‐100 in PBS. Images were taken using LSM710 confocal microscope system (Axio Observer Z1; ZEISS), fitted with a PlanApochromat 40×/1.3 NA oil differential interference contrast objective, and brightness and contrast were adjusted by Photoshop CS6.
The primary antibodies used in this paper were guinea pig anti‐Dpn (1:1,000), rabbit anti‐Dpn (1:200), mouse anti‐Mira (1:50, F. Matsuzaki), rabbit anti‐GFP (1:3,000; F. Yu), mouse anti‐GFP (1:3,000; F. Yu), rabbit anti‐RFP (1:2,000; abcam, Cat#62341), mouse anti‐Patronin N3 (1:250, F. Yu), rabbit anti‐Msps (1:500), rabbit anti‐Msps (1:1,000, J. Raff), rat anti‐E‐cadherin (1:20, DCAD2, DSHB), mouse anti‐β‐Gal (1:1,000, Promega, Cat#: Z3781), mouse anti‐Sec71 (1:100, F. Yu), rabbit anti‐GM130 (1:200, Abcam ab52649), guinea pig anti‐Arf1 (1:200, F. Yu), rabbit anti‐Flag (1:1,000; Sigma‐Aldrich), mouse anti‐Myc (1:1,000; abcam), and rabbit anti‐HA (1:1,000, Sigma‐Aldrich). The secondary antibodies used were conjugated with Alexa Fluor 488, 555 or 647 (Jackson laboratory).
Laser ablation of quiescent NSCs
Larval brains of various genotypes expressing UAS‐mCD8‐GFP under grh‐Gal4 at various time points were dissected in Shield and Sang M3 insect medium (Sigma‐Aldrich) supplemented with 10% FBS. The ex vivo larval brain explant culture was supplied with fat body from wild‐type third instar and live imaging of the larval brains were performed with a Nikon A1R MP laser scanning confocal microscope using 40× objective lens and Zoom factor 5. Quiescent NSCs with protrusions attached to the neuropil were chosen and imaged for about 10–30 s (1 s/frame) before ablation. Quiescent NSCs were hit by 355 nm UV picolaser at 70–80 nW power for 1–2 s to cause injury (Hara et al, 2016). After injury, quiescent NSCs were imaged again for 10–30 s followed by time‐lapse imaging for at least 20 min (1 min/frame, 7–10 z‐stacks with 0.5–0.8‐μm intervals). The movies and images were made and analyzed with NIH ImageJ software.
In vivo imaging and ablation were done using whole larvae, which were placed in a single‐layer PDMS microfluidic device, a vacuum was applied via a syringe to immobilize the animal (Mishra et al, 2014).
Recoil velocity or cell response after ablation (μm/s) was calculated by measuring the difference in length over time between the length of the entire quiescent NSC right before ablation and 1–2 s right after ablation. The length of the gap over time and fluorescence recovery over time was analyzed with the NIH ImageJ software.
Fluorescence recovery after photobleaching (FRAP)
Image acquisition and FRAP measurements were performed on a Nikon A1R MP laser scanning confocal microscope using 40× objective lens and Zoom factor 5. Photo‐bleaching was achieved by focusing 25% 488 nm laser for 8 s on the selected ROI in the middle of the protrusion. Fluorescent images of the cells were acquired before and after photobleaching by time‐lapse imaging of quiescent NSCs every 1 s for 5 min. Measurements of recoil velocity, length of the gap recovered, and fluorescence intensity recovery over time in regions of the cell that were photobleached were performed similarly to the laser ablation methodology.
Tracking of EB1‐GFP comets
Larval brains of various genotypes expressing EB1‐GFP under grh‐Gal4 at various time points were dissected in Shield and Sang M3 insect medium (Sigma‐Aldrich) supplemented with 10% FBS. The larval brain explant culture was supplied with the fat body from wild‐type third instar and live imaging of the larval brains were performed with LSM710 confocal microscope system using 40× Oil lens and Zoom factor 6. The brains were imaged for 151 s, with 83 frames acquired for each movie and the images were analyzed with NIH ImageJ software. The velocity of the EB1‐GFP comets were calculated, and kymographs were generated using KymoButler (Jakobs et al, 2019). The general cutoff for selected tracks is as follows: sensitivity threshold for track detection −0.2 and minimum size of detected objects (pixels) ‐3, minimum number of consecutive frames per track −3, pixel size in μm (optional) ‐1 frame rate in seconds (optional). 1 by default. ‐1. The starting points of the tracks are at the base of the PIS region where the protrusion is extended from the cell body. For EB1 comets arising from Golgi, the larval brains were imaged for 90 s with 50 frames acquired for each movie. The tracking of EB1 comets were done manually using NIH ImageJ software.
Cell lines, transfection, and co‐immunoprecipitation
Drosophila S2 cells (CVCL_Z232) originally from William Chia's laboratory (with a non‐authenticated identity but have been used in the laboratory for the past 10 years) were cultured in Express Five serum‐free medium (Gibco) supplemented with 2 mM Glutamine (Thermo Fisher Scientific). The S2 cell culture used in this study is free of mycoplasma contamination, inferred by the absence of small speckles of DAPI staining outside of the cell nucleus. For transient expression of proteins, S2 cells were transfected using Effectene Transfection Reagent (QIAGEN) according to the manufacturer's protocol. S2 cells were used for RNAi, PLA, and BiFC assays.
For RNAi experiments, Drosophila S2 cells were cultured and incubated with dsRNA and GFP‐α‐tubulin plasmid (Gohta Goshima) as previously described (Goshima & Vale, 2003; Goodwin & Vale, 2010). Here, cells were treated with dsRNA for 2 days and analyzed at day 5.
Generation of transgenic flies
UAS‐NYFP‐Myc‐Arf1, UAS‐NYFP‐Myc‐Arf1T31N, UAS‐NYFP‐Myc‐Arf1Q71L, UAS‐NYFP‐Myc‐Patronin, and UAS‐CYFP‐HA‐Patronin transgenic flies were generated by P‐element‐mediated transformation (BestGene Inc.). BDSC 8622 [yw; P{CaryP}attP2] was used as the injection stock for site‐specific insertion of UAS‐NYFP‐Myc‐Arf1, UAS‐NYFP‐Myc‐Arf1T31N, UAS‐NYFP‐Myc‐Arf1Q71L, UAS‐NYFP‐Myc‐Patronin, and UAS‐CYFP‐HA‐Patronin into chromosomal location 68A4 (BestGene Inc.).
Bimolecular fluorescence complementation
In vitro bimolecular fluorescence complementation (BiFC) assay (Gohl et al, 2010) was performed using S2 cells. 1 × 10⁶ cells were seeded onto Poly‐L‐lysine‐coated coverslips (Iwaki) and were transfected with act‐Gal4 and the BiFC constructs each at 0.2 μg per well, respectively, using Effectene Transfection Reagent (QIAGEN). The following BiFC constructs were used to test interactions between Patronin, and Arf1: UASt‐CYFP‐Patronin, UASt‐CYFP‐PatroninCC, UASt‐CYFP‐PatroninCH, UASt‐CYFP‐PatroninCKK, UASt‐CYFP‐PatroninΔCH, UASt‐CYFP‐PatroninΔCKK, UASt‐NYFP‐Myc‐Arf1, UASt‐NYFP‐Myc‐Arf1Q71L, UASt‐NYFP‐Myc‐Arf1T31N, UASt‐CYFP‐HA, and UASt‐NYFP‐Myc. At 48 h after transfection, the growth medium was removed, and the cells were rinsed with cold PBS before fixing them with 4% EM grade formaldehyde in PBS for 15 min. The fixed S2 cells were rinsed three times with PBS‐T (1×PBS + 0.1% Triton‐X100) and blocked with 5% BSA in PBS‐T for 1 h, before incubating them with primary antibodies at room temperature (RT) for 2 h. Following incubation, the cells were rinsed three times with PBS‐T and were incubated with secondary antibodies in PBS‐T for 1 h at RT. Coverslips coated with immuno‐stained S2 cells were mounted onto glass slides using vector shield (Vector Laboratory) for confocal microscopy.
In vivo bimolecular fluorescence complementation was performed by expressing the BiFC vectors and constructs using insc‐Gal4. Crosses were set up and incubated at 18°C. Larvae were aged for 16 h ALH after which larvae were dissected and processed for immunohistochemistry staining.
Proximity ligation assay (PLA)
PLA is based on the following principle: secondary antibodies conjugated with a PLA PLUS or PLA MINUS probe bind to anti‐Flag and anti‐Myc antibodies, respectively. During ligation, connector oligos hybridize to PLA probes and T4 ligases catalyze to form a circularized template. DNA polymerase amplifies the circularized template, which is bound by fluorescently‐labeled complementary oligos, allowing the interaction to be observed as PLA foci within the cells (Adopted from Duolink PLA, Merck). PLA was performed on S2 cells that were transfected with the following plasmids using Effectene Transfection Reagent (QIAGEN): control Myc, control Flag, control HA, Flag‐Patronin, Myc‐Patronin, Myc‐PatroninCC, Myc‐PatroninCH, Myc‐PatroninCKK, Myc‐PatroninΔCH, Myc‐PatroninΔCKK, Flag‐Arf1WT, HA‐Arf1Q71L, and HA‐Arf1T31N. The cells were washed thrice with cold PBS, fixed with 4% EM‐grade formaldehyde in PBS for 15 min, and blocked in 5% BSA in PBS‐T (0.1% Triton‐X100) for 45 min. The cells were then incubated with primary antibodies at RT for 2 h before proceeding with Duolink PLA (Sigma‐Aldrich) according to the manufacturer's protocol. After incubation with primary antibodies, the cells were incubated with PLA probes at 37°C for 1 h. They were then washed twice with Buffer A for 5 min, each at RT, followed by ligation of probes at 37°C for 30 min. Amplification was performed at 37°C for 100 min, followed by two washes with Buffer B, each for 10 min, at RT. The cells were washed once with 0.01× Buffer B before incubating with primary antibodies diluted in 3% BSA in PBS for 2 h at RT. Following this, the cells were washed twice with 0.1% PBS‐T and incubated with secondary antibodies for 1.5 h at RT, before mounting them with in situ mounting media with DAPI (Duolink, Sigma‐Aldrich).
Quantification and statistical analysis
Drosophila larval brains from various genotypes were placed dorsal side up on confocal slides. Confocal z‐stacks were taken from the surface to the deep layers of the larval brains (20–30 slides per z‐stack with 2 or 3 μm intervals). For each genotype, all experiments were performed with a minimum of two biological replicates. In total, a minimum of six brain lobes were imaged for z‐stacks and Image J or Zen software's was used for quantification.
Statistical analysis was performed using GraphPad Prism 8. Unpaired two‐tailed t‐tests were used for the comparison of two sample groups and one‐way ANOVA or two‐way ANOVA followed by Sidak's multiple comparisons test for the comparison of more than two sample groups. All data are shown as mean ± SD. Statistically nonsignificant (ns) *denotes P > 0.05, ** denotes P > 0.01, ** denotes P > 0.001, and **** denotes P < 0.0001.
Author contributions
Mahketa R Gujar: Conceptualization; data curation; formal analysis; methodology; writing – original draft; writing – review and editing. Yang Gao: Data curation; formal analysis. Xiang Teng: Data curation; formal analysis. Wei Yung Ding: Data curation; formal analysis. Jiaen Lin: Data curation; formal analysis. Ye Sing Tan: Data curation; formal analysis. Liang Yuh Chew: Data curation; formal analysis. Yusuke Toyama: Resources; supervision; funding acquisition. Hongyan Wang: Conceptualization; resources; supervision; funding acquisition; writing – original draft; writing – review and editing.
Disclosure and competing interests statement
The authors declare no competing interests.
Supporting information
Appendix S1
Expanded View Figures PDF
Movie EV1
Movie EV2
Movie EV3
Movie EV4
Movie EV5
Movie EV6
Movie EV7
Movie EV8
Movie EV9
Movie EV10
Movie EV11
Movie EV12
Movie EV13
Movie EV14
Movie EV15
Movie EV16
Movie EV17
Movie EV18
Movie EV19
Movie EV20
Movie EV21
Movie EV22
Movie EV23
Movie EV24
Movie EV25
Movie EV26
Movie EV27
Movie EV28
Movie EV29
Movie EV30
Movie EV31
Movie EV32
Movie EV33
Source Data for Expanded View and Appendix
PDF+
Source Data for Figure 1
Source Data for Figure 2
Source Data for Figure 3
Source Data for Figure 4
Source Data for Figure 5
Source Data for Figure 6
Source Data for Figure 7
Acknowledgments
We thank F. Yu, G. Goshima, C. Gonzalez, J. Raff, T. Lee, F Matsuzaki, W. Chia, and the Bloomington Drosophila Stock Center, Vienna Drosophila Resource Center, Kyoto Stock Centre DGGR, and the Developmental Studies Hybridoma Bank for fly stocks and antibodies. This work is supported by the Ministry of Health‐Singapore National Medical Research Council MOH‐000143 (MOH‐OFIRG18may‐0004) to H.W. and Ministry of Education Tier 2 MOE‐T2EP30220‐0016 to Y.T.
EMBO reports (2023) 24: e56624
Data availability
All data generated or analyzed during this study are included in the manuscript. This study includes no data deposited in external repositories.
References
- Akhmanova A, Hoogenraad CC (2015) Microtubule minus‐end‐targeting proteins. Curr Biol 25: R162–R171 [DOI] [PubMed] [Google Scholar]
- Arsenijevic Y, Weiss S, Schneider B, Aebischer P (2001) Insulin‐like growth factor‐I is necessary for neural stem cell proliferation and demonstrates distinct actions of epidermal growth factor and fibroblast growth factor‐2. J Neurosci 21: 7194–7202 [DOI] [PMC free article] [PubMed] [Google Scholar]
- Baines AJ, Bignone PA, King MDA, Maggs AM, Bennett PM, Pinder JC, Phillips GW (2009) The CKK domain (DUF1781) binds microtubules and defines the CAMSAP/ssp4 family of animal proteins. Mol Biol Evol 26: 2005–2014 [DOI] [PubMed] [Google Scholar]
- Baser A, Skabkin M, Martin‐Villalba A (2017) Neural stem cell activation and the role of protein synthesis. Brain Plast 3: 27–41 [DOI] [PMC free article] [PubMed] [Google Scholar]
- Bostock MP, Prasad AR, Chaouni R, Yuen AC, Sousa‐Nunes R, Amoyel M, Fernandes VM (2020) An immobilization technique for long‐term time‐lapse imaging of explanted Drosophila tissues. Front Cell Dev Biol 8: 590094 [DOI] [PMC free article] [PubMed] [Google Scholar]
- Britton JS, Edgar BA (1998) Environmental control of the cell cycle in Drosophila: nutrition activates mitotic and endoreplicative cells by distinct mechanisms. Development 125: 2149–2158 [DOI] [PubMed] [Google Scholar]
- Chell JM, Brand AH (2010) Nutrition‐responsive glia control exit of neural stem cells from quiescence. Cell 143: 1161–1173 [DOI] [PMC free article] [PubMed] [Google Scholar]
- Chuang M, Goncharov A, Wang S, Oegema K, Jin Y, Chisholm AD (2014) The microtubule minus‐end‐binding protein patronin/PTRN‐1 is required for axon regeneration in C. elegans . Cell Rep 9: 874–883 [DOI] [PMC free article] [PubMed] [Google Scholar]
- Cloetta D, Thomanetz V, Baranek C, Lustenberger RM, Lin S, Oliveri F, Atanasoski S, Ruegg MA (2013) Inactivation of mTORC1 in the developing brain causes microcephaly and affects gliogenesis. J Neurosci 33: 7799–7810 [DOI] [PMC free article] [PubMed] [Google Scholar]
- De Camilli P, Moretti M, Donini SD, Walter U, Lohmann SM (1986) Heterogeneous distribution of the cAMP receptor protein RII in the nervous system: evidence for its intracellular accumulation on microtubules, microtubule‐organizing centers, and in the area of the Golgi complex. J Cell Biol 103: 189–203 [DOI] [PMC free article] [PubMed] [Google Scholar]
- Deng Q, Tan YS, Chew LY, Wang H (2021) Msps governs acentrosomal microtubule assembly and reactivation of quiescent neural stem cells. EMBO J 40: e104549 [DOI] [PMC free article] [PubMed] [Google Scholar]
- Ding WY, Huang J, Wang H (2020) Waking up quiescent neural stem cells: molecular mechanisms and implications in neurodevelopmental disorders. PLoS Genet 16: e1008653 [DOI] [PMC free article] [PubMed] [Google Scholar]
- Ding R, Weynans K, Bossing T, Barros CS, Berger C (2016) The Hippo signalling pathway maintains quiescence in Drosophila neural stem cells. Nat Commun 7. 10.1038/ncomms10510 [DOI] [PMC free article] [PubMed] [Google Scholar]
- Doetsch F, Caille I, Lim DA, Garcia‐Verdugo JM, Alvarez‐Buylla A (1999) Subventricular zone astrocytes are neural stem cells in the adult mammalian brain. Cell 97: 703–716 [DOI] [PubMed] [Google Scholar]
- Fabel K, Kempermann G (2008) Physical activity and the regulation of neurogenesis in the adult and aging brain. Neuromolecular Med 10: 59–66 [DOI] [PubMed] [Google Scholar]
- Feng C, Thyagarajan P, Shorey M, Seebold DY, Weiner AT, Albertson RM, Rao KS, Sagasti A, Goetschius DJ, Rolls MM (2019) Patronin‐mediated minus end growth is required for dendritic microtubule polarity. J Cell Biol 218: 2309–2328 [DOI] [PMC free article] [PubMed] [Google Scholar]
- Fredriksson S, Gullberg M, Jarvius J, Olsson C, Pietras K, Gustafsdottir SM, Ostman A, Landegren U (2002) Protein detection using proximity‐dependent DNA ligation assays. Nat Biotechnol 20: 473–477 [DOI] [PubMed] [Google Scholar]
- Gil‐Ranedo J, Gonzaga E, Jaworek KJ, Berger C, Bossing T, Barros CS (2019) STRIPAK members orchestrate hippo and insulin receptor signaling to promote neural stem cell reactivation. Cell Rep 27: 2921–2933 [DOI] [PMC free article] [PubMed] [Google Scholar]
- Gohl C, Banovic D, Grevelhorster A, Bogdan S (2010) WAVE forms hetero‐ and homo‐oligomeric complexes at integrin junctions in Drosophila visualized by bimolecular fluorescence complementation. J Biol Chem 285: 40171–40179 [DOI] [PMC free article] [PubMed] [Google Scholar]
- Goodwin SS, Vale RD (2010) Patronin regulates the microtubule network by protecting microtubule minus ends. Cell 143: 263–274 [DOI] [PMC free article] [PubMed] [Google Scholar]
- Goshima G, Vale RD (2003) The roles of microtubule‐based motor proteins in mitosis: comprehensive RNAi analysis in the Drosophila S2 cell line. J Cell Biol 162: 1003–1016 [DOI] [PMC free article] [PubMed] [Google Scholar]
- Gujar MR, Gao Y, Teng X, Deng Q, Lin KY, Tan YS, Toyama Y, Wang H (2023) Golgi-dependent reactivation and regeneration of Drosophila quiescent neural stem cells. Developmental Cell. (In press) [DOI] [PubMed] [Google Scholar]
- Gujar MR, Gao Y, Teng X, Deng Q, Tan YS, Toyama Y, Wang H (2022) Golgi‐dependent reactivation and regeneration of quiescent neural stem cells. bioRxiv 10.1101/2022.08.22.504877 [PREPRINT] [DOI] [PubMed]
- Hara Y, Shagirov M, Toyama Y (2016) Cell boundary elongation by non‐autonomous contractility in cell oscillation. Curr Biol 26: 2388–2396 [DOI] [PubMed] [Google Scholar]
- Hendershott MC, Vale RD (2014) Regulation of microtubule minus‐end dynamics by CAMSAPs and Patronin. Proc Natl Acad Sci U S A 111: 5860–5865 [DOI] [PMC free article] [PubMed] [Google Scholar]
- Horton AC, Racz B, Monson EE, Lin AL, Weinberg RJ, Ehlers MD (2005) Polarized secretory trafficking directs cargo for asymmetric dendrite growth and morphogenesis. Neuron 48: 757–771 [DOI] [PubMed] [Google Scholar]
- Huang J, Wang H (2018) Hsp83/Hsp90 physically associates with insulin receptor to promote neural stem cell reactivation. Stem Cell Reports 11: 883–896 [DOI] [PMC free article] [PubMed] [Google Scholar]
- Isshiki T, Pearson B, Holbrook S, Doe CQ (2001) Drosophila neuroblasts sequentially express transcription factors which specify the temporal identity of their neuronal progeny. Cell 106: 511–521 [DOI] [PubMed] [Google Scholar]
- Ito K, Hotta Y (1992) Proliferation pattern of postembryonic neuroblasts in the brain of Drosophila melanogaster . Dev Biol 149: 134–148 [DOI] [PubMed] [Google Scholar]
- Jakobs MA, Dimitracopoulos A, Franze K (2019) KymoButler, a deep learning software for automated kymograph analysis. Elife 8: e42288 [DOI] [PMC free article] [PubMed] [Google Scholar]
- Jiang K, Hua S, Mohan R, Grigoriev I, Yau KW, Liu Q, Katrukha EA, Altelaar AF, Heck AJ, Hoogenraad CC et al (2014) Microtubule minus‐end stabilization by polymerization‐driven CAMSAP deposition. Dev Cell 28: 295–309 [DOI] [PubMed] [Google Scholar]
- Juanes M, Guercio G, Marino R, Berensztein E, Warman DM, Ciaccio M, Gil S, Bailez M, Rivarola MA, Belgorosky A (2015) Three novel IGF1R mutations in microcephalic patients with prenatal and postnatal growth impairment. Clin Endocrinol (Oxf) 82: 704–711 [DOI] [PubMed] [Google Scholar]
- Lai SL, Doe CQ (2014) Transient nuclear Prospero induces neural progenitor quiescence. Elife 3: e03363 [DOI] [PMC free article] [PubMed] [Google Scholar]
- Li S, Koe CT, Tay ST, Tan ALK, Zhang S, Zhang Y, Tan P, Sung WK, Wang H (2017) An intrinsic mechanism controls reactivation of neural stem cells by spindle matrix proteins. Nat Commun 8: 122 [DOI] [PMC free article] [PubMed] [Google Scholar]
- Lucassen PJ, Meerlo P, Naylor AS, van Dam AM, Dayer AG, Fuchs E, Oomen CA, Czeh B (2010) Regulation of adult neurogenesis by stress, sleep disruption, exercise and inflammation: implications for depression and antidepressant action. Eur Neuropsychopharmacol 20: 1–17 [DOI] [PubMed] [Google Scholar]
- Ly PT, Tan YS, Koe CT, Zhang Y, Xie G, Endow S, Deng WM, Yu F, Wang H (2019) CRL4Mahj E3 ubiquitin ligase promotes neural stem cell reactivation. PLoS Biol 17: e3000276. 10.1371/journal.pbio.3000276 [DOI] [PMC free article] [PubMed] [Google Scholar]
- Mairet‐Coello G, Tury A, DiCicco‐Bloom E (2009) Insulin‐like growth factor‐1 promotes G(1)/S cell cycle progression through bidirectional regulation of cyclins and cyclin‐dependent kinase inhibitors via the phosphatidylinositol 3‐kinase/Akt pathway in developing rat cerebral cortex. J Neurosci 29: 775–788 [DOI] [PMC free article] [PubMed] [Google Scholar]
- Marcette JD, Chen JJ, Nonet ML (2014) The Caenorhabditis elegans microtubule minus‐end binding homolog PTRN‐1 stabilizes synapses and neurites. Elife 3: e01637 [DOI] [PMC free article] [PubMed] [Google Scholar]
- Martin M, Akhmanova A (2018) Coming into focus: mechanisms of microtubule minus‐end organization. Trends Cell Biol 28: 574–588 [DOI] [PubMed] [Google Scholar]
- Mishra B, Ghannad-Rezaie M, Li J, Wang X, Hao Y, Ye B, Chronis N, Collins CA (2014) Using microfluidics chips for live imaging and study of injury responses in Drosophila larvae . J Vis Exp e50998. 10.3791/50998 [DOI] [PMC free article] [PubMed] [Google Scholar]
- Morshead CM, Reynolds BA, Craig CG, McBurney MW, Staines WA, Morassutti D, Weiss S, van der Kooy D (1994) Neural stem cells in the adult mammalian forebrain: a relatively quiescent subpopulation of subependymal cells. Neuron 13: 1071–1082 [DOI] [PubMed] [Google Scholar]
- Nashchekin D, Fernandes AR, St Johnston D (2016) Patronin/shot cortical foci assemble the noncentrosomal microtubule array that specifies the Drosophila anterior‐posterior axis. Dev Cell 38: 61–72 [DOI] [PMC free article] [PubMed] [Google Scholar]
- Ori‐McKenney KM, Jan LY, Jan YN (2012) Golgi outposts shape dendrite morphology by functioning as sites of acentrosomal microtubule nucleation in neurons. Neuron 76: 921–930 [DOI] [PMC free article] [PubMed] [Google Scholar]
- Otsuki L, Brand AH (2018) Cell cycle heterogeneity directs the timing of neural stem cell activation from quiescence. Science 360: 99–102 [DOI] [PMC free article] [PubMed] [Google Scholar]
- Otsuki L, Brand AH (2020) Quiescent neural stem cells for brain repair and regeneration: lessons from model systems. Trends Neurosci 43: 213–226 [DOI] [PubMed] [Google Scholar]
- Panzade S, Matis M (2021) The microtubule minus‐end binding protein Patronin is required for the epithelial remodeling in the Drosophila abdomen. Front Cell Dev Biol 9: 682083 [DOI] [PMC free article] [PubMed] [Google Scholar]
- Poon CL, Mitchell KA, Kondo S, Cheng LY, Harvey KF (2016) The hippo pathway regulates neuroblasts and brain size in Drosophila melanogaster . Curr Biol 26: 1034–1042. 10.1016/j.cub.2016.02.009 [DOI] [PubMed] [Google Scholar]
- Richardson CE, Spilker KA, Cueva JG, Perrino J, Goodman MB, Shen K (2014) PTRN‐1, a microtubule minus end‐binding CAMSAP homolog, promotes microtubule function in Caenorhabditis elegans neurons. Elife 3: e01498 [DOI] [PMC free article] [PubMed] [Google Scholar]
- Shyu YJ, Hu CD (2008) Fluorescence complementation: an emerging tool for biological research. Trends Biotechnol 26: 622–630 [DOI] [PubMed] [Google Scholar]
- Sousa‐Nunes R, Yee LL, Gould AP (2011) Fat cells reactivate quiescent neuroblasts via TOR and glial insulin relays in Drosophila . Nature 471: 508–512 [DOI] [PMC free article] [PubMed] [Google Scholar]
- Speder P, Brand AH (2014) Gap junction proteins in the blood‐brain barrier control nutrient‐dependent reactivation of Drosophila neural stem cells. Dev Cell 30: 309–321 [DOI] [PMC free article] [PubMed] [Google Scholar]
- Tanaka N, Meng W, Nagae S, Takeichi M (2012) Nezha/CAMSAP3 and CAMSAP2 cooperate in epithelial‐specific organization of noncentrosomal microtubules. Proc Natl Acad Sci U S A 109: 20029–20034 [DOI] [PMC free article] [PubMed] [Google Scholar]
- Truman JW, Bate M (1988) Spatial and temporal patterns of neurogenesis in the central nervous system of Drosophila melanogaster . Dev Biol 125: 145–157 [DOI] [PubMed] [Google Scholar]
- Tsuji T, Hasegawa E, Isshiki T (2008) Neuroblast entry into quiescence is regulated intrinsically by the combined action of spatial Hox proteins and temporal identity factors. Development 135: 3859–3869 [DOI] [PubMed] [Google Scholar]
- Wang Y, Zhang H, Shi M, Liou YC, Lu L, Yu F (2017) Sec71 functions as a GEF for the small GTPase Arf1 to govern dendrite pruning of Drosophila sensory neurons. Development 144: 1851–1862 [DOI] [PubMed] [Google Scholar]
- Wang Y, Rui M, Tang Q, Bu S, Yu F (2019) Patronin governs minus‐end‐out orientation of dendritic microtubules to promote dendrite pruning in Drosophila . Elife 8: e39964 [DOI] [PMC free article] [PubMed] [Google Scholar]
- Wu J, de Heus C, Liu Q, Bouchet BP, Noordstra I, Jiang K, Hua S, Martin M, Yang C, Grigoriev I et al (2016) Molecular pathway of microtubule Organization at the Golgi Apparatus. Dev Cell 39: 44–60 [DOI] [PubMed] [Google Scholar]
- Yan YP, Sailor KA, Vemuganti R, Dempsey RJ (2006) Insulin‐like growth factor‐1 is an endogenous mediator of focal ischemia‐induced neural progenitor proliferation. Eur J Neurosci 24: 45–54 [DOI] [PubMed] [Google Scholar]
- Yang SZ, Wildonger J (2020) Golgi outposts locally regulate microtubule orientation in neurons but are not required for the overall polarity of the dendritic cytoskeleton. Genetics 215: 435–447 [DOI] [PMC free article] [PubMed] [Google Scholar]
- Yau KW, van Beuningen SF, Cunha‐Ferreira I, Cloin BM, van Battum EY, Will L, Schatzle P, Tas RP, van Krugten J, Katrukha EA et al (2014) Microtubule minus‐end binding protein CAMSAP2 controls axon specification and dendrite development. Neuron 82: 1058–1073 [DOI] [PubMed] [Google Scholar]
- Zheng Y, Buchwalter RA, Zheng C, Wight EM, Chen JV, Megraw TL (2020) A perinuclear microtubule‐organizing Centre controls nuclear positioning and basement membrane secretion. Nat Cell Biol 22: 297–309 [DOI] [PMC free article] [PubMed] [Google Scholar]
- Zhou W, Chang J, Wang X, Savelieff MG, Zhao Y, Ke S, Ye B (2014) GM130 is required for compartmental organization of dendritic golgi outposts. Curr Biol 24: 1227–1233 [DOI] [PMC free article] [PubMed] [Google Scholar]
- Zhou Z, Xu H, Li Y, Yang M, Zhang R, Shiraishi A, Kiyonari H, Liang X, Huang X, Wang Y et al (2020) CAMSAP1 breaks the homeostatic microtubule network to instruct neuronal polarity. Proc Natl Acad Sci U S A 117: 22193–22203 [DOI] [PMC free article] [PubMed] [Google Scholar]