Abstract
Assessing fetal development is essential to the provision of healthcare for both mothers and fetuses. In low- and middle-income countries, conditions that increase the risk of fetal growth restriction (FGR) are often more prevalent. In these regions, barriers to accessing healthcare and social services exacerbate fetal maternal health problems. One of these barriers is the lack of affordable diagnostic technologies. To address this issue, this work introduces an end-to-end algorithm applied to a low-cost, hand-held Doppler ultrasound device for estimating gestational age (GA), and by inference, FGR. The Doppler ultrasound signals used in this study were collected from 226 pregnancies (45 low birth weight at delivery) between 5 and 9 months GA by lay midwives in highland Guatemala. We designed a hierarchical deep sequence learning model with an attention mechanism to learn the normative dynamics of fetal cardiac activity in different stages of development. This resulted in a state-of-the-art GA estimation performance, with an average error of 0.79 months. This is close to the theoretical minimum for the given quantization level of one month. The model was then tested on Doppler recordings of the fetuses with low birth weight and the estimated GA was shown to be lower than the GA calculated from last menstruation. Thus, this could be interpreted as a potential sign of developmental retardation (or FGR) associated with low birth weight, and referral and intervention may be necessary.
Keywords: Hierarchical attention network, fetal gestational age, 1D-Doppler, machine learning
I. Introduction
Every year about twenty million infants are born globally with low birth weight (LBW) (less than 2500g), and the majority are born in low-and middle-income countries (LMICs) [1]. LBW can result from fetal growth restriction (FGR) or preterm birth. Fetuses with FGR conditions are more vulnerable to mortality and morbidity in the neonatal period and beyond. Therefore, early prediction of FGR could help manage the condition and lower mortality risk. Accurate estimation of gestational age (GA) using cardiac patterns can help with assessing fetal development, preterm birth management, identifying infants at risk for adverse health outcomes as well as delivery scheduling [2], [3].
Medical technologies for monitoring fetal and maternal health is not equally accessible to all. Almost half of women in LMICs do not receive adequate antenatal care, and worldwide an estimated two million early neonatal deaths occur annually in these areas primarily due to lack of access to quality care [4], [5]. In high-income countries ultrasound imaging is currently most frequently used for fetal health monitoring and estimating GA. Nonetheless, the cost of purchase, the technical skills required for maintenance and the user-dependent accuracy have limited the application of this technique in resource-limited settings [6]. Therefore, low-cost alternative methods are used in LMICs to estimate GA. A common method used for GA estimation is the last menstrual period (LMP), in which a 28-days menstrual cycle is assumed (Naegele’s rule) [7]. Although, some studies have criticized LMP due to the inconsistency in the menstrual cycle length [8] and the difficulty to recall the day of the last menstrual period [9], LMP-based GA estimation has been shown to be a useful method and clinically preferred for fetal dating in rural areas lacking medical equipment. Specifically, a study conducted in Bangladesh showed that LMP is a highly feasible estimate of GA if early antenatal ultrasound is unavailable [10]. In another study in Vietnam [11], the comparison of LMP based GA and Farr neonatal examination with ultrasound was provided. Farr is a method of assessing GA of a newborns by measuring certain physical characteristics such as skin texture, skin color and skull hardness [12]. They showed that LMP can provide a more accurate estimate of GA [11]. The validity of LMP-based GA estimation method was also tested in rural Guatemala [13] by comparing this method with the Capurro neonatal examination [14], [15] and the symphysis-fundus height [16]. The Capurro method is based on physical and neuromuscular criteria including skin texture, ear shape and head lag. The results suggested that, when trained field personnel assist women to recall their date of LMP, this date provides the best estimate of GA [13].
Fetal cardiac function assessment is a promising approach to identify high-risk fetuses [17]. The Autonomic nervous system (ANS) evolves during pregnancy and regulates fetal heart rate (FHR) [18], [19], which modifies FHR dynamics during pregnancy. Therefore, FHR is associated with fetal development and GA, which could facilitate the detection of pathological fetal development [20]. Studies on the detection of growth restriction using FHR showed that FGR fetuses have a lower percentage of heart rate variability compared with the normal population [21].
Cardiotocography is an inexpensive Doppler-based method routinely performed during pregnancy for fetal heart monitoring. This technique provides continuous fetal heart rate using the data recorded by an ultrasound transducer for a period of 10–60 minutes. Fetal heart rate estimation is based on using autocorrelation over a specific window, which is generally every 3.75 seconds. However, it has low specificity and is endowed with an auto-correlation of the beats, reducing the estimated heart rate resolution. Another type of device for recording fetal cardiac activity using Doppler technology is in-home fetal Doppler transducers. This non-invasive and low-cost technique can be easily adapted to connect to mobile devices such as smartphones for recording and processing, motivating their use in mobile-health (mhealth) systems for risk screening in low-resource environments [22].
Using the Doppler technique, blood flow through the heart’s chambers and valves can be captured. Therefore, analyzing one dimensional Doppler ultrasound (1D-DUS) in the time and frequency domain provides valuable information regarding fetal cardiac functionality. However, despite all the advantages, the susceptibility to noise and movement makes the morphology of 1D-DUS signals highly variable which demonstrated both at intra- and inter-subject levels [23]. Therefore, learning heart rate patterns from 1D-DUS is challenging due to changes in the statistical characteristics of the signal.
In this study, we present a deep learning based method for estimating GA using fetal 1D-DUS recordings to assess fetal development and early identification of FGR conditions. FGR may develop at any time during pregnancy due to maternal, fetal, placental, or genetic complications. Notably, a common factor in most FGR pregnancies is a restriction of blood flow to the fetus. Therefore, FGR is associated with reduced fetal weight at any given GA or a categorization of ‘small for gestational age’ (SGA). SGA also refers to newborns with a birth weight below the 10th percentile for a given GA at birth. The first goal of this study was to develop an accurate GA estimation model using data recorded from individuals with normal birth weight (NBW). Next, we tested the model using the data in a LBW category expecting an underestimation of GA compared to LMP-based GA dating. Birth weight data were collected as part of the perinatal care program. The weight thresholds of 2.64kg for males and 2.57kg for females were used [24] to divide the data into normal and LBW individuals for the training/validation and testing phases.
The proposed machine learning pipeline is a hierarchical deep sequence learning model to estimate GA from fetal 1D-DUS recordings. This model was designed to process sequences of time-frequency domain features extracted from 1D-DUS recordings. The network consists of two levels of recurrent networks with an attention mechanism to learn the long and short-term variability in cardiac activity.
The main novel contributions of this research include:
The development of an end-to-end deep learning model to automatically estimate GA from 1D-DUS recordings is described. This approach mitigates challenges regarding 1D-DUS morphology variations and extraction of handcrafted features. In particular, the attention layer obviates the need for heuristics or hand-annotation of activity states to contextualize the variability.
The resulting model is robust to nonstationary changes in activity and noise by using a two-step attention mechanism and reducing the effect of low-quality segments. Some artifacts might be avoidable when recording physiological signals, but there are also inevitable artifacts due to the nature of the 1D-DUS technique (such as motion of the device, mother, or fetus). Therefore, designing a method which is robust to the effects of noise is essential.
We describe a comprehensive comparison and analysis using the largest cohort of raw 1D fetal Doppler data reported to-date. Different network structures and training approaches were investigated for noisy and unbalanced data to increase the generalizability of the proposed models for future studies on GA estimation.
A clinically interpretable model is derived from data recorded from normal and low birth weight individuals.
A. Related Work
As mentioned above, to estimate GA from cardiac activity, studies often use fetal heart rate variability (FHRV) metrics. Specifically, it has been shown that using FHRV parameters extracted from magnetocardiographic recordings as an input of the regression model, fetal maturation age can be assessed [25], [26]. However, this approach requires high resolution fetal magnetocardiographic recording which is costly and nonportable equipment, making its use in LMICs impractical. In addition, Marzbanrad et al. presented a method for estimating GA using a step-wise regression on cardiac wall intervals derived from 1D-DUS and fetal electrocardiagram (ECG) signals [27]. In further work, Marzbanrad et al. improved the estimation accuracy by incorporating 1D-DUS and fetal ECG quality assessment algorithms to filter poor quality signals [28]. Valderrama et al. presented a study on using FHRV indexes derived from 1D-DUS and maternal blood pressure to estimating GA using support vector regression using 10 minutes recordings [29]. Although previous Doppler based methods achieved significant results, they need additional recordings such as fetal ECG signals or maternal blood pressure, which increases costs and complicates the implementation, particularly in LMICs.
Deep learning models with the capability of automatic feature extraction provide a significant improvement in the processing of cardiac signals. Recent works on attention based models improved the interpretability and performance of the learning process in different applications [30], [31], [32], [33], [34]. To provide an interpretable model with high performance for automatic estimation of GA, in this study, we developed a deep learning model powered by hierarchical attention networks to process 1D-DUS signals captured by a low-cost transducer.
B. Limitations of GA Estimation in Low-resource Settings
In post-processing steps on clinical data acquired in high-income countries, we can discard the poor quality records, record them again or switch to a more reliable monitor. However, when we propose solutions for LMICs with limited and overloaded medical resources, misreported values, low-quality signals, and images become an integral part of the problem. Therefore, it is essential to consider these limitations in processing the data.
Data used in this work was collected as a part of a perinatal care program conducted in rural highland Guatemala. Midwives were trained to use a mobile app to record perinatal information during regular visits. As part of the project, the community health workers performed home visits with newly pregnant patients under midwife care. Community health workers also conducted a visit approximately one to two weeks after delivery to collect additional information on neonatal health and any perinatal or postnatal complications [35]. Therefore, in this study the birth weight was estimated using the weight gain percentage derived from the fitted weight curve, as described in our earlier work [24]. This affects the accuracy of identifying normal and low birth weight infants. The model presented in this study is based on GA derived from the LMP method (reported to the nearest month). LMP is a valid and highly-feasible estimate of the GA in low-resource settings even among preterm infants of 33 weeks or below [10]. However, it can also be affected by errors due to recalling the date of LMP or biologically associated errors.
II. Methods
A. Data Model
Let denote the time-series of a 1D-DUS signal with discrete time index , acquired during a clinical visit of a pregnant woman on date . The “true GA” at date is denoted , where is the date of conception, while the reported (LMP-estimated) GA is , where is the anticipated conception date. Therefore, the reported and true GA can be related as follows:
| (1) |
where is the GA presumption error, which without additional priors (such as 2D-Doppler) remains an unknown stochastic constant over pregnancy. The error accounts for rounding errors due to recording GA labels in months, lack of knowledge of the last menstrual period and uncertainties in the exact ovulation, intercourse and conception dates.
We denote the 2-dimensional scalogram feature extracted from the 1D-DUS by . The scalogram is constructed as a function of time and frequency based on the absolute value of the continuous wavelet transform of a signal. Mathematically, the continuous wavelet transform computes the inner products of a continuous signal with a set of continuous wavelets [36].
The objective is to design a deep network to estimate the true GA from a single or a set of 1D-DUS acquired during pregnancy, i.e.,
| (2) |
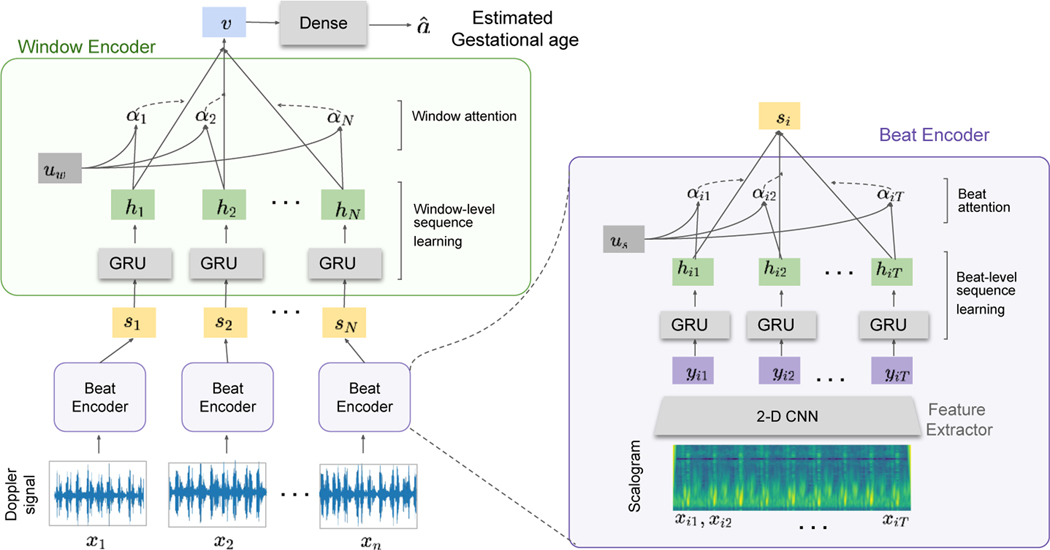
where is an estimate of the true GA, denote the dates that 1D-DUS is acquired from the pregnant woman, and denotes the 1D-DUS to GA transform that is learned by the neural network. The network gets the series of scalograms and has three components, feature extractor , beat encoder and window encoder , as shown in Fig. 1. The first level of the attention mechanism summarizes the extracted features from each scalogram matrix and maps them to the vector . The second attention layer is applied to hidden states ( to produced from to respectively) to emphasize the importance of each window. In this scheme, the LMP-estimated GA is used for model training.
Fig. 1:
The architecture of the proposed hierarchical attention network. It contains three main components: a) convolutional feature extractor, , b) beat encoder, , and c) window encoder, . The input Doppler signal is divided into windows of 3.75 s . The scalogram of each window is calculated before feeding the network where window has time samples after the time-frequency feature construction.
B. Hierarchical Attention Network for Modeling Long- and Short-Term Temporal Patterns
Although the hierarchical attention method was previously introduced and used in other applications [37], it was necessary to modify this approach for our work. Specifically, we defined the network components for this specific application and the characteristics of Doppler signals. We leveraged a hierarchical attention network to test the hypothesis that better representations can be obtained by incorporating knowledge of long- and short-term fetal cardiac activity in the model architecture. This model includes two levels of attention mechanisms, one at the time sample level focusing on the scalogram of the Doppler signals and another at the window level focusing on the relationship between consecutive windows. This model was designed to capture two insights about fetal Doppler time series: 1) the underlying dynamic pattern of a series of fetal heartbeats, and 2) the fact that different time epochs of the signal are differentially informative to estimate fetal development. This could be due to change in the noise level, different fetal activity levels (as suggested by Hoyer et al. [38]) or variation in importance of a specific part of the cardiac cycle for GA estimation.
Both beat and window encoders are followed by an attention layer. The feature extractor is a time-invariant neural network that learns a representation based on training data by finding a robust transformation. The beat encoder network is a recurrent network that learns the dynamic of set of beats. Finally, the window encoder learns the relation of segments of multiple beats.
C. Sequence Encoder
In order to model the sequence of beats and segments, gated recurrent units (GRU) [33] were used. The GRU uses a gating mechanism to track the state of sequences without using separate memory cells. We denote input vector at time t as , one can adapt the GRU architecture as:
| (3) |
where is a reset gate and update gate. decides how much information should be preserved and decides the contribution proportion of the past and new information. and are point-wise nonliniarity, is point-wise product and , , are parameters of the model. Both beat encoder and window encoder networks include GRU layers.
D. Hirarchical attention
As mentioned earlier, the hierarchy in the network tries to incorporate long and short-term dynamics in 1D-DUS. It is obvious that some parts of the signal are more involved in a given task due to fetal behavioral states, movement patterns and quality of the signal. Therefore, this model utilizes two levels of attention mechanism along with hierarchical training of beat-level and window-level networks.
Suppose that is a hidden representation of the time sample in window in vector space, the attention layer in network first projects into hyperbolic space . Then, it combines the components of according to their relevance to the problem and estimate the normalized importance weight through a softmax function. After that, the weighted sum of the time sample representations creates the window vector :
| (4) |
The window vectors are then fed to the network. The window-level attention gets hidden representation of windows after processing in GRU layer. In (5), is a high level representation and summarizes the information in one recording of 1D-DUS. The window-level attention mechanism works as follows:
| (5) |
E. Generalization with data balancing
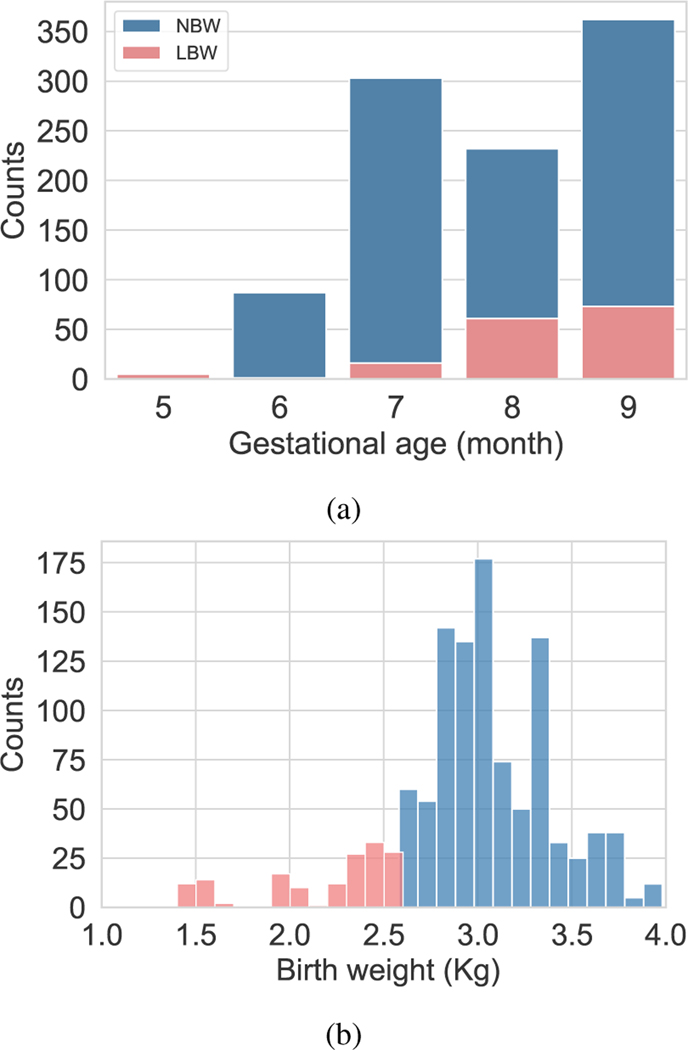
Data imbalance is a critical issue in real-world datasets specially in healthcare data. In this work, GA labels were recorded in month during the third trimester. Figure 3a shows the distribution of GA labels. Since there are less number of samples in months 5 and 6, we leveraged learning solutions to improve the generalization of less frequent categories using balanced loss function and balanced batch generator. Typically, balanced loss function assigns sample weights proportionally to the inverse of number of samples in each category. In this work, the inverse of the effective relative number of samples was used to re-weight the loss [39]. The mathematical formulation for the effective number of samples in each category was defined as where controls how rapidly this value grows and is the number of samples.
Fig. 3:
Distribution of gestational age labels and birth weight in the data set.
III. Experimental design
A. Data
The data were collected as part of a randomized control trial, conducted in rural highland Guatemala [40], [41]. The mHealth system described in this article is a part of the NIH funded study titled Mobile Health Intervention to Improve Perinatal Continuum of Care in Guatemala. The study was approved by the Wuqu’ Kawoq and Emory University institutional review boards (Wuqu’ Kawoq IRB approval number: WK-2015–001, Emory University protocol record: IRB00076231) to ensure compliance with ethical standards. The dataset includes 1D-DUS signals recorded by traditional birth attendants, who were trained to use the hand-held 1D-DUS device and were provided with a mobile application. Immediately before recording the 1D-DUS signals, the traditional birth attendants also entered the anticipated GA in months based on the last menstrual period. The 1D-DUS device was an AngelSounds fetal 1D-DUS JPD-100s (Jumper Medical Co., Ltd., Shenzhen, China) with an ultrasound transmission frequency of 3.3MHz. Data were captured using a bespoke Android client at 44.1kHz, using a low-cost smartphone (Samsung S3 mini) and stored as uncompressed WAV files at 7056/s bits) [22]. Figure 2 illustrates the data sources and devices used in this research. The data was captured from pregnant women at 5 to 9 months of gestation. The inclusion criteria were specified as existence of weight and GA label corresponding to 1D-DUS recording at the time of the visit. Noisy signals were detected using the model presented by Valderrama et al. [41], which is based on a two-step classifier to assess the quality of each 3.75s non-overlapping window of data. The first step detects silent segments by using only variance as a feature and a binary logistic regression classifier. The second step involved the use of a multi-class support vector machine for four classes of data: good quality, poor quality, interference, and talking. The following features were used for this classifier: cross correlation with a template of an average beat, sample entropy, wavelet coefficients, band limited power spectral density averages, and cepstral coefficients. Each recording was split into 3.75s segments for quality evaluation and hand-labelled by three individual annotators familiar with the data. After excluding the recordings with less than 50% good quality segments, data from 226 pregnancies remained, including 45 LBW and 181 NBW deliveries. The identification of LBW newborns was based on thresholds estimated from the same population. For newborns the weight threshold was found at 2.64kg for males and 2.57kg for females [24]. Weights of the newborns were recorded in a visit up to two weeks after delivery. In order to provide a more accurate estimation of birth weight, the traditional infant weight models (Count’s and Reeds models [42]) were fitted using 918 newborn records from the same Guatemalan highland community. Then, estimated birth weights were determined using the weight gain percentage derived from a fitted weight curve.
Fig. 2:
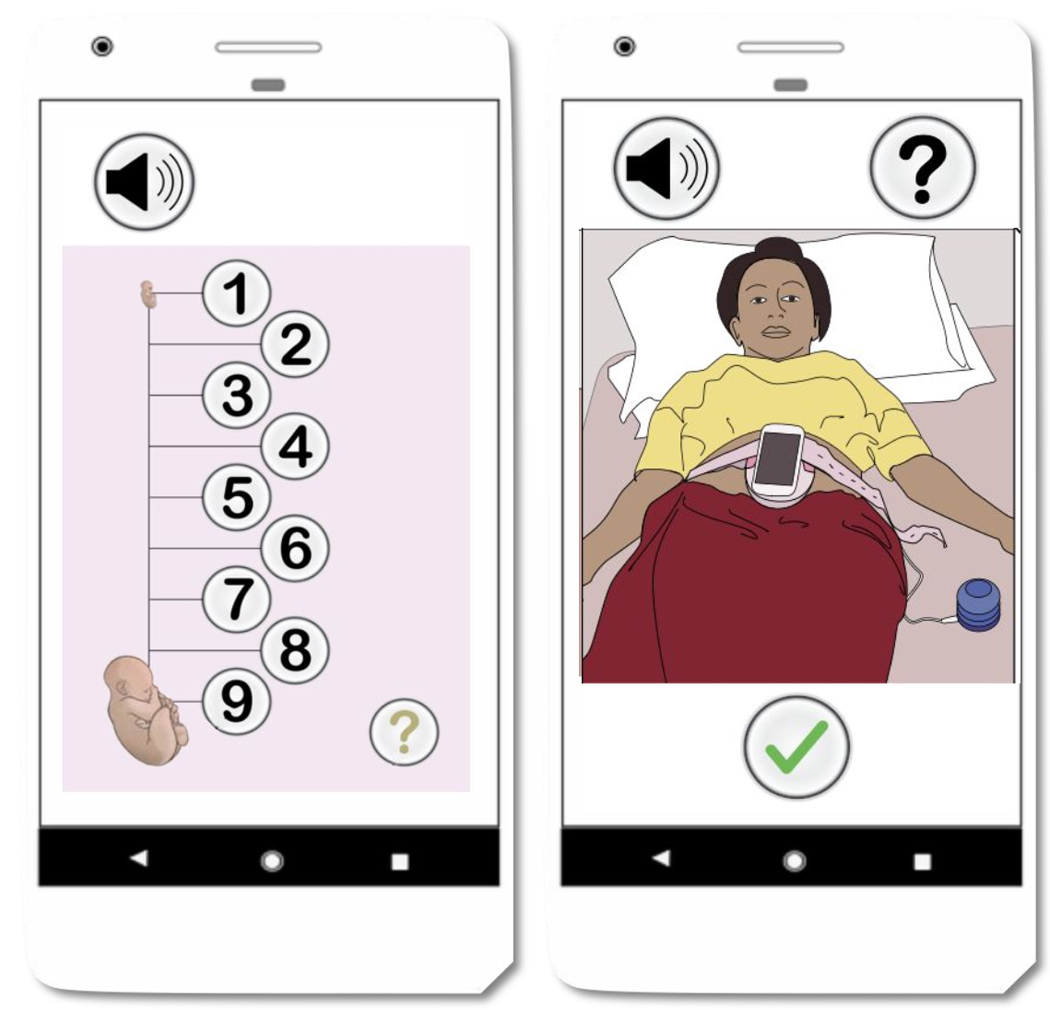
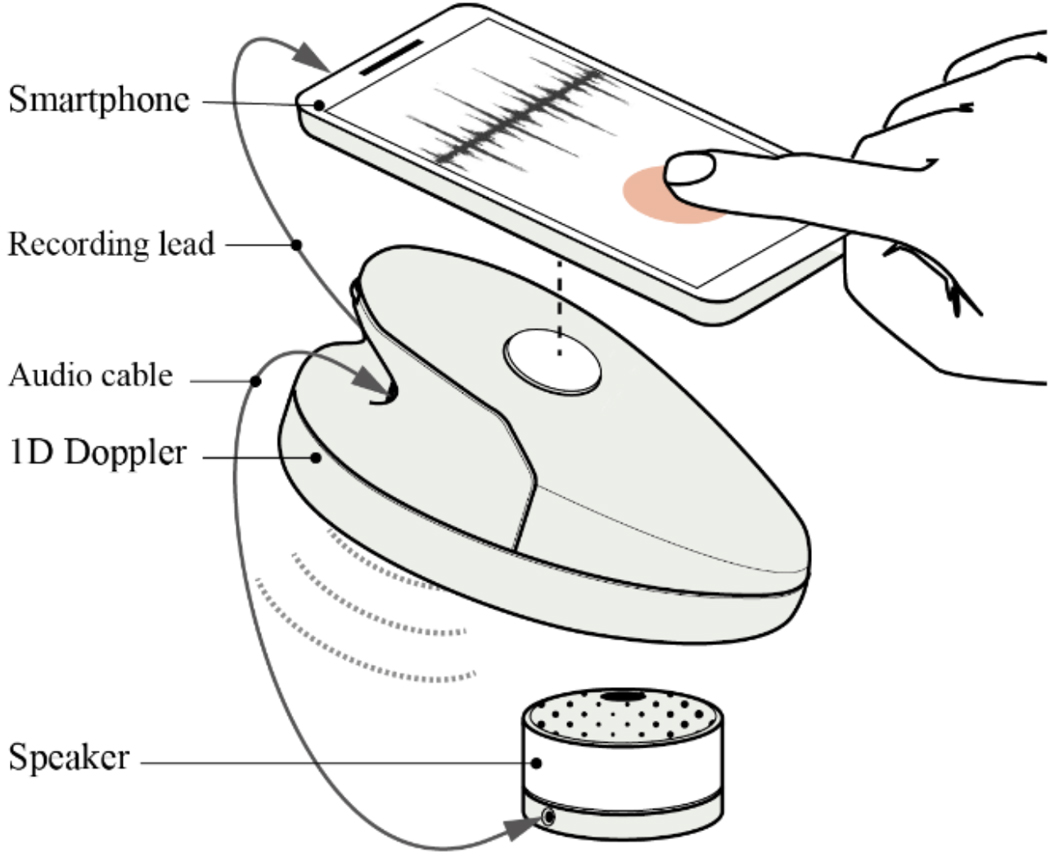
Data collection using the developed mobile application and Doppler transducers.
The number of recordings of fetuses with NBW in GA months 5, 6, 7, 8 and 9 were 8, 35, 72, 78, and 111, respectively. These data was used to evaluate the GA estimation model using 5 fold cross validation. It should be noted that the splitting of the recordings into folds was performed after dividing the data into train and test sets. The LBW data was used as a separate test data and includes 4, 7, 15, 22, 26 visits recorded in months 5 through 9. Figure 3 illustrates the distribution of the data used for model analysis.
B. 1D-DUS signal processing
Given the nature of the physiological time-series data, 1D-DUS signals are corrupted with internal and external interference such as respiration, movement, and environmental noise. In this work, a second-order band-pass Butterworth filter was used to reduce the effect of unwanted frequencies. By observing the frequency components of the 1D-DUS signals, the cutoff frequencies were set to 25 and 600 Hz, corresponding to cardiac oscillations. Specifically, the cardiac frequency range for the device used in this research (which uses a 3.3 MHz transducer) was estimated based on the empirical models of the cardiac wall velocities and Doppler magnitude frequency shift [43]. After the preprocessing steps, a scalogram of the signal is generated using the Morlet wavelet. A scalogram provides a two dimensional representation of a signal which shows how the frequency contents change overtime [36].
C. Network implementation
Feature extractor network gets the scalogram of the signal (batch size=15) and consists of three layers of 2-D convolutional neural network. Each layers is followed by batch normalization, rectified linear (ReLU) units, and max pooling units. The beat and window encoder networks consist of GRU networks with 50 units. The analysis window length was set to 3.75s and each input observation was a one minute 1D-DUS segment. A mean absolute error (MAE) was used as a loss function and mini batch stochastic gradient decent (SGD) was leveraged to optimize the parameters of the network. In the sample weight calculation function was set to 0.99. The network was implemented in TensorFlow 2.0 and Python 3.10.1. We used a computing system with the following specifications for training and testing the model: 64GB of RAM and a single CPU and one NVidia Tesla P100 GPU. The processing time per batch was 0.6s during training and the processing time for testing the model was 0.89s per recording.
D. Evaluation metrics
Stratified five-fold cross-validation is used to assess the performance of GA estimation. The network was trained and validated using one minute recordings of fetuses with NBW. To evaluate the performance of the model, mean and standard deviation of the error in estimating GA based on reported last menstrual period (LMP) were determined.
To test the effect of using techniques for long-tailed data distribution, we compared the performance of the model using Random Batch Generator (RBG) with other training strategies. First, the balanced batch generator (BBG) was used, which is based on generating balanced batches including the same number of data from each GA category. Second, we added a balanced loss function (BLF) for re-weighting samples in the network loss. The mean absolute error loss was balanced by using size of data in each category. The network we used is shown in Fig. 1. In this experiment, we used the feature extractor network with three layers of 2-D convolutional neural network with 32, 64 and 128 filters (kernel size=(3,3)). Each layers is followed by batch normalization, rectified linear (ReLU) units, and max pooling units with pooling size of (2,2). A Wilcoxon signed-rank test (one-sided; ) was applied in order to test whether the improvements obtained by applying the BBG and the BBG with a BLF were statistically significant. The values of this statistical test were calculated for each GA label to test the null hypothesis that the error of the base model (RBG) is less than the BBG and BLF approaches.
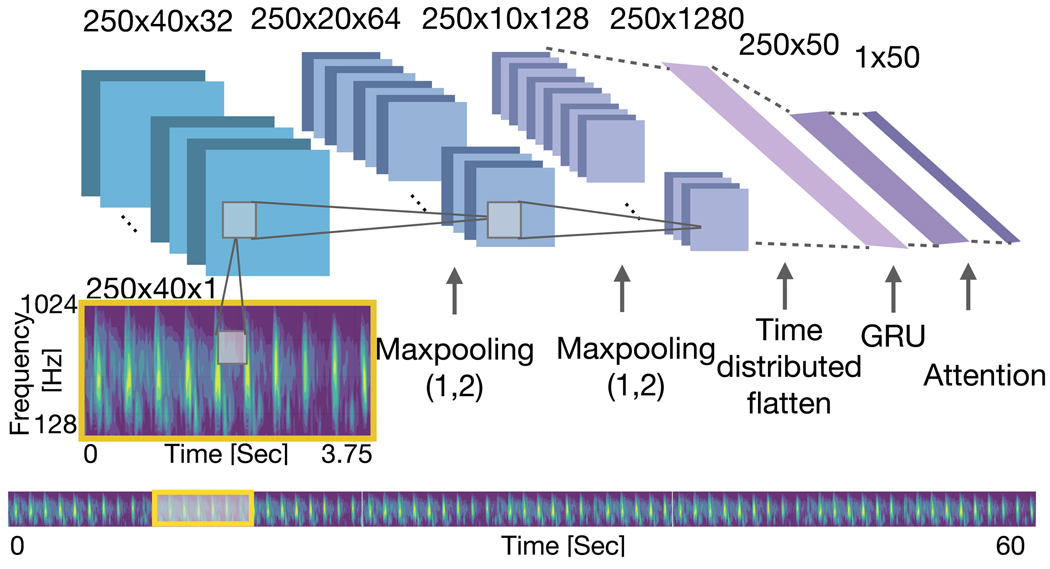
In addition, keeping the hierarchy in the model, we tested the performance of the model using three structures in the beat level modeling . First, convolutional and recurrent networks were used with time attention mechanism with focusing on time domain information. In this experiment, the pooling operation was applied only on frequency dimension (pooling size (1, 2)) . The details of this network are provided in Fig. 4. Then we omitted the recurrent block in the beat level network and tested the time attention model . In the last experiment we applied max pooling on time dimension (pooling size (2, 1)) and tested the frequency attention .
Fig. 4:
Architecture of the beat encoder in the experiment. In this structure Max Pooling was applied on the frequency dimension and attention mechanism was applied on the time dimension.
Qualitative results were also added to illustrate the effect of the attention mechanism and learning process. This includes the attention weights on the scalogram of the data using three network structures and the window level attention using structure.
In this research we assume that FGR cases are those with LBW. Therefore, to show the performance of the model on recognizing the possible FGR cases we leveraged the model trained on NBW and tested on LBW data. So, we divided the results section into three sections, A) using just the NBW data to find the best model. B) testing the trained model on LBW data and C) Qualitative results based on the attention weights visualization.
IV. Results
A. Model evaluation using Normal Birth Weight individuals
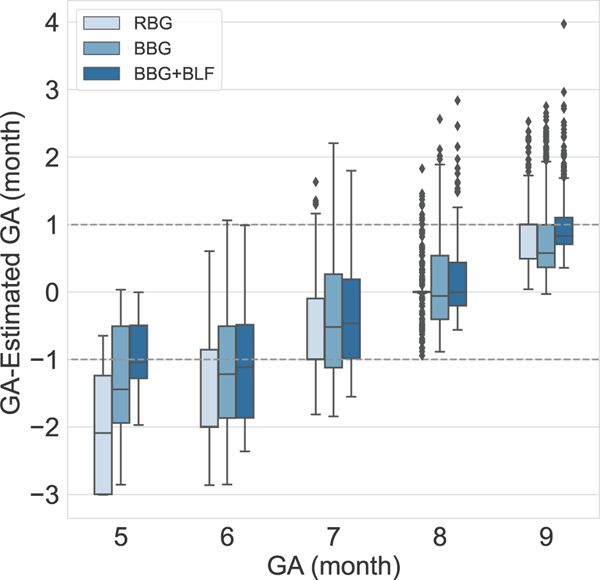
Table I and II show the MAE of estimating GA in each month of pregnancy based on reported LMP. The results of the experiments show that, assigning sample weights and using balanced batch generator in the training process reduced MAE of estimating label five from 1.99 to 0.91, label 6 from 1.52 to 1.16 and label 7 from 0.87 to 0.71 and label 9 from 0.82 to 0.79 and increased the error in estimating label 8 from 0.19 to 0.40 due to reducing the bias in model. Using the balancing approach also reduced the SD of the error in estimation of GA labels 5, 6 and 9. Fig. 5 shows the result of GA estimation using training strategies for addressing imbalanced data. A Wilcoxon signed-rank test () was used to test if GA estimation error of the BBG, and the BBG plus BLF models were statistically significantly lower than the base model (RBG). These tests gave a -value of 0.01 and 10−21, both of which suggest rejecting the null hypothesis of having lower estimation error using the base model (Table I).
TABLE I:
Results of using random batch generator (RBG), balanced batch generator (BBG) and balanced loss function (BLF). Columns show mean and standard deviation (MAE and SDE) of estimation error in GAs of 5–9 months together with the average over all months (All). A one-sided Wilcoxon test was used to compare RBG model with BBG and BBG+BLF models.
| Gestational Age (months since reported last menstrual period) | |||||||
|---|---|---|---|---|---|---|---|
| 5 | 6 | 7 | 8 | 9 | All | ||
|
| |||||||
| MAE | RBG BBG |
1.99 1.26 0.91 |
1.52 1.26 1.16 |
0.87 0.84 0.71 |
0.19 0.53 0.40 |
0.84 0.76 0.96 |
0.82 0.79 0.79 |
|
| |||||||
| SDE | RBG BBG |
0.90 0.82 0.46 |
0.73 0.77 0.69 |
0.35 0.52 0.43 |
0.33 0.43 0.45 |
0.84 0.58 0.44 |
0.6 0.6 0.53 |
|
| |||||||
| Wilcoxon | BBG | 10−3 | 9 × 10⁻³ | 10−4 | 0.16 | 0.99 | 0.01 |
| -value | 5 × 10⁻⁷ | 5 × 10⁻⁷ | 10−9 | 6 × 10⁻⁴ | 4 × 10⁻⁵ | 10−21 | |
TABLE II:
Results of using three structures in the beat-level network: 1) Convolutional and recurrent networks with attention ; 2) Convolutional network and time attention ; 3) convolutional network with frequency attention were tested. Columns show mean and standard deviation (MAE and SDE) of estimation error in gestational ages of 5–9 months, together with the average over all months (All).
| Gestational Age (months since reported last menstrual period) | |||||||
|---|---|---|---|---|---|---|---|
| 5 | 6 | 7 | 8 | 9 | All | ||
|
| |||||||
| MAE |
|
1.58 1.09 0.83 |
0.99 0.96 0.98 |
0.74 0.75 0.78 |
0.54 0.54 0.48 |
0.73 0.70 0.94 |
0.91 0.80 0.79 |
|
| |||||||
| SDE |
|
0.71 0.70 0.53 |
0.65 0.68 0.72 |
0.50 0.50 0.47 |
0.42 0.38 0.50 |
0.51 0.56 0.44 |
0.54 0.54 0.53 |
Fig. 5:
Five-fold cross-validated results using random batch generator (RBG) and strategies to deal with the imbalanced data using balanced batch generator (BBG) and BBG with balanced loss function (BBG+BLF).
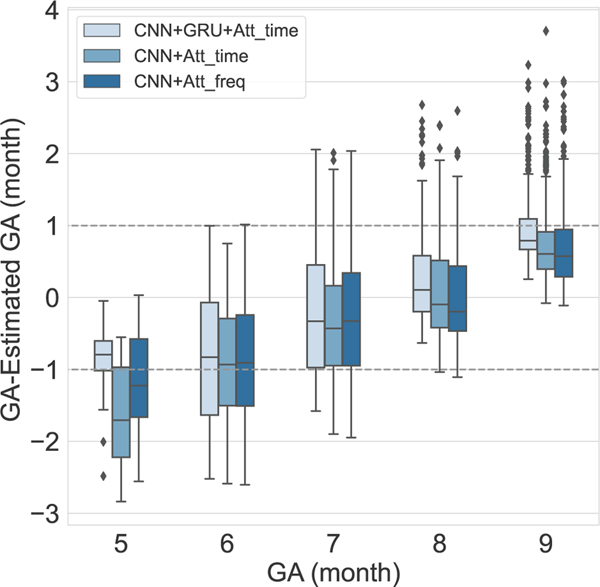
Figure 6 illustrates the results of using three different tested structures in the network. Using both GRU and CNN networks resulted in more accurate estimation of GA labels 5, 8 and overall MAE of 0.79 and SDE of 0.53.
Fig. 6:
Five-fold cross-validated results using different structures in the beat encoder network. The first structure is which is shown in Fig. 1 and consists of both CNN and GRU networks with an attention mechanism on the time dimension. In the structure, the GRU was removed from the beat encoder, and the attention model was applied to the time dimension. The structure is similar to , except that the attention model was applied to the frequency dimension.
B. Model evaluation on Low Birth Weight individuals
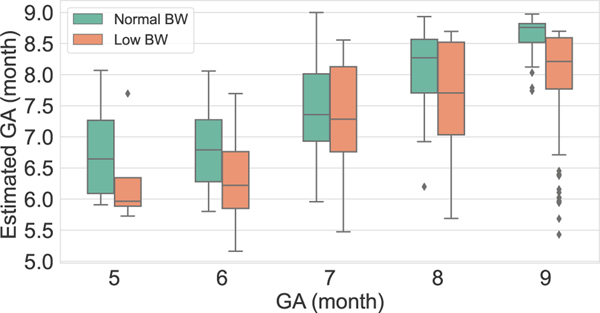
Figure 7 illustrates the GA estimation spread (using median ± interquartile ranges) on NBW and LBW test data for the network trained on NBW. This figure shows underestimation of GA for LBW data and can be used to detect the possible cases of FGR by comparing LMP based GA with the estimated GA from the model.
Fig. 7:
Median ± interquartile range estimates of gestational age on NBW (left, green) and LBW (orange, right) individuals. Note that the GA estimates of the LBW are always lower than those of the NBW.
C. Qualitative results
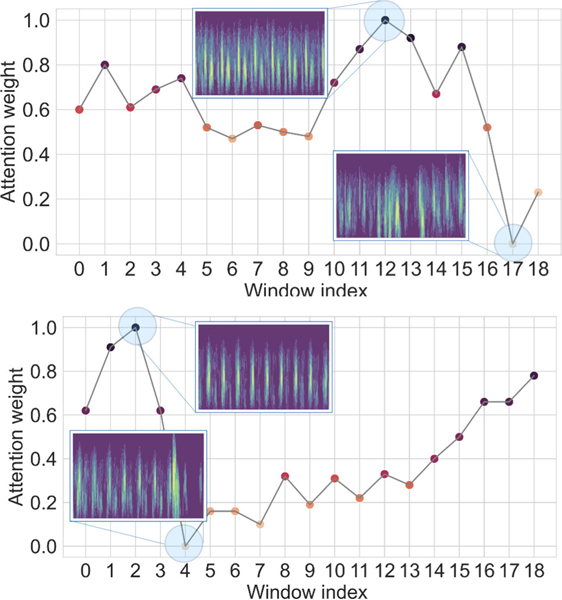
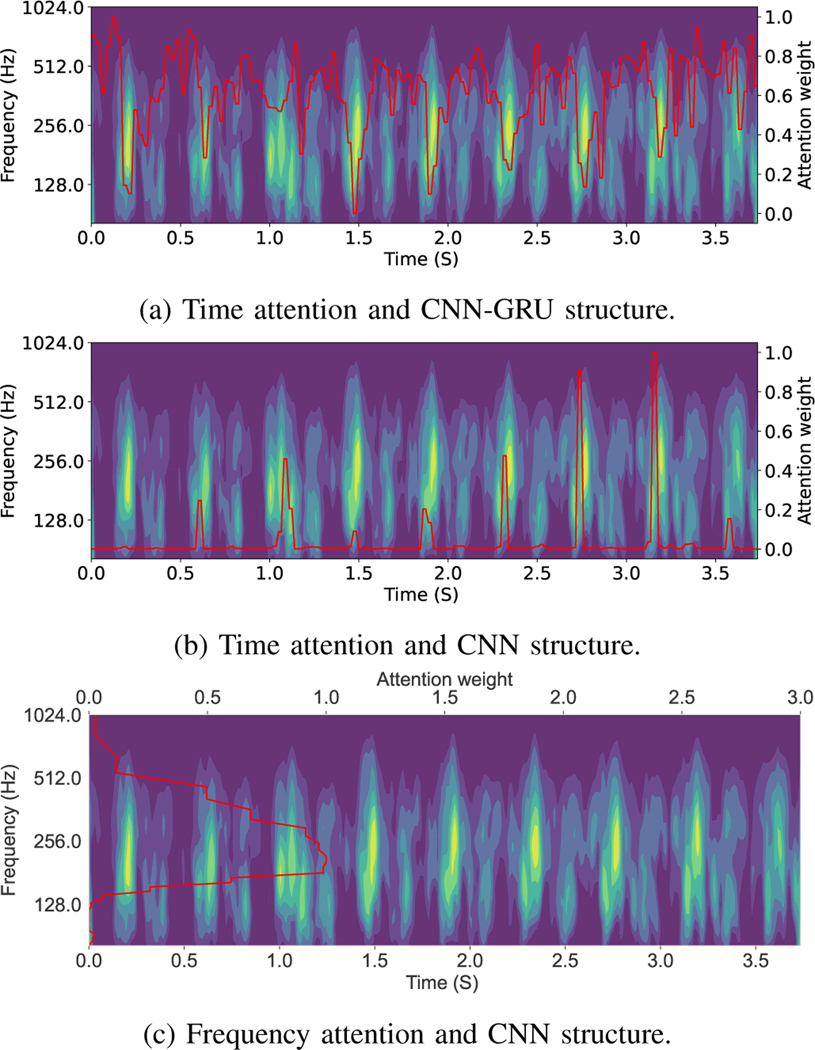
The attention layer provides insights into the model’s reasoning behind its prediction and it helps to mitigate the black box limitation of the deep learning model. Figure 8 shows two examples of the window attention. The model assigns lower weight to the segments with lower quality which validates that our model is able to select informative segments of the input signal. Figure 9 demonstrate the important areas of the extracted scalogram in the designed experiments. Using time attention approach (figures 9a and 9b) the model can detect components with larger amplitude in the time frequency feature. And, using the frequency attention (figure 9c) leads to emphasizing important frequencies in the task of GA estimation.
Fig. 8:
Visualization of window level attention weights. The model assigns lower weights to the low quality segments.
Fig. 9:
Visualization of attention weights using different structures. Attention weights are shown in red, indicating the importance of different parts of the scalogram in the task of GA estimation. We tested three structures: a) and time attention structure. b) Time attention using just CNN network and c) CNN network and frequency attention.
V. Discussion & Conclusion
This work presents a novel approach based on hierarchical sequence learning with an attention mechanism for fetal gestational age estimation using a low-cost one-dimensional Doppler ultrasound. The proposed model weights the important segments and time samples of the data according to the task of fetal development estimation. Since the imbalanced dataset used in this work could affect the model’s generalizability on less frequent labels, imbalanced learning strategies, including balanced batch generator and assigning sample weights, were employed.
The visualization of the attention weights demonstrated that this model effectively picks out important segments based on the quality of the recordings. In addition, the importance of different parts of scalogram features as assigned by attention weights shows capturing beat-to-beat variability. FHRV is widely used and has been validated in previous studies as an indicator of GA.
The proposed method achieved the state-of-the-art performance on estimating gestational age using only Doppler signals. It is interesting to compare the work presented in this article with that of Hoyer et al. [38], [44] who developed a ‘fetal brain age score’ (fABAS) based on heart rate variability and a linear regression model measured separately during quiet sleep, active sleep and active wakefulness. Their reported fABAS is very similar to our measure of GA development presented here, and in fact inspired our early work on using Doppler to identify FGR (Stroux et al. [21]). However, their determination of these ‘sleep/wake’ states was based on somewhat ad hoc (yet remarkably successful) definitions of these states. Moreover, sleep/activity states may manifest differently or at different rates for growth restricted fetuses. For these reason, and because the determination of states is non-trivial, and the fact that in the practical deployment of our system in rural healthcare, it is impossible to guarantee a long enough recording to capture more than one state (Martinez et al. [40]), we chose to take a non-parametric and nonlinear approach using a deep learning framework to side-step the need to measure activity or estimate sleep/wake states. Our assumption was that activity related to development can be implicitly learned using a deep neural network from the large number of raw Doppler recordings that we acquired. However, in earlier work, we reported on an approach which was comparable to that of Hoyer et al. [38], again without explicit states. In our earlier work, we used FHRV indexes derived from 1D-DUS (together with maternal blood pressure) to estimate GA using 10-minute recordings [29]. The best reported performance for this approach was when using a support vector regression (SVR) approach with MAE of 1.51, 0.47, 0.44, 1.04 months for GA of 6, 7, 8, 9. (Data in GA label 5 did not meet the inclusion criteria of this study.) We note that previous Doppler-based methods were based on using additional devices such as fetal ECG signals or maternal blood pressure, which increases costs and complicates the implementation, particularly in LMICs. In another Doppler-based study, Marzbanrad et al. [28] presented a method to assess fetal development using 1D-DUS and abdominal electrocardiography. By validating the results against the GA identified by Crown-Rump length, they reported 3.8 weeks MAE and 2.7 weeks after excluding low quality signals. While the error in this method is only slightly higher that we report, the results are not directly comparable because they are on a different population.
The primary methods of GA estimation are ultrasound imaging and manual measurement of fetal biometry, as well as LMP-based approaches. Gestational dating based on first-trimester ultrasound imaging was once reserved for women with unknown LMP. However, ultrasound imaging is currently the most common and reliable technique, which uses a variety of sonographic measurements and parameters to estimate GA [45]. The most important criticism on this method is that all these measures are based on physical growth and they fail to account for normal variability. Ultrasound imaging-based methods for gestational dating can also be different due to factors such as unsuitable positioning of the fetus, operator error, and the quality of the images. For example, 95% prediction intervals of ±10 days at 20 weeks, ±14 days at 24 weeks and ±17 days at 34 weeks were found for estimation based on femur length [46], [47]. The error in gestational dating using methods with higher standard errors, such as fundal height, was shown to be ±28 days at 34 weeks [48], [47]. In another study, the LMP-based GA was determined as a reference to evaluate ultrasound image-based methods. The results of using head circumference demonstrated that the uncertainty of estimated GA gradually increases with advancing GA, from 6–7 days to 15–20 days in either direction in time [49]. In summary, previous studies showed that current techniques might differ in estimating GA. However, for guiding postnatal care at the individual level, a discrepancy of 1–2 week(s) may be acceptable [10]. It is important to note that LMP was used to label our data and that the healthcare workers rounded to the nearest month. Therefore an error of ±15 days is the intrinsic lower bound error of our framework. Hence, our error of 0.79 months is close to the theoretical minimum for our data. In our most recent study, we are using Doppler imaging to perform more accurate dating at the end of the first trimester and expect to report improved results from this in the coming years.
A. Limitations
The results presented here demonstrate that the proposed GA estimator model provides sufficiently accurate results. We note several minor limitations of the current study, which require further investigation in the future. The model introduced in this study was trained using the gestational age labels based on a last menstrual period. However, the LMP approach is not particularly accurate, and thus introduces noise at the labeling stage. In order to improve the accuracy and validate the labels, additional devices such as Doppler imaging is needed. However, Doppler imaging is relatively expensive, requires trained expert use, and is not readily available in most low resources areas such as rural Guatemala. Nevertheless, the approach described in this article can be easily applied to a dataset with more accurate gestational age labels. We also note that the weight data in this study was recorded serendipitous in the first few weeks after birth. Therefore, the birth weight was estimated using the fitted weight curve [24] which is likely to introduce additional error in the estimates of LBW and NBW data in this study. By improving birth weight collection, and having clinical teams provide true FGR fetuses at birth, it is likely that the results of this study will improve further. Finally, we note that there may be normal variations in genetics that affect fetal growth curves between populations [50]. Therefore, a cross-population study is required to examine whether this affects the FGR estimations of our proposed method.
VI. Acknowledgements
The research presented here was partially funded by a Global Health Grant from Emory University. GC acknowledges the support of the National Institutes of Health, the Fogarty International Center and the Eunice Kennedy Shriver National Institute of Child Health and Human Development (NICHD), grant number 1R21HD084114-01 (Mobile Health Intervention to Improve Perinatal Continuum of Care in Guatemala), which enabled the collection of the data in this work. The data analysis in this work was funded by NICHD grant number 1R01HD110480 (AI-driven low-cost ultrasound for automated quantification of hypertension, preeclampsia, and IUGR). GC has financial interest in Alivecor Inc, and receives unrestricted funding from the company. GC also is the CTO of Mindchild Medical and CSO of Lifebell AI, and has ownership interests in both companies. None of the work presented in this article are related to these interests.
The research presented here was partially funded by a Global Health Grant from Emory University. G. D. Clifford acknowledges the support of the National Institutes of Health, the Fogarty International Center and the Eunice Kennedy Shriver National Institute of Child Health and Human Development (NICHD), grant number 1R21HD084114-01, which enabled the collection of the data in this work. The data analysis in this work was funded by NICHD grant number 1R01HD110480.
Contributor Information
Nasim Katebi, Department of Biomedical Informatics, Emory University, Atlanta.
Reza Sameni, Department of Biomedical Informatics, Emory University, Atlanta.
Peter Rohloff, Department of Biomedical Engineering, Georgia Institute of Technology, Atlanta.
Gari D. Clifford, Department of Biomedical Informatics, Emory University, Atlanta.
References
- [1].Wardlaw TM, Low birthweight: country, regional and global estimates. UNICEF, 2004. [Google Scholar]
- [2].Alexander GR, Tompkins ME, Petersen DJ, Hulsey TC, and Mor J, “Discordance between LMP-based and clinically estimated gestational age: implications for research, programs, and policy.” Public Health Reports, vol. 110, no. 4, p. 395, 1995. [PMC free article] [PubMed] [Google Scholar]
- [3].Ananth CV, “Menstrual versus clinical estimate of gestational age dating in the united states: temporal trends and variability in indices of perinatal outcomes,” Paediatric and Perinatal Epidemiology, vol. 21, pp. 22–30, 2007. [DOI] [PubMed] [Google Scholar]
- [4].Lawn JE, Lee AC, Kinney M, Sibley L, Carlo WA, Paul VK, Pattinson R, and Darmstadt GL, “Two million intrapartum-related stillbirths and neonatal deaths: where, why, and what can be done?” International Journal of Gynecology & Obstetrics, vol. 107, pp. S5–S19, 2009. [DOI] [PubMed] [Google Scholar]
- [5].Finlayson K. and Downe S, “Why do women not use antenatal services in low-and middle-income countries? a meta-synthesis of qualitative studies,” PLoS Medicine, vol. 10, no. 1, p. e1001373, 2013. [DOI] [PMC free article] [PubMed] [Google Scholar]
- [6].W. H. Organization et al. , WHO compendium of innovative health technologies for low resource settings, 2011–2014: assistive devices, eHealth solutions, medical devices, other technologies, technologies for outbreaks. World Health Organization, 2015. [Google Scholar]
- [7].Lawson GW, “Naegele’s rule and the length of pregnancy – a review,” Australian and New Zealand Journal of Obstetrics and Gynaecology, vol. 61, no. 2, pp. 177–182, Oct. 2020. [Online]. Available: 10.1111/ajo.13253 [DOI] [PubMed] [Google Scholar]
- [8].Dietz PM, England LJ, Callaghan WM, Pearl M, Wier ML, and Kharrazi M, “A comparison of LMP-based and ultrasound-based estimates of gestational age using linked California livebirth and prenatal screening records,” Paediatric and Perinatal Epidemiology, vol. 21, pp. 62–71, 2007. [DOI] [PubMed] [Google Scholar]
- [9].Andersen HF, Johnson TR Jr, Flora JD Jr, and Barclay ML, “Gestational age assessment: II. Prediction from combined clinical observations,” American Journal of Obstetrics and Gynecology, vol. 140, no. 7, pp. 770–774, 1981. [PubMed] [Google Scholar]
- [10].Rosenberg RE, Ahmed ANU, Ahmed S, Saha SK, Chowdhury MA, Black RE, Santosham M, and Darmstadt GL, “Determining gestational age in a low-resource setting: validity of last menstrual period,” Journal of Health, Population, and Nutrition, vol. 27, no. 3, p. 332, 2009. [DOI] [PMC free article] [PubMed] [Google Scholar]
- [11].Deputy NP, Nguyen PH, Pham H, Nguyen S, Neufeld L, Martorell R, and Ramakrishnan U, “Validity of gestational age estimates by last menstrual period and neonatal examination compared to ultrasound in vietnam,” BMC Pregnancy and Childbirth, vol. 17, no. 1, pp. 1–9, 2017. [DOI] [PMC free article] [PubMed] [Google Scholar]
- [12].Kerridge VFD and Mitchell R, “The value of some external characteristics in the assessment of gestational age at birth,” Developmental Medicine & Child Neurology, vol. 8, no. 6, pp. 657–660, 1966. [DOI] [PubMed] [Google Scholar]
- [13].Neufeld LM, Haas JD, Grajeda R, and Martorell R, “Last menstruaĺ period provides the best estimate of gestation length for women in rural Guatemala,” Paediatric and Perinatal Epidemiology, vol. 20, no. 4, pp. 290–298, 2006. [DOI] [PubMed] [Google Scholar]
- [14].Capurro H, Konichezky S, Fonseca D, and Caldeyro-Barcia R, “A simplified method for diagnosis of gestational age in the newborn infant,” The Journal of pediatrics, vol. 93, no. 1, pp. 120–122, 1978. [DOI] [PubMed] [Google Scholar]
- [15].Lee AC, Panchal P, Folger L, Whelan H, Whelan R, Rosner B, Blencowe H, and Lawn JE, “Diagnostic accuracy of neonatal assessment for gestational age determination: a systematic review,” Pediatrics, vol. 140, no. 6, 2017. [DOI] [PubMed] [Google Scholar]
- [16].Pay ASD, Wiik J, Backe B, Jacobsson B, Strandell A, and Klovning A, “Symphysis-fundus height measurement to predict small-for-gestational-age status at birth: a systematic review,” BMC pregnancy and childbirth, vol. 15, no. 1, pp. 1–9, 2015. [DOI] [PMC free article] [PubMed] [Google Scholar]
- [17].Liston R, Sawchuck D, Young D, Brassard N, Campbell K, Davies G, Ehman W, Farine D, Farquharson D, Hamilton E. et al. , “Fetal health surveillance: antepartum and intrapartum consensus guideline,” Journal of Obstetrics and Gynaecology Canada, vol. 29, no. 9, pp. S3–S4, 2007. [PubMed] [Google Scholar]
- [18].Schneider U, Schleussner E, Fiedler A, Jaekel S, Liehr M, Haueisen J, and Hoyer D, “Fetal heart rate variability reveals differential dynamics in the intrauterine development of the sympathetic and parasympathetic branches of the autonomic nervous system,” Physiological Measurement, vol. 30, no. 2, p. 215, 2009. [DOI] [PubMed] [Google Scholar]
- [19].Wallwitz U, Schneider U, Nowack S, Feuker J, Bauer S, Rudolph A, and Hoyer D, “Development of integrative autonomic nervous system function: an investigation based on time correlation in fetal heart rate patterns,” Journal of Perinatal Medicine, vol. 40, no. 6, pp. 659–667, 2012. [DOI] [PubMed] [Google Scholar]
- [20].Wakai RT, “Assessment of fetal neurodevelopment via fetal magneto-cardiography,” Experimental Neurology, vol. 190, pp. 65–71, 2004. [DOI] [PubMed] [Google Scholar]
- [21].Stroux L, Redman CW, Georgieva A, Payne SJ, and Clifford GD, “Doppler-based fetal heart rate analysis markers for the detection of early intrauterine growth restriction,” Acta Obstetricia et Gynecologica Scandinavica, vol. 96, no. 11, pp. 1322–1329, 2017. [DOI] [PMC free article] [PubMed] [Google Scholar]
- [22].Stroux L, Martinez B, Coyote Ixen E, King N, Hall-Clifford R, Rohloff P, and Clifford GD, “An mHealth monitoring system for traditional birth attendant-led antenatal risk assessment in rural Guatemala,” Journal of Medical Engineering & Technology, vol. 40, no. 7–8, pp. 356–371, 2016. [DOI] [PMC free article] [PubMed] [Google Scholar]
- [23].Marzbanrad F, Stroux L, and Clifford GD, “Cardiotocography and beyond: a review of one-dimensional Doppler ultrasound application in fetal monitoring,” Physiological Measurement, vol. 39, no. 8, p. 08TR01, 2018. [DOI] [PMC free article] [PubMed] [Google Scholar]
- [24].Valderrama CE, Marzbanrad F, Juarez M, Hall-Clifford R, Rohloff P, and Clifford GD, “Estimating birth weight from observed postnatal weights in a Guatemalan highland community,” Physiological Measurement, vol. 41, no. 2, p. 025008, 2020. [DOI] [PMC free article] [PubMed] [Google Scholar]
- [25].Hoyer D, Nowack S, Bauer S, Tetschke F, Rudolph A, Wallwitz U, Jaenicke F, Heinicke E, Götz T, Huonker R et al. , “Fetal development of complex autonomic control evaluated from multiscale heart rate patterns,” American Journal of Physiology-Regulatory, Integrative and Comparative Physiology, vol. 304, no. 5, pp. R383–R392, 2013. [DOI] [PubMed] [Google Scholar]
- [26].Tetschke F, Schneider U, Schleussner E, Witte OW, and Hoyer D, “Assessment of fetal maturation age by heart rate variability measures using random forest methodology,” Computers in Biology and Medicine, vol. 70, pp. 157–162, 2016. [DOI] [PubMed] [Google Scholar]
- [27].Marzbanrad F, Khandoker AH, Kimura Y, Palaniswami M, and Clifford GD, “Estimating fetal gestational age using cardiac valve intervals,” in 2016 Computing in Cardiology Conference (CinC).IEEE, 2016, pp. 109–112. [Google Scholar]
- [28].Marzbanrad F, “Assessment of fetal development using cardiac valve intervals,” Frontiers in Physiology, vol. 8, p. 313, 2017. [DOI] [PMC free article] [PubMed] [Google Scholar]
- [29].Valderrama CE, Marzbanrad F, Hall-Clifford R, Rohloff P, and Clifford GD, “A proxy for detecting IUGR based on gestational age estimation in a Guatemalan rural population,” Frontiers in Artificial Intelligence, vol. 3, p. 56, 2020. [DOI] [PMC free article] [PubMed] [Google Scholar]
- [30].Gao L, Guo Z, Zhang H, Xu X, and Shen HT, “Video captioning with attention-based LSTM and semantic consistency,” IEEE Transactions on Multimedia, vol. 19, no. 9, pp. 2045–2055, 2017. [Google Scholar]
- [31].Song H, Rajan D, Thiagarajan JJ, and Spanias A, “Attend and diagnose: Clinical time series analysis using attention models,” in Thirtysecond AAAI Conference on Artificial Intelligence, 2018. [Google Scholar]
- [32].Shashikumar SP, Shah AJ, Clifford GD, and Nemati S, “Detection of paroxysmal atrial fibrillation using attention-based bidirectional recurrent neural networks,” in Proceedings of the 24th ACM SIGKDD International Conference on Knowledge Discovery & Data Mining, 2018, pp. 715–723. [Google Scholar]
- [33].Bahdanau D, Cho K, and Bengio Y, “Neural machine translation by jointly learning to align and translate,” arXiv preprint arXiv:1409.0473, 2014. [Google Scholar]
- [34].Xu K, Ba J, Kiros R, Cho K, Courville A, Salakhudinov R, Zemel R, and Bengio Y, “Show, attend and tell: Neural image caption generation with visual attention,” in International Conference on Machine Learning. PMLR, 2015, pp. 2048–2057. [Google Scholar]
- [35].Juarez M, Juarez Y, Coyote E, Nguyen T, Shaw C, Hall-Clifford R, Clifford GD, and Rohloff P, “Working with lay midwives to improve the detection of neonatal complications in rural Guatemala,” BMJ Open Quality, vol. 9, no. 1, p. e000775, 2020. [Google Scholar]
- [36].Mallat S, A wavelet tour of signal processing. Elsevier, 1999. [Google Scholar]
- [37].Yang Z, Yang D, Dyer C, He X, Smola A, and Hovy E, “Hierarchical attention networks for document classification,” in Proceedings of the 2016 Conference of the North American Chapter of the Association for Computational Linguistics: Human Language Technologies, 2016, pp. 1480–1489. [Google Scholar]
- [38].Hoyer D, Kowalski E-M, Schmidt A, Tetschke F, Nowack S, Rudolph A, Wallwitz U, Kynass I, Bode F, Tegtmeyer J. et al. , “Fetal autonomic brain age scores, segmented heart rate variability analysis, and traditional short term variability,” Frontiers in Human Neuroscience, vol. 8, p. 948, 2014. [DOI] [PMC free article] [PubMed] [Google Scholar]
- [39].Cui Y, Jia M, Lin T-Y, Song Y, and Belongie S, “Class-balanced loss based on effective number of samples,” in Proceedings of the IEEE/CVF Conference on Computer Vision and Pattern Recognition, 2019, pp. 9268–9277. [Google Scholar]
- [40].Martinez B, Ixen EC, Hall-Clifford R, Juarez M, Miller AC, Francis A, Valderrama CE, Stroux L, Clifford GD, and Rohloff P, “mHealth intervention to improve the continuum of maternal and perinatal care in rural Guatemala: a pragmatic, randomized controlled feasibility trial,” Reproductive Health, vol. 15, no. 1, p. 120, 2018. [DOI] [PMC free article] [PubMed] [Google Scholar]
- [41].Valderrama CE, Marzbanrad F, Stroux L, Martinez B, Hall-Clifford R, Liu C, Katebi N, Rohloff P, and Clifford GD, “Improving the quality of point of care diagnostics with real-time machine learning in low literacy LMIC settings,” in Proceedings of the 1st ACM SIGCAS Conference on Computing and Sustainable Societies, 2018, pp. 1–11. [Google Scholar]
- [42].Berkey CS and Reed RB, “A model for describing normal and abnormal growth in early childhood,” Human Biology, pp. 973–987, 1987. [PubMed] [Google Scholar]
- [43].Valderrama CE, Stroux L, Katebi N, Paljug E, Hall-Clifford R, Rohloff P, Marzbanrad F, and Clifford GD, “An open source autocorrelation-based method for fetal heart rate estimation from one-dimensional Doppler ultrasound,” Physiological Measurement, vol. 40, no. 2, p. 025005, 2019. [DOI] [PMC free article] [PubMed] [Google Scholar]
- [44].Hoyer D, Schneider U, Kowalski E-M, Schmidt A, Witte OW, Schleußner E, Hatzmann W, Grönemeyer DH, and Van Leeuwen P, “Validation of functional fetal autonomic brain age score fabas in 5 min short recordings,” Physiological Measurement, vol. 36, no. 11, p. 2369, 2015. [DOI] [PubMed] [Google Scholar]
- [45].Lynch CD and Zhang J, “The research implications of the selection of a gestational age estimation method,” Paediatric and Perinatal Epidemiology, vol. 21, pp. 86–96, 2007. [DOI] [PubMed] [Google Scholar]
- [46].Konje J, Abrams K, Bell S, and Taylor D, “Determination of gestational age after the 24th week of gestation from fetal kidney length measurements,” Ultrasound in obstetrics and gynecology: the official journal of the international society of ultrasound in obstetrics and gynecology, vol. 19, no. 6, pp. 592–597, 2002. [DOI] [PubMed] [Google Scholar]
- [47].Self A, Daher L, Schlussel M, Roberts N, Ioannou C, and Papageorghiou AT, “Second and third trimester estimation of gestational age using ultrasound or maternal symphysis-fundal height measurements: A systematic review,” BJOG: An International Journal of Obstetrics & Gynaecology, 2022. [DOI] [PMC free article] [PubMed] [Google Scholar]
- [48].Sherwood RJ, Meindl R, Robinson H, and May R, “Fetal age: methods of estimation and effects of pathology,” American Journal of Physical Anthropology: The Official Publication of the American Association of Physical Anthropologists, vol. 113, no. 3, pp. 305–315, 2000. [DOI] [PubMed] [Google Scholar]
- [49].Papageorghiou AT, Kemp B, Stones W, Ohuma EO, Kennedy SH, Purwar M, Salomon LJ, Altman DG, Noble JA, Bertino E. et al. , “Ultrasound-based gestational-age estimation in late pregnancy,” Ultrasound in Obstetrics & Gynecology, vol. 48, no. 6, pp. 719–726, 2016. [DOI] [PMC free article] [PubMed] [Google Scholar]
- [50].Dunger D, Petry C, and Ong K, “Genetic variations and normal fetal growth,” Hormone Research in Paediatrics, vol. 65, no. Suppl. 3, pp. 34–40, 2006. [DOI] [PubMed] [Google Scholar]


