Abstract
Nucleic acid nanoparticles (NANPs) are extensively investigated as diagnostic and therapeutic tools. These innovative particles can be composed of RNA, DNA, and/or modified nucleic acids. Due to the regulatory role of nucleic acids in the cellular system, NANPs have the ability to identify target molecules and regulate expression of genes in disease pathways. However, translation of NANPs in clinical settings is hindered due to inefficient intracellular delivery, chemical instability, and off-target immunostimulatory effects following immune recognition. The composition of nucleic acids forming NANPs has been demonstrated to influence immunorecognition, subcellular compartmentalization, and physicochemical properties of NANPs. This chapter first outlines the methods used to generate a panel of NANPs with a uniform shape, size, charge, sequence, and connectivity. This includes the procedures for replacing the RNA strands with DNA or chemical analogs in the designated NANPs. Second, this chapter will also describe experiments to assess the effect of the chemical modification on enzymatic and thermodynamic stability, delivery efficiency, and subcellular compartmentalization of NANPs.
Keywords: Nucleic acid nanoparticles (NANPs), Intracellular compartmentalization, Immunorecognition, NANPs synthesis
1. Introduction
Nucleic acid nanoparticles (NANPs) are rationally designed three-dimensional nucleic acid structures. They hold the advantages of tunability of physicochemical properties, immune response regulation, and multifunctionality with targeting ligands or therapeutic nucleic acids. NANPs can also be exploited in diagnostic and therapeutic applications. However, NANPs have not been commercialized due to the following parameters that require further optimization: delivery efficiency, sensitivity to enzymatic degradation, and induction of off-target immune response [1]. Extensive research efforts are ongoing to overcome these hurdles: by optimizing the structure and composition of NANPs.
Previous work demonstrated that the physicochemical properties of NANPs affect their immunostimulatory properties [2]. Previous studies highlighted that size, shape, and composition of NANPs are key players in immunostimulation [3, 4]. As for the size and globularity, it was reported that the increase in size and globularity of NANPs increases the stimulation of the immune response [3,4]. Another study confirmed that altering the composition of NANPs modulated the degree of the immune response, as DNA NANPs have less immune activation than RNA NANPs [5]. Research indicates that thermostability, serum stability, and immunostimulatory activity can be optimized by incorporating chemically modified nucleic acid analogs in the NANPs [6–14]. In this chapter, the methods for the synthesis and characterization of an array of NANPs with modified composition will be discussed. In our previous publication, NANPs composed of RNA, DNA, and 2’F modified oligonucleotides, but sharing the same size, shape, sequences, connectivity, and charge, were used to assess the effect of modified chemical composition on the intracellular compartmentalization and immunostimulatory potential. The temperature stability, serum stability, and structural integrity following release from a lipid carrier were determined via UV melting experiments, fetal bovine serum stability assays, and native-PAGE gels, respectively. Additionally, the receptors required for recognition of NANPs and the downstream immune responses were investigated using a combination of reporter cell lines, siRNA-based approaches, specific capture ELISAs, and immunoblot analysis. Finally, cellular fractionation experiments and fluorescent immunohistochemical analysis were used to assess the intracellular compartmentalization of the NANPs.
2. Materials
-
NANP Synthesis.
Synthetic oligonucleotides with 2′-fluoro-modified pyrimidines (2’F-U/C).
DNA strands including 5′-end cy-3-labeled oligonucleotides.
-
Polymerase chain reaction (PCR):
100 μM Forward Primer for the desired strand.
100 μM Reverse Primer for the desired strand.
0.2 μM DNA Template for the desired strand.
2X MyTaq Mix.
Endotoxin-free water.
PCR tubes (1 per strand).
-
Purification of DNA samples:
Impure PCR products.
Endotoxin-free water.
1.5 mL Eppendorf tubes (2 per PCR sample).
2.0 mL Eppendorf tubes (1 per PCR sample).
Filtration columns (1 per PCR sample).
DNA Binding Buffer.
DNA Wash Buffer.
1.5% agarose gel and supplies.
2’F in vitro T7 RNA transcription kit.
-
8 M urea 18% PAGE:
20 mL 40% acrylamide/bis-acrylamide / 8 M urea.
25 mL 8 M urea.
5 mL 10X TBE; 108 g Tris base, 55 g boric acid, 7.4 g EDTA (disodium salt), 1 L Milli-Q water (17.5–17.8 MΩ).
25 μL TEMED.
500 μL 10% APS.
Beaker (100–150 mL).
Graduated cylinder (50–100 mL).
Glass gel plates (one front, one back).
2 gel spacers.
Gel gasket.
Razor blade.
Gel comb.
100% ethanol.
ddiH2O (17.5–17.8 MΩ).
Elution buffer: 89 mM Tris–HCl buffer (pH 8.0), 0.3 M sodium acetate, 0.1 mM EDTA).
-
Ethanol precipitation: (2.5× volume of 100% ethanol and 1/10 volume of 3 M sodium acetate):
6 Eppendorf tubes (1.5 mL).
Eluates.
ddiH2O.
100% ethanol.
90% ethanol.
Equipment: Pipettes and pipette tips, microcentrifuge, vortex, refrigerated centrifuge, SpeedVac-20 °C, Freezer.
Assembly buffer: 89 mM Tris-borate buffer (pH 8.3), 2 mM magnesium acetate, and 50 mM potassium chloride.
-
Native-PAGE gel:
ddiH2O (17.5–17.8 MΩ).
40% 19:1 acrylamide/bis-acrylamide.
10X TB.
1 M Magnesium chloride.
TEMED.
10% APS.
Beaker (50–100 mL).
Graduated cylinder (10 mL).
Mini gel glass plates (one front, one back).
Gel comb (of appropriate thickness for the chosen glass plate set).
Razor blade.
100% ethanol.
Green gel casting frame.
Gel casting stand.
Buffer tank with lid.
Buffer dam.
Native loading buffer.
1X TB, 2 mM Mg2+.
Mini gel spatula.
Glass tray.
Squirt bottle with ddiH2O.
Diluted ethidium bromide.
Equipment: Pipettes and pipette tips in boxes, refrigerator, UV lamp and transilluminator, power supply.
- UV-Melting Experiments.
- UV-melting cells (micro-cuvette Starna Cells, 10 mm path length) equipped with a PTFE stopper.
- Agilent spectrophotometer.
- Dynamic Light Scattering Analysis.
- 50 kDa Ultracel-50 regenerated cellulose membrane.
- DLS cells.
- Zetasizer nano-ZS.
- Fetal Bovine Serum Stability Assay.
- 20% fetal bovine serum (FBS) solution.
- 3% agarose gel; 50 mL 1x TBE buffer and 1.5 g agarose powder.
-
Integrity of NANP upon Release from a Carrier.
Lipofectamine 2000 (L2K).
10% Triton-X.
-
Native PAGE (37.5:1, 8%):
ddiH2O (17.5–17.8 MΩ).
40% 19:1 acrylamide/bis-acrylamide.
10X TB.
1 M magnesium chloride.
TEMED.
10% APS.
Beaker (50–100 mL).
Graduated cylinder (10 mL).
Mini gel glass plates (one front, one back).
Gel comb (of appropriate thickness for the chosen glass plate set).
Razor blade.
100% ethanol.
Green gel casting frame.
Gel casting stand.
Buffer tank with lid.
Buffer dam.
Native loading buffer.
1X TB, 2 mM Mg2+.
Mini gel spatula.
Glass tray.
Squirt bottle with ddiH2O (17.5–17.8 MΩ).
Diluted ethidium bromide.
Equipment: Pipettes and pipette tips in boxes, refrigerator, UV lamp and transilluminator, power supply.
- Source and Propagation of Cell Lines.
- Immortalized primary human microglia (hμglia) cells (gift from Dr. Jonathan Karn, Case Western Reserve University).
- Dulbecco’s modified Eagle’s medium supplemented with 5% FBS and penicillin/streptomycin (100 U/mL–100 g/mL).
- Transfection of Microglia.
- L2K.
- DOTAP (MilliporeSigma).
- DMEM supplemented with 5% FBS.
- Cell media supplemented with 100 U/mL penicillin-100 g/mL streptomycin.
- Cellular Fractionation.
- Cy3-labeled NANPs.
- Cellular fractionation kit.
- Cytosolic isolation buffer; CIB.
- Membrane/organelle isolation buffer; MIB.
- Nuclear/cytoskeleton isolation buffer; NIB.
- Immunoblot for proteins GAPDH, COX IV, Rab7, and H3, as described in the immunoblot section.
- SpectraMax iD5 plate reader.
- Flow Cytometric Analysis.
- Cy3-labeled NANPs.
- L2K or DOTAP.
- 0.05% trypsin.
- 1% paraformaldehyde.
- Flow cytometer.
- Fluorescent Immunohistochemical Analysis.
- Poly-D-lysine-coated glass coverslips for huglia cell line.
- Cy3-labeled NANPs.
- L2K or DOTAP.
- 4% paraformaldehyde.
- 0.1% Triton-X-100.
- 2% BSA.
- Monoclonal rabbit antibody directed against EEA1.
- Polyclonal goat anti-rabbit secondary antibody coupled to Alexa Fluor 647.
- Prolong Diamond antifade mountant with DAPI.
- Olympus Fluoview 1000 four-color confocal laser microscope.
2.1. Statistical Analysis
GraphPad Prism, GraphPad 15 Software.
3. Methods
-
NANP Synthesis.
-
Amplification of DNA templates for in vitro transcription of 2’FU/C modified RNA strands by PCR:
All reagents are thawed and placed on ice.
All PCR tubes are labeled with the names of the samples to be amplified.
25 μL of 2X MyTaq Mix is added to each PCR tube.
22 μL of endotoxin-free water is added to each PCR tube.
1 μL of each template, forward primer, and reverse primer specific for the desired strand are added to their respective tubes.
The total 50 μL of sample is mixed by pipetting up and down, and centrifuge briefly using a mini-centrifuge.
-
Tubes are placed into the thermocycler and lid is closed. Set a program to run from:
(94 °C for 90 sec)
(55 °C for 90 sec)
(72 °C for 90 sec) and repeat these three steps for 30 cycles.
Approximately 3 h are needed for the thermocycler to complete all 30 rounds of amplification. Afterward, the thermocycler can be programmed to keep all samples at 4 °C or placed in the 4 °C refrigerator until DNA purification.
-
Purify amplified DNA samples:
One 1.5 mL tube is labeled for each PCR sample. All of the 50 μL PCR products are moved from each sample to their respective 1.5 mL tubes. Afterward, the PCR tubes are discarded.
DNA Binding Buffer is added to each 1.5 mL tube to bring the total volume to 700 μL (For a 50 μL PCR reaction, add 650 μL of DNA Binding Buffer).
Vortex the tubes thoroughly and centrifuge.
Using scissors, cut off and discard the caps from the
2.0 mL tubes.
One filtration column is placed inside each 2.0 mL tube. The tab of each filtration column is labeled with the name of the sample.
All 700 μL of each sample is transferred into each filtration column.
The filtration columns are placed in 2.0 mL tubes in a tabletop centrifuge so that they are evenly balanced. Set the centrifuge to 10,000 rcf for 30 s.
Afterward, the buffer which has run through the filter is discarded into a liquid waste container by briefly removing the filter column and dumping the 2.0 mL tubes. Be careful not to touch the white silica filter at the bottom before returning the filter to the 2.0 mL tube.
200 μL of DNA Wash Buffer is added to each column to wash the DNA stuck in the filter.
The filtration columns in 2.0 mL tubes are placed back into the tabletop centrifuge so that they are evenly balanced. Spin the centrifuge again at 10,000 rcf for 30 s.
Next, the buffer which has run through the filter is discarded into a liquid waste container by briefly removing the filter column and dumping the 2.0 mL tubes. Be careful not to touch the white silica filter at the bottom before returning the filter to the 2.0 mL tube.
Wash the DNA a second time by adding 200 μL of DNA Wash Buffer to each column.
The filtration columns in 2.0 mL tubes are placed back into the tabletop centrifuge so that they are evenly balanced. Spin the centrifuge again at 10,000 rcf for 30 s.
The filtration columns are transferred into new 1.5 mL tubes. The 2.0 mL tubes are discarded by dumping the liquid into a liquid waste container and disposing of the tubes.
50 μL of endotoxin-free water is added to each filtration column. (Or if 100 μL of PCR reaction was done, add 100 μL of endotoxin-free water.)
Place the filtration columns in 1.5 mL tubes back into the tabletop centrifuge so that they are evenly balanced with the caps towards the inside. Spin the centrifuge again at 10,000 rcf for 30 s.
The 1.5 mL tubes are labeled with the sample name and “purified DNA.” The filtration columns are discarded.
Verifying Purification on an Agarose Gel: a 1.5% agarose gel with ethidium bromide is prepared.
A piece of Parafilm is cut and placed paper-side down on the benchtop. 2 μL drops of agarose loading buffer are pipetted onto the Parafilm for each sample of purified DNA to be verified.
Add 2 μL of purified DNA to 2 μL of agarose loading buffer for each sample. Mix by pipetting 4 μL total up
and down. Load the sample into one well of the agarose gel. Repeat for all purified DNA samples to be verified.
Put the lid onto the agarose gel chamber. (The samples will run from black to red; negative to positive).
Under UV light, look for the orange, fluorescent bands to see if purified DNA is present. Verified purified DNA should be stored at −20 °C until used for transcription.
Preparation of 2’F-modified RNA strand 2’F-T1 by 2’F in vitro T7 RNA transcription kit.
-
Purification of the prepared 2’F-modified RNA strand 2’F-T1 by 8 M urea 18% PAGE.
Mix the reagents to create the urea gel: 25 mL 40% acrylamide/bis-acrylamide / 8 M Urea, 20 mL 8 M Urea, 5 mL 10X TBE, 25 μL of TEMED, and 500 μL of 10% APS.
Pour in the gel and let it polymerize for 15–20 min.
Add the gel into the tank and pour 1X TBE until it fills up past the wells of the gel. Pour 1X TBE into the bottom chamber of the gel stand until it fills up past the bottom of the gel assembly.
Rinse the wells twice with 1X TBE to clean the wells of the urea gel using a syringe and its needle.
In the first well, load 10 μL of the urea gel ladder and then 106 μL of each transcription sample into separate wells.
Run the gel until there is 3–4 inches of separation between the two dyes (bromophenol blue on the bottom and xylene cyanol on the top) found in the urea loading buffer.
UV shadow is used on the urea page to cut out the corresponding bands and elute them from the gel for 4 h at 37 °C in 700 μL elution buffer.
-
Precipitate the eluted bands by ethanol precipitation at −20 °C overnight:
Transfer 600 μL of the liquid from each elution tube into the corresponding “RNA strand.” Do not transfer any gel pieces.
Add 900 μL of 100% ethanol to each “RNA strand” tube. Vortex each tube for 5–10 s.
Place the tubes at −20 °C for 3 h.
Centrifuge the tubes at 4 °C for 30 min at 14,000 rpm.
Discard 900 μL of supernatant from each tube, and avoid the pellet which has formed at the bottom.
Add 900 μL of 90% ethanol to each tube.
Centrifuge at 4 °C for 10 min at 14,000 rpm.
Repeat steps 5–7.
Remove ~1000 μL of supernatant from each tube, and avoid the pellet which has formed at the bottom leaving only ~50 μL of liquid with the pellet.
Place tubes with caps opened in the SpeedVac, and run at 55 ° C until all samples are dry ~30 min.
Visualize the dried pellet and add 30 μL of ddiH2O to each tube. Vortex each for 5–10 s and briefly centrifuge.
Measure the absorbance of each strand at 260 nm using the NanoDrop 2000.
Store samples at −20 °C.
To assemble all the DNA, RNA, and fluorinated structures, mix corresponding strands (1 μM final) in assembly buffer; following the one-pot self-assembly protocol using equimolar concentrations. Then heat the mixtures to 100 °C followed by slow cooling to 4 °C.
Use PCR thermal controller for annealing of 2’F-RNA/DNA and 2’ F NANPs only for slow cooling (1 °C/ min) from 90 °C to 4 °C.
Store assemblies at 4 °C until needed.
Evaluate the purity of each batch by using AFM imaging.
-
Evaluate the purity of each batch by using 8% native-PAGE gel:
Mix the reagents to make the native gel: 10.5 mL ddiH2O, 3 mL 40% 19:1 acrylamide/bis-acrylamide (from the refrigerator), 1.5 mL 10X TB, 30 μL of 1 M MgCl2, 9 μL of TEMED, and 150 μL of 10% APS.
Pour in the gel and let it polymerize for 10–15 min.
Pre-run the gel in 1X TB (2 mM Mg2+ ) at 150 volts (and 25 mA) for 5 min on the “volt” setting.
Run gel after loading the samples, in 1X TB (2 mM Mg2+ ) at 300 volts (and 150 mA) for 20 min on the “volt” setting.
Stain the gel in diluted ethidium bromide for 5 min, and then wash twice in ddiH2O.
Image the gel using ChemiDoc to confirm pure assemblies (Fig. 1).
-
-
UV-Melting Experiments.
Degas the assembled NANPs (C = 0.1–0.2 M, V = 100 μl) in 1× assembly buffer (AB) by SpeedVac for 5 min.
Place the mixtures of total volume of 100 μL in UV-melting cells.
Use Agilent spectrophotometer at 260 nm over a temperature range of 20–100 °C (ramp rate of 0.1 °C/min).
Replicate each experiment three times.
Fit the absorbance data by using the nonlinear dose response function of Origin Pro (see Note 1) (Fig. 2).
- Dynamic Light Scattering Analysis.
- Filter the assembled NANPs through 50 kDa Ultracel-50 regenerated cellulose membrane by centrifugation at 12,000 × g for 2.5 min.
- Transfer the remaining volume to DLS cells, and analyze at 25 °C using the Zetasizer nano-ZS (Fig. 3).
- Fetal Bovine Serum Stability Assay.
- Incubate the assembled NANPs in 20% FBS solution.
- Take aliquots at time intervals from 1 min to 12 h.
- Evaluate the remaining particle fractions using 3% agarose gel electrophoresis.
- For the control in this experiment, use corresponding NANPs incubated in buffer for 12 h at 37 °C in absence of FBS.
- Quantify the remaining fraction of NANPs from the gel image using ImageJ software.
- Plot the resulting fraction percentage as a function of incubation time using Origin Pro software (Fig. 4).
-
Integrity of NANP upon Release from a Carrier.
Mix the assembled NANPs to L2K to a final volume of 9 μl and incubate at room temperature.
After 30 min of incubation, add 1 μL of 10% Triton-X to the mixture and incubate for 30 min.
Separate the samples by native PAGE (37.5:1, 8%), and stain the gel with ethidium bromide for visualizing. Follow procedures as previously described in NANP synthesis section, step 10 (Fig. 5).
-
Source and Propagation of Cell Lines.
Transformed primary human cells with lentiviral vectors expressing SV40 T antigen and hTERT (gifted from Dr. Jonathan Karn, Case Western Reserve University).
Maintain the cell line in Dulbecco’s modified Eagle’s medium supplemented with 5% FBS and penicillin/streptomycin (100 U/mL–100 g/mL).
-
Transfection of Microglia.
Transfect the hμglia cell line with L2K or DOTAP following the manufacturer’s guidelines.
Incubate the NANPs with L2K or DOTAP for 30 min before transfection of hμglia with 5 nM NANPs for 4 h in DMEM supplemented with 5% FBS.
Change the cell culture medium with media supplemented with 100 U/mL penicillin-100 g/mL streptomycin.
Collect cell supernatants for analysis at the designated time points.
-
Cellular fractionation.
Transfect cells with Cy3-labeled nanoparticles for 2 or 4 h.
Use the cellular fractionation kit according to the manufacturer guidelines to separate cells into three fractions: cytosolic (using the cytosolic isolation buffer; CIB), membrane/organelle (using the membrane/organelle isolation buffer; MIB), and nuclear/cytoskeleton (using the nuclear/cytoskeleton isolation buffer; NIB).
Determine the purity of the fractions via immunoblot for proteins GAPDH, COX IV, Rab7, and H3, as described previously in the immunoblot section.
Evaluate the fluorescence (Ex540/Em580) of each fraction using SpectraMax iD5 plate reader (Fig. 6).
-
Flow Cytometric Analysis.
Transfect the hμglia cell line with 5 nM Cy3-labeled NANPs using L2K or DOTAP and incubate for 4 h.
Remove cells from tissue culture plates using 0.05% trypsin, and fix with 1% paraformaldehyde before flow cytometric analysis.
Evaluate NANP uptake by flow cytometric analysis using an Accuri C6 cytometer or similar instrument (Fig. 7).
-
Fluorescent Immunohistochemical Analysis.
Plate the hμglia cells on Poly-D-lysine-coated glass coverslips, and transfect cells with 5 nM Cy3-labled NANPs using L2K or DOTAP. Incubate cells for 4 h.
Fix cells with 4% paraformaldehyde, then permeabilize cells with 0.1% Triton-X-100, and block cells with 2% BSA.
Stain cells with a monoclonal rabbit antibody directed against EEA1.
Incubate cells with a polyclonal goat anti-rabbit secondary antibody coupled to Alexa Fluor 647.
Mount samples with Prolong Diamond antifade mountant with DAPI.
Image samples using an Olympus Fluoview 1000 fourcolor confocal laser microscope (Fig. 8).
Fig. 1.
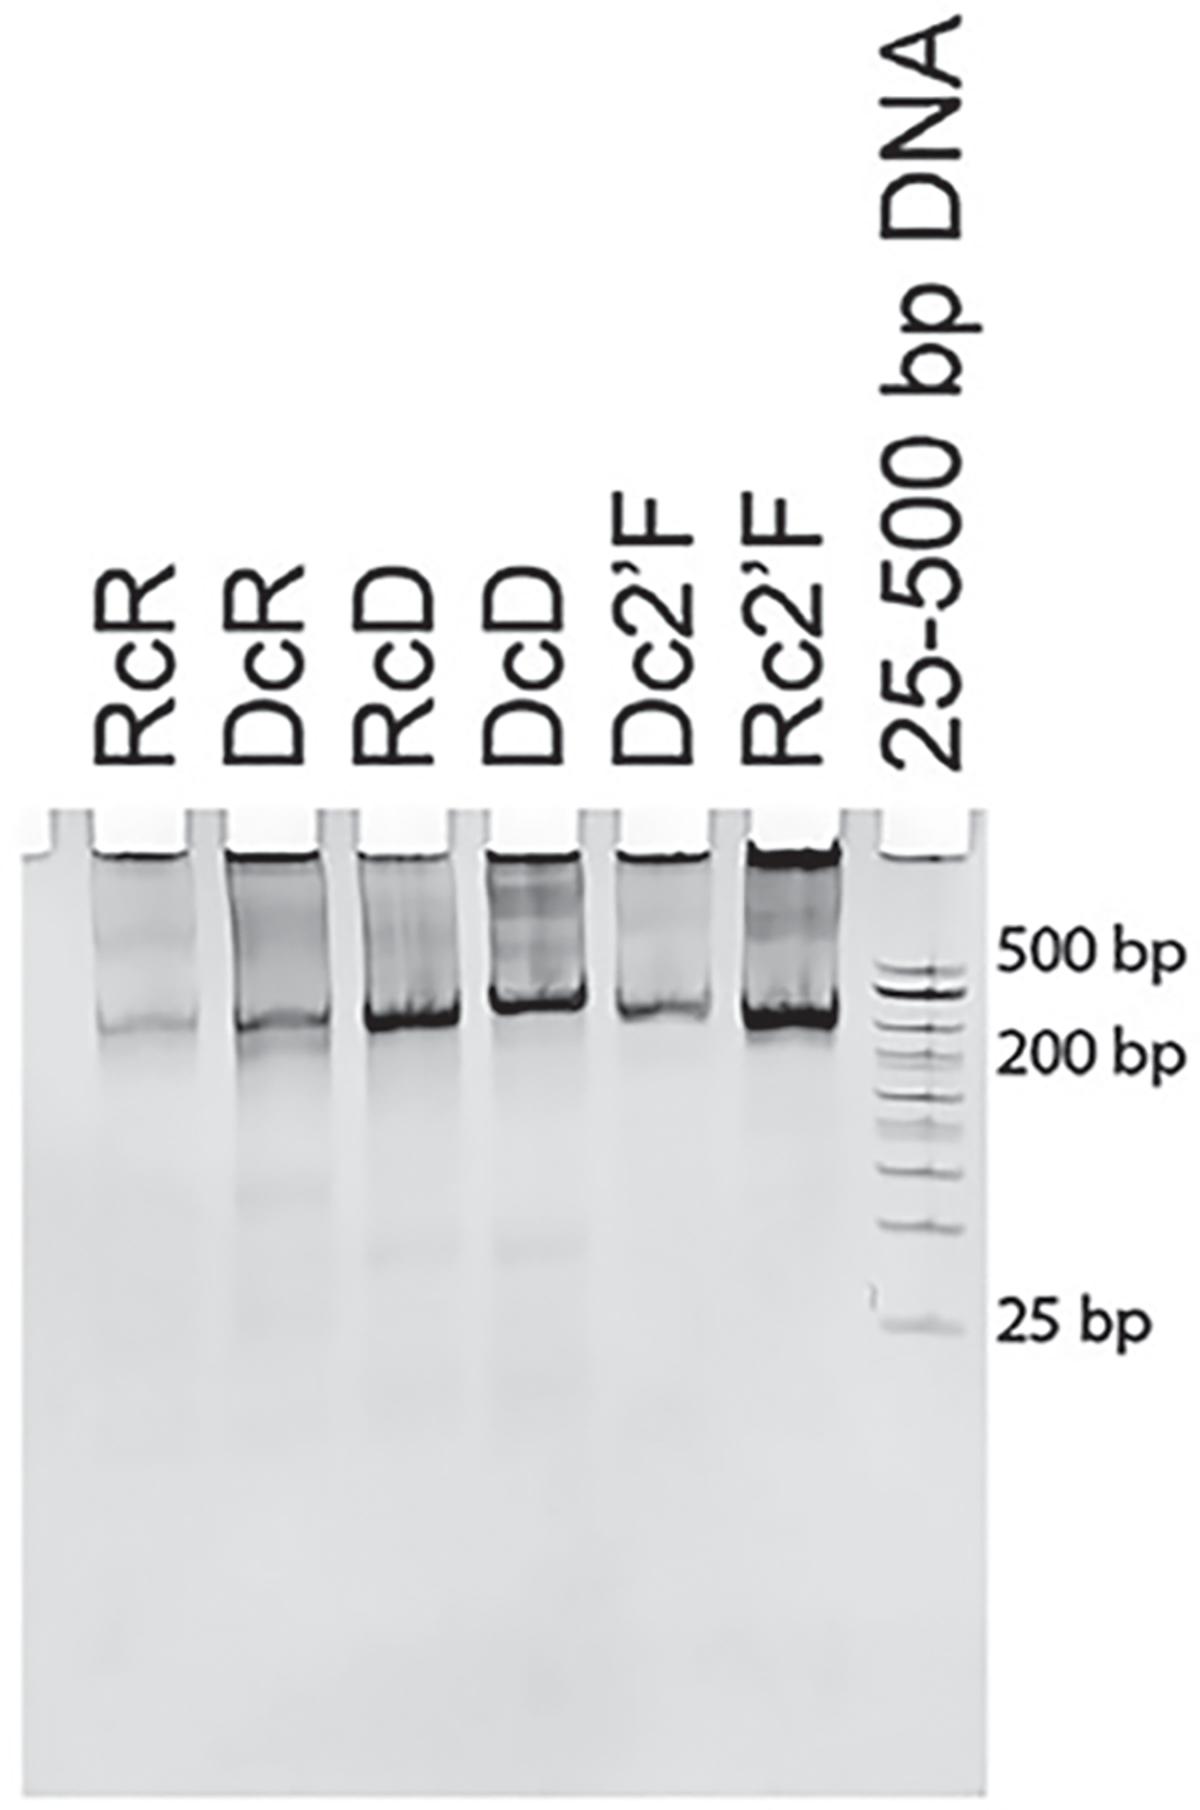
Native PAGE confirming the assemblies by EtBr total staining. (Reproduced from Ref. [5])
Fig. 2.
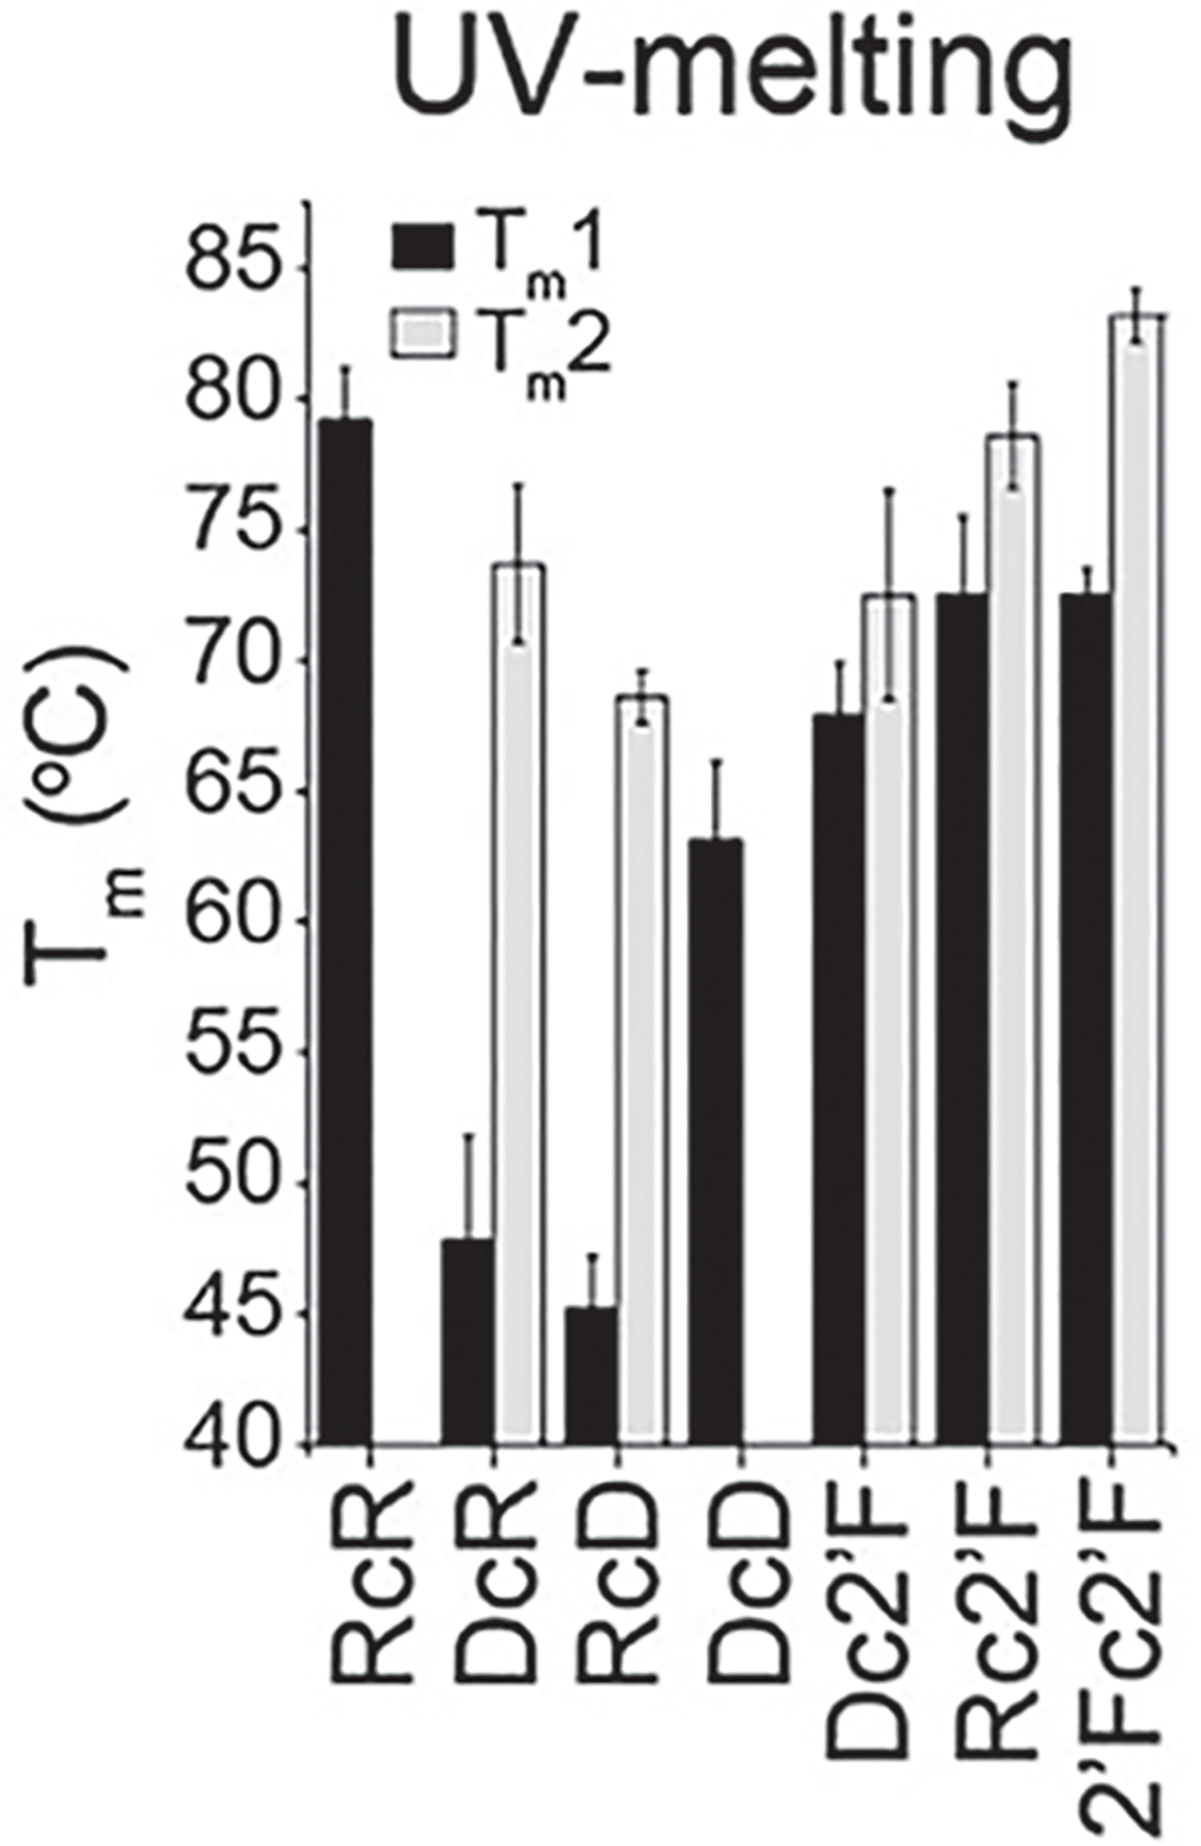
UV-melting experiment to measure the melting temperature of NANPs. (Reproduced from Ref. [5])
Fig. 3.
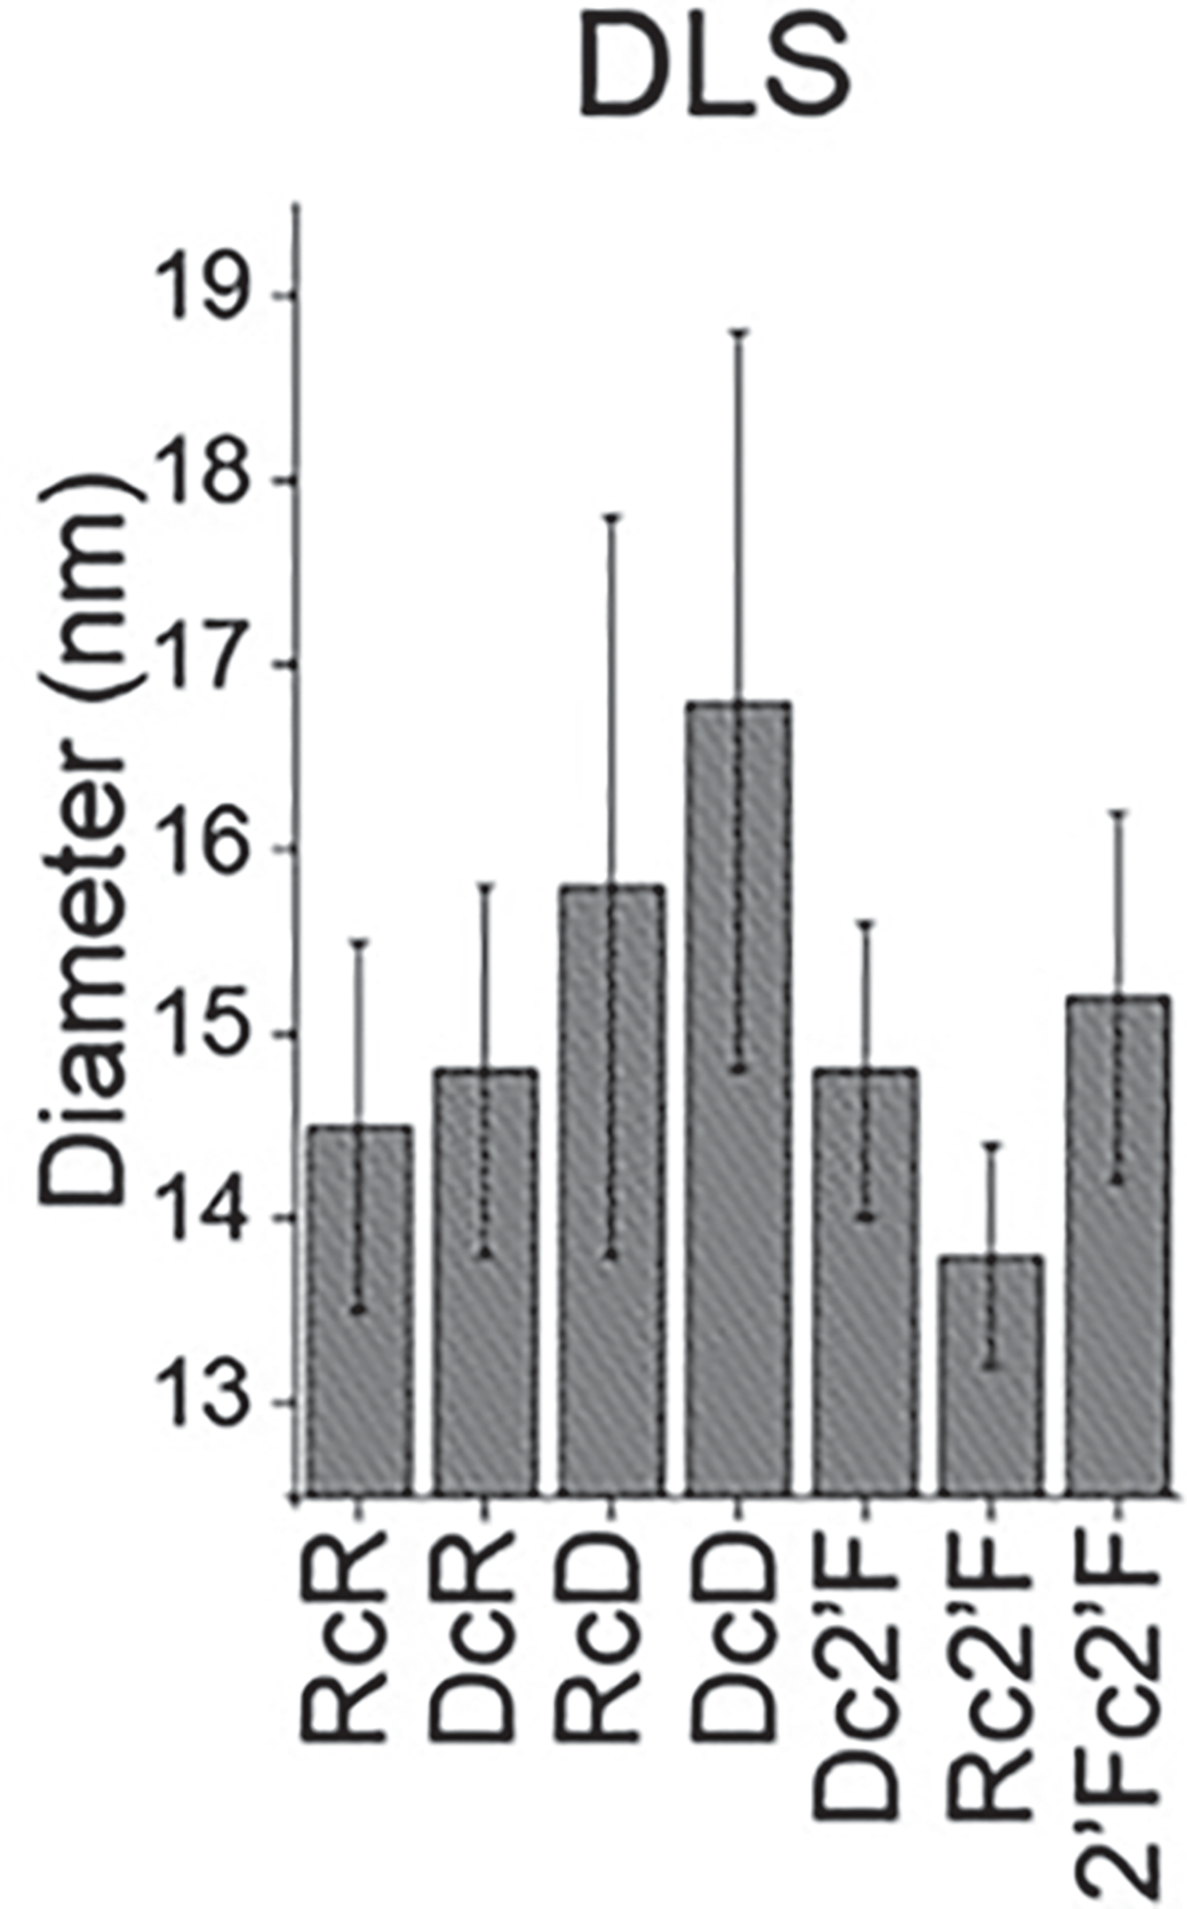
Assessment of relative sizes of NANPs by DLS. (Reproduced from Ref. [5])
Fig. 4.
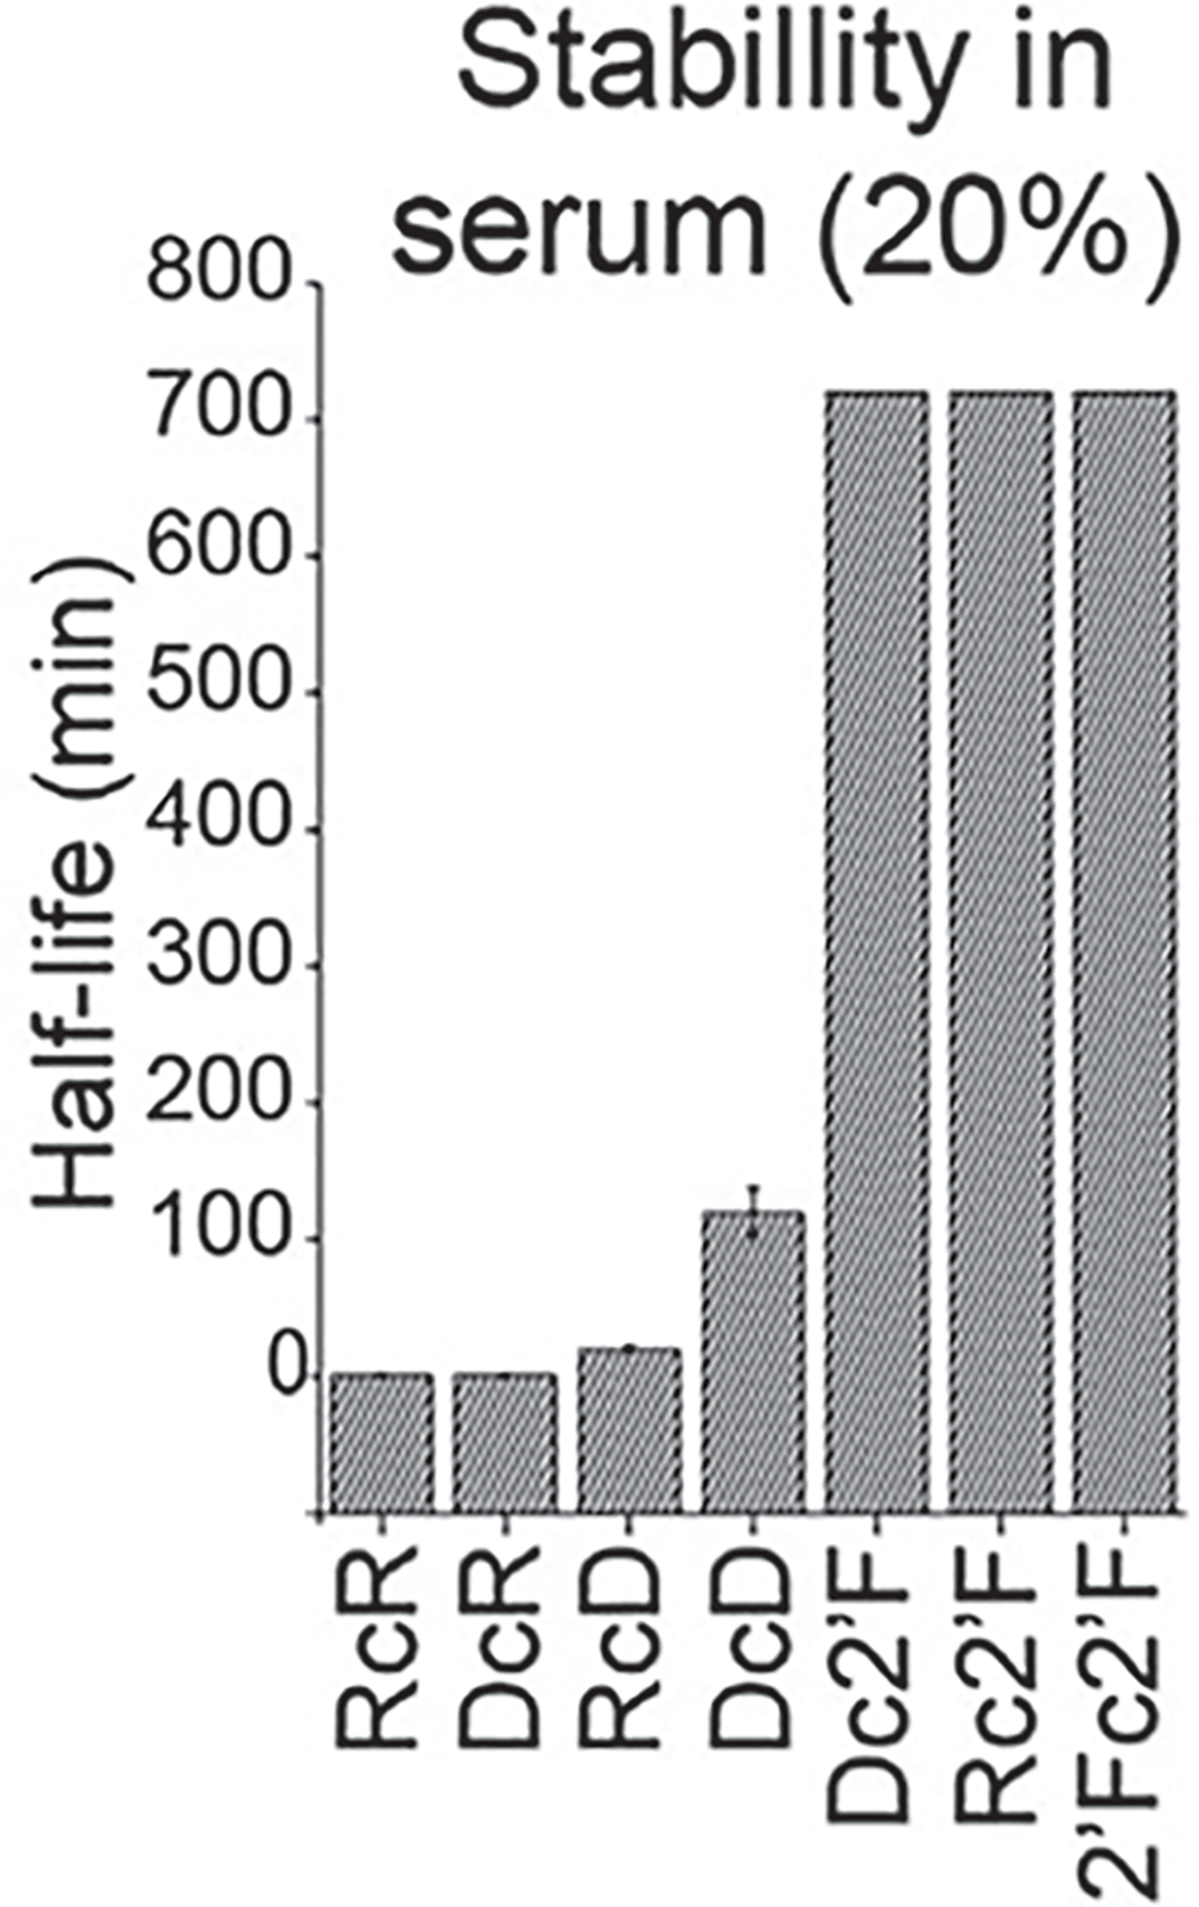
Chemical stability analysis by EMSA of NANPs in 20% FBS incubated at 37 °C from 1 to 720 min. (Reproduced from Ref. [5])
Fig. 5.
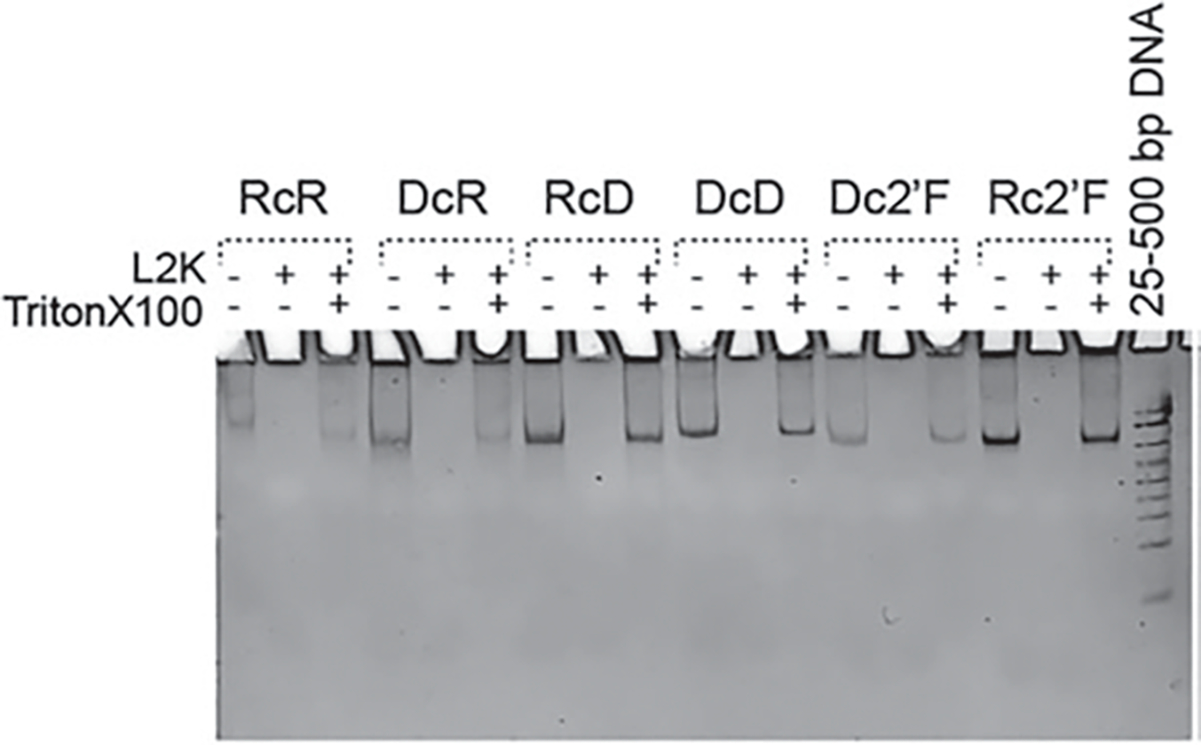
EtBr total staining native PAGE confirming the structural integrity of NANPs upon release from Lipofectamine 2000 (L2K) complexation. (Reproduced from Ref. [5])
Fig. 6.
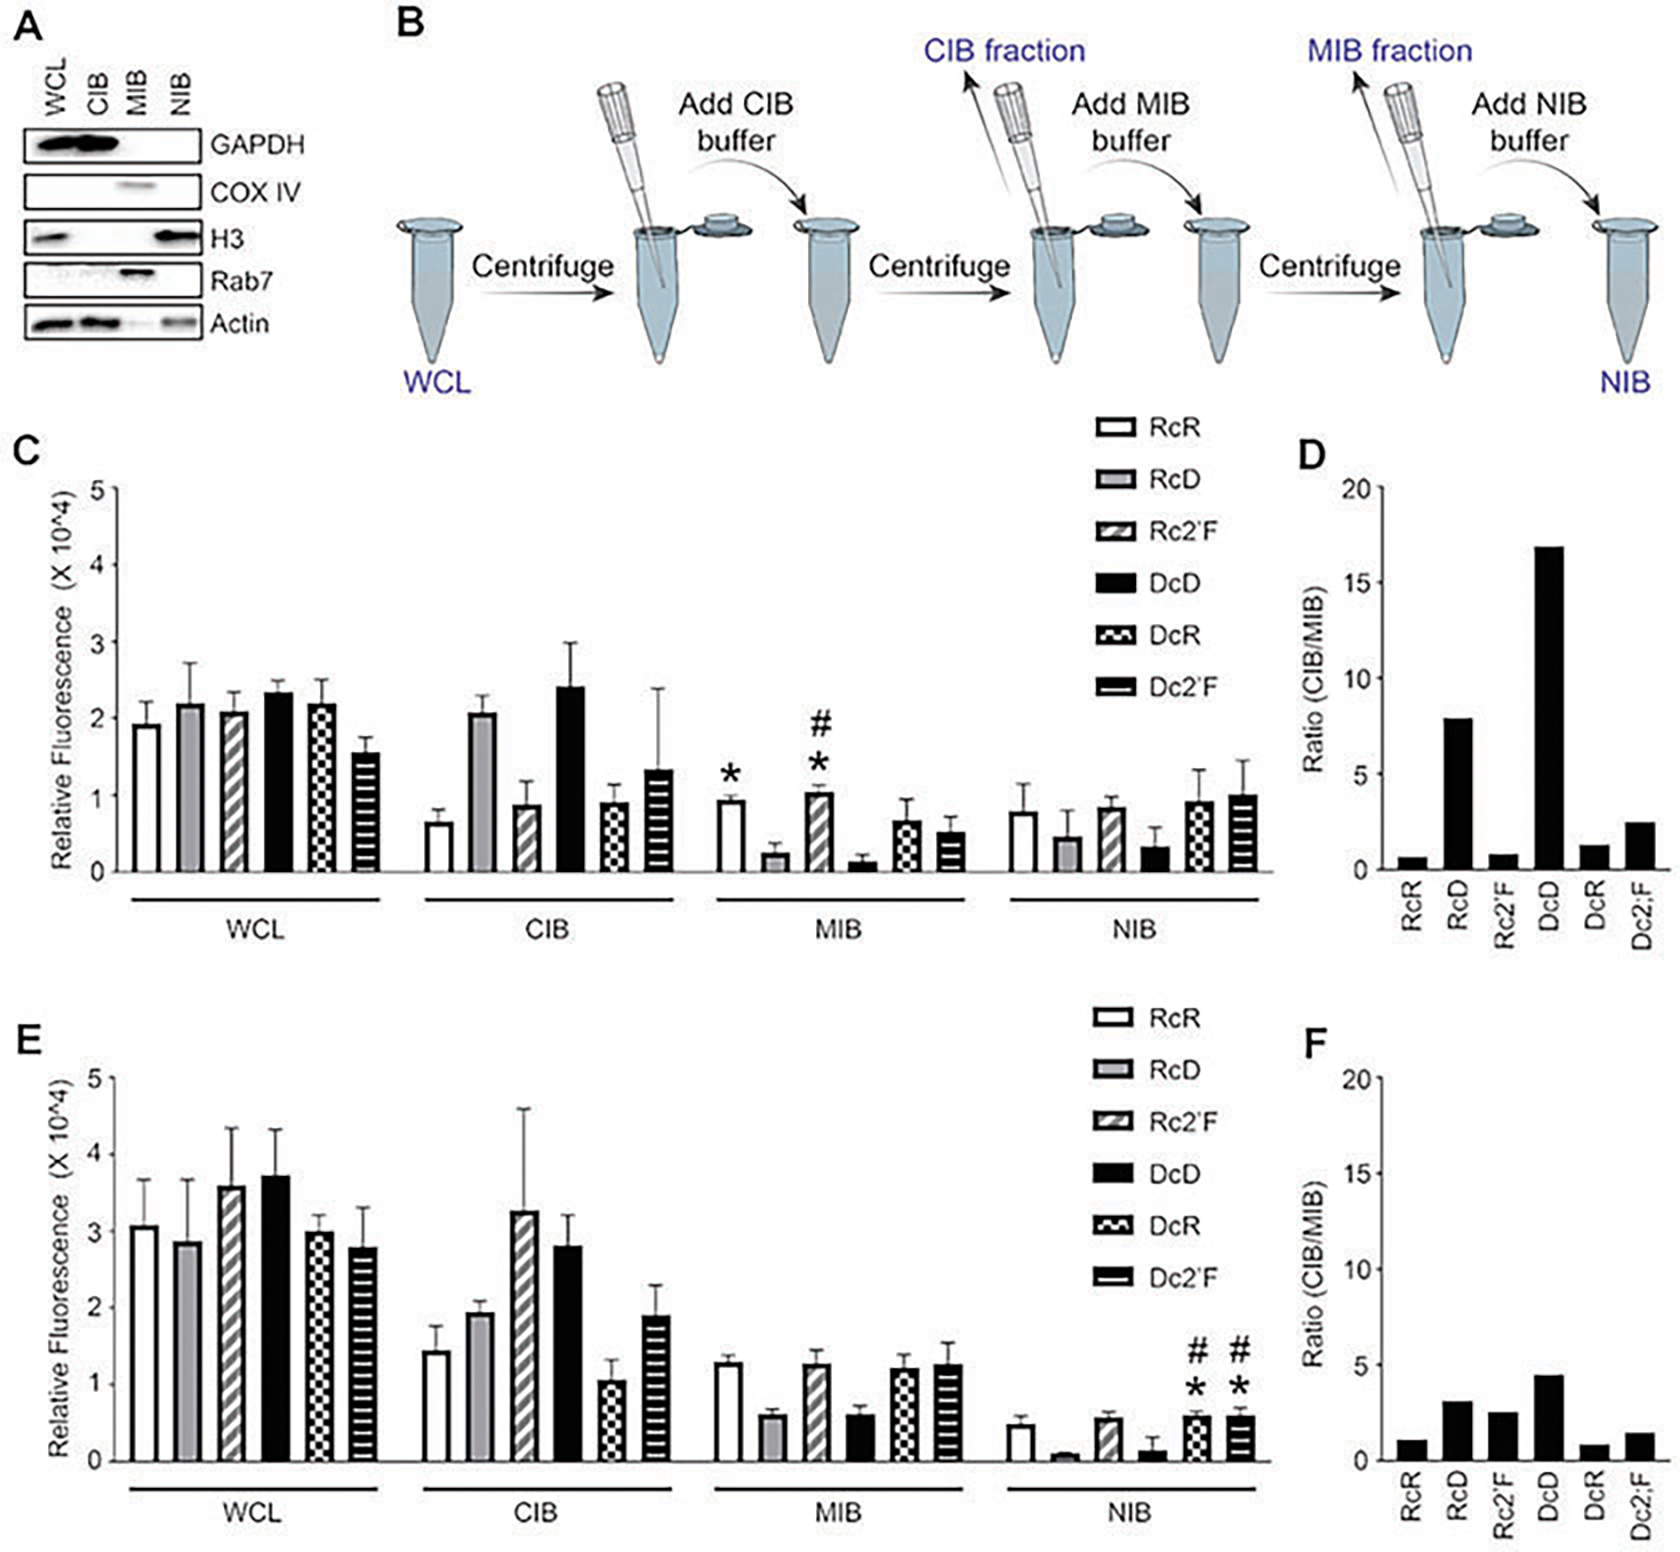
Cellular fractionation into cytosolic (cytosolic isolation buffer, CIB), membrane/organelle (membrane/organelle isolation buffer, MIB), and nuclear/cytoskeleton (nuclear/cytoskeleton isolation buffer, NIB) fractions. (a) Immunoblot analysis for evaluation protein expression of GAPDH, COX IV, histone 3 (H3), Rab7, and actin in fractions. (b) Illustration of cell fractionation protocol. Fluorescence of cell fractions at (c) 2 h and (e) 4 h. The (CIB/MIB) ratio showed at (d) 2 h and (f) 4 h. (Reproduced from Ref. [5])
Fig. 7.

Flow cytometry to determine relative cellular uptake of NANPs. (a) Transfection of microglia with 5 nMCy3-labeled NANPs using L2K for 4 h. (b) Transfection of microglia with 5 nMCy3-labeled NANPs using DOTAP for 4 h. (c) A graph showing the average percent positive cells for NANPs delivered with DOTAP and L2K. (Reproduced from Ref. [5])
Fig. 8.
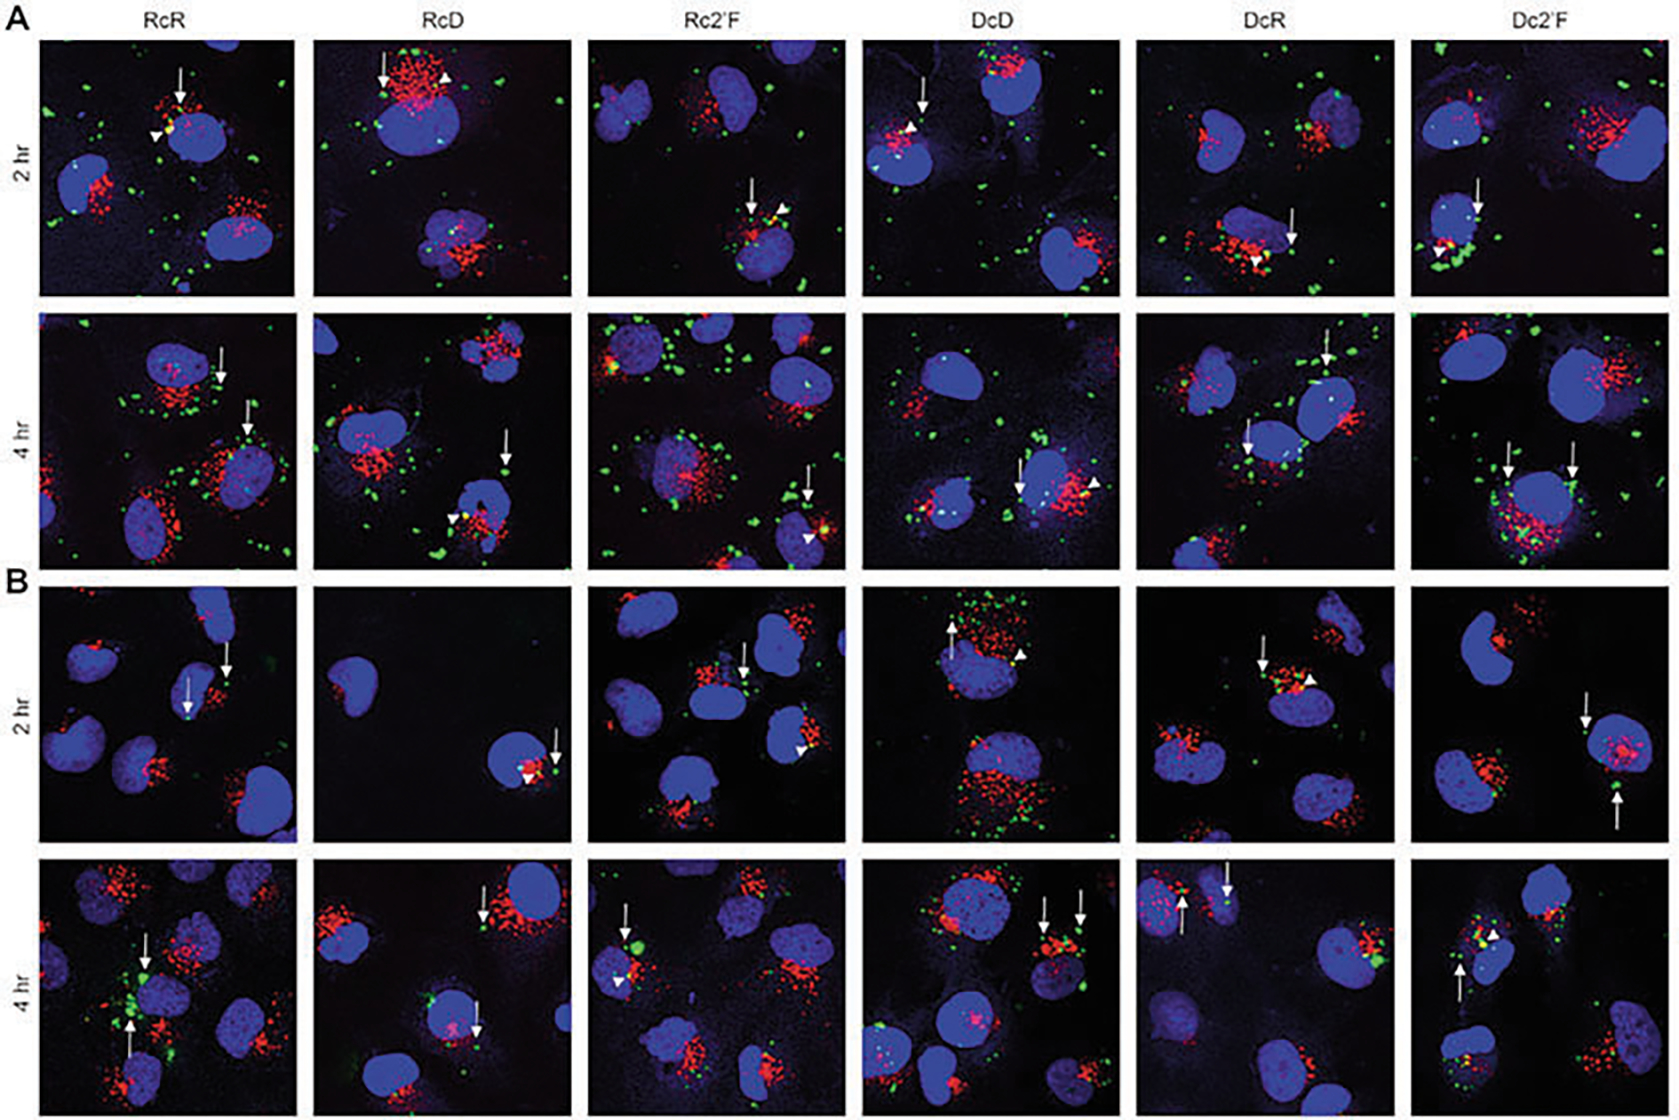
Fluorescent immunohistochemical analysis of samples. (a) Microglia transfected with 5 nMCy3-labeled NANPs using L2K, (b) or DOTAP, for 2 h and 4 h by immunofluorescence microscopy. The images show the localization of NANPs (green) within the cells, early endosomal marker (EEA1) (red), and nuclear stain DAPI (blue). Arrows indicate NANPS not colocalized with EEA1, and arrow heads indicate NANPS colocalized with EEA1. (Reproduced from Ref. [5])
3.1. Statistical Analysis
Present data as the mean ± standard error of the mean (SEM).
Perform statistical analyses on data using Student’s t-test, one-way analysis of variance (ANOVA) with Bonferroni’s or Tukey’s post hoc tests, or two-way ANOVA with Dunnet’s post hoc test using GraphPad Prism, GraphPad 15 Software.
Consider p-value of <0.05 as statistically significant.
4. Notes
-
Use the following equation to fit the absorbance data:
= temperature (°C).
= absorbance at λ = 260 nm.
= bottom plateau (asymptote 1) or Abs at fully associated state.
= the upper plateau (asymptote 2) or Abs at fully dissociated state.
= temperature at the midpoint or Tm.
= measure of steepness of the inflection.
Acknowledgments
Research reported in this publication was supported by the National Institute of General Medical Sciences of the National Institutes of Health under Award Numbers R01GM120487 and R35GM139587 (to K.A.A.). The content is solely the responsibility of the authors and does not necessarily represent the official views of the National Institutes of Health.
References
- 1.Juneja R, Vadarevu H, Halman J, Tarannum M, Rackley L, Dobbs J et al. (2020) Combination of nucleic acid and mesoporous silica nanoparticles: optimization and therapeutic performance in vitro. ACS Appl Mater Interfaces 12(35):38873–38886 [DOI] [PMC free article] [PubMed] [Google Scholar]
- 2.Dobrovolskaia MA, McNeil SE (2015) Immunological and hematological toxicities challenging clinical translation of nucleic acid-based therapeutics. Expert Opin Biol Ther 15(7):1023–1048 [DOI] [PubMed] [Google Scholar]
- 3.Rackley L, Stewart JM, Salotti J, Krokhotin A, Shah A, Halman JR et al. (2018) RNA fibers as optimized nanoscaffolds for siRNA coordination and reduced immunological recognition. Adv Funct Mater 28(48):1805959. [DOI] [PMC free article] [PubMed] [Google Scholar]
- 4.Ke W, Hong E, Saito RF, Rangel MC, Wang J, Viard M et al. (2019) RNA-DNA fibers and polygons with controlled immunorecognition activate RNAi, FRET and transcriptional regulation of NF-κB in human cells. Nucleic Acids Res 47(3):1350–1361 [DOI] [PMC free article] [PubMed] [Google Scholar]
- 5.Johnson MB, Halman JR, Miller DK, Cooper JS, Khisamutdinov EF, Marriott I et al. (2020) The immunorecognition, subcellular compartmentalization, and physicochemical properties of nucleic acid nanoparticles can be controlled by composition modification. Nucleic Acids Res 48(20):11785–11798 [DOI] [PMC free article] [PubMed] [Google Scholar]
- 6.Bui M, Johnson M, Viard M, Satterwhite E, Martins A, Li Z et al. (2017) Versatile RNA tetra-U helix linking motif as a toolkit for nucleic acid nanotechnology. Nanomed-Nanotechnol Biol Med 13(3):1137–1146 [DOI] [PMC free article] [PubMed] [Google Scholar]
- 7.Stewart JM, Viard M, Subramanian HK, Roark BK, Afonin KA, Franco E (2017) Correction: programmable RNA microstructures for coordinated delivery of siRNAs. Nanoscale 9(15):5019. [DOI] [PubMed] [Google Scholar]
- 8.Jasinski D, Haque F, Binzel D, Guo P (2017) Advancement of the emerging field of RNA nanotechnology. ACS Nano 11(2):1142–1164 [DOI] [PMC free article] [PubMed] [Google Scholar]
- 9.Schmitt FCF, Freund I, Weigand MA, Helm M, Dalpke AH, Eigenbrod T (2017) Identification of an optimized 2′. RNA 23(9):1344–1351 [DOI] [PMC free article] [PubMed] [Google Scholar]
- 10.Behlke MA (2008) Chemical modification of siRNAs for in vivo use. Oligonucleotides 18(4):305–319 [DOI] [PubMed] [Google Scholar]
- 11.Wilds CJ, Damha MJ (2000) 2′-Deoxy-2′-fluoro-beta-D-arabinonucleosides and oligonucleotides (2′F-ANA): synthesis and physicochemical studies. Nucleic Acids Res 28(18):3625–3635 [DOI] [PMC free article] [PubMed] [Google Scholar]
- 12.Afonin KA, Viard M, Kagiampakis I, Case CL, Dobrovolskaia MA, Hofmann J et al. (2015) Triggering of RNA interference with RNA-RNA, RNA-DNA, and DNA-RNA nanoparticles. ACS Nano 9(1):251–259 [DOI] [PMC free article] [PubMed] [Google Scholar]
- 13.Robbins M, Judge A, Liang L, McClintock K, Yaworski E, MacLachlan I (2007) 2’-O-methyl-modified RNAs act as TLR7 antagonists. Mol Ther 15(9):1663–1669 [DOI] [PubMed] [Google Scholar]
- 14.Lee Y, Urban JH, Xu L, Sullenger BA, Lee J (2016) 2’Fluoro modification differentially modulates the ability of RNAs to activate pattern recognition receptors. Nucleic Acid Ther 26(3):173–182 [DOI] [PMC free article] [PubMed] [Google Scholar]


