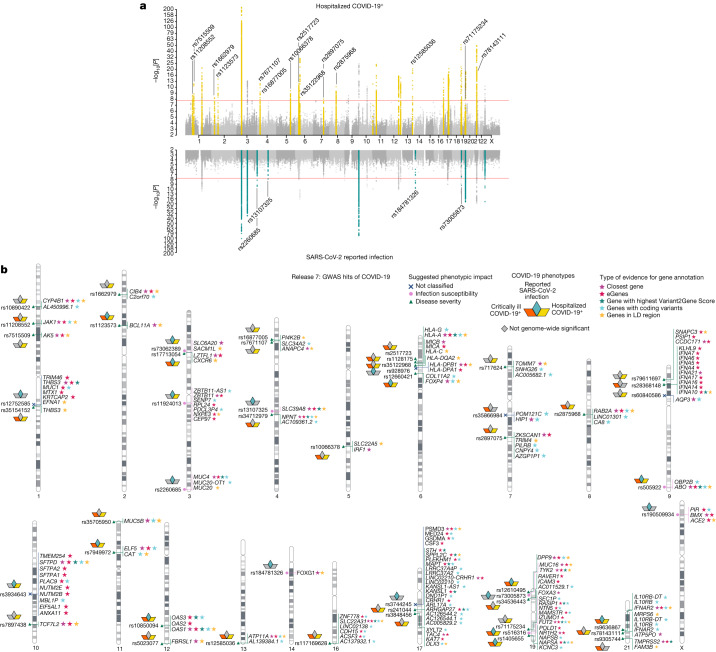
Fig. 2. GWAS results for COVID-19.
a, The results of a GWAS analysis of hospitalized individuals with COVID-19 (n = 49,033 cases and n = 3,393,109 controls) (top), and the results for individuals with reported SARS-CoV-2 infection (n = 219,692 cases and n = 3,001,905 controls) (bottom). The loci highlighted in yellow (top) represent regions that are associated with severity of COVID-19. The loci highlighted in green (bottom) are regions associated with susceptibility to SARS-CoV-2 infection. Lead variants for the loci that were identified in this data release are annotated with their respective rsID. The y axis is on the −log10 (P) scale up to 10, after which it switches to a 10 × log10[−log10(P)] scale to aid presentation. b, Results of gene prioritization using different evidence measures of gene annotation. For the genes in a linkage-disequilibrium (LD) region, genes with coding variants and eGenes (fine-mapped cis-expression quantitative trait locus (cis-eQTL) variant with posterior inclusion probability (PIP) >0.1 in GTEx Lung) are annotated as such if they are in linkage disequilibrium with a COVID-19 lead variant (r2 > 0.6). V2G, the highest gene prioritized by OpenTargetGenetics V2G score. The pink circle indicates SARS-CoV-2 infection susceptibility, the green triangle indicates COVID-19 severity and the blue cross indicates unclassified. This figure was reproduced from the original publication by the COVID-19 HGI1 with modifications reflecting the updated analysis from data release 7.

