Abstract
Purpose
To investigate whether vorticity could predict functional plaque progression better than high-risk plaque (HRP) and lesion length (LL) in individuals with type 2 diabetes mellitus.
Materials and Methods
This single-center prospective study included 61 participants (mean age, 61 years ± 9 [SD]; 43 male participants) who underwent serial coronary CT angiography at 2 years, with 20%–70% stenosis at initial CT between October 2015 and March 2020. The number of the following HRP characteristics was recorded: low attenuation, positive remodeling, spotty calcification, and napkin-ring sign. Vorticity was calculated using a mesh-free simulation. A decrease in CT fractional flow reserve larger than 0.05 indicated functional progression. Models using HRP and LL and vorticity were compared using receiver operating characteristic curve analysis.
Results
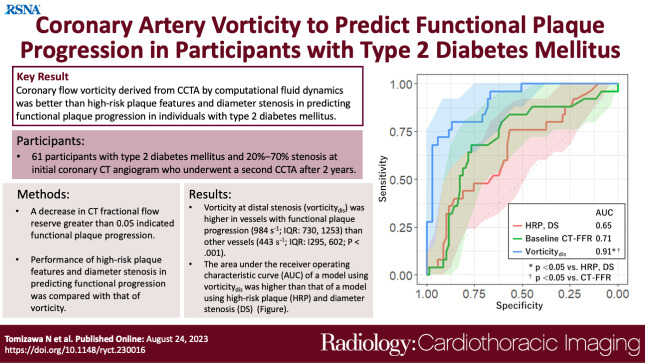
Of the 94 vessels evaluated, 25 vessels (27%) showed functional progression. Vessels with functional progression showed higher vorticity at distal stenosis (984 sec-1; IQR: 730–1253 vs 443 sec-1; IQR: 295–602; P < .001) than vessels without progression. The area under the receiver operating characteristic curve of vorticity (0.91; 95% CI: 0.84, 0.97) was higher than that of HRP and LL (0.69; 95% CI: 0.56, 0.82; P < .01). Diagnostic accuracy of vorticity (85%; 80 of 94 vessels; 95% CI: 76, 92) was higher than that of HRP and LL (72%; 68 of 94 vessels; 95% CI: 62, 81; P = .004).
Conclusion
In participants with type 2 diabetes mellitus, vorticity at distal stenosis was a better predictor of functional plaque progression than HRP and LL.
Keywords: Coronary Artery, Vorticity, Functional Plaque Progression, Type 2 Diabetes, Vasculature, CT Angiography, Computational Fluid Dynamics, Fractional Flow Reserve
Supplemental material is available for this article.
© RSNA, 2023
Keywords: Coronary Artery, Vorticity, Functional Plaque Progression, Type 2 Diabetes, Vasculature, CT Angiography, Computational Fluid Dynamics, Fractional Flow Reserve
Summary
Coronary flow vorticity derived from coronary CT angiography by computational fluid dynamics was better than high-risk plaque and lesion length in predicting functional plaque progression in participants with type 2 diabetes mellitus.
Key Points
■ Vessels with functional plaque progression had higher vorticity at distal stenosis (984 sec-1 [IQR: 730–1253] vs 443 sec-1 [IQR: 295–602], P < .001) than other vessels.
■ The area under the receiver operating characteristic curve in a model using vorticity at distal stenosis (0.91; 95% CI: 0.84, 0.97) was higher than that using high-risk plaque, diameter stenosis, and lesion length (0.69; 95% CI: 0.56, 0.82; P < .01).
■ The diagnostic accuracy of vorticity at distal stenosis (cutoff: 716 sec-1; 85%; 80 of 94 vessels; 95% CI: 76, 92) was higher than that of high-risk plaque and lesion length (72%; 68 of 94 vessels; 95% CI: 62, 81; P = .04).
Introduction
Computational fluid dynamics (CFD) using coronary CT angiography (CCTA) has become available to evaluate functional significance of coronary stenosis (1). Besides pressure calculations, CFD can also evaluate the degree of flow turbulence and frictional forces on the vessel walls (2,3). Previous studies have shown that both high and low wall shear stress are associated with future cardiovascular events (2,4). In addition to wall shear stress, vorticity analysis of coronary flow has attracted attention as a method for evaluating coronary flow disturbance (3). Vorticity is an index that reflects flow turbulence and can be calculated using the velocity vector of the entire coronary lumen (3). Vortex formation is driven by arterial stenosis, worsening with increased stenosis grade (5). A previous study showed that vorticity values larger than 900 sec−1 were associated with flow-limiting stenosis (3).
Patients with type 2 diabetes mellitus are at risk for coronary artery disease, including nonsignificant lesions (6), and the extent of plaque distribution begins at the borderline state of the condition (7). High-risk coronary plaque depicted with CCTA is a risk factor for future cardiac events (8). A study using a stenosed porcine model showed that elevated vorticity distal to stenosis impairs endothelial function and causes platelet activation (9). However, little is known regarding whether vorticity in addition to high-risk morphology can predict plaque progression. Additionally, previous studies defined plaque progression based on morphology (10), and risk factors that predict functional plaque progression are unknown.
Therefore, the aim of the present study was to investigate the risk factors, including vorticity and high-risk morphology, in predicting functional plaque progression as assessed with CT fractional flow reserve (CT-FFR) in participants with type 2 diabetes mellitus.
Materials and Methods
Participants
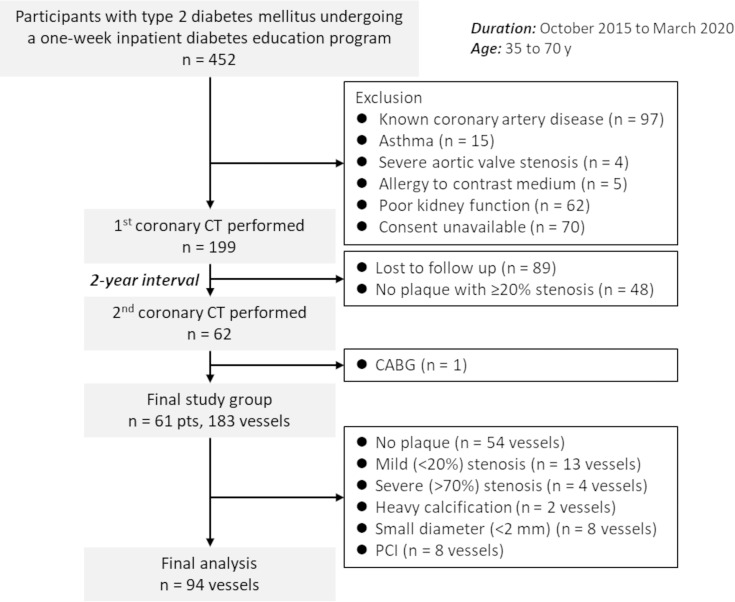
This single-center prospective study was approved by the institutional review board, and written informed consent to participate in the study and undergo serial CCTA at 2 years was provided by all participants. We initially included 452 consecutive participants between the ages of 35 and 70 years old with type 2 diabetes mellitus who were offered a 1-week in-hospital diabetes education program between October 2015 and March 2020 (Fig 1). The exclusion criteria were as follows: (a) known coronary artery disease (n = 97), (b) asthma (n = 15), (c) severe aortic valve stenosis confirmed with US (n = 4), (d) allergy to contrast medium (n = 5), (e) poor kidney function (n = 62), and (f) consent unavailable (n = 70). The first CCTA was performed in 199 participants, and 48 participants without plaque causing greater than or equal to 20% stenosis were excluded. Eighty-nine participants withdrew from the study, resulting in a second CCTA 2 years later in 62 participants. Of the 62 participants, one underwent coronary artery bypass grafting and was excluded from analysis. Therefore, the final study group included 61 participants. The Framingham risk score was calculated to evaluate the cardiovascular risk (11). Of the eligible 183 vessels, 94 vessels with 20%–70% stenosis at the initial CT were analyzed. If multiple plaques were present, the most proximal plaque was considered. Per-vessel analysis was performed in this study.
Figure 1:
Participant flowchart. The study initially included 452 consecutive participants undergoing a 1-week inpatient diabetes education program. The first coronary CT angiography was performed in 199 participants, and the second coronary CT angiography 2 years later was performed in 62 participants. The final analysis included 61 participants and 94 vessels with 20%–70% stenosis. CABG = coronary artery bypass grafting, PCI = percutaneous coronary intervention, pts = participants.
CCTA Studies
A 320-row CT scanner was used to perform CCTA (Aquilion ONE Genesis Edition; Canon Medical Systems). The detailed CT acquisition protocol is provided in Appendix S1. Images were reconstructed with a section thickness of 0.50 mm and an increment of 0.25 mm using a convolution kernel of FC04 with iterative reconstruction (AIRD 3D [adaptive iterative dose reduction using a three-dimensional processing algorithm]; Canon Medical Systems). Images were transferred to a workstation for postprocessing (Synapse Vincent, version 6.0; Fujifilm Medical).
Coronary Stenosis and Plaque Analysis
Measurements were performed by a cardiovascular radiologist (N.T., with 15 years of experience) who was blinded to plaque progression results. A dedicated workstation software (Coronary Analysis; Fujifilm Medical) automatically identified the lumen border to measure the diameter stenosis (DS) and lesion length (LL). Plaque analysis was qualitatively performed using cross-sectional and curved planar reformatted images to detect the following features: low attenuation (CT number < 30 HU), positive remodeling (remodeling index, >1.1), spotty calcification, and napkin-ring sign (12). The total number of high-risk plaque (HRP) characteristics was used for further analysis. As a second observer, a cardiovascular physician (D.T., with 5 years of experience in cardiovascular analysis) analyzed these values in 30 randomly selected vessels from different participants.
CFD Analysis
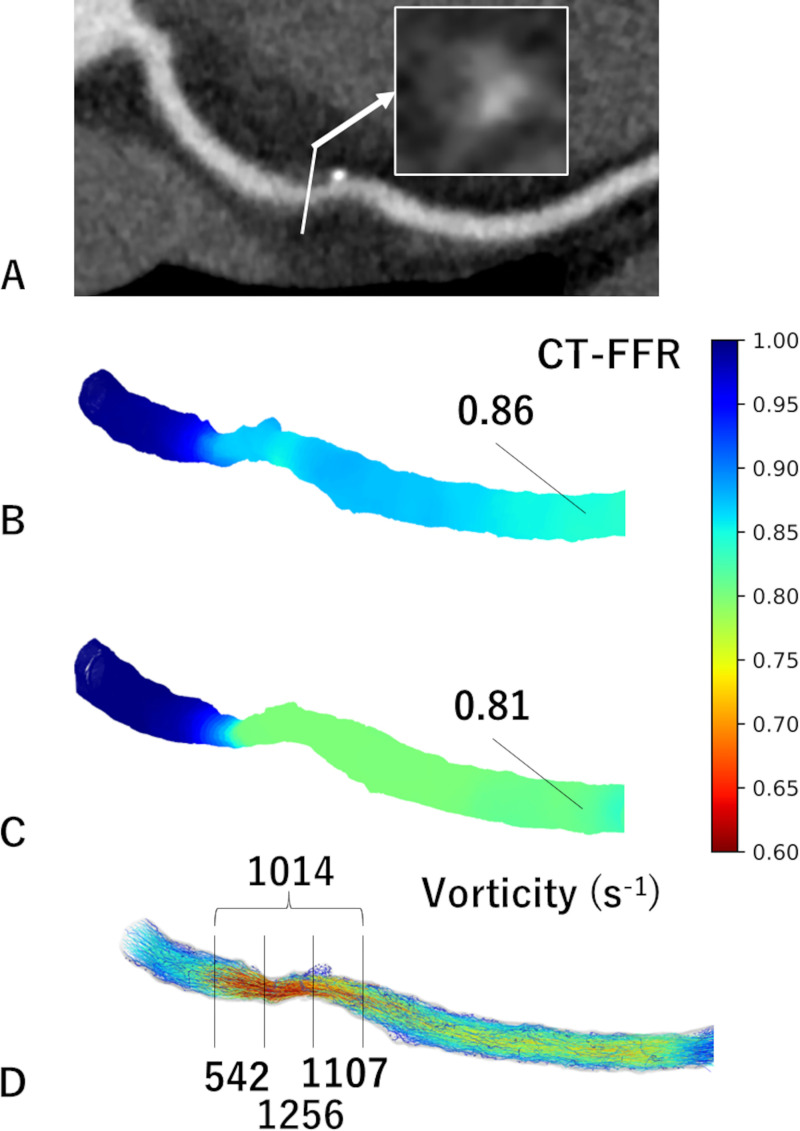
We used a mesh-free method (OpenMPS) to perform CFD analysis. The OpenMPS software is an open-source implementation of the moving particle semi-implicit method available at GitHub (https://github.com/OpenMps/openmps) (13). In brief, a three-dimensional CFD algorithm was employed from approximately 1 cm proximal to 2 cm distal to the stenosis. The CT-FFR value at 2 cm distal to the stenosis was recorded (Fig 2). If CT-FFR decreased by greater than 0.05 at the second CCTA, the stenosis was considered to be functionally progressive. We determined a CT-FFR change in the difference of ratios greater than 0.05 to be significant to exclude measurement error and because the range for gray-zone CT-FFR values is 0.05 (1). Calculation of vorticity is described in Appendix S1. Vorticity of the following four points were acquired: the proximal (vorticityprox), middle (vorticitymid), and distal (vorticitydis) thirds of the lesion and the entire lesion (vorticityent). Measurements were performed by a cardiovascular radiologist (N.T.). Methods for inter- and intraobserver analyses are described in Appendix S1.
Figure 2:
Images in a 55-year-old male participant with functional plaque progression at 2 years. (A) Coronary CT angiographic image with cross-sectional magnification (arrow) shows positive remodeling, low attenuation, and the napkin-ring sign. (B) The initial CT fractional flow reserve (CT-FFR) was 0.86, which progressed to (C) 0.81 in 2 years. (D) The vorticity of the distal segment of stenosis was 1107 sec-1 using the initial coronary CT data.
Statistical Analysis
Continuous variables are shown as means ± SDs and categorical variables as numbers with percentages, unless otherwise described. The Student t test was used to compare continuous variables. The Fisher exact test and Wilcoxon rank sum test were used to compare categorical variables and skewed variables, respectively. The McNemar test was used to compare the accuracy of each potential risk factor in detecting functional progression. We adjusted the multiple vessels per participant. Methods to assess interobserver agreement are mentioned in Appendix S1.
Logistic regression analysis was used to predict functional progression. Variables with P values less than .10 in univariable analysis were included in multivariable analysis. As for vorticity, the segment with the highest odds ratio (OR) was included in multivariable analysis. Generalized estimated equations were used to adjust multiple vessels per patient. Receiver operating characteristic curve analysis was used to compare the predictive value of vorticity at various segments: HRP and LL, baseline CT-FFR, and vorticity at distal stenosis. The Youden index was used to determine the optimal cutoff value.
Differences in area under the receiver operating characteristic curve (AUC) values were assessed using the DeLong method using the logistic regression analysis adjusted for multiple vessels per participant. Logistic regression analysis and calculation of intraclass correlation coefficients (ICCs) were performed using the packages clust.bin.pair, clusrank, broom, geepack, ggplot2, and pROC with R software (version 4.0.2; R Foundation). The remaining statistical analyses were performed using JMP software (version 16.0.0; SAS institute). A P value less than .05 was considered to indicate a statistically significant difference.
Results
Participant and Lesion Characteristics
The study included 61 participants (mean age, 61 years ± 9 [SD]; 43 male participants) (Table 1). The mean Framingham risk score was 11.2 ± 3.3. Mean heart rate during the scan was 58.6 beats per minute ± 7.8 (SD), and all participants had adequate diagnostic image quality. More than half of the participants had dyslipidemia and a smoking history. Diabetic retinopathy, nephropathy, and neuropathy were present in 10 (16%), 13 (22%), and 23 (38%) participants, respectively. Insulin, oral hypoglycemic drugs, and statins were prescribed in 20 (33%), 49 (80%), and 40 (66%) participants, respectively.
Table 1:
Participant Demographics
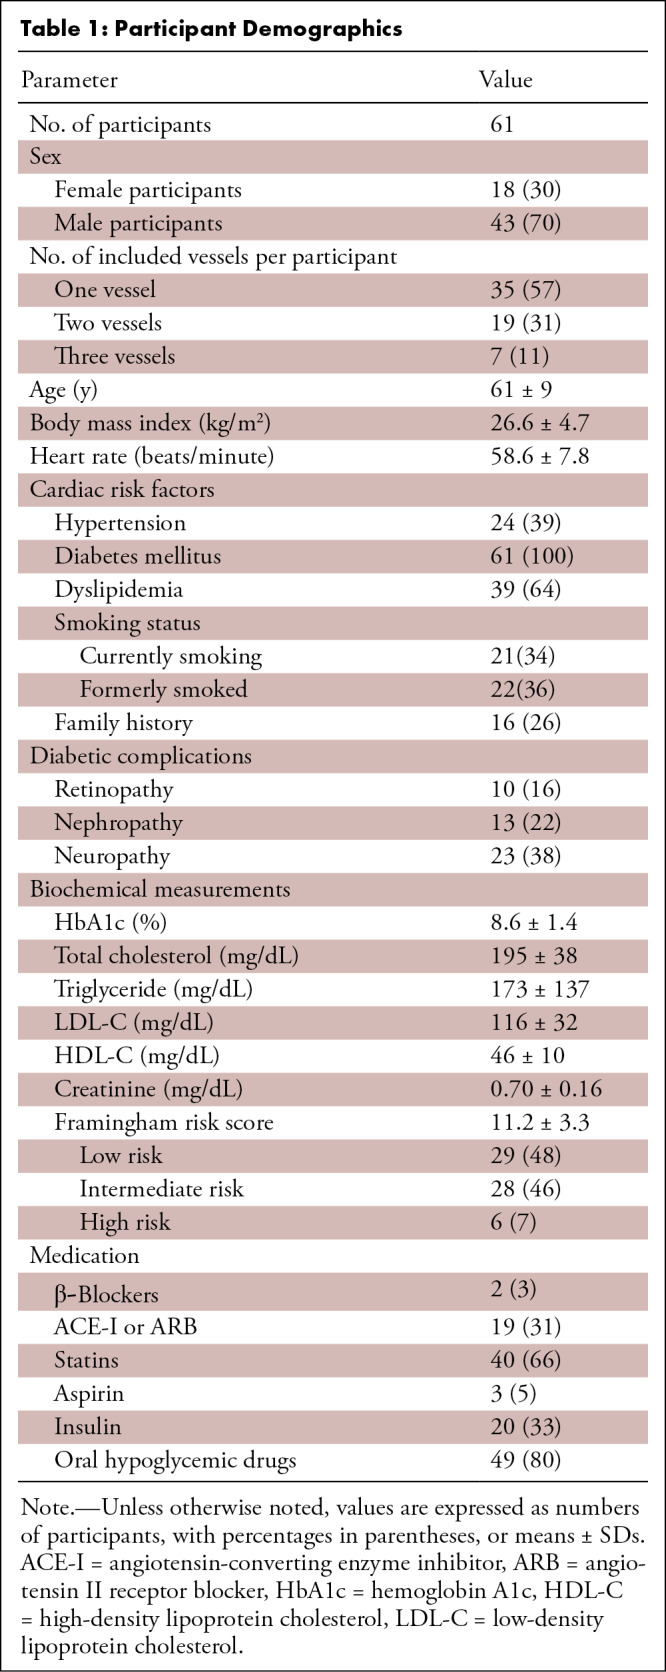
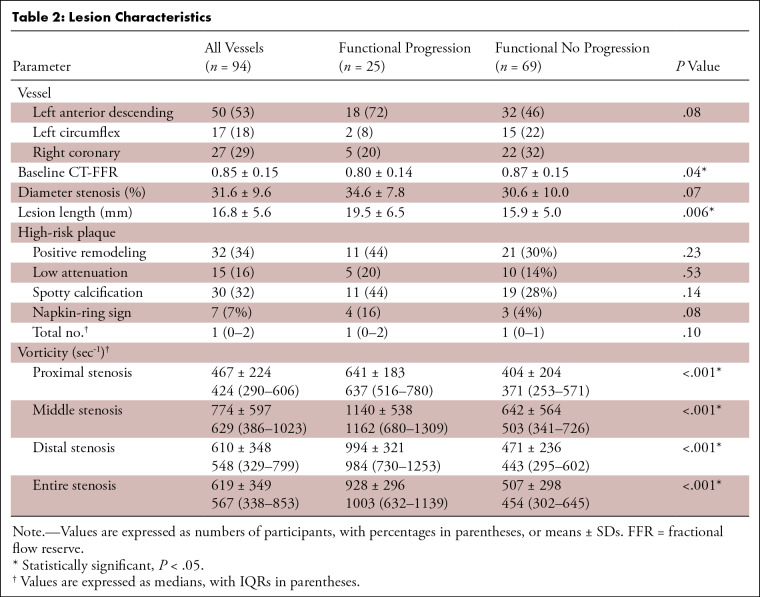
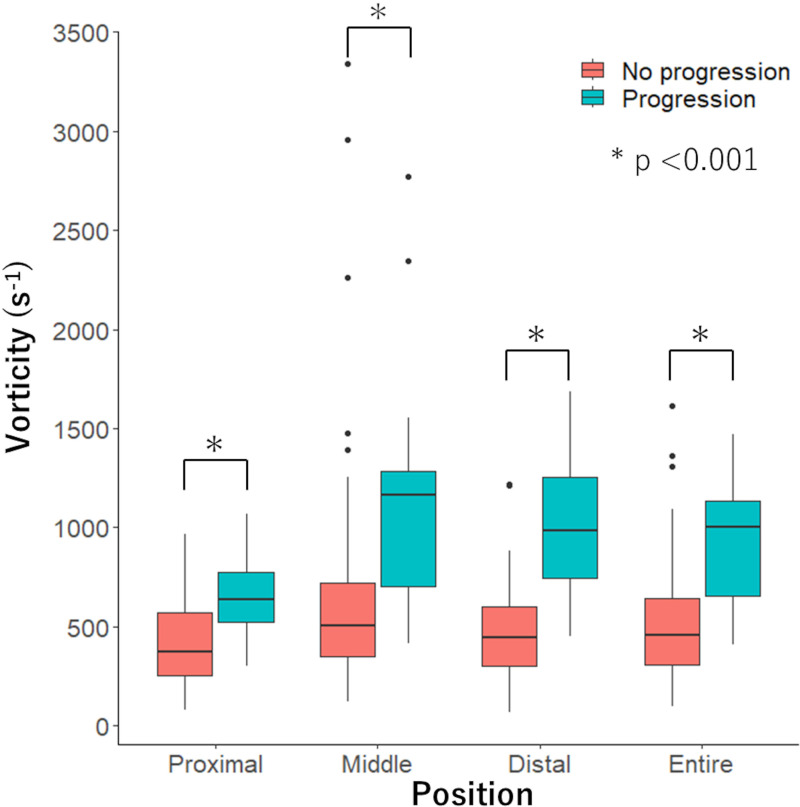
A total of 94 vessels with intermediate stenosis were analyzed. One, two, or three vessels were analyzed in 35 (57%), 19 (31%), and seven (11%) participants, respectively. Most lesions were located in the left anterior descending artery (50 vessels; 53%), followed by the right coronary (27 vessels; 29%) and left circumflex (17 vessels; 18%) arteries (Table 2). Functional progression was observed in 25 vessels (27%) from 21 participants. Vessels with functional progression had lower baseline CT-FFR (0.80 ± 0.14 vs 0.87 ± 0.15, P = .04) than vessels without progression. We found no evidence of a difference in DS (34.6% ± 7.8 vs 30.6% ± 10.0, P = .07) and numbers of HRP characteristics (median, 1; IQR: 0–2 vs median, 1; IQR: 0–1; P = .10) between vessels with and without functional progression. Vessels with functional progression had longer LLs (19.5 mm ± 6.5 vs 15.9 mm ± 5.0, P = .006), higher vorticity in proximal (median, 637 sec-1; IQR: 516–780 vs median, 371 sec-1; IQR: 253–571; P < .001), middle (median, 1162 sec-1; IQR: 680–1309 vs median, 503 sec-1; IQR: 341–726; P < .001), distal (median, 984 sec−1; IQR: 730–1253 vs median, 443 sec−1; IQR: 295–602; P < .001), and entire (median, 1003 sec-1; IQR: 632–1139 vs median, 454 sec-1; IQR: 302–645; P < .001) stenosis than vessels without (Fig 3).
Table 2:
Lesion Characteristics
Figure 3:
Graph shows comparison of vorticity of proximal, middle, distal, and entire stenosis in vessels with and without functional progression. Vorticity of vessels with functional progression was higher than vessels without in all segments (P < .001).
Influence of Cardiovascular Risk on Lesion Characteristics and Vorticity
Cardiovascular risk assessed by Framingham risk score was low and intermediate-to-high in 44 (47%) and 50 (53%) vessels, respectively. We found no evidence of a difference in DS (30.2% ± 8.9 vs 32.9% ± 10.1, P = .17), LL (15.9 mm ± 6.9 vs 17.6 mm ± 5.2, P = .14), HRP (median, 0; IQR: 0–1 vs median, 1; IQR: 0–2, P = .26), and vorticityent (median, 493; IQR: 309–656 vs median, 623; IQR: 375–1012, P = .10) between vessels with low and intermediate-to-high cardiovascular risk (Table S1).
Logistic Regression Analysis
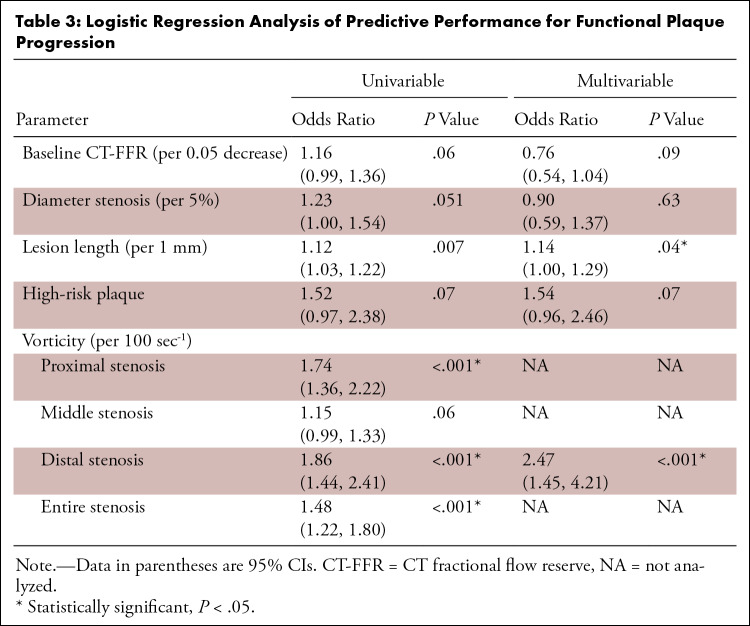
Univariable analysis showed that baseline CT-FFR (per 0.05 decrease; OR, 1.16; 95% CI: 0.99, 1.36; P = .06), DS (per 5%; OR, 1.23; 95% CI: 1.00, 1.54; P = .051), and HRP (OR, 1.52; 95% CI: 0.97, 2.38; P = .07) were not predictors for functional progression, while LL was a predictor (per 1 mm; OR, 1.12; 95% CI: 1.03, 1.22; P = .007) (Table 3). Vorticity of proximal, distal, and entire stenosis were predictors of functional progression. Comparing proximal, middle, distal, and entire stenosis, vorticitydis (per 100 sec-1; OR, 1.86; 95% CI: 1.44, 2.41; P < .001) showed the largest OR.
Table 3:
Logistic Regression Analysis of Predictive Performance for Functional Plaque Progression
When HRP, DS, LL, baseline CT-FFR, and vorticitydis were included in the multivariable model, LL (per 1 mm; OR, 1.14; 95% CI: 1.00, 1.29; P = .04) and vorticitydis (per 100 sec-1; OR, 2.47; 95% CI: 1.45, 4.21; P < .001) remained significant predictors.
Diagnostic Performance in Predicting Functional Plaque Progression
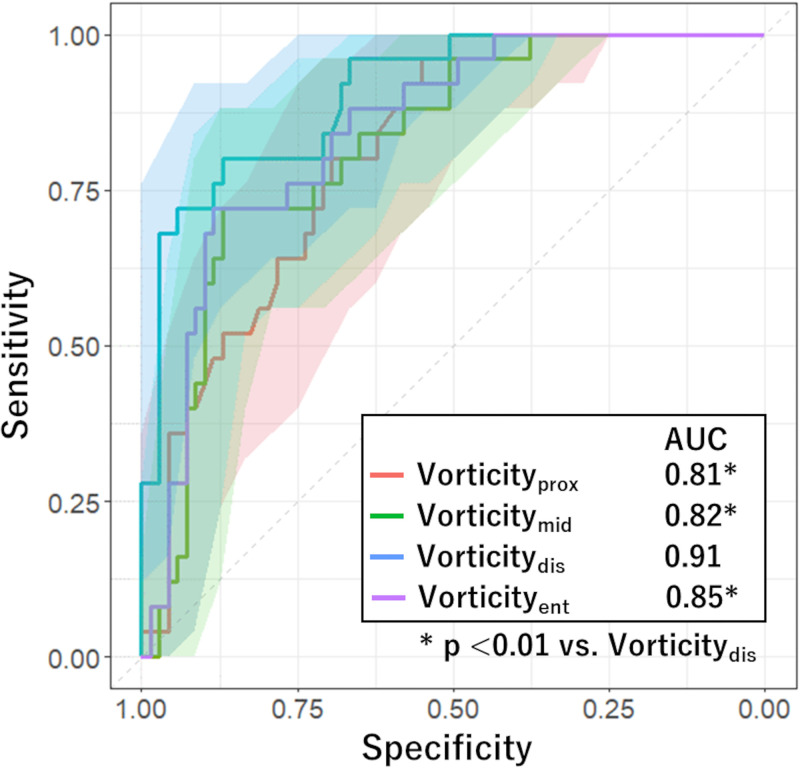
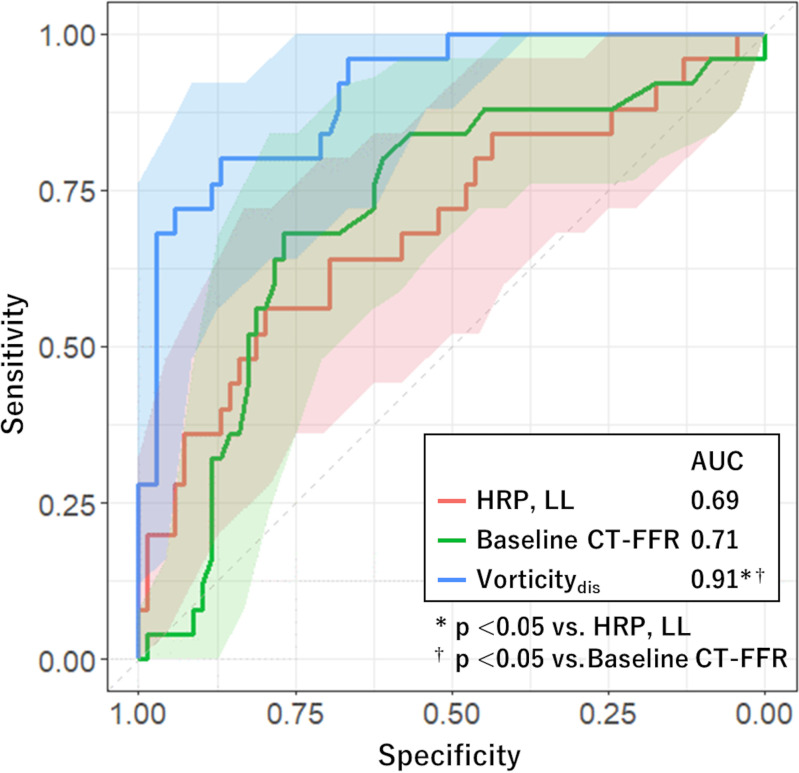
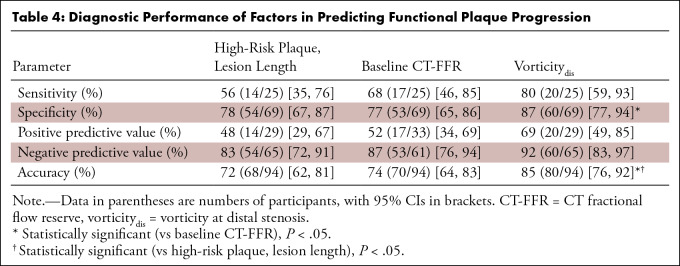
Receiver operating characteristic analysis for evaluating performance of each factor in predicting functional plaque progression showed that the model including vorticitydis had a higher AUC (0.91; 95% CI: 0.84, 0.97) than models including vorticity of the remaining segments (P < .01) (Fig 4). We found no evidence of a difference in AUC of HRP combined with LL (0.69; 95% CI: 0.56, 0.82) and that of baseline CT-FFR (0.71; 95% CI: 0.59, 0.83; P = .82). The AUC of vorticitydis was higher than these values (0.91; 95% CI: 0.84, 0.97; P < .01) (Fig 5). The cutoff values for baseline CT-FFR and vorticitydis were 0.87 and 716 sec-1, respectively.
Figure 4:
Graph shows comparison of receiver operating characteristic curves estimating performance of risk factors in predicting functional plaque progression. The area under the receiver operating characteristic (AUC) curve of the model including vorticity of distal stenosis (vorticitydis) was significantly higher than those in the remaining models (P < .01). Shaded areas represent 95% CI band. Vorticityent = vorticity of entire stenosis, Vorticitymid = vorticity of middle stenosis, Vorticityprox = vorticity of proximal stenosis.
Figure 5:
Graph shows comparison of receiver operating characteristic curves estimating performance of risk factors in predicting functional plaque progression. The area under the receiver operating characteristic (AUC) curves of models including high-risk plaque (HRP) and lesion length (LL), and baseline CT fractional flow reserve (CT-FFR), were not statistically significantly different, but these measurements were significantly higher in the model using vorticity of distal stenosis (vorticitydis). Shaded areas represent 95% CI band.
We found no evidence of a difference in sensitivity in predicting functional progression between models using HRP and LL (56%; 14 of 25 vessels; 95% CI: 35, 76), baseline CT-FFR (68%; 17 of 25 vessels; 95% CI: 46, 85), and vorticitydis (80%; 20 of 25 vessels; 95% CI: 59, 93) (Table 4). The specificity of vorticitydis (87%; 60 of 69 vessels; 95% CI: 77, 94) was higher than that of baseline CT-FFR (77%; 53 of 69 vessels; 95% CI: 65, 86; P = .03). The diagnostic accuracy of vorticitydis (85%; 80 of 94 vessels; 95% CI: 76, 92) was higher than that of HRP and LL (72%; 68 of 94 vessels; 95% CI: 62, 81; P = .04) and baseline CT-FFR (74%; 70 of 94 vessels; 95% CI: 64, 83; P = .02).
Table 4:
Diagnostic Performance of Factors in Predicting Functional Plaque Progression
Reproducibility of Values
Interobserver agreement on low attenuation, positive remodeling, spotty calcification, and napkin-ring sign were fair (κ = 0.30), good (κ = 0.63), very good (κ = 0.81), and moderate (κ = 0.52), respectively.
Interobserver ICC for CT-FFR was 1.0 (95% CI: 0.99, 1.0), indicating good agreement. We found no evidence of differences in CT-FFR (mean difference, -0.002; 95% CI: -0.005, 0.005; P = .92) values between observers.
Interobserver ICC for vorticityent ranged from 0.96 (95% CI: 0.92, 0.98) to 0.99 (95% CI: 0.99, 1.0) between the three observers, indicating good agreement (Table S2). The mean difference in vorticityent ranged from -7.0 (95% CI: -18.1, 4.1; P = .21) to 25.9 (95% CI: -4.7, 56.4; P = .09) between the observers. Intraobserver ICC and mean difference for vorticityent were 0.98 (95% CI: 0.96, 0.99) and -17.7 (95% CI: -36.3, 0.9; P = .06), respectively (Table S3). Vorticity values for proximal, middle, and distal stenosis were in good agreement within and among observers (Tables S2, S3).
Discussion
The present study showed that vorticitydis (per 100 sec-1; OR: 1.86; 95% CI: 1.44, 2.41; P < .001) and LL (per 1 mm; OR: 1.12; 95% CI: 1.03, 1.22; P = .007) were associated with functional plaque progression in participants with type 2 diabetes mellitus, with a weaker association for baseline CT-FFR, DS, and HRP. The predictive value of vorticitydis for functional progression (AUC, 0.91; 95% CI: 0.84, 0.97) was higher than that of HRP and LL (AUC, 0.69; 95% CI: 0.56, 0.82; P < .01). Although established risk scores such as the Framingham score are related to plaque progression (14), functional parameters did not show evidence of difference in different risk groups partly because the patient cohort was homogeneous in that all individuals had type 2 diabetes mellitus requiring educational hospitalization. Previous studies have shown a relationship between wall shear stress and morphologic plaque progression (4,10), but to our knowledge, this is the first study to investigate functional progression using vorticity.
The relationship of hemodynamic factors and thrombus formation has been investigated in various studies (15). In the promotion of initial thrombi, disturbance of coronary flow that facilitates the transport of platelets toward the wall is required in addition to the activation of von Willebrand factor (16). Furthermore, variations of local velocity within the coronary artery promote atherogenesis (17). These findings were confirmed in a study using a porcine model that showed that vorticity increased distal to the throat of the stenosis and increased risk of thrombosis (9). In another study, CFD analysis was performed on 30 left anterior descending artery models obtained from intravascular US and demonstrated that cavitation in the coronary artery from increased vorticity distal to the coronary stenosis may promote plaque rupture due to constant small injuries (18). Our study further confirmed that vorticity at the distal third of a stenosis promotes stenosis progression and that the predictive power at the distal third was stronger than the remaining segments.
The role of wall shear stress on the progression of coronary atherosclerosis has been reported in various studies (19). In vivo studies using intravascular US (20,21) showed that low wall shear stress is linked to increased expression of matrix metalloproteinases and changes in vascular smooth muscle cell migration, which promote atherosclerosis (22,23). Conversely, high wall shear stress also induces platelet dysfunction that exacerbates the local thrombotic propensity (24). A study including patients with stable coronary artery disease showed that high wall shear stress was predictive of future myocardial infarction (2). One reason for these conflicting results might be that the extent of flow disturbance is not included in wall shear stress. Vorticity contains both the fluid shear and the tendency of flow to rotate, and it might represent a more profound stimulus to endothelial cells (25). Our study showed that a vorticity value larger than 716 sec-1 was related to plaque progression, and the single cutoff, unlike wall shear stress, is more practical.
Certain features of HRP depicted with CT are associated with increased future cardiovascular events (12). A study using near-infrared spectroscopy showed that lipid-rich plaques are more frequently exposed to high wall shear stress (26). Our study showed that when HRP and vorticity were included in multivariable analysis, HRP was not a significant factor in predicting functional plaque progression. One reason for this might be that although HRPs are predictive of future cardiovascular events, the event rate itself is low (27). This was compatible with the results in this study, as the positive predictive value of HRPs was low in predicting plaque progression. Moreover, interobserver agreement of some HRP features were fair to moderate, but the ICCs of vorticity were very high in our study. Therefore, vorticity analysis might be more reproducible than HRP evaluation. In addition, CT-FFR was not a significant factor to predict functional progression. Flow turbulence could occur depending on plaque geometry even with a small decrease in FFR, and vorticity is a better indicator of the magnitude of flow turbulence than CT-FFR (2). This might have resulted in lower diagnostic performance of CT-FFR than vorticity.
This study had the following limitations. First, more than 40% of participants (89 of 199) who underwent the first CCTA withdrew consent for a second CCTA 2 years later due to the COVID-19 pandemic, resulting in potential selection bias. Second, we did not include quantitative plaque measurements in this study. Including these measurements might improve the accuracy in predicting plaque progression and clinical outcomes (28,29). Third, this study focused on participants with type 2 diabetes mellitus with mild stenosis and could not be generalized to those without. Fourth, if multiple plaques were present, we only investigated the first plaque because CFD parameters of distal plaques might be affected by the initial plaque. Fifth, CT-FFR values in this study are simulated, and invasive FFR was not measured. The simulation method was validated against invasive FFR in previous studies (3,13). Sixth, the cutoff for functional progression was set at a CT-FFR decrease of 0.05, which may have missed plaques with functional progression. Also, this cutoff does not consider changes in symptoms. Seventh, influence of medical treatment was difficult to analyze in this cohort because medication was determined by the attending physicians. Finally, diagnostic performance was assessed without external testing or cross-validation, and overestimation of AUC values may be possible. However, the relative differences between models may still be valid.
In conclusion, vorticity of the distal segment of a plaque was associated with functional progression at 2 years in individuals with type 2 diabetes mellitus. Multicenter studies with a larger cohort using other CT machines and reconstruction methods would further confirm the results of this study.
Supported in part by the Japan Society for the Promotion of Science KAKENHI grant no. 21K07573.
Disclosures of conflicts of interest: N.T. No relevant relationships. S.F. No relevant relationships. T. Mita No relevant relationships. D.T. No relevant relationships. Y.N. No relevant relationships. R.F. No relevant relationships. A.K. No relevant relationships. Y.K. No relevant relationships. K.T. No relevant relationships. M.H. No relevant relationships. M.K. No relevant relationships. K.K.K. No relevant relationships. H.W. Grants from Takeda Pharmaceuticals, Nippon Boehringer Ingelheim, Kissei Pharmaceutical, Novo Nordisk, Mitsubishi Tanabe Pharma, LifeScan Japan, Kyowa Kirin, Sumitomo Pharma, Eli Lilly, Taisho Pharmaceutical, Abbott, Ono Pharmaceutical, Soiken, Sanwa Kagaku, and Kowa; payment from Bayer Pharma Japan, Teijin Pharma, Sanofi-Aventis, Novo Nordisk, Nippon Boehringer Ingelheim, Eli Lilly, Sumitomo Pharma, Mitsubishi Tanabe Pharma, Daiichi Sankyo Company, Abbott, Kowa, Taisho Pharmaceutical, Astellas Pharma, Kissei Pharmaceutical, AstraZeneca, Ono Pharmaceutical, Sanwa Kagaku, Takeda Pharmaceuticals. T. Minamino No relevant relationships. S.A. No relevant relationships.
Abbreviations:
- AUC
- area under the receiver operating characteristic curve
- CCTA
- coronary CT angiography
- CFD
- computational fluid dynamics
- CT-FFR
- CT fractional flow reserve
- DS
- diameter stenosis
- HRP
- high-risk plaque
- ICC
- intraclass correlation coefficient
- LL
- lesion length
- OR
- odds ratio
- vorticitydis
- vorticity of distal stenosis
- vorticityent
- vorticity of entire stenosis
- vorticitymid
- vorticity of middle stenosis
- vorticityprox
- vorticity of proximal stenosis.
References
- 1. Weir-McCall JR , Fairbairn TA . Fractional Flow Reserve Derived from CT: The State of Play in 2020 . Radiol Cardiothorac Imaging 2020. ; 2 ( 1 ): e190153 . [DOI] [PMC free article] [PubMed] [Google Scholar]
- 2. Kumar A , Thompson EW , Lefieux A , et al . High Coronary Shear Stress in Patients With Coronary Artery Disease Predicts Myocardial Infarction . J Am Coll Cardiol 2018. ; 72 ( 16 ): 1926 – 1935 . [DOI] [PubMed] [Google Scholar]
- 3. Tomizawa N , Nozaki Y , Fujimoto S , et al . Coronary flow disturbance assessed by vorticity as a cause of functionally significant stenosis . Eur Radiol 2022. ; 32 ( 10 ): 6859 – 6867 . [DOI] [PubMed] [Google Scholar]
- 4. Stone PH , Maehara A , Coskun AU , et al . Role of Low Endothelial Shear Stress and Plaque Characteristics in the Prediction of Nonculprit Major Adverse Cardiac Events: The PROSPECT Study . JACC Cardiovasc Imaging 2018. ; 11 ( 3 ): 462 – 471 . [DOI] [PubMed] [Google Scholar]
- 5. Engelhard S , van Helvert M , Voorneveld J , et al . US Velocimetry in Participants with Aortoiliac Occlusive Disease . Radiology 2021. ; 301 ( 2 ): 332 – 338 . [DOI] [PubMed] [Google Scholar]
- 6. Tomizawa N , Nojo T , Inoh S , Nakamura S . Difference of coronary artery disease severity, extent and plaque characteristics between patients with hypertension, diabetes mellitus or dyslipidemia . Int J Cardiovasc Imaging 2015. ; 31 ( 1 ): 205 – 212 . [DOI] [PubMed] [Google Scholar]
- 7. Tomizawa N , Inoh S , Nojo T , Nakamura S . The association of hemoglobin A1c and high risk plaque and plaque extent assessed by coronary computed tomography angiography . Int J Cardiovasc Imaging 2016. ; 32 ( 3 ): 493 – 500 . [DOI] [PubMed] [Google Scholar]
- 8. Chang HJ , Lin FY , Lee SE , et al . Coronary Atherosclerotic Precursors of Acute Coronary Syndromes . J Am Coll Cardiol 2018. ; 71 ( 22 ): 2511 – 2522 . [DOI] [PMC free article] [PubMed] [Google Scholar]
- 9. Owen DG , de Oliveira DC , Neale EK , Shepherd DET , Espino DM . Numerical modelling of blood rheology and platelet activation through a stenosed left coronary artery bifurcation . PloS One 2021. ; 16 ( 11 ): e0259196 . [DOI] [PMC free article] [PubMed] [Google Scholar]
- 10. Costopoulos C , Timmins LH , Huang Y , et al . Impact of combined plaque structural stress and wall shear stress on coronary plaque progression, regression, and changes in composition . Eur Heart J 2019. ; 40 ( 18 ): 1411 – 1422 . [DOI] [PMC free article] [PubMed] [Google Scholar]
- 11. D'Agostino RB Sr , Vasan RS , Pencina MJ , et al . General cardiovascular risk profile for use in primary care: the Framingham Heart Study . Circulation 2008. ; 117 ( 6 ): 743 – 753 . [DOI] [PubMed] [Google Scholar]
- 12. Williams MC , Earls JP , Hecht H . Quantitative assessment of atherosclerotic plaque, recent progress and current limitations . J Cardiovasc Comput Tomogr 2022. ; 16 ( 2 ): 124 – 137 . [DOI] [PubMed] [Google Scholar]
- 13. Tomizawa N , Nozaki Y , Fujimoto S , et al . A phantom and in vivo simulation of coronary flow to calculate fractional flow reserve using a mesh-free model . Int J Cardiovasc Imaging 2021. ; 38 ( 4 ): 895 – 903 . [DOI] [PubMed] [Google Scholar]
- 14. von Birgelen C , Hartmann M , Mintz GS , et al . Relationship between cardiovascular risk as predicted by established risk scores versus plaque progression as measured by serial intravascular ultrasound in left main coronary arteries . Circulation 2004. ; 110 ( 12 ): 1579 – 1585 . [DOI] [PubMed] [Google Scholar]
- 15. Katritsis DG , Theodorakakos A , Pantos I , et al . Vortex formation and recirculation zones in left anterior descending artery stenoses: computational fluid dynamics analysis . Phys Med Biol 2010. ; 55 ( 5 ): 1395 – 1411 . [DOI] [PubMed] [Google Scholar]
- 16. Miyazaki H , Yamaguchi T . Formation and destruction of primary thrombi under the influence of blood flow and von Willebrand factor analyzed by a discrete element method . Biorheology 2003. ; 40 ( 1-3 ): 265 – 272 . [PubMed] [Google Scholar]
- 17. Feldman CL , Ilegbusi OJ , Hu Z , Nesto R , Waxman S , Stone PH . Determination of in vivo velocity and endothelial shear stress patterns with phasic flow in human coronary arteries: a methodology to predict progression of coronary atherosclerosis . Am Heart J 2002. ; 143 ( 6 ): 931 – 939 . [DOI] [PubMed] [Google Scholar]
- 18. Rigatelli G , Zuin M , Ngo TT , et al . Intracoronary cavitation as a cause of plaque rupture and thrombosis propagation in patients with acute myocardial infarction: A computational study . J Transl Int Med 2019. ; 7 ( 2 ): 69 – 75 . [DOI] [PMC free article] [PubMed] [Google Scholar]
- 19. Samady H , Molony DS , Coskun AU , Varshney AS , De Bruyne B , Stone PH . Risk stratification of coronary plaques using physiologic characteristics by CCTA: Focus on shear stress . J Cardiovasc Comput Tomogr 2020. ; 14 ( 5 ): 386 – 393 . [DOI] [PMC free article] [PubMed] [Google Scholar]
- 20. Stone PH , Saito S , Takahashi S , et al . Prediction of progression of coronary artery disease and clinical outcomes using vascular profiling of endothelial shear stress and arterial plaque characteristics: the PREDICTION Study . Circulation 2012. ; 126 ( 2 ): 172 – 181 . [DOI] [PubMed] [Google Scholar]
- 21. Timmins LH , Molony DS , Eshtehardi P , et al . Oscillatory wall shear stress is a dominant flow characteristic affecting lesion progression patterns and plaque vulnerability in patients with coronary artery disease . J R Soc Interface 2017. ; 14 ( 127 ): 20160972 . [DOI] [PMC free article] [PubMed] [Google Scholar]
- 22. Deguchi JO , Aikawa E , Libby P , et al . Matrix metalloproteinase-13/collagenase-3 deletion promotes collagen accumulation and organization in mouse atherosclerotic plaques . Circulation 2005. ; 112 ( 17 ): 2708 – 2715 . [DOI] [PubMed] [Google Scholar]
- 23. Bentzon JF , Weile C , Sondergaard CS , Hindkjaer J , Kassem M , Falk E . Smooth muscle cells in atherosclerosis originate from the local vessel wall and not circulating progenitor cells in ApoE knockout mice . Arterioscler Thromb Vasc Biol 2006. ; 26 ( 12 ): 2696 – 2702 . [DOI] [PubMed] [Google Scholar]
- 24. Chen Z , Mondal NK , Zheng S , et al . High shear induces platelet dysfunction leading to enhanced thrombotic propensity and diminished hemostatic capacity . Platelets 2019. ; 30 ( 1 ): 112 – 119 . [DOI] [PMC free article] [PubMed] [Google Scholar]
- 25. Chu M , von Birgelen C , Li Y , et al . Quantification of disturbed coronary flow by disturbed vorticity index and relation with fractional flow reserve . Atherosclerosis 2018. ; 273 : 136 – 144 . [DOI] [PubMed] [Google Scholar]
- 26. Hartman EMJ , de Nisco G , Kok AM , et al . Lipid-rich Plaques Detected by Near-infrared Spectroscopy Are More Frequently Exposed to High Shear Stress . J Cardiovasc Transl Res 2021. ; 14 ( 3 ): 416 – 425 . [DOI] [PMC free article] [PubMed] [Google Scholar]
- 27. Feuchtner G , Kerber J , Burghard P , et al . The high-risk criteria low-attenuation plaque <60 HU and the napkin-ring sign are the most powerful predictors of MACE: a long-term follow-up study . Eur Heart J Cardiovasc Imaging 2017. ; 18 ( 7 ): 772 – 779 . [DOI] [PubMed] [Google Scholar]
- 28. Lee SE , Sung JM , Andreini D , et al . Per-lesion versus per-patient analysis of coronary artery disease in predicting the development of obstructive lesions: the Progression of AtheRosclerotic PlAque DetermIned by Computed TmoGraphic Angiography Imaging (PARADIGM) study . Int J Cardiovasc Imaging 2020. ; 36 ( 12 ): 2357 – 2364 . [DOI] [PubMed] [Google Scholar]
- 29. Dey D , Achenbach S , Schuhbaeck A , et al . Comparison of quantitative atherosclerotic plaque burden from coronary CT angiography in patients with first acute coronary syndrome and stable coronary artery disease . J Cardiovasc Comput Tomogr 2014. ; 8 ( 5 ): 368 – 374 . [DOI] [PubMed] [Google Scholar]


