

Abstract
Background
Obsessive-compulsive disorder (OCD) and schizophrenia have distinct but also overlapping symptoms. Few studies have examined the shared and disorder-specific disturbances in dynamic brain function in the 2 disorders.
Study Design
Resting-state functional magnetic resonance imaging data of 31 patients with OCD and 49 patients with schizophrenia, all untreated, and 45 healthy controls (HCs) were analyzed using spatial group independent component (IC) analysis. Time-varying degree centrality patterns across the whole brain were clustered into 3 reoccurring states, and state transition metrics were obtained. We further explored regional temporal variability of degree centrality for each IC across all time windows.
Study Results
Patients with OCD and patients with schizophrenia both showed decreased occurrence of a state having the highest centrality in the sensorimotor and auditory networks. Additionally, patients with OCD and patients with schizophrenia both exhibited reduced dynamics of degree centrality in the superior frontal gyrus than controls, while dynamic degree centrality of the cerebellum was lower in patients with schizophrenia than with OCD and HCs. Altered dynamics of degree centrality nominally correlated with symptom severity in both patient groups.
Conclusions
Our study provides evidence of transdiagnostic and clinically relevant functional brain abnormalities across OCD and schizophrenia in neocortex, as well as functional dynamic alterations in the cerebellum specific to schizophrenia. These findings add to the recognition of overlap in neocortical alterations in the 2 disorders, and indicate that cerebellar alterations in schizophrenia may be specifically important in schizophrenia pathophysiology via impact on cerebellar thalamocortical circuitry.
Keywords: obsessive-compulsive disorder, schizophrenia, resting-state functional magnetic resonance imaging, brain, temporal dynamics, degree centrality
Introduction
Obsessive-compulsive disorder (OCD) and schizophrenia have distinct clinical symptoms, but also have overlapping symptom features and cognitive impairments. These disorders also have overlaps in cognitive functions,1 neurobiology, and gene associations,2 often have a chronic course and have similar age distribution of onset.3 Perhaps most importantly, both disorders have the relatively distinct feature of rigidly holding onto beliefs despite low credibility and maladaptive consequences. Despite their established overlapping features, the overlapping and distinctive alterations in brain function associated with the disorder remain poorly delineated.
Previous neuroimaging studies have found that schizophrenia and OCD have overlapping as well as distinct associated alterations in brain structure and function. Of interest given the reduced flexibility of thinking associated with the disorders, both have been shown to have decreased gray matter volume in dorsal anterior cingulate cortex (ACC).4 At the network level, one study reported that patients with schizo-obsessive comorbidity (SOC), schizophrenia, and OCD all exhibited increased static functional connectivity (sFC) between subregions of the default mode network (DMN) and executive control networks (ECN) relative to healthy controls (HCs).5 Patients with OCD and schizophrenia share a failure in internal source monitoring that may contribute to the phenomenological overlap between delusions/hallucinations and intrusive obsessional thoughts.6 At the neurobiological level, reduced sFC and structural connectivity involving auditory network (AUD) and sensorimotor network (SMN)7–9 might contribute to these alterations as they provide important inputs for self-monitoring and the discrimination of self and other-initiated events.10,11 Disorder-specific brain imaging alterations have also been identified. Qin et al. explored white matter network topological characteristics and found that patients with schizophrenia exhibited reduced nodal strength and efficiency in the striatum and visual/auditory cortices relative to OCD.12 Yu et al. reported dissimilarities of spontaneous brain activity in multiple regions (indicated by amplitude of low-frequency fluctuation, regional homogeneity [ReHo], and static degree centrality) between schizophrenia and OCD.13 Sustained attention deficit in schizophrenia has been correlated with reduced sFC between left medial prefrontal cortex (mPFC) and bilateral ACC, while in OCD it was related to decreased sFC between right mPFC and left superior frontal gyrus (SFG).14 Additionally, increased sFC between DMN and middle temporal gyrus has been reported in patients with SOC and schizophrenia, while decreased sFC between these regions was reported in patients with OCD.5 More severe brain structural15,16 and functional abnormalities5 as well as clinical symptom severity17 have been reported in patients with SOC than schizophrenia or OCD alone, suggesting potential additive factors of comorbidity on brain features.
Connectome models have driven home the point that brain regions are highly interactive, and that the brain nodes function together as components of differentiated networks.18,19 The role of brain regions in the broader brain connectome has been evaluated using graph-theory-based analysis. Using this approach, disrupted sFC topology has been shown in both schizophrenia and OCD, and related to clinical symptoms of the 2 disorders.20,21 Degree centrality is a graph-theory-based metric that reflects the relative “importance” of nodes in brain networks. A brain region with a high degree of centrality has more robust sFC than other regions. Aberrant static degree centrality has been documented in schizophrenia22 and correlated with the reduction in Positive and Negative Syndrome Scale (PANSS) scores after antipsychotic treatment.23 Degree centrality alterations have also been found in OCD, with the presence of such alterations allowing differentiation from HCs with an accuracy of 88%.24 These points highlight the novelty and importance of graph/connectome modeling approach and its potential to advance understanding of brain alterations in psychiatric disorders, and the need for studies of untreated patients to limit the diverse effects of psychotropic medications in studies aiming to understand illness-related alterations in brain function.25,26
In recent years, neuroimaging researchers have focused more on dynamic than static (or average) connectivity, based on the recognition that the brain network is a dynamic, time-varying system.27–30 Most previous FC studies comparing schizophrenia and OCD evaluated static connectivity, which evaluated average connectivity rather than its dynamic organization over time. But studies of dynamic connectivity in individual disorders have been informative. Patients with schizophrenia have been shown to spend more time in states with weak connections between networks,31,32 and the reduced transitions between functional brain states were associated with clinical symptom severity.33 Patients with OCD have been reported to spend more time in a state characterized by strong within-network connections and less time in an integrated state characterized by the predominance of between-network connections.34 Wang et al. reported that dynamic degree centrality can help differentiate responders and nonresponders to antipsychotic treatment in schizophrenia.35 And, Linda et al. found higher dynamic coherence of dorsolateral prefrontal cortex (DLPFC) with other brain regions before treatment was related to greater distress reduction after repetitive transcranial magnetic stimulation treatment in patients with OCD.36
Given these considerations and the lack of previous studies comparing dynamic FC (dFC) alterations of patients with schizophrenia and OCD directly, the present study used graph modeling and dFC analysis to identify transdiagnostic and disorder-specific alterations of the functional brain connectome in OCD and schizophrenia using resting-state functional magnetic resonance imaging (rfMRI). We studied untreated patients with either disorder, and patients without psychiatric comorbidities, to clarify their similarities and differences without potential confounding from these features. We focused on 2 aspects of brain dynamics: The time-varying degree centrality patterns of the whole brain and temporal variability of degree centrality for each brain region. Based on previous findings with studies of one of the target disorders,37,38 we hypothesized that subcortical alterations would be more specific to schizophrenia, and that neocortical alterations of ACC, DMN, AUD, and SMN would be observed in both schizophrenia and OCD.
Methods
Participants
This study was approved by the research ethics committee of West China Hospital of Sichuan University, and informed written consent was obtained from all participants. Diagnoses of OCD and schizophrenia were determined by experienced clinical psychiatrists using Structured Clinical Interview for DSM-IV (Patient Edition). Patients with OCD and schizophrenia had no psychiatric comorbidities. Only participants who completed MRI scanning, met criteria of minimal head motion, and whose brain MRI passed image quality control procedures were included. In OCD, 17 patients were drug-naïve and 14 patients had previously received psychiatric medications but had been medication free for at least 2 weeks. All 49 patients with schizophrenia were treatment-naïve and 45 HCs were recruited. The 3 groups did not differ significantly in age (P = .386), sex (P = .843), or years of education (P = .140) (table 1). Additional information is presented in supplementary material.
Table 1.
The Demographic and Clinical Information of All Participants
| OCD (n = 31) | SZ (n = 49) | HC (n = 45) | F/χ2/t value | P value | |
|---|---|---|---|---|---|
| Gender (number) | 19M, 12F | 27M, 22F | 25M, 20F | 0.341a | .843 |
| Age (years) | 27.1(9.4) | 24.6(8.0) | 26.6(9.3) | 0.960b | .386 |
| Education(years) | 13.7(2.8) | 12.3(2.9) | 12.5(3.5) | 1.995b | .140 |
| Duration (years) | 6.0(5.4) | 1.6(1.9) | — | 27.819 | <.001* |
| YBOCS | 22.9(5.2) | — | — | — | — |
| HAMA | 7.9(3.1) | — | — | — | — |
| HAMD | 9.8(2.7) | — | — | — | — |
| PANSS total | — | 88.3(18.3) | — | — | — |
| PANSS positive | — | 23.4 (7.2) | — | — | — |
| PANSS negative | — | 19.2 (8.3) | — | — | — |
| PANSS general | — | 45.7 (10.1) | — | — | — |
achi-square test. bANOVA, c2-sample t-test; values are given as mean (SD).
Abbreviations: OCD, obsessive-compulsive disorder; SZ, schizophrenia; HC, healthy controls; YBOCS, Yale-Brown Obsessive-Compulsive Scale; HAMA, Hamilton Anxiety Rating Scale; HAMD, Hamilton Depression Rating Scale; PANSS, Positive and Negative Syndrome Scale.
MR Data Acquisition and Preprocessing
High-resolution 3-dimensional structural MRI and rfMRI data were collected using a 3.0T MRI system (EXCITE, GE) with an 8-channel phased array head coil. Parameters of MRI scanning sequences and data preprocessing are detailed in supplementary material. To reduce the influence of head motion, participants with a maximum displacement of more than 2mm, maximum rotation greater than 2°, and a mean framewise displacement larger than 0.2mm were excluded. The mean framewise displacement did not significantly differ among the 3 groups (F = 0.581, P = .561).
Independent Component Analysis
After MR data preprocessing, we performed spatial group independent component analysis (GICA) using the GIFT toolbox (mialab.mrn.org/software/gift/) to identify intrinsic connectivity networks (details in supplementary material). Reliability and stability of the Informax GICA algorithm in ICASSO39 were ensured by repeating the algorithm 20 times, and the most central run was used to reconstruct subject-specific time courses and spatial maps of each independent component (IC) with the GICA back reconstruction algorithm.40 The group independent components (ICs) of the 20 runs were clustered, and then the quality index (Iq) of IC was calculated (supplementary table S1). ICs with Iq > 0.7 were selected as prior work suggested.41 We selected 55 ICs and sorted them into 8 functional networks (figure 1): AUD, basal ganglia, DMN, ECN, language network, SMN, salience attention network (SAN), and visual network. The coefficient of determination (R2) between the ICs and the Stanford functional template as a criterion for assigning ICs to 1 of the 8 functional networks in this study, using the highest R2 of nodes with the 8 networks to assign nodes to networks. The peak coordinates and R2 values of all selected ICs are provided in supplementary table S1. Fifty-five ICs were defined as functionally independent nodes, with the sFC between pairs of ICs (Pearson’s correlation coefficient) as edges used for the calculation of degree centrality.
Fig. 1.
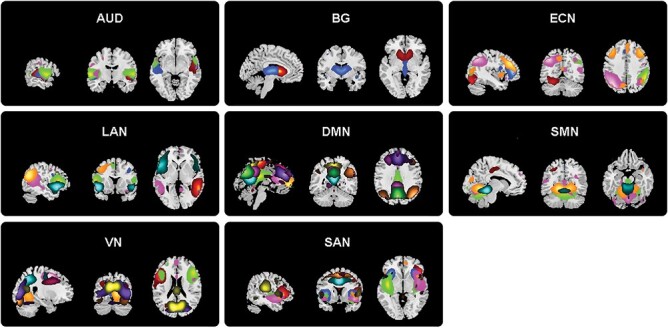
The 55 independent components (ICs) derived from all subjects in the present study were divided into 8 functional networks: Auditory network (AUD), default mode network (DMN), executive control network (ECN), language network (LAN), salience network (SAN), subcortical network (SC), sensorimotor network (SMN), and visual network.
Degree Centrality of Each Component for All-time Windows
The sliding-window approach was used to measure time-varying changes in degree centrality for the 55 identified ICs. We chose a 22TR window (44s) because it has been suggested that time windows of 30 to 60 seconds can successfully capture patterns of resting-state fluctuations of FC.42 To explore the dynamics of degree centrality for each IC, we measured the fluctuation of degree centrality across all sliding windows using GRETNA software (www.nitrc.org/projects/gretna). Instead of using a single sparsity threshold, we applied a wide range of sparsity levels, and computed the area under the curve of estimated degree centrality across all sparsity thresholds. The selected thresholds ranged from 0.07 to 0.32 (with an interval of 0.01) and were used for the calculation of area under the curve of degree centrality of the ICs for each time window. For every sparsity threshold, the degree centrality for each IC was measured by the number of edges connected to this IC in the binarized FC matrices. Methodological details are included as supplementary material.
Dynamics of Degree Centrality
Measuring the time-varying degree centrality patterns evaluates how the whole-brain degree centrality pattern changes over time, and measuring temporal variability of degree centrality for each IC makes it possible to understand each brain region’s dynamic fluctuation of nodal centrality.
To assess time-varying degree centrality patterns, k-means clustering was performed on the degree centrality pattern across all time windows for all participants. The k value was varied from 2 to 10 to identify the optimal number of brain states. To reduce the potential bias of the initial random selection of cluster centroids, the k-means clustering algorithm was iterated 100 times for each k value. The elbow method was used to evaluate the number of meaningful clusters of FC patterns that comprise brain states. This approach calculates the sum of squared errors against each cluster number k (here, k = 2–10), and then plots the curve of sum of squared errors against each corresponding cluster number to identify the elbow point of the curve, which basically represents the point where additional clusters are less robust.43 Using the “elbow criteria,” the optimal k value was determined to be 3 in the present study (supplementary figure S2). We used the cluster centroids of all participants to represent the 3 reoccurring degree centrality states during the resting-state study (see results and supplementaryfigure 2A). To characterize each degree centrality state, we calculated the mean degree centrality for each network of the 3 cluster centroids (figure 2B). Then we assessed 3 different state transition metrics to quantify the temporal properties of the degree centrality states: (1) fractional time, which represents the proportion of time window belonging to each state, (2) mean dwell time, which measures the average length of time spent in each state before switching into other states, and (3) number of transitions, which counts the total number of switches between different states over time. To quantify temporal variability of degree centrality for each IC, the coefficient of variation of regional degree centrality across all time windows was calculated. Higher coefficient of variation represents higher fluctuation of brain region centrality. To evaluate the consistency and validity of the dynamic degree centrality analysis at different window sizes relative to the 22TR window used, we also examined the data using a 30TR window size repeating the above analyses. Findings using 22TR window are well replicated in this validation analysis (details in supplementary material).
Fig. 2.
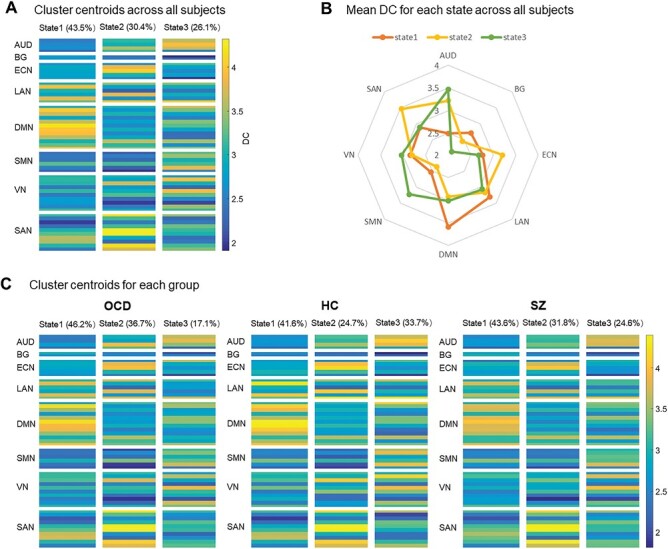
Cluster centroids of time-varying degree centrality patterns in all subjects (A). The radar map of mean degree centrality of each network for 3 states (B). Cluster centroids of time-varying degree centrality patterns in obsessive-compulsive disorder (OCD), schizophrenia (SZ), and healthy controls (HC), respectively (C). Abbreviations of brain networks see figure 1.
Statistical Analysis
Due to the non-normal distribution of dynamic degree centrality measures, the independent samples Kruskal–Wallis one-way ANOVA and post hoc pair-wise tests were used to assess group differences of all metrics. Significance was set at P < .05 for these statistical analyses, with the false discovery rate correction used to correct for multiple comparisons of degree centrality state transition measures. To test for the significance of group differences in the larger number of nodal degree centrality dynamic properties, the false positive adjustment approach was used to control the false-positive rate to 1 per analysis44 and Bonferroni correction was used for post hoc tests. There were no differences in both dynamic degree centrality states and temporal variability of degree centrality between drug-naïve patients and drug-washout patients with OCD. Thus, we pooled the 2 subgroups for analysis. To explore the relationships between altered dynamic degree centrality measures and clinical symptom severity within each patient group, we performed Spearman partial correlation analyses, with age, sex, and education years as covariates. We set P < .05 (nominal significance) for these exploratory correlational analyses given a large number of correlations examined, and describe them as suggestive effects rather than significant effects.
Results
Group Differences in Temporal Properties of Degree Centrality States
We obtained 3 time-varying degree centrality states in an analysis of all participants based on k-means clustering: State 1 occurred most frequently (43.5%), which was characterized by the highest degree centrality in DMN; state 2 occurred less frequently (30.4%), and showed the highest degree centrality in SAN and ECN; state 3 (26.1% of the time), and showed the highest degree centrality in SMN and AUD (figure 2A–B). For OCD, HCs, and schizophrenia, the total occurrences of the 3 states were 46.2%, 41.6%, and 43.6% for state 1, 36.7%, 24.7%, and 31.8% for state 2, and 17.1%, 33.7%, and 24.6% for state 3, respectively (figure 2C). There were significant differences in the occurrences of state 3 among the 3 groups (P = .006, PFDR = .018). The occurrences of the other 2 states were not different among the 3 groups.
For state transition metrics, patients with OCD showed decreased fractional time in state 3 compared with HCs (F = 10.380, P = .006; post hoc test for OCD vs HCs: P = .001, PFDR = .021). OCD patients exhibited decreased dwell time in state 3 relatives to controls (F = 10.518, P = .005; post hoc test for OCD vs HCs: P = .001, PFDR = .021; post hoc test for schizophrenia vs HCs: P = .045, PFDR = .315, respectively), though the P value of the schizophrenia group was significant with a nominal significance threshold. We did not find significant group differences in other state transition metrics (figure 3).
Fig. 3.
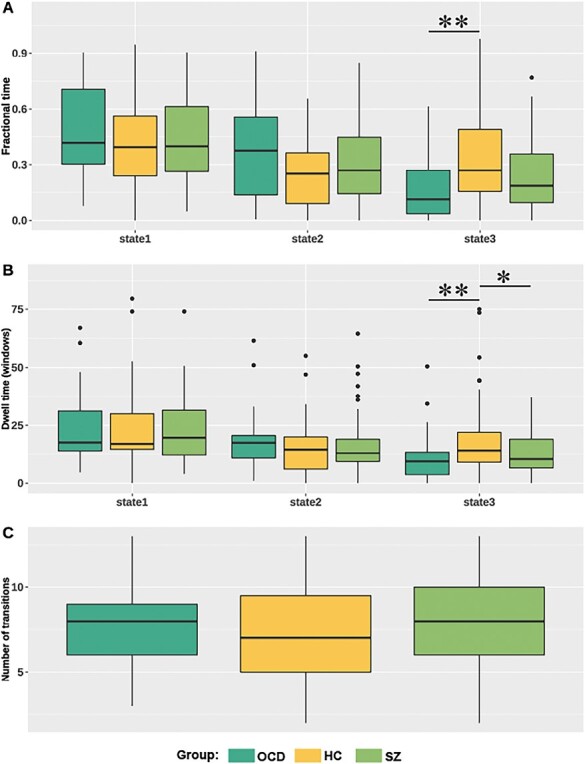
Group comparisons of state transition metrics. Patients with obsessive-compulsive disorder (OCD) showed decreased fractional time in state 3 compared with healthy controls (HC) (A). Patients with OCD and schizophrenia (SZ) both showed decreased dwell time in state 3 compared with HC (B). No significant group difference in number of transitions (C). The * represents uncorrected P < .05, and the ** represents corrected P < .05.
Group Differences in Temporal Variability of Degree Centrality
We observed significant group differences in temporal variability of degree centrality in IC38 (located in SFG of right DLPFC that belonged to SAN, F = 9.532, P = .009) and IC76 (located in the cerebellum and belonged to SMN, F = 8.083, P = .018). Post hoc analysis showed that patients with OCD (P = .003, PBonferroni = .009) and nominally in schizophrenia patients (P = .034, PBonferroni = .102) showed lower temporal variability of degree centrality in IC38 than controls. Patients with schizophrenia also showed significantly lower temporal variability in IC76 compared with HCs (P = .032, PBonferroni = .096) and patients with OCD (P = .009, PBonferroni = .027) (Figure 4A–B). There was no difference in dynamic degree centrality in IC76 between OCD and controls.
Fig. 4.
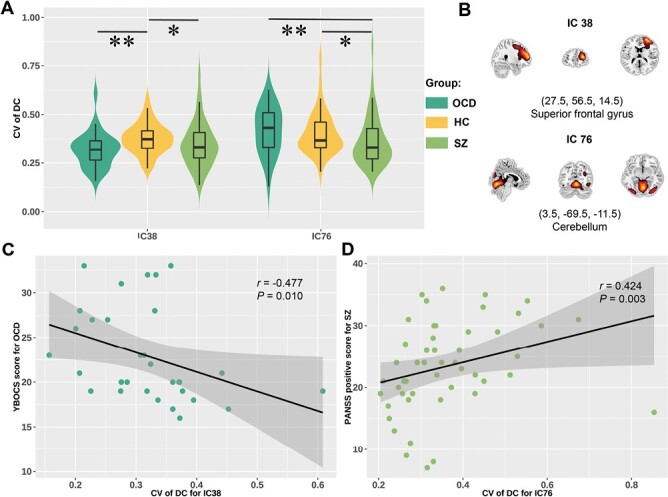
Group comparisons of temporal variability of degree centrality (A). Spatial maps of independent component (IC) 38 and IC76 (B). Significant correlations between temporal variability of degree centrality for IC38 and obsessive-compulsive score in patients with obsessive-compulsive disorder (OCD) (C). Significant correlation between temporal variability of degree centrality for IC76 and positive symptom score of Positive and Negative Syndrome Scale (PANSS) in schizophrenia (SZ) (D). The * represents uncorrected P < .05, and the ** represents corrected P < .05.
Correlation Analysis
Altered state transition metrics did not show significant correlations with clinical symptom severity, illness duration, or age of patients with OCD or schizophrenia. Temporal variability of degree centrality for IC38 showed a nominally significant negative correlation with symptom severity in OCD (r = −0.477, P = .010, figure 4C), and temporal variability of degree centrality for IC76 showed a positive nominally significant relationship with positive symptom score of PANSS in schizophrenia patients (r = 0.424, P = .003, figure 4D). Altered temporal variability of degree centrality did not correlate with illness duration, or age of patients with OCD or schizophrenia.
Discussion
In this study, patients with OCD and schizophrenia both spent less time in a state characterized by the highest degree centrality in sensory and sensorimotor systems and shared decreased temporal variability of degree centrality in the SFG than controls. Patients with schizophrenia showed significantly lower temporal variability of degree centrality in the cerebellum than HCs and patients with OCD. Nominally significant correlations with symptom severity were observed in both disorders. We did not demonstrate alterations of dynamic degree centrality in DMN or ACC, which may be ascribed to the difference in sample size, drug effect in prior studies, illness status, or analytic method. One possibility is that average FC is more reduced in these regions than the dynamic variability of FC, which would suggest a general reduction in connectivity with greater preservation of dynamic covariation of activity across brain nodes in the identified brain states.
Temporal Properties of Degree Centrality States Indicating Shared Alterations
Using k-means clustering, we identified 3 reoccurring degree centrality states. Compared with HCs, both patients with OCD and schizophrenia spent less time in state 3, characterized by the highest degree of centrality in SMN and AUD. Sensorimotor and auditory processing deficits are established in both disorders.45–49 Thus, alterations in these networks, both from past neurophysiological studies and our current dFC findings, suggest shared pathophysiological alterations in the 2 disorders.
In our study, decreased dwell time in the state characterized by the highest centrality of brain regions of SMN and AUD was a common abnormality for the 2 disorders. Patients with schizophrenia have shown decreased sFC between sensory networks and decreased dwell time in the state characterized by strong connections between these networks.31 Patients with OCD have displayed decreased sFC in sensory networks50,51 and lower centrality in the sensorimotor network52 compared with HCs. A recent brain dynamic study showed patients with OCD with higher symptom severity spend less time in the state with substantial between-network dFC (eg, between AUD, SMN, and visual network).34 As a shared endophenotype for OCD and their unaffected first‐degree relatives, this FC state has been considered a neurophysiological biomarker of OCD.34 Thus, previous brain sFC studies, previous dynamic findings with each single disorder, and our direct dFC comparison study converge in supporting the idea that a lower occurrence of the functional brain state characterized by high centrality in sensorimotor and primary sensory networks may represent a shared neurophysiological alteration in OCD and schizophrenia.
Shared and Disorder-Specific Alterations of Temporal Variability of Nodal Degree Centrality
In the analysis of nodal temporal variability of degree centrality, both patients with OCD and schizophrenia showed decreased temporal variability of degree centrality in the right DLPFC’s SFG (belonging to SAN) that is involved in the execution of multiple higher cognitive functions.53 The SAN is crucial for the detection of salient stimuli and orienting attention to them, and switching between default mode and executive states based on task demands.54 Previous studies have demonstrated that patients with schizophrenia and OCD manifest abnormal cortical thickness and volume55,56 and sFC57,58 in SFG. Similar to our results, previous studies suggested that patients with schizophrenia exhibited decreased dFC in dorsal prefrontal cortex during tasks59 and during the resting state.60 Our findings now demonstrate a similar severity of alteration in this region in schizophrenia and OCD.
Recent brain dFC studies of OCD or schizophrenia have demonstrated decreased brain dynamics involving areas of SAN,61,62 consistent with findings of our direct comparison of the 2 disorders. Decreased temporal variability of nodal centrality in these regions in our study suggests reduced efficiency or flexibility in the integration of SAN with other brain networks. This may contribute to impaired behavioral flexibility and reduced insight in both OCD and schizophrenia.61,63 In the case of OCD, our findings indicated that decreased temporal variability of degree centrality in this network is nominally related to level of obsessive-compulsive symptoms and behaviors.
We also observed that patients with schizophrenia exhibited lower dynamics of cerebellar degree centrality than were observed in OCD and HCs. Via reciprocal connections with the cerebral cortex through cerebellar-thalamic-cortical circuitry, this region is now recognized to play a vital role in cognitive and affective processes.64,65 The role of cerebellar dysfunction in the psychopathology of schizophrenia was highlighted by the “cognitive dysmetria theory,” which postulated that impaired coordination and sequencing of both sensorimotor and mental processes in schizophrenia results from alterations in cerebellar circuitry.66,67 Studies of individuals at high risk for psychosis indicated that cerebellar-cortical dysconnectivity predicts the onset of psychosis.68 Reduced gray matter volume of the cerebellum has been associated with decreased dFC between the cerebellum and the frontal-parietal network in patients with schizophrenia.69 The nominal association of decreased dynamics of cerebellar degree centrality with lower PANSS positive symptom scores in the present study reflects their clinical significance in schizophrenia.
Despite the differences between schizophrenia and OCD patients in cerebellar function observed in our study, some previous findings suggest some cerebellar alterations in OCD.70 Also, we note that in our study, OCD patients did show a nominally significant trend of increased temporal variability of cerebellar centrality compared with HCs. A task-based study using the Stroop response conflict task reported reduced activation in patients with OCD compared with HCs.71 A meta-analysis provided a quantitative overview of ReHo findings in OCD and reported lower ReHo in the cerebellum in patients with OCD.72 Thus, while alterations in cerebellar dFC appear to be greater in schizophrenia as our findings demonstrate, future studies are needed to clarify whether there are different or more subtle cerebellar alterations in OCD as well.
Limitations
First, the sample size in our study was not large, and some effects of interest were significant with a nominal threshold but not full correction for multiple comparisons, most notably the correlational analyses of brain-behavior associations. Second, while replication is required, we note that we validated our results using a different window size and obtained similar results, suggesting that our findings were stable regardless of the choice of window length. Third, the mean illness duration of patients with OCD was longer than the first-episode patients with schizophrenia. Illness duration differences or prior treatment in OCD patients may affect brain dynamics. Furthermore, whether the identified abnormalities persist after recovery from acute illness remains to be determined. Fourth, although the sliding-window method has been widely used to measure brain dynamics, controversy remains regarding the optimal strategy to best capture dynamic fluctuations.73 Evaluating brain dynamics with different methods and metrics might contribute to future advances and clarifications. Fifth, we noted that the scanning time of the resting-state studies was briefer than is now recommended,74 although, this is somewhat allayed by the fact that similar results were found for the 2 sliding-window sizes. Sixth, as with all studies using ICA, there is a risk of overfitting and independent replication is needed to confirm our ICA solution. Additionally, it should be noted that while the lack of psychiatric comorbidities and untreated status of patients are limitations concerning the generalizability of our findings to treated patients with diverse comorbidities, these features are also a strength of our study with regard to confidence of inferences about illness-related biology because confounding influences of comorbidity and drug effects do not impact our group comparisons. Furthermore, our study aimed to identify similarities and differences in brain function between OCD and schizophrenia, and we thus are not able to address the issue of patients meeting criteria for both disorders. Finally, we performed disorder-specific clinical ratings of both patient samples, using rating scales widely used for each disorder. Future studies incorporating identical clinical ratings in both groups may better clarify symptom/brain function correlations across the disorders.
Conclusion
In summary, we found that patients with OCD and schizophrenia both showed a decreased occurrence of a state manifested as the highest centrality in sensory and sensorimotor systems. Some alterations of regional degree centrality dynamics have nominally significant associations with symptom severity. Our results extend previous studies by providing a dynamic brain network-level view of shared and unique brain dysfunction in OCD and schizophrenia using the same scanner and analytic framework. Our findings provide the novel demonstration that the ability of neocortical regions to shift their dFC with other regions is altered in generally similar ways in OCD and schizophrenia, but that the dynamic integration of cerebellum into the brain connectome is particularly altered in schizophrenia.
Supplementary Material
Acknowledgments
The authors wish to thank the volunteer study participants for participating in this study. Conflict of interest: Dr. Sweeney has consulted to VeraSci. Other authors declare no potential conflicts of interest with regard to this manuscript.
Contributor Information
Lekai Luo, Huaxi MR Research Center (HMRRC), Department of Radiology, West China Hospital of Sichuan University, Chengdu, Sichuan, P.R. China; Department of Radiology, West China Second Hospital of Sichuan University, Chengdu, Sichuan, P.R. China.
Qian Li, Huaxi MR Research Center (HMRRC), Department of Radiology, West China Hospital of Sichuan University, Chengdu, Sichuan, P.R. China.
Yaxuan Wang, Huaxi MR Research Center (HMRRC), Department of Radiology, West China Hospital of Sichuan University, Chengdu, Sichuan, P.R. China.
Ning He, Department of Psychiatry, West China Hospital of Sichuan University, Chengdu, Sichuan, P.R. China.
Yuxia Wang, Huaxi MR Research Center (HMRRC), Department of Radiology, West China Hospital of Sichuan University, Chengdu, Sichuan, P.R. China.
Wanfang You, Huaxi MR Research Center (HMRRC), Department of Radiology, West China Hospital of Sichuan University, Chengdu, Sichuan, P.R. China.
Qian Zhang, Huaxi MR Research Center (HMRRC), Department of Radiology, West China Hospital of Sichuan University, Chengdu, Sichuan, P.R. China.
Fenghua Long, Huaxi MR Research Center (HMRRC), Department of Radiology, West China Hospital of Sichuan University, Chengdu, Sichuan, P.R. China.
Lizhou Chen, Huaxi MR Research Center (HMRRC), Department of Radiology, West China Hospital of Sichuan University, Chengdu, Sichuan, P.R. China.
Youjin Zhao, Huaxi MR Research Center (HMRRC), Department of Radiology, West China Hospital of Sichuan University, Chengdu, Sichuan, P.R. China.
Li Yao, Huaxi MR Research Center (HMRRC), Department of Radiology, West China Hospital of Sichuan University, Chengdu, Sichuan, P.R. China.
John A Sweeney, Huaxi MR Research Center (HMRRC), Department of Radiology, West China Hospital of Sichuan University, Chengdu, Sichuan, P.R. China; Department of Psychiatry and Behavioral Neuroscience, University of Cincinnati, Cincinnati, OH.
Qiyong Gong, Huaxi MR Research Center (HMRRC), Department of Radiology, West China Hospital of Sichuan University, Chengdu, Sichuan, P.R. China.
Fei Li, Huaxi MR Research Center (HMRRC), Department of Radiology, West China Hospital of Sichuan University, Chengdu, Sichuan, P.R. China.
Funding
This study was supported by the National Natural Science Foundation of China (Grant Nos. 61876032 to Fei Li, 82102007 to Li Yao, 82001795 to Youjin Zhao, 81621003, 81761128023, and 82027808 to Qiyong Gong, and 81820108018 to John A. Sweeney and Qiyong Gong), National Key R&D Program of China (2022YFC2009900), and Sichuan Science and Technology Program (2021YFS0077 to Li Yao, 2022YFS0069 to Youjin Zhao, and 2023YFS0226 to Lizhou Chen).
Author Contributions
Fei Li conceptualized and designed the study. Lekai Luo, Qian Li, Yaxuan Wang, Ning He, Yuxia Wang, Wanfang You, Qian Zhang, Fenghua Long, Lizhou Chen, Youjin Zhao, and Li Yao contributed to literature search, data acquisition and analysis, and draft the manuscript. Lekai Luo, Qian Li, Yaxuan Wang, John A. Sweeney, Qiyong Gong, and Fei Li critically revised the manuscript, and contributed to the data analysis strategy and interpretation. All authors approved the final version of the manuscript.
Data Availability
The data that support the findings of this study are available from the corresponding authors upon reasonable request.
References
- 1. Brainstorm C, et al. , Analysis of shared heritability in common disorders of the brain. Science. 2018;360(6395):eaap8757. [DOI] [PMC free article] [PubMed] [Google Scholar]
- 2. Writing Committee for the Attention-Deficit/Hyperactivity, D. et al. Virtual histology of cortical thickness and shared neurobiology in 6 psychiatric disorders. JAMA Psychiatry. 2021;78(1):47–63. [DOI] [PMC free article] [PubMed] [Google Scholar]
- 3. Poyurovsky M, Koran LM.. Obsessive-compulsive disorder (OCD) with schizotypy vs. schizophrenia with OCD: diagnostic dilemmas and therapeutic implications. J Psychiatr Res. 2005;39(4):399–408. [DOI] [PubMed] [Google Scholar]
- 4. Goodkind M, Eickhoff SB, Oathes DJ, et al. Identification of a common neurobiological substrate for mental illness. JAMA Psychiatry. 2015;72(4):305–315. [DOI] [PMC free article] [PubMed] [Google Scholar]
- 5. Wang YM, Zou L-Q, Xie W-L, et al. Altered functional connectivity of the default mode network in patients with schizo-obsessive comorbidity: a comparison between schizophrenia and obsessive-compulsive disorder. Schizophr Bull. 2019;45(1):199–210. [DOI] [PMC free article] [PubMed] [Google Scholar]
- 6. Lavalle L, Bation R, Dondé C, Mondino M, Brunelin J.. Dissociable source-monitoring impairments in obsessive-compulsive disorder and schizophrenia. Eur Psychiatry. 2020;63(1):e54. [DOI] [PMC free article] [PubMed] [Google Scholar]
- 7. Zhang X, Liu W, Guo F, et al. Disrupted structural covariance network in first episode schizophrenia patients: evidence from a large sample MRI-based morphometric study. Schizophr Res. 2020;224:24–32. [DOI] [PubMed] [Google Scholar]
- 8. Kim DJ, Moussa-Tooks AB, Bolbecker AR, et al. Cerebellar-cortical dysconnectivity in resting-state associated with sensorimotor tasks in schizophrenia. Hum Brain Mapp. 2020;41(11):3119–3132. [DOI] [PMC free article] [PubMed] [Google Scholar]
- 9. Stern ER, Eng GK, De Nadai AS, Iosifescu DV, Tobe RH, Collins KA.. Imbalance between default mode and sensorimotor connectivity is associated with perseverative thinking in obsessive-compulsive disorder. Transl Psychiatry. 2022;12(1):19. [DOI] [PMC free article] [PubMed] [Google Scholar]
- 10. Kuiper JJ, Lin Y-H, Young IM, et al. A parcellation-based model of the auditory network. Hear Res. 2020;396:108078. [DOI] [PubMed] [Google Scholar]
- 11. Faivre N, Vuillaume L, Bernasconi F, Salomon R, Blanke O, Cleeremans A.. Sensorimotor conflicts alter metacognitive and action monitoring. Cortex. 2020;124:224–234. [DOI] [PubMed] [Google Scholar]
- 12. Qin J, et al. The shared and distinct white matter networks between drug-naive patients with obsessive-compulsive disorder and schizophrenia. Front Neurosci. 2019;13:96. [DOI] [PMC free article] [PubMed] [Google Scholar]
- 13. Yu XM, et al. Comparison of resting-state spontaneous brain activity between treatment-naive schizophrenia and obsessive-compulsive disorder. BMC Psychiatry. 2021;21(1):544. [DOI] [PMC free article] [PubMed] [Google Scholar]
- 14. Fan J, Gan J, Liu W, et al. Resting-state default mode network related functional connectivity is associated with sustained attention deficits in schizophrenia and obsessive-compulsive disorder. Front Behav Neurosci. 2018;12:319. [DOI] [PMC free article] [PubMed] [Google Scholar]
- 15. Wang YM, Zou L-Q, Xie W-L, et al. Altered grey matter volume and cortical thickness in patients with schizo-obsessive comorbidity. Psychiatry Res Neuroimaging. 2018;276:65–72. [DOI] [PubMed] [Google Scholar]
- 16. Wang YM, Yang Z-Y, Cai X-L, et al. Identifying schizo-obsessive comorbidity by tract-based spatial statistics and probabilistic tractography. Schizophr Bull. 2020;46(2):442–453. [DOI] [PMC free article] [PubMed] [Google Scholar]
- 17. Ouazzani Housni Touhami Y, et al. , Clinical profile of schizophrenia comorbid with obsessive-compulsive symptoms: a comparative study. Encephale. 2022:S0013-7006(22)00179-8. [DOI] [PubMed] [Google Scholar]
- 18. Luo L, et al. , Recent advances in psychoradiology. Phys Med Biol. 2022;67(23):23TR01. [DOI] [PubMed] [Google Scholar]
- 19. Li F, Sun H, Biswal BB, Sweeney JA, Gong Q.. Artificial intelligence applications in psychoradiology. Psychoradiology. 2021;1(2):94–107. [DOI] [PMC free article] [PubMed] [Google Scholar]
- 20. Fornito A, Zalesky A, Pantelis C, Bullmore ET.. Schizophrenia, neuroimaging and connectomics. Neuroimage. 2012;62(4):2296–2314. [DOI] [PubMed] [Google Scholar]
- 21. Suo XS, Lei D, Li L, et al. Psychoradiological patterns of small-world properties and a systematic review of connectome studies of patients with 6 major psychiatric disorders. J Psychiatry Neurosci. 2018;43(6):427. [DOI] [PMC free article] [PubMed] [Google Scholar]
- 22. Cheng H, Newman S, Goñi J, et al. Nodal centrality of functional network in the differentiation of schizophrenia. Schizophr Res. 2015;168(1–2):345–352. [DOI] [PMC free article] [PubMed] [Google Scholar]
- 23. Liu W, Fang P, Guo F, Qiao Y, Zhu Y, Wang H.. Graph-theory-based degree centrality combined with machine learning algorithms can predict response to treatment with antipsychotic medications in patients with first-episode schizophrenia. Dis Markers. 2022;2022:1853002. [DOI] [PMC free article] [PubMed] [Google Scholar]
- 24. Lv D, Ou Y, Wang Y, et al. Altered functional connectivity strength at rest in medication-free obsessive-compulsive disorder. Neural Plast. 2021;2021:3741104. [DOI] [PMC free article] [PubMed] [Google Scholar]
- 25. Lu L, Li H, Baumel WT, et al. Acute neurofunctional effects of escitalopram during emotional processing in pediatric anxiety: a double-blind, placebo-controlled trial. Neuropsychopharmacology. 2022;47(5):1081–1087. [DOI] [PMC free article] [PubMed] [Google Scholar]
- 26. Lui S, Li T, Deng W, et al. Short-term effects of antipsychotic treatment on cerebral function in drug-naive first-episode schizophrenia revealed by “resting state” functional magnetic resonance imaging. Arch Gen Psychiatry. 2010;67(8):783–792. [DOI] [PubMed] [Google Scholar]
- 27. Li Q, et al. , Controllability of functional brain networks and its clinical significance in first-episode schizophrenia. Schizophr Bull. 2022:sbac177. [DOI] [PMC free article] [PubMed] [Google Scholar]
- 28. Yin Y, et al. , Brain alterations in sensorimotor and emotional regions associated with temporomandibular disorders. Oral Dis. 2022. Online ahead of print. [DOI] [PubMed] [Google Scholar]
- 29. Allen EA, Damaraju E, Plis SM, Erhardt EB, Eichele T, Calhoun VD.. Tracking whole-brain connectivity dynamics in the resting state. Cereb Cortex. 2014;24(3):663–676. [DOI] [PMC free article] [PubMed] [Google Scholar]
- 30. Luo L, et al. Patterns of brain dynamic functional connectivity are linked with attention-deficit/hyperactivity disorder-related behavioral and cognitive dimensions. Psychol Med. 2023:1–12. Online ahead of print. [DOI] [PMC free article] [PubMed] [Google Scholar]
- 31. Damaraju E, Allen EA, Belger A, et al. Dynamic functional connectivity analysis reveals transient states of dysconnectivity in schizophrenia. Neuroimage Clin. 2014;5:298–308. [DOI] [PMC free article] [PubMed] [Google Scholar]
- 32. You, W., et al. , Impaired dynamic functional brain properties and their relationship to symptoms in never treated first-episode patients with schizophrenia. Schizophrenia (Heidelb). 2022. 8(1):90. [DOI] [PMC free article] [PubMed] [Google Scholar]
- 33. Rabany L, Brocke S, Calhoun VD, et al. Dynamic functional connectivity in schizophrenia and autism spectrum disorder: convergence, divergence and classification. Neuroimage Clin. 2019;24:101966. [DOI] [PMC free article] [PubMed] [Google Scholar]
- 34. Peng Z, Guo Y, Wu X, et al. Abnormal brain functional network dynamics in obsessive-compulsive disorder patients and their unaffected first-degree relatives. Hum Brain Mapp. 2021;42(13):4387–4398. [DOI] [PMC free article] [PubMed] [Google Scholar]
- 35. Wang Y, Jiang Y, Su W, et al. Temporal dynamics in degree centrality of brain functional connectome in first-episode schizophrenia with different short-term treatment responses: a longitudinal study. Neuropsychiatr Dis Treat. 2021;17:1505–1516. [DOI] [PMC free article] [PubMed] [Google Scholar]
- 36. Douw L, Quaak M, Fitzsimmons SMDD, et al. Static and dynamic network properties of the repetitive transcranial magnetic stimulation target predict changes in emotion regulation in obsessive-compulsive disorder. Brain Stimul. 2020;13(2):318–326. [DOI] [PubMed] [Google Scholar]
- 37. Cao H, et al. Cerebellar functional dysconnectivity in drug-naïve patients with first-episode schizophrenia. Schizophr Bull. 2023;49(2):147–427. [DOI] [PMC free article] [PubMed] [Google Scholar]
- 38. Zeng J, Zhang W, Wu G, et al. Effects of antipsychotic medications and illness duration on brain features that distinguish schizophrenia patients. Schizophr Bull. 2022;48(6):1354–1362. [DOI] [PMC free article] [PubMed] [Google Scholar]
- 39. Himberg J, Hyvärinen A, Esposito F. Validating the independent components of neuroimaging time-series via clustering and visualization. NeuroImage. 2004;22(3):1214–1222. [DOI] [PubMed] [Google Scholar]
- 40. Calhoun VD, Adali T, Pearlson GD, Pekar JJ.. A method for making group inferences from functional MRI data using independent component analysis. Hum Brain Mapp. 2001;14(3):140–151. [DOI] [PMC free article] [PubMed] [Google Scholar]
- 41. Ma S, Correa NM, Li X-L, Eichele T, Calhoun VD, Adalı T.. Automatic identification of functional clusters in FMRI data using spatial dependence. IEEE Trans Biomed Eng. 2011;58(12):3406–3417. [DOI] [PMC free article] [PubMed] [Google Scholar]
- 42. Preti MG, Bolton TA, Van De Ville D.. The dynamic functional connectome: state-of-the-art and perspectives. Neuroimage. 2017;160:41–54. [DOI] [PubMed] [Google Scholar]
- 43. Thorndike RL. Who belongs in the family? Psychometrika. 1953;18(4):267–276. [Google Scholar]
- 44. Bullmore ET, Suckling J, Overmeyer S, Rabe-Hesketh S, Taylor E, Brammer MJ.. Global, voxel, and cluster tests, by theory and permutation, for a difference between two groups of structural MR images of the brain. IEEE Trans Med Imaging. 1999;18(1):32–42. [DOI] [PubMed] [Google Scholar]
- 45. Lencer R, Sprenger A, Reilly JL, et al. Pursuit eye movements as an intermediate phenotype across psychotic disorders: evidence from the B-SNIP study. Schizophr Res. 2015;169(1–3):326–333. [DOI] [PMC free article] [PubMed] [Google Scholar]
- 46. Sweeney JA, Palumbo DR, Halper JP, Shear MK.. Pursuit eye movement dysfunction in obsessive-compulsive disorder. Psychiatry Res. 1992;42(1):1–11. [DOI] [PubMed] [Google Scholar]
- 47. Yamamuro K, Okada K, Kishimoto N, Ota T, Iida J, Kishimoto T.. A longitudinal, event-related potential pilot study of adult obsessive-compulsive disorder with 1-year follow-up. Neuropsychiatr Dis Treat. 2016;12:2463–2471. [DOI] [PMC free article] [PubMed] [Google Scholar]
- 48. Parker DA, Hamm JP, McDowell JE, et al. Auditory steady-state EEG response across the schizo-bipolar spectrum. Schizophr Res. 2019;209:218–226. [DOI] [PMC free article] [PubMed] [Google Scholar]
- 49. Zhao Y, Zhang Q, Shah C, et al. Cortical thickness abnormalities at different stages of the illness course in schizophrenia: a systematic review and Meta-analysis. JAMA Psychiatry. 2022;79(6):560–570. [DOI] [PMC free article] [PubMed] [Google Scholar]
- 50. Moreira PS, Marques P, Magalhães R, et al. The resting-brain of obsessive-compulsive disorder. Psychiatry Res Neuroimaging. 2019;290:38–41. [DOI] [PubMed] [Google Scholar]
- 51. Cui G, Ou Y, Chen Y, et al. Altered global brain functional connectivity in drug-naive patients with obsessive-compulsive disorder. Front Psychiatry. 2020;11:98. [DOI] [PMC free article] [PubMed] [Google Scholar]
- 52. Armstrong CC, Moody TD, Feusner JD, et al. Graph-theoretical analysis of resting-state fMRI in pediatric obsessive-compulsive disorder. J Affect Disord. 2016;193:175–184. [DOI] [PMC free article] [PubMed] [Google Scholar]
- 53. Fan J, et al. , Resting-state default mode network related functional connectivity is associated with sustained attention deficits in schizophrenia and obsessive-compulsive disorder. Front Behav Neurosci. 2018;12:319. [DOI] [PMC free article] [PubMed] [Google Scholar]
- 54. Menon V. Large-scale brain networks and psychopathology: a unifying triple network model. Trends Cogn Sci. 2011;15(10):483–506. [DOI] [PubMed] [Google Scholar]
- 55. Fouche JP, du Plessis S, Hattingh C, et al. Cortical thickness in obsessive-compulsive disorder: multisite mega-analysis of 780 brain scans from six centres. Br J Psychiatry. 2017;210(1):67–74. [DOI] [PubMed] [Google Scholar]
- 56. Asmal L, du Plessis S, Vink M, Chiliza B, Kilian S, Emsley R.. Symptom attribution and frontal cortical thickness in first-episode schizophrenia. Early Interv Psychiatry. 2018;12(4):652–659. [DOI] [PubMed] [Google Scholar]
- 57. Ding YD, et al. , Enhanced global-brain functional connectivity in the left superior frontal gyrus as a possible endophenotype for schizophrenia. Front Neurosci. 2019;13:145. [DOI] [PMC free article] [PubMed] [Google Scholar]
- 58. Wang YM, Cai X-L, Zhang R-T, et al. Searchlight classification based on amplitude of low frequency fluctuation and functional connectivity in individuals with obsessive-compulsive symptoms. Cogn Neuropsychiatry. 2019;24(5):322–334. [DOI] [PubMed] [Google Scholar]
- 59. Harvey PO, Lee J, Cohen MS, et al. Altered dynamic coupling of lateral occipital complex during visual perception in schizophrenia. Neuroimage. 2011;55(3):1219–1226. [DOI] [PMC free article] [PubMed] [Google Scholar]
- 60. Baajour SJ, Chowdury A, Thomas P, et al. Disordered directional brain network interactions during learning dynamics in schizophrenia revealed by multivariate autoregressive models. Hum Brain Mapp. 2020;41(13):3594–3607. [DOI] [PMC free article] [PubMed] [Google Scholar]
- 61. Supekar K, Cai W, Krishnadas R, Palaniyappan L, Menon V.. Dysregulated brain dynamics in a triple-network saliency model of schizophrenia and its relation to psychosis. Biol Psychiatry. 2019;85(1):60–69. [DOI] [PubMed] [Google Scholar]
- 62. Luo L, Li Q, You W, et al. Altered brain functional network dynamics in obsessive-compulsive disorder. Hum Brain Mapp. 2021;42(7):2061–2076. [DOI] [PMC free article] [PubMed] [Google Scholar]
- 63. Fan J, Zhong M, Zhu X, et al. Resting-state functional connectivity between right anterior insula and right orbital frontal cortex correlate with insight level in obsessive-compulsive disorder. Neuroimage Clin. 2017;15:1–7. [DOI] [PMC free article] [PubMed] [Google Scholar]
- 64. Ramnani N, et al. The evolution of prefrontal inputs to the cortico-pontine system: Diffusion imaging evidence from macaque monkeys and humans. Cereb Cortex. 2006;16(6):811–818. [DOI] [PubMed] [Google Scholar]
- 65. Schmahmann JD. Disorders of the cerebellum: ataxia, dysmetria of thought, and the cerebellar cognitive affective syndrome. J Neuropsychiatry Clin Neurosci. 2004;16(3):367–378. [DOI] [PubMed] [Google Scholar]
- 66. Andreasen NC, Paradiso S, O'Leary DS.. “Cognitive dysmetria” as an integrative theory of schizophrenia: a dysfunction in cortical-subcortical-cerebellar circuitry? Schizophr Bull. 1998;24(2):203–218. [DOI] [PubMed] [Google Scholar]
- 67. Guell X, Gabrieli JDE, Schmahmann JD.. Embodied cognition and the cerebellum: perspectives from the dysmetria of thought and the universal cerebellar transform theories. Cortex. 2018;100:140–148. [DOI] [PubMed] [Google Scholar]
- 68. Cao H, et al. , Cerebello-thalamo-cortical hyperconnectivity as a state-independent functional neural signature for psychosis prediction and characterization. Nat Commun. 2018;9(1):3836. [DOI] [PMC free article] [PubMed] [Google Scholar]
- 69. He H, Luo C, Luo Y, et al. Reduction in gray matter of cerebellum in schizophrenia and its influence on static and dynamic connectivity. Hum Brain Mapp. 2019;40(2):517–528. [DOI] [PMC free article] [PubMed] [Google Scholar]
- 70. Xu T, Zhao Q, Wang P, et al. Altered resting-state cerebellar-cerebral functional connectivity in obsessive-compulsive disorder. Psychol Med. 2019;49(7):1156–1165. [DOI] [PubMed] [Google Scholar]
- 71. Nabeyama M, Nakagawa A, Yoshiura T, et al. Functional MRI study of brain activation alterations in patients with obsessive-compulsive disorder after symptom improvement. Psychiatry Res. 2008;163(3):236–247. [DOI] [PubMed] [Google Scholar]
- 72. Qing X, Gu L, Li D.. Abnormalities of localized connectivity in obsessive-compulsive disorder: a voxel-wise meta-analysis. Front Hum Neurosci. 2021;15:739175. [DOI] [PMC free article] [PubMed] [Google Scholar]
- 73. Hindriks R, Adhikari MH, Murayama Y, et al. Can sliding-window correlations reveal dynamic functional connectivity in resting-state fMRI? Neuroimage. 2016;127:242–256. [DOI] [PMC free article] [PubMed] [Google Scholar]
- 74. Fu Z, Tu Y, Di X, et al. Characterizing dynamic amplitude of low-frequency fluctuation and its relationship with dynamic functional connectivity: an application to schizophrenia. Neuroimage. 2018;180(Pt B):619–631. [DOI] [PMC free article] [PubMed] [Google Scholar]
Associated Data
This section collects any data citations, data availability statements, or supplementary materials included in this article.
Supplementary Materials
Data Availability Statement
The data that support the findings of this study are available from the corresponding authors upon reasonable request.