

Summary
The pre-mRNA life cycle requires intron processing; yet, how intron processing defects influence splicing and gene expression are unclear. Here, we find TTDN1/MPLKIP, which is encoded by a gene implicated in non-photosensitive trichothiodystrophy (NP-TTD), functionally links intron lariat processing to spliceosomal function. The conserved TTDN1 C-terminal region directly binds lariat debranching enzyme DBR1, while its N-terminal intrinsically disordered region (IDR) binds the intron binding complex (IBC). TTDN1 loss, or a mutated IDR, causes significant intron lariat accumulation, as well as splicing and gene expression defects, mirroring phenotypes observed in NP-TTD patient cells. A Ttdn1-deficient mouse model recapitulates intron processing defects and certain neurodevelopmental phenotypes seen in NP-TTD. Fusing DBR1 to the TTDN1 IDR is sufficient to recruit DBR1 to the IBC and circumvents the functional requirement for TTDN1. Collectively, our findings link RNA lariat processing with splicing outcomes by revealing the molecular function of TTDN1.
Keywords: RNA lariat, DBR1, trichothiodystrophy, spliceosome, RNA processing, transcription
eTOC Blurb
Townley et al. demonstrate that TTDN1 is involved in RNA processing, linking the lariat debranching enzyme to a spliceosomal complex. This function of TTDN1 is shown to be critical for proper splicing and transcription, and Ttdn1 loss in mice leads to phenotypes seen in patients with trichothiodystrophy.
Graphical Abstract

Introduction
Eukaryotic gene expression involves the recruitment of transcriptional machinery to the transcriptional start site followed by the release of RNA Polymerase II (RNAP II), leading to RNAP II elongation and the subsequent synthesis of pre-mRNA. While the removal of introns from a nascent pre-mRNA molecule can occur as a post-transcriptional regulatory step, cotranscriptional splicing is an essential feature of many highly-expressed genes1–3. The ability of cells to undergo co-transcriptional splicing centers on the idea that spatiotemporal organization of splicing and transcription not only protects nascent RNAs from degradation, but also enhances local substrate concentration, thereby increasing reaction efficiencies4. This subnuclear coordination is facilitated by interactions between the RNAP II carboxy-terminal domain (CTD) and a host of factors that regulate transcription, pre-mRNA splicing, mRNA capping, polyadenylation, and downstream steps such as mRNA export5–10. Aside from physically promoting splicing, changes in RNAP II elongation rate can broadly influence alternative splicing patterns. Studies examining elongation rate in response to UV damage, chromatin state, and RNAP II mutation have found that abnormal elongation rates caused by altered RNAP II function reduced splicing efficiency and resulted in aberrant alternative splicing patterns11–16.
While most research on RNAP II elongation has centered on the downstream effects on splicing, multiple studies provide evidence for a positive feedback mechanism between early-stage spliceosome assembly and efficient RNAP II elongation. Rapid inactivation of the U2 snRNP, an essential spliceosomal component, via small-molecule inhibition was found to largely prevent the release of paused RNAP II into the gene body for active transcription elongation, resulting in a global decrease in mRNA biogenesis17. In S. cerevisiae, blocking pre-spliceosome complex formation via depletion of the RNA helicase Prp5p leads to RNAP II accumulation on introns and decreased elongation within intron-containing genes, while transcription of intronless genes is unaffected18. In a similar fashion, depletion of the serine/arginine-rich (SR) protein SC-35 in mouse cells results in gene-specific RNAP II elongation defects19. That RNAP II physically interacts with early components of the spliceosome20 further suggests an intricate interplay between nascent RNA production and its downstream processing.
Although early inhibition of splicing has a demonstrated influence on nascent transcription, whether late-stage splicing inhibition may result in similar alterations is unknown. Notably, a largely understudied terminal step in splicing occurs upon exon ligation, as introns that are removed from the pre-mRNA transcript form a circular RNA fragment known as a lariat. The intron lariat circularizes via a 2’,5’-phosphodiester bond, and the lariat is subsequently linearized by the highly conserved RNA debranching metalloenzyme (DBR1)21–23. Human genes have an average of 7–8 introns, and spliceosome assembly occurs de novo on each intron of a pre-mRNA transcript, necessitating an efficient and accurate method of intron removal24,25. Known as the intron lariat turnover pathway, this late-stage step is critical for the release and processing of a subset of regulatory microRNAs26,27, as well as for the recycling of spliceosome-associated small nuclear ribonucleoproteins (snRNPs)28. In the absence of efficient lariat processing, retention of snRNPs may occur in late-stage splicing complexes, potentially impacting the efficiency of subsequent spliceosome assembly29. Differential regulation of spliceosome-associated snRNP levels influences alternative splicing during normal development and across cancer subtypes30. Yet how the rate at which released and recycled intron-associated splicing factors and snRNPs influence gene expression is largely unstudied. Importantly, the consequences of disrupted lariat complex processing, including pleiotropic developmental defects and increased susceptibility to viral infection, imply that this end-stage splicing step has key homeostatic roles in the cell31,32. However, it has yet to be determined whether these are a direct effect of increased RNA lariats or an indirect impact on transcription or RNA processing.
Here, we identify the uncharacterized protein TTDN1 as an unappreciated link between intron metabolism, splicing, and gene expression. We show that TTDN1 promotes the association between DBR1 and the intron binding complex, facilitating the processing of nascent intron lariats. Lariat accumulation in the absence of TTDN1 coincides with length-dependent gene expression changes. Mutations to the gene encoding TTDN1 result in nonphotosensitive trichothiodystrophy (NP-TTD), which feature broad neurological and developmental abnormalities thought to be associated with transcriptional defects33–35. We validate our in vitro findings by developing a Ttdn1Δ/Δ mouse model, which recapitulates the RNA processing defects seen in NP-TTD patient cell lines, as well certain aspects of the neurodevelopmental phenotypes seen in NP-TTD patients. Collectively, our work connects disrupted lariat processing to downstream consequences on splicing and gene expression, placing these studies in the context of the molecular pathology underlying NP-TTD.
Results
TTDN1 interacts with DBR1 and promotes RNA lariat processing in cells
We recently characterized a link between alkylation damage responses and RNF113A, a gene associated with NP-TTD36–40. We were curious about the mechanism of TTDN1, which is another gene implicated in NP-TTD34. To begin to identify TTDN1 function, we used mass spectrometry to analyze TTDN1 interaction partners from HeLa-S nuclear extract, since TTDN1 localized to the nucleus (Supplemental Figure S1a). From two independent immunoprecipitations, the intron lariat debranching enzyme, DBR1, was identified by mass spectrometry (Supplemental Table S1 and Supplemental Figure S1b). Immunoprecipitation of HA-TTDN1 co-immunoprecipitated DBR1 (Figure 1a), and immunoprecipitation of endogenous DBR1 co-immunoprecipitated TTDN1 (Figure 1b). To determine whether TTDN1 and DBR1 could interact directly, we immobilized GST-TTDN1 and tested its ability to bind His-Flag-DBR1. While GST-TTDN1 was able to pull down His-Flag-DBR1, two negative controls (GST and GST-ASCC1) did not (Figure 1c).
Figure 1. TTDN1 interacts with DBR1 and promotes RNA debranching.
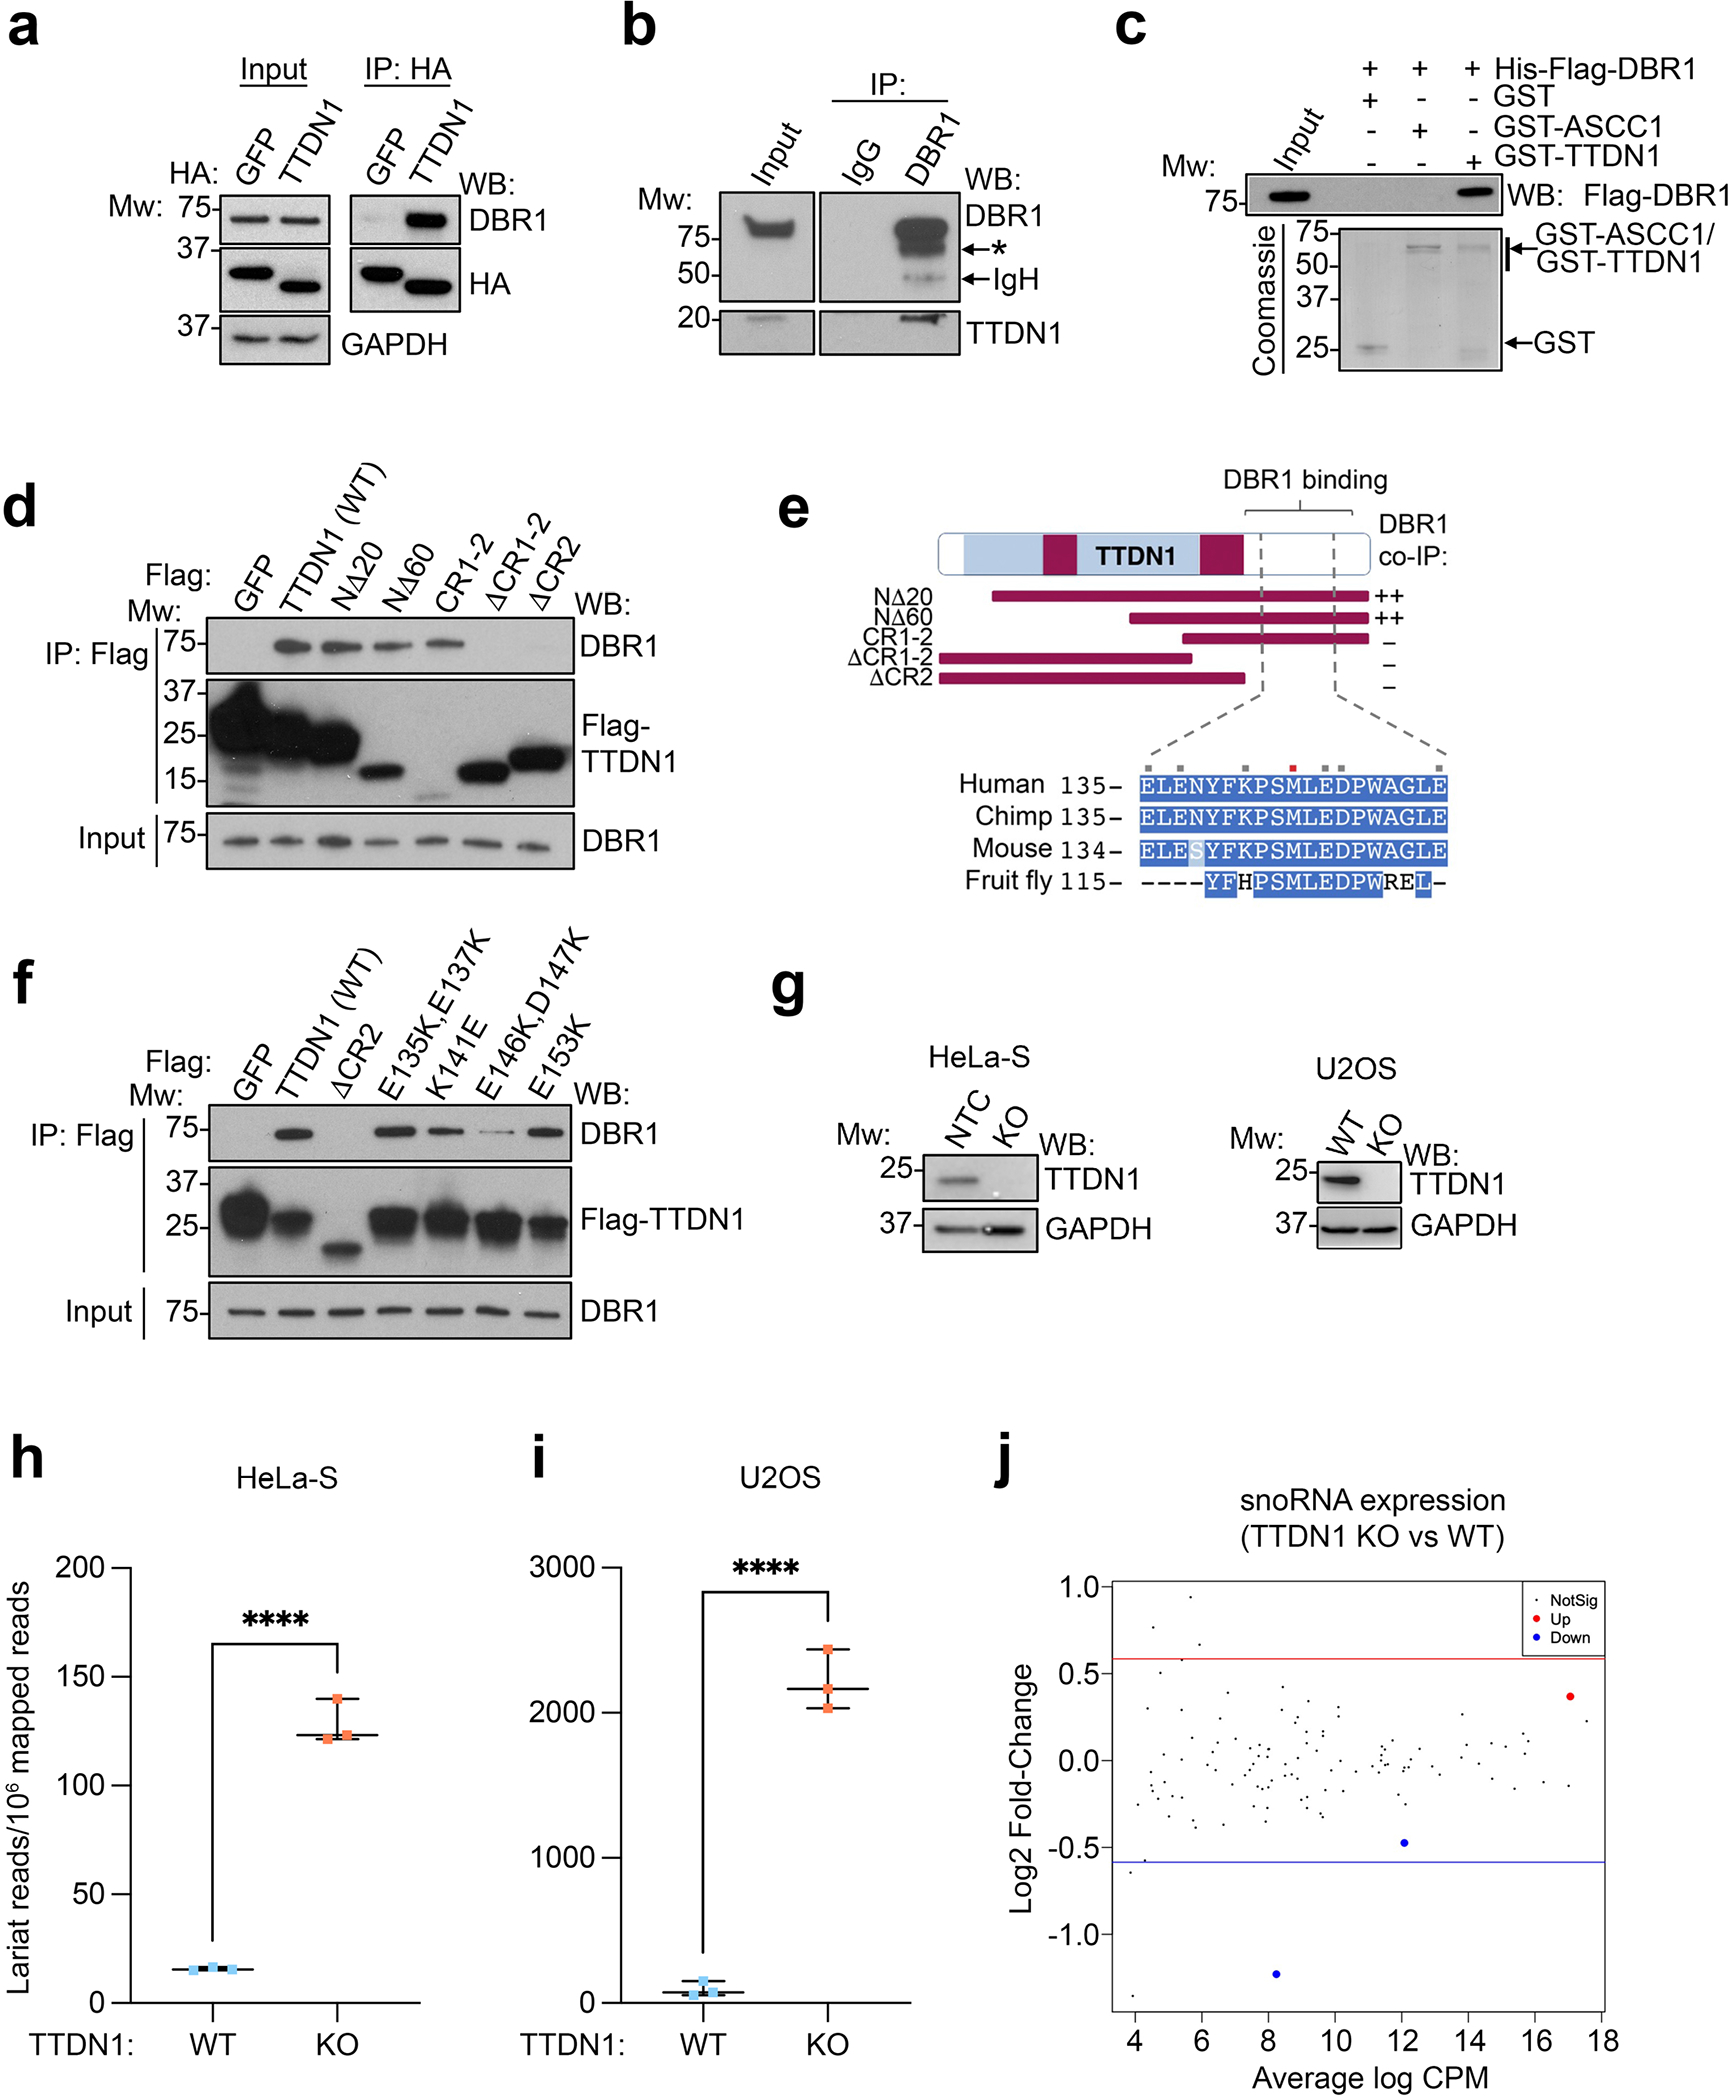
(a) HA immunoprecipitation (IP: HA) was performed from 293T cells expressing indicated vectors. IP and input were analyzed by western blot with the indicated antibodies; positions of molecular weight (Mw) markers are shown (in KDa). (b) 293T extracts were immunoprecipitated with IgG or DBR1 antibody. IP and input material were analyzed by western blot using antibodies as shown. Asterisk (*) indicates a DBR1 degradation product. (c) GST, GST-ASCC1, or GSTTTDN1 were immobilized and binding with His-Flag-DBR1 was tested. Bound and input material were analyzed by western blot against Flag or Coomassie Blue staining (CBB). (d) Flag IP was performed from 293T cells expressing the indicated vectors. IP and input material were analyzed by western blot. (e) TTDN1 schematic and summary of DBR1 binding analysis. Bottom shows C-terminal sequence alignment of human TTDN1 and its orthologues. Red square indicates NP-TTD associated mutation (Met144→Val). Grey squares indicate residues targeted for mutagenesis. (f) Flag IP was performed as in (d) using the indicated vectors expressed in 293T cells. (g) TTDN1 was targeted using CRISPR/Cas9 in HeLa-S and U2OS cells. Clones were isolated and analyzed by western blot. (h) and (i) RNA-Seq was performed in the indicated cells, and stable lariat species were quantified using a RNA branchpoint detection algorithm. ****p< 0.0001 by unpaired t-test. (j) Bland-Altman plot comparing snoRNA expression in control and TTDN1 KO HeLa-S cells. Red and blue lines indicate Log2 fold-change of +/− 0.585.
Next, we performed a deletion analysis of TTDN1. The N-terminus of TTDN1 was dispensable for co-immunoprecipitation of DBR1, while the C-terminal conserved regions, termed CR1 and CR241, were both necessary and sufficient for interacting with DBR1 under the same conditions (Figure 1d–e). The M144V patient mutation, located within the CR2 domain, had a very minor effect on the DBR1 interaction (Supplemental Figure S1c). Additional site-directed mutagenesis demonstrated that specific residues within this domain of TTDN1, in particular E146 and D147, were important for the interaction with DBR1 (Figure 1e–f, Supplemental Figure S1c).
Because of their physical interaction, we reasoned that TTDN1 may impact lariat processing by DBR1. Therefore, we generated CRISPR/Cas9 clonal knockouts of TTDN1 in HeLa-S and U2OS cells (Figure 1g). To quantify lariat processing, we performed RNA-seq at high depth (>200 million reads/sample), then applied a modified version of a previously described branchpoint annotation algorithm 42. This method utilizes sequences from the 5’ and 3’ ends of annotated introns to identify lariat-derived reads which can occur when reverse transcriptase transcribes through a lariat branchpoint. The representation of these reads relative to linearly mapped reads is then computed to quantify lariat abundance at steady state. Using this approach, we found that TTDN1 loss increased lariat abundance ~8.2 and ~23.7-fold over controls in HeLa-S and U2OS cells, respectively (Figure 1h–i). This was not due to overt loss of DBR1 protein (Supplemental Figure S1d). Our RNA-Seq analysis also revealed that loss of TTDN1 led to aberrant splicing events, primarily exon skipping (Supplemental Figure S1e–f). A similar effect was observed upon depletion of DBR1 and performing RNA-Seq to assess splicing alterations (Supplemental Figure S1g–h). As processing of small nucleolar RNAs (snoRNAs) also depend on DBR128, we determined whether this class of small RNAs were misregulated in TTDN1 deficient cells. Yet this was not the case, suggesting that introns encoding snoRNAs may not be affected by TTDN1 loss (Figure 1j).
TTDN1 links DBR1 to the intron binding complex
TTDN1 may function to promote DBR1 activity by linking DBR1 to higher-order RNPs. To test this, we performed size exclusion chromatography using control and TTDN1 KO nuclear extracts. DBR1 from both extracts eluted primarily at lower molecular weight (~150 kDa). However, in control extract, a small amount of DBR1 co-eluted with earlier fractions, suggesting association with larger complexes, which was lost in TTDN1 KO extracts (Supplemental Figure S2a, fractions 26–30). Interactome analysis of DBR1 revealed that a majority of its interacting proteins had functional associations with the spliceosome (Supplemental Table S2), consistent with previous reports43. Amongst these were all five members of the intron binding complex (IBC), composed of the Aquarius helicase (AQR), XAB2/SYF1, ISY1, ZNF830/CCDC16, and PPIE (Supplemental Figure S2b)44,45. Notably, many of these interactions appeared reduced or lost in the DBR1 IP-MS performed in TTDN1 KO cells (Figure 2a and Supplemental Figure S2c, and Supplemental Table S3). IP-western analysis of tagged DBR1 confirmed interaction with IBC members in control cells, but this was lost in TTDN1 KO cells (Figure 2b), indicating that TTDN1 may link DBR1 and the IBC. Under these conditions, we did not observe an interaction between DBR1 and other spliceosomal proteins, such as PRP8 and SF3B2 (Supplemental Figure S2d).
Figure 2. TTDN1 promotes DBR1 association with the intron binding complex (IBC).

(a) Peptide plot depicting normalized sum intensities (averaged from two independent experiments) for proteins associated with Flag-HA-DBR1 in control or TTDN1 KO HeLa-S cells, as determined by LC-MS/MS (see also Supplemental Figure S2c). (b) Flag-HA-DBR1 or vector was expressed in WT or TTDN1 KO HeLa-S cells. Flag immunoprecipitation was performed from nuclear extract; Input/bound material was western blotted as shown. (c) Flag IP was performed using the indicated vectors expressed in 293T cells; input and bound material were western blotted as shown. (d) Schematic of human TTDN1 highlighting its prion-like domain and its conserved CR2 region. (e) Aromatic patterning was quantified as described previously, generating 106 random sequence permutations to build the null-model distribution46. (f) Flag IP was performed as in (c) using the indicated vectors expressed in 293T cells (g) IBC was purified from insect cells, analyzed by SDS-PAGE, and Coomassie blue staining. (h) GST, GST-TTDN1, or the GST-TTDN1φ→Ala were immobilized and binding with IBC was tested. Bound and input material were analyzed by western blot against AQR and XAB2 or Coomassie Blue staining. Asterisk (*) indicates GST-TTDN1 degradation products. Representative of two experiments. (i) GST or GST-TTDN1 were immobilized and binding with IBC or AQR alone was tested as in (h). Representative of two experiments. (j) His-Flag DBR1 (0.1, 0.5, and 4 μg) was immobilized and binding with IBC was tested. Bound and input material were analyzed by western blot as shown. (k) Binding assay between IBC and DBR1 was performed as in (j) with 0.15 μg of DBR1, with or without His-TTDN1 as indicated. Representative of two experiments. Unless otherwise stated, all results are representative of three experiments.
We reasoned that Flag-HA tagging TTDN1 at the N-terminus interfered IBC binding, thus explaining the lack of IBC peptides in our TTDN1 interactome analysis. Indeed Flag-only tagged TTDN1 co-immunoprecipitated endogenous XAB2 and AQR (Figure 2c). Deletion of the N-terminal portion of TTDN1 reduced or abrogated XAB2/AQR co-immunoprecipitation without impacting the DBR1 interaction. We noticed that the N-terminus of TTDN1 consisted of an aromatic-rich prion-like domain with evenly spaced aromatic residues (Figure 2d, aromatics in orange), similar to hnRNP-A146. The natural patterning of the aromatic residues in TTDN11−122 is more evenly distributed than almost all possible patterns of aromatic residues obtained randomly, implying evolutionary pressure for such spacing (Figure 2e), in line with prior work on other such domains that may form biological condensates46. Indeed, recombinant mCherry-fused TTDN1 formed droplets in vitro, while targeted mutations of these aromatics (TTDN1φ→Ala) reduced droplet formation (Supplemental Figure S2e–g). Since AQR and XAB2 both associated with nuclear speckle bodies (Supplemental Figure S2h), we reasoned that TTDN1φ→Ala mutant may lose interaction with AQR and XAB2. Unlike WT TTDN1, co-immunoprecipitation of IBC components was lost when we immunoprecipitated TTDN1φ→Ala, although its ability to associate with DBR1 was maintained (Figure 2f).
We next reconstitute the TTDN1-IBC interaction. using recombinant IBC containing all five subunits purified from insect cells (Figure 2g). We found that immobilized GST-TTDN1 but not GST alone associated with IBC, while GST-TTDN1φ→Ala was significantly reduced in its ability to pull down the IBC (Figure 2h). Recombinant AQR alone did not interact with GSTTTDN1 (Figure 2i). The IBC was also able to interact with immobilized Flag-DBR1, but this interaction appeared to increase when His-TTDN1 was added (Figure 2j–k). Taken together, our results suggest that TTDN1 functions to promote an interaction between DBR1 and the IBC.
Lariat processing defects influence gene expression
How might disruption of this RNP-DBR1 interaction cause TTD? In transcription-coupled repair disorders, long genes may accumulate a higher total lesion load than short genes. This results in biased misexpression of genes in a length-dependent manner due to RNAP II stalling, such that long genes are downregulated and short genes are upregulated47. While patients with TTDN1 alterations are repair-proficient, they exhibit neurodevelopmental phenotypes consistent other TC-NER defective TTD patients; yet how TTDN1 loss correlates with transcriptional defects is unclear34. We found that the average genomic length of downregulated transcripts in TTDN1 deficient cells was significantly longer than the length of unaffected genes in both U2OS and HeLa-S cells (Figure 3a and Supplemental Figure S3a). This inverse correlation was observed when analyzing the number of exons and gene expression changes; that is, downregulated genes had more exons, and upregulated genes had fewer exons (Supplemental Figure S3b–c). Plotting gene expression change compared to transcript genomic length revealed an inverse relationship when comparing TTDN1 KO cells relative to controls (Figure 3b and Supplemental Figure S3d). We confirmed three long genes (TLL1, BCR, and POU6F2) downregulated in our RNA-Seq data were similarly reduced by qRT-PCR in the TTDN1 KO cells (Figure 3c). Conversely, four short genes were confirmed to be upregulated in TTDN1 KO cells (see Supplemental Figure S7 below). We reasoned that a common set of differentially expressed genes could account for the NP-TTD phenotypes, even though a diverse set of factors cause this syndrome. Notably, ~800 differentially expressed genes overlapped between our TTDN1 KO expression data and those altered upon loss of RNF113A48; these were enriched for genes involved in cell migration and neuronal development, amongst others (Supplemental Figure S3e–f).
Figure 3. Gene expression changes upon loss of TTDN1 or DBR1.

(a) Box plots of transcript genomic length of differentially expressed (<−1.0 or > 1.0 log2 fold-change for downregulated and upregulated, respectively) and not differentially expressed transcripts from TTDN1 KO and control U2OS cells. p values determined by Wilcoxon rank-sum tests. (b) Relationship between transcript genomic length and changes in expression upon loss of TTDN1 in U2OS cells. (c) mRNA levels were assessed by RT-qPCR from cells in (a). Internal control was β-actin. Genomic transcript length corresponding RNA-Seq results are displayed below. Error bars represent standard deviation from two independent experiments. **** p<0.0001 by unpaired t-test. (d) and (e) Analysis as in (a) and (b), respectively, was performed using RNA-Seq of DBR1 KO and control HeLa-S cells. (f) Whole cell lysates from two control (C1 and C2) and three NP-TTD (P1, P2, and P3) fibroblast lines with TTDN1 mutations were used for western blot analysis. Ages and sexes of patients are shown. (g) Stable lariat species were quantified using a branchpoint identification algorithm in cell lines from (f). *** p<0.001, **** p<0.0001 by unpaired t-test. (h) Analysis as in (a) was performed using RNA-Seq analysis of P1 and C2 cells. (i) Alternative 3′/5′ splice sites (A3SS, A5SS), mutually exclusive exons (MXE), retained introns (RI), and skipped exons (SE) were quantified using rMATS. Ontology analysis (below) was performed using the differentially spliced genes. Unless otherwise stated, all results are representative of three experiments.
The effect of DBR1 loss on length-dependent gene expression was even more striking (Figure 3d–e), suggesting that loss of lariat processing is sufficient to result in similar length-associated changes in gene expression. We then analyzed patient fibroblasts from three siblings with NP-TTD — all homozygous for a two base pair deletion at nucleotides 187–188 in exon 1 of TTDN141; western blotting confirmed loss of TTDN1 protein (Figure 3f). These patient cell lines demonstrated a marked increase in RNA lariat accumulation, reflecting the same defect observed in our TTDN1 knockout cells (Figure 3g). When assessing differential gene expression in the patient fibroblasts, we saw more modest alterations with respect to gene length, although shorter genes were consistently upregulated in the NP-TTD patient cells compared to controls (Figure 3h and Supplemental Figure S3g, S3i). This could be due to mismatched patient age, or that the control fibroblasts were from unrelated individuals. Notably, these patient fibroblasts had similar altered splicing patterns seen in our TTDN1 KO cell lines (Figure 3i and Supplemental Figure S3h, S3j), suggesting a similar defect in mRNA processing. Ontology analysis of the differentially spliced genes revealed cell growth and authophagy pathways as significantly enriched (Figure 3i), which may contribute to TTD pathology.
Loss of Ttdn1 in mice recapitulates RNA processing defects and specific NP-TTD pathologies
Our in vitro findings support a model where lariat accumulation leads to splicing disruption and gene expression alterations. We next asked how loss of TTDN1 in vivo could lead to downstream consequences in development and neurological function. While there are NER-deficient mouse models49, none of these recapitulate phenotypes resulting from repair-proficient TTD. As such, we created a mouse model for the common TTDN1 allele found in NP-TTD patients (TTDN1M144V/M144V)41. Using CRISPR/Cas9, we produced the corresponding homozygous mouse (Ttdn1M143V/ M143V), as well as a large end-joining mediated deletion that resulted in a premature stop codon, and lack of detectable protein (hereon referred to as Ttdn1Δ/Δ; Supplemental Figure S4a–b). We saw significant defects in weight gain over time in both female and male Ttdn1Δ/Δ mice (Figure 4a and Supplemental Figure S4c), consistent with most NP-TTD patients34. However, we failed to see this phenotype in the Ttdn1M143V/M143V mice (Supplemental Figure S4d); this could reflect the largely intact interaction we observed with this form of TTDN1 and DBR1 (see Supplemental Figure S2). From heterozygous matings, Ttdn1Δ/Δ mice were born at less than expected Mendelian ratios, reflecting a modest reduction in overall fitness (Supplemental Figure S4e). A hallmark of TTD is the presence of sparse, sulfur-deficient hair, and while this was not overtly apparent in younger Ttdn1Δ/Δ mice (Figure 5b, left), we observed a significant decrease in cysteic acid content as a percentage of hair protein in these mice (Figure 5c), on par with a previously-characterized NER-defective TTD mouse model50. While most TC-NER deficient mice die prematurely, Ttdn1Δ/Δ mice did not appear to grossly deteriorate or die early; aged Ttdn1Δ/Δ mice are still alive beyond 15 months, reflecting the lack of progeroid phenotypes in NP-TTD. However, the sparse hair became more apparent in aged Ttdn1Δ/Δ mice (Figure 4b, right), and defects in weight gain were maintained over time (Supplemental Figure S4f).
Figure 4. Ttdn1Δ/Δ mice recapitulate molecular and pathological phenotypes of NP-TTD.

(a) Weights of female littermate mice were determined at the indicated age. N=5 mice per genotype. * p<0.05, ** p<0.01, *** p<0.001, ****p<0.0001 by unpaired t-test. (b) Female littermate mice at 1 month (left) and 15 months (right). Note sparse hair apparent in aged Ttdn1Δ/Δ mouse. (c) Amino acid analysis of hair protein from littermate mice. N=5 per genotype, ** p<0.01 by unpaired t-test. (d) RNA was extracted from the cortex of 8 week old littermate mice. Stable lariat species were quantified using a branchpoint identification algorithm. N=5 mice per genotype. **** p<0.0001 by unpaired t-test. (e) GSEA of the top 9 pathways significantly differentially regulated in the cortex of 8 week-old Ttdn1Δ/Δ mice based on MSigDb Human Phenotype Ontology gene sets. (f) An ANOVA conducted on the data pertaining to distance traveled in the peripheral zone of the test field; Ttdn1Δ/Δ mice traveled significantly shorter distance than controls in this area [F(1,33)=4.32, p=0.046]. (g) An ANOVA performed on the walking initiation test (combined cohorts) yielded a significant genotype effect [F(1,33)=15.07, p=0.003]; Ttdn1Δ/Δ mice took significantly longer to move out of a circumscribed area. (h) An rmANOVA conducted on the data from the accelerating rotarod trials produced a significant genotype effect [F(1,33)=11.74, *p=0.002], and genotype x trials interaction [F(1,33)=6.67, **p=0.014], indicating that Ttdn1Δ/Δ mice spent significantly less time on the rotarod for some of the trials. #p<0.025; ##p<0.003. (i) and (j) Significant genotype effects were found following rmANOVAs conducted on swimming speed data from cued and place trials conducted in the Morris water maze; (genotype effects: [F(1,33)=7.87, *p<0.00005] and [F(1,33)=33.86, *p<0.00005, respectively), indicating Ttdn1Δ/Δ mice swam significantly more slowly than controls. A significant sex effect was found during the cued trials [F(1,33)=7.87, p=0.008], but the genotype x sex interaction was not significant. ##p<0.015; †p<0.0005; ††p<0.00005. (k) An rmANOVA conducted on the auditory cue data from the conditioned fear test (day 3) resulted in a significant genotype effect, [F(1,33)=20.69, *p=0.001], and a significant genotype x minutes interaction, [F(7,231)=2.33, **p=0.033, Huyhn-Feldt (H-F) adjusted p], showing that Ttdn1Δ/Δ mice exhibited significantly reduced freezing levels for certain times during the test #p<0.05, ^p<0.010, ##p<0.00625 (Bonferroni corrected level); †p<0.0005; ††p<0.00005.
Figure 5. Relationship between TTDN1 and spliceosomal function in gene expression and transcription.

(a) RNA-Seq data was used to quantify stable lariat species upon Pladienolide-B (Pla-B) treatment; ns, not significant by unpaired t-test. (b) Relationship between transcript genomic length and changes in expression (log2 fold-changes) in U2OS cells upon Pla-B treatment. (c) and (d) Box plots of transcript genomic length of differentially expressed (<−0.585 or >0.585 log2 fold-change for downregulated and upregulated, respectively) and not differentially expressed transcripts from control and TTDN1 KO U2OS cells in the presence or absence of Pla-B. p values were determined by Wilcoxon rank-sum tests. (e) Venn diagram showing the number of overlapping DEGs comparing U2OS cells treated with Pla-B and TTDN1 KO U2OS cells. p value was determined by one-sided Fisher’s exact test. (f) PRO-Seq analysis in control and TTDN1 KO U2OS cell lines. Metagene plot is shown, demonstrating the relationship between average PRO-Seq signal and position on gene body for all genes (TSS, transcription start site; TES, transcription end site). (g) and (h) PRO-Seq metagene analysis of downregulated (g) and upregulated (h) genes, defined as <−0.585 or >0.585 log2 fold-change, respectively, using parallel RNA-Seq samples in control and TTDN1 KO cells. (i) Venn diagram showing the overlap between DEGs (at least +/−0.585 log2 fold-change) and genome-wide PRO-Seq signal changes comparing control and TTDN1 KO U2OS cells. p value was determined by one-sided Fisher’s exact test. All RNA-Seq and PRO-Seq experiments were performed in triplicate.
To determine whether Ttdn1Δ/Δ mice recapitulated RNA processing defects observed in the cell lines, we performed RNA-seq from the cortex of Ttdn1Δ/Δ and wildtype littermate controls. RNA lariat abundance was increased ~4.1-fold compared to WT samples, as were alternative splicing events (Figure 4d and Supplemental Figure S4g). Gene set enrichment analysis of pathways significantly differentially dysregulated in the cortex of Ttdn1Δ/Δ revealed signatures associated with neurological and developmental defects in humans (Figure 4e). Male Ttdn1Δ/Δ brains were smaller than controls, whereas female brains were not significantly different (Supplemental Figure S4h). Additional RNA-Seq analysis from two different tissues from WT and Ttdn1Δ/Δ aged (15-month old) male mice revealed upregulated gene expression associated with shorter genes or those with fewer exons, while downregulated genes were not as consistently associated with longer genes or greater exons (Supplemental Figure S4i–l). These data suggest that Ttdn1Δ/Δ mice recapitulate certain aspects of the molecular pathology seen in NP-TTD. It is possible that Ttdn1 in the mouse is not as critical for lariat and RNA processing as its human counterpart, given the lesser degree of RNA lariat increase in the Ttdn1Δ/Δ mice compared to the human TTDN1 KO cells.
Behavioral Assessment of Ttdn1Δ/Δ Mice
To further characterize their phenotypes, Ttdn1Δ/Δ mice and Ttdn1+/+ controls from two different cohorts were evaluated on several behavioral tasks including a 1-hour locomotor activity test, a marble-burying test, and a battery of sensorimotor measures (walking initiation, ledge platform; pole, 60° and 90° inclined screens, inverted screens). Except for a modest, but significant reduction in distance traveled in the peripheral zone, Ttdn1Δ/Δ and control mice were not significantly different on variables related to locomotor activity (Figure 4f and Supplemental Figures S5a–c). Many NP-TTD patients have autistic-like behaviors, thus mice were also evaluated on the marble-burying test, an often-used measure for assessing models of autism51. However, Ttdn1Δ/Δ and control groups did not differ in terms of compulsive digging, as measured by the number of marbles buried during the test (Supplemental Figure S5d). Out of the total seven measures within the sensorimotor battery, a significant genotype effect was found for only the walking initiation test in terms of the time taken to move out of a small circumscribed area, suggesting fear of moving in an open, novel environment or a slowed motor response in Ttdn1Δ/Δ mice (Figure 4g, Supplemental Table 3). Fine-motor coordination was assessed using the rotarod test. Significant performance deficits were found in the Ttdn1Δ/Δ mice for the time they were able to remain on the accelerating rotarod (Figure 4h), but not for the stationary or constant speed components of the rotarod procedure (Supplemental Figures S5e–f). Together, these data suggest that while loss of Ttdn1 contributes to defects in fine-motor coordination, several basic sensorimotor functions are largely unaffected.
Spatial learning and memory capabilities were assessed next using the Morris Water Maze (MWM), followed by an evaluation of associative memory performance using a Pavlovian fear conditioning procedure. While there were no significant deficits in spatial learning and memory in the Ttdn1Δ/Δ mice (Supplemental Figures S5g–j), we observed significantly reduced swimming speeds in the Ttdn1Δ/Δ mice during the cued and place trials (Figure 4i–j), suggesting impaired coordination and/or motivational disturbances. Analysis of the conditioned fear data showed that the Ttdn1Δ/Δ mice exhibited significantly reduced freezing levels on the auditory cue component (day 3) of the procedure (Figure 4k and Supplemental Figures S5k–l). Importantly, no significant differences between knockout and control mice were found in freezing levels during the following: baseline or tone-shock training (day 1); the contextual fear test (day 2); altered context baseline (day 3); or shock sensitivity. Moreover, no significant effects were observed on measures of acoustic startle or pre-pulse inhibition (only tested in cohort 2; Supplemental Figures S5m–o). We conclude that the deficit in auditory cue conditioning exhibited by Ttdn1Δ/Δ mice is a selective cognitive impairment not likely due to deafness or extreme auditory deficits. Altogether, our results suggest that the Ttdn1Δ/Δ mice likely have impaired fine motor coordination and/or motivational disturbances, as well as specific fear (auditory cue) conditioning deficits.
U2 snRNP inhibition mirrors TTDN1/DBR1 loss in altering length-dependent gene expression
Determining a more unified basis for how NP-TTD shares molecular pathology with photosensitive TTD has remained obscure due to the genetic heterogeneity of the disease. TFIIEβ52, aminoacyl-tRNA synthetases53–55, and the spliceosomal protein RNF113A38–40 are linked to NP-TTD. We reasoned that the molecular defect caused by loss of RNF113A and TTDN1 may be due to a common spliceosomal defect; indeed, RNF113A joins the activated spliceosome just prior to the first transesterification step in splicing56. Therefore, we reasoned that early inhibition of the spliceosome may result in similar length-dependent gene expression changes. We tested the effect the spliceosome inhibitor pladienolide-B (Pla-B), which inhibits the U2-associated SF3B complex57, on gene expression and RNA processing in WT and TTDN1 KO cells. We first assessed RNA lariat accumulation and found that Pla-B treatment does impact lariat levels at steady state (Figure 5a). However, Pla-B treatment led to similar length-dependent gene expression change as TTDN1/DBR1 loss, increasing the expression of shorter genes and negatively affecting longer ones (Figure 5b and Supplemental Figure S6a). This effect of Pla-B was also observed in TTDN1 KO cells (Supplemental Figure S6b–c), although we noted a significantly stronger impact of Pla-B on control cells versus those deficient for TTDN1 (i.e., a greater number of transcripts were affected by Pla-B in WT cells; compare Figure 5c–d). Indeed, there was a significant overlap between genes downregulated in untreated TTDN1 KO cells versus Pla-B treated control cells (Figure 5e), indicating that SF3B inhibition is at least partially epistatic with TTDN1 loss. We also tested whether loss of another spliceosomal factor, PRP43, similarly affected expression of specific target genes impacted by TTDN1 loss, but this was not the case (Supplemental Figure S6d–e).
Why would TTDN1 deficiency partially mirror an early spliceosomal defect? Because of the interaction between TTDN1 and the IBC, and the significant increase in lariats upon loss of TTDN1, we considered the possibility that lariats may accumulate on the IBC in TTDN1 knockout cells. Therefore, we immunoprecipitated Flag-AQR in control and TTDN1 KO cells and performed RT-PCR on select lariats. Lariats were readily demonstrable in association with AQR in TTDN1 KO cells, but were barely detectable in controls (Supplemental Figure S6f–g). The presence of these lariats in association with AQR could potentially reduce the amount of functional IBC, which associates with U2. Inhibition of U2 with Pla-B impacts RNAP II function by impacting pause-release17. To determine whether TTDN1 loss similarly impacted RNAP II activity we performed PRO-Seq (precision run-on sequencing). This technique uses biotin-labeled nucleoside triphosphates as substrates in nuclear run-on reaction, and sequencing the 3’ end of the transcript identifies the last incorporated NTP, providing base pair resolution of the last NTP58. When surveying the whole transcriptome with PRO-Seq, we observed little appreciable change in the overall nascent activity of RNAP II (Figure 5f). However, when focusing only on genes that were differentially downregulated or upregulated in parallel RNA-Seq experiments, we found reduced and increased activity of RNAP II, respectively, throughout the gene body, when comparing WT and TTDN1 KO cells (Figure 5g–h). This indicates that RNAP II activity, in particular initiation, may explain the gene expression changes seen upon loss of TTDN1. Indeed, a significant overlap was observed between PRO-Seq signal changes and differential gene expression by RNA-Seq (Figure 5i).
The TTDN1 N-terminal IDR is critical for its function
Because TTDN1 associates with the IBC through its N-terminal IDR, we tested whether this domain was important for its function. We targeted the human TTDN1 locus in U2OS cells using CRISPR/Cas9 and substituted its exon 1 with the N-terminal aromatics mutant (TTDN1φ→Ala). Although we were only able to obtain hemizygous TTDN1φ→Ala/Δ clones, TTDN1 protein levels in two independent clones were similar to the WT counterpart (Figure 6a). We evaluated RNA lariat accumulation, which demonstrated significant elevation of these RNA species in both IDR knock-in clones compared to control cells (Figure 6b). We observed a similar length-associated gene expression change in the TTDN1φ→Ala/Δ cell line as observed with the TTDN1 KO cells (Figures 6c–e). Quantitative RT-PCR confirmed these expression changes for the knock-in clones for both longer and shorter genes (Supplemental Figure S7a–b). Reduction of TTDN1 protein levels to <50% of WT levels resulted in very modest gene expression changes as determined by qRT-PCR (Supplemental Figure S7c–d), arguing against a simple dosage effect in the TTDN1φ→Ala/Δ clones. Using one of the TTDN1φ→Ala/Δ cell lines, we also evaluated nascent RNA transcription using PRO-Seq. Similar to the TTDN1 KO cells, we found reduced and increased activity of RNAP II across the gene body of genes that were downregulated or upregulated, respectively, in the TTDN1φ→Ala/Δ cell line (Figure 6f–h). Again, there was a significant overlap between PRO-Seq and genes differentially expressed as determined by RNA-Seq, tying the TTDN1 IDR domain to RNAP II activity (Figure 6i). Thus the aromatic residues in the TTDN1 IDR, which interact with the IBC, are critical for its function.
Figure 6. The TTDN1 IDR is critical for its function.
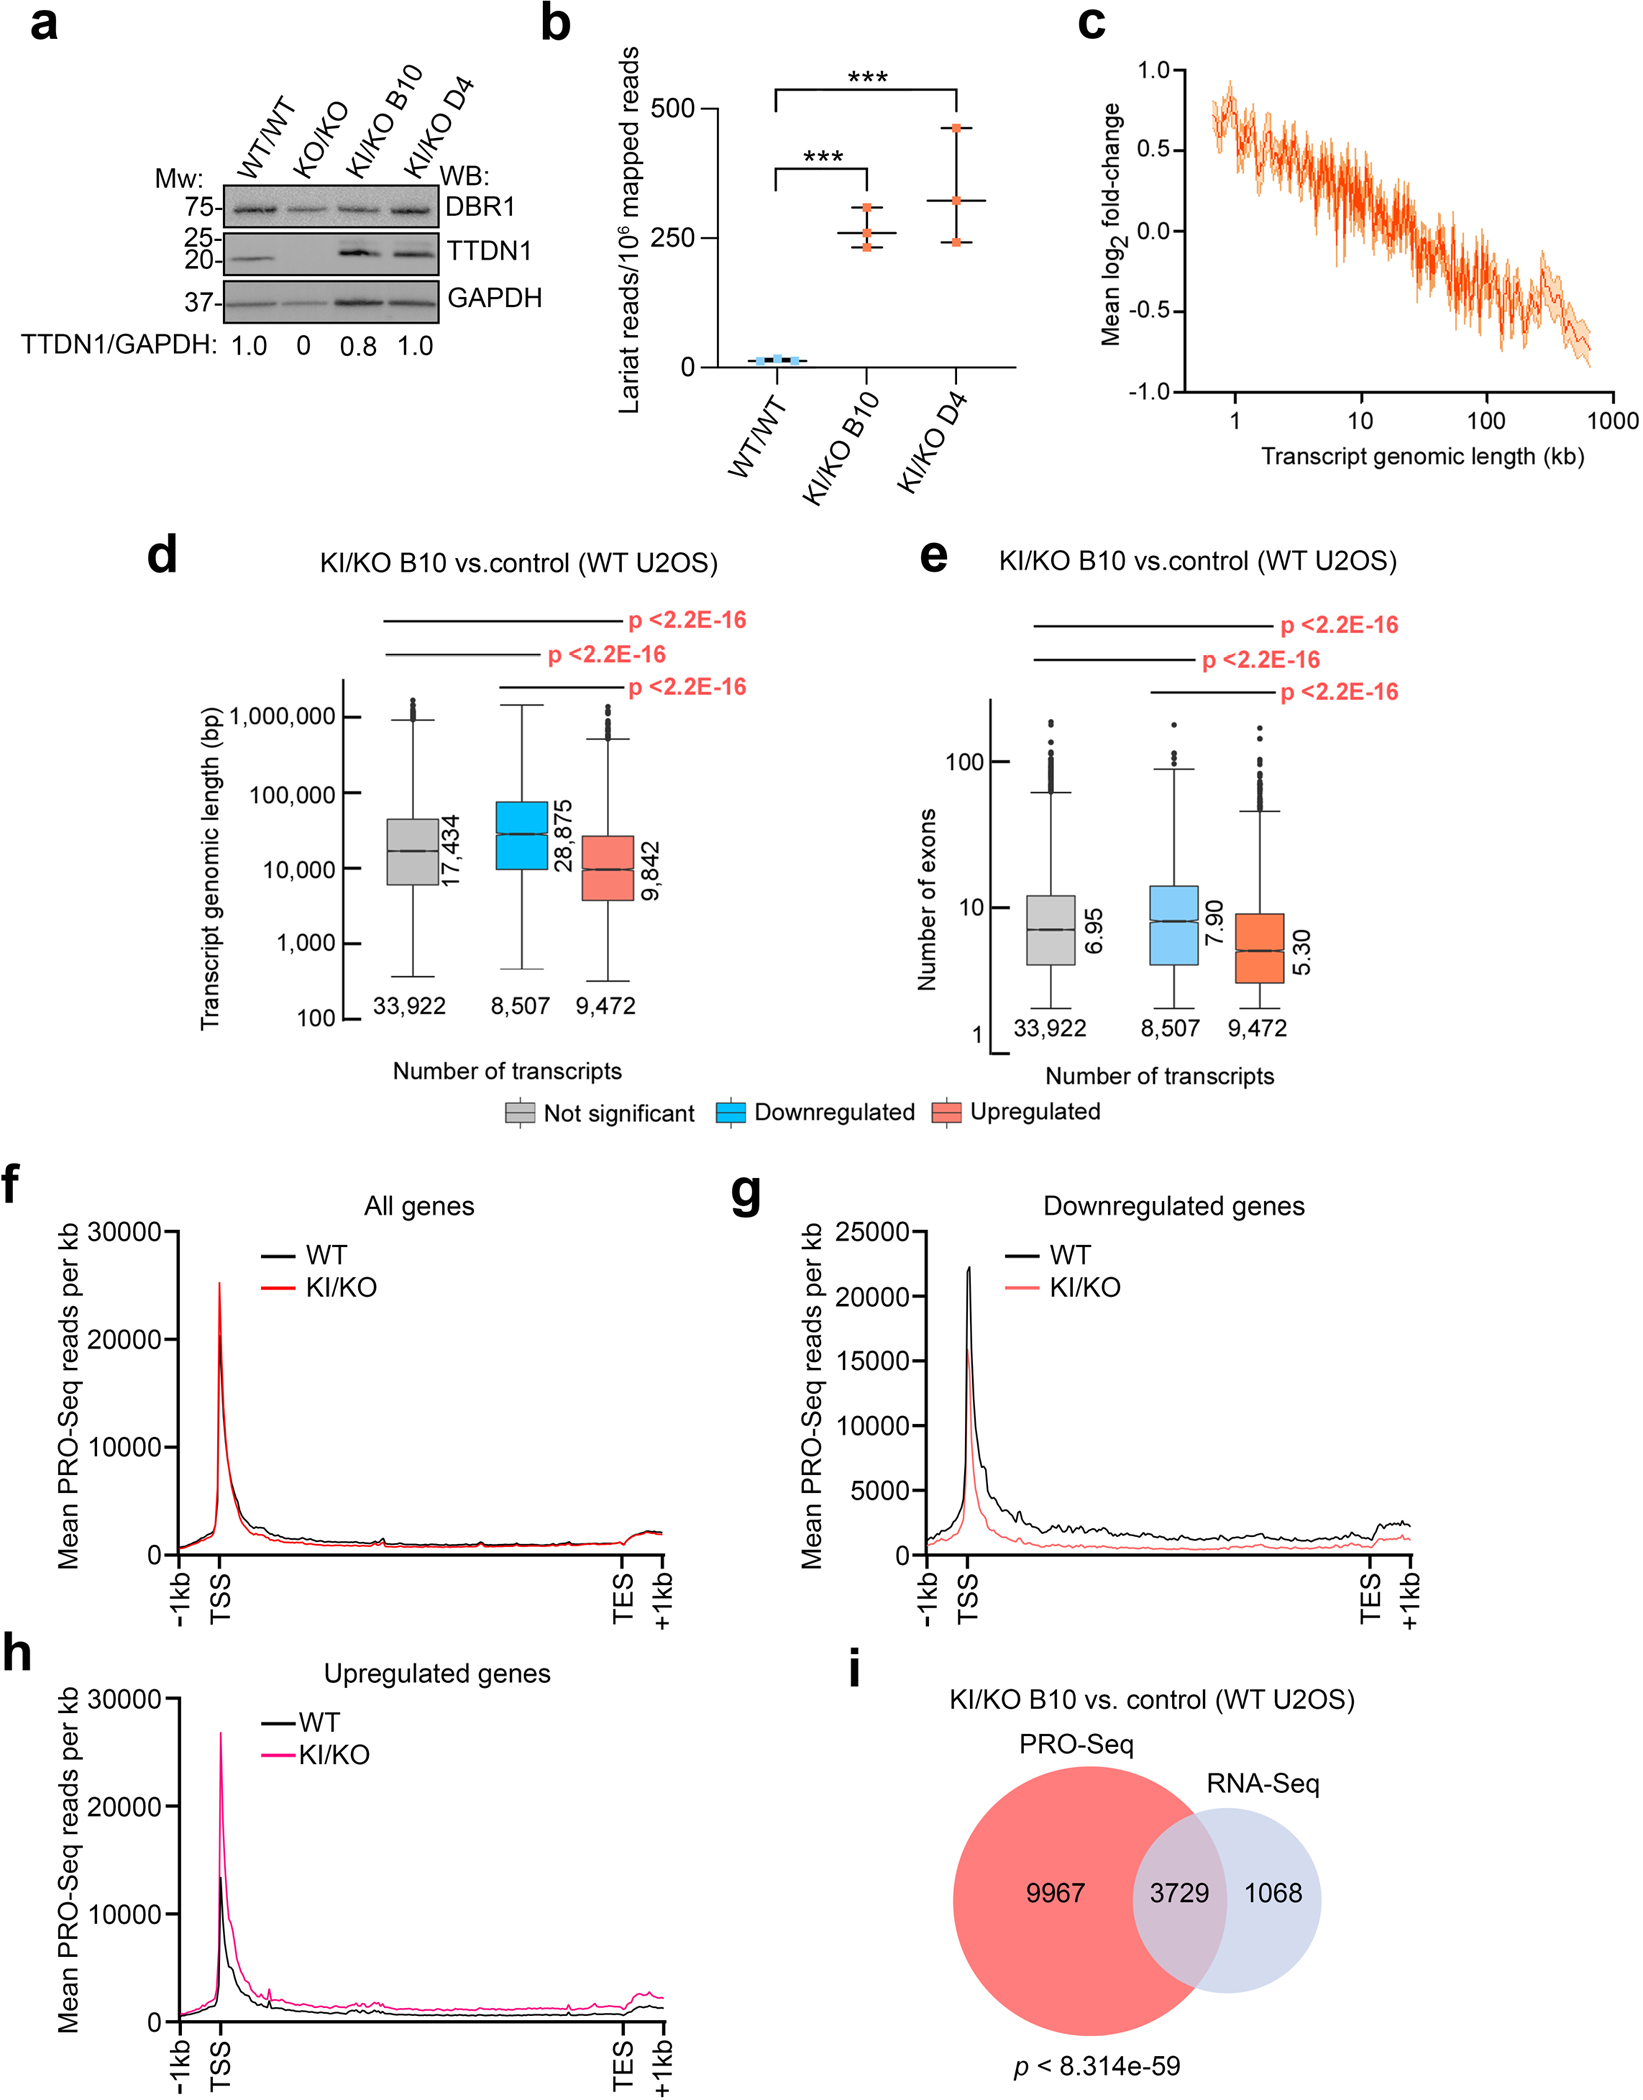
(a) Protein levels in TTDN1φ→Ala/Δ (KI/KO) U2OS cells were compared to control and TTDN1 KO by western blot. Normalized TTDN1/GAPDH band intensities are shown below. (b) Stable lariat species were quantified using a branchpoint identification algorithm in cell lines from (a); *** p<0.001 by unpaired t-test. (c) Relationship between transcript genomic length and changes in expression (log2 fold-changes) comparing control U2OS and KI/KO cells. (d) Box plots of transcript genomic length of differentially expressed (<−0.585 or >0.585 log2 fold-change for downregulated and upregulated, respectively) and not differentially expressed transcripts from control and KI/KO U2OS cells. p values were determined by Wilcoxon rank-sum tests. (e) Box plots of mean exon number of differentially expressed and not differentially expressed genes using the same RNA-Seq data from (d). p values were determined by Wilcoxon rank-sum tests. (f) PRO-Seq analysis was performed in control and KI/KO U2OS cells. Metagene plot is shown, demonstrating the relationship between average PRO-Seq signal and position on gene body for all genes (TSS, transcription start site; TES, transcription end site). (g) and (h) PRO-Seq metagene analysis of downregulated (g) and upregulated (h) genes (defined as in Figure 5g–h) using parallel RNA-Seq samples in control and KI/KO cells. (i) Venn diagram showing the overlap between DEGs (at least +/−0.585 log2 fold-change) and genome-wide PRO-Seq signal changes comparing control and KI/KO cells. p value was determined by one-sided Fisher’s exact test. All RNA-Seq and PRO-Seq experiments were performed in triplicate.
A DBR1TTDN1-NTD fusion promotes IBC interaction, lariat processing, and partially rescues length-dependent gene expression
We wished to find additional evidence that the function of the TTDN1 IDR, in relation to linking DBR1 to the IBC, is critical for lariat processing and gene expression. To determine whether restoring DBR1 association with the IBC would be sufficient to rescue these phenotypes, we generated a fusion of the N-terminal IDR of TTDN1 with the C-terminus of DBR1 (DBR1TTDN1-NTD) (Figure 7a). We reasoned that this would at least partially bypass the requirement for TTDN1. This fusion protein was indeed capable of interacting with IBC components (Figure 7b). RNA-seq analysis revealed that it also rescued lariat levels in the TTDN1 KO cells to that of WT controls (Figure 7c). Finally, we profiled gene expression in TTDN1 KO cells expressing DBR1TTDN1-NTD and found that expression of the fusion protein partially rescued gene length-dependent phenotypes (Figures 7d–g and Supplemental Figures S7e–f). Specifically, the inverse correlation between gene length and gene expression changes was reduced (Figures 7d–e). The number of long genes that were downregulated was also reduced, as were the number of upregulated short genes (Figure 7f–g and Supplemental Figures S7e–f). Together, these data strongly support the model that the primary function of TTDN1 may to serve as a link, both functionally and physically, between DBR1 and the IBC in order to promote efficient lariat processing, which in turn affects gene expression.
Figure 7. Tethering DBR1 to the IBC partially rescues TTDN1 deficiency.

(a) A fusion of DBR1 to the TTDN1 IDR is predicted to bind the IBC, bypassing the requirement for TTDN1. (b) The indicated Flag vectors were expressed in control or TTDN1 KO HeLa-S cells. Following Flag immunoprecipitation, input and IP material was western blotted with the antibodies as shown. (c) Stable lariat species were quantified using a branchpoint identification algorithm in cell lines from (b); *** p<0.001, **** p<0.0001 by unpaired t-test. (d) and (e) Relationship between transcript genomic length and changes in expression (log2 fold-changes) in the indicated cell lines. (f-g) Box plots of transcript genomic length of differentially expressed (<−0.585 or >0.585 log2 fold-change for downregulated and upregulated, respectively) and not differentially expressed transcripts comparing the indicated cell lines. All experiments were performed in triplicate.
Discussion
Here we identify TTDN1 as a molecule involved in RNA processing, and determine its role in lariat biology and gene expression. We find that the highly conserved TTDN1 C-terminus functions to bind DBR1, whereas aromatic residues within the N-terminal IDR mediate interactions with the IBC. In the absence of TTDN1, the association of DBR1 with the IBC in cells is lost, and that the resulting lariat accumulation coincides with splicing disruption and defects in gene expression. We observe reduced expression of long genes in particular, which may be a consequence of high intronic burden; how expression of shorter genes is increased is less clear, although this is observed in other models of TC-NER deficiency47. Our PRO-Seq data indicates that these expression changes upon loss of TTDN1 are at least partially due to alterations in transcriptional initiation. Our NP-TTD mouse model recapitulates aspects of the developmental and neurological defects seen in patients with TTDN1 deficiency. That expression of a DBR1TTDN1-NTD fusion in TTDN1 KO cells partially rescues defects associated with TTDN1 loss strengthens the idea that increased coordination between DBR1 and the IBC promotes nascent lariat debranching by DBR1, promoting proper splicing.
TTDN1-mutated patients are non-photosensitive and NER proficient35,51, as are patients with mutations in TFIIEβ33,52, RNF113A38,40, aminoacyl-tRNA synthetases (aaRS)53–55. However, non-photosensitive cases retain the neurological and developmental phenotypes seen in photosensitive patients. While TFIIEβ has roles in transcription initiation, RNF113A functions in RNA splicing and recruitment of the ASCC complex, which in turn may affect nascent transcription37,59. Although seemingly diverse, this heterogeneity may at least partially converge on gene expression, which has led to the hypothesis that the hallmark features of TTD are a consequence of altered gene expression and protein instability, although these explanations do not satisfy the seemingly specific phenotypes in TTD, such as brittle, sulfur deficient hair54. Here, we show that TTDN1 affects the lariat processing activity of DBR1 in vivo, which suggests NP-TTD cases can arise from indirect consequences of aberrant splicing culminating in altered nascent transcription and aberrant length-dependent gene expression.
Intron lariat formation begins during the first transesterification reaction downstream of spliceosome assembly and catalytic activation. During the first transesterification step, the phosphodiester bond of the 5’ splice site undergoes nucleophilic attack by the 2’OH group of a bulged branch adenosine. This releases the 5’ exon and results in a 2’−5’ phosphodiester linkage between the 5’ splice site and branch adenosine. The second transesterification step results in exon ligation and intron lariat release after the 3’OH of the released 5’ exon attacks the phosphodiester bond of the 3’ splice site60,61. The released lariat intron is contained within the intron lariat complex (ILC)62, containing U2, U5, and U6 snRNPs, along with several splicing factors. The ATP-dependent DExH box RNA helicase hPrp43 is subsequently recruited and disassembles the ILC to allow DBR1 debranching activity to linearize the intron lariat62. In Saccharomyces cerevisiae, DBR1 is not essential for viability, and despite increased lariat intron RNAs, there is little growth defect63. In contrast, the Schizosaccharomyces pombe dbr1null mutant has overt growth defects that coincide with cellular elongation and increased lariat intron RNAs64. That introns occupy 95% of protein-coding transcripts in humans may explain why DBR1 is essential65–67. Thus, while DBR1 is evolutionarily well-conserved, the increasing consequences of DBR1 deficiency correlate with increased intronic burden, and therefore a higher demand for intron turnover.
Yet, it is likely that toxicity associated with DBR1 deficiency is multifaceted. One report suggests that reduced DBR1 in humans coincides with intron lariat accumulation concurrent with retention of snRNPs in IL complexes29, yet further evidence of this is lacking. Our data here suggests an alternative model, albeit one which is not mutually exclusive: at least some of the accumulated lariats associate with AQR/IBC complex, and perhaps the IBC is not able to perform its function in a subsequent cycle of splicing. In addition, the role of DBR1 in debranching intron lariats has been connected with the release and processing of various non-canonical regulatory microRNAs27,68 and intronic small nucleolar RNAs (snoRNAs), which function in modification of ribosomal RNAs28. snoRNA deficiency is associated with the production of unmodified rRNAs and reduced ribosome processivity. However, while loss of TTDN1 does not appear to affect all functions of DBR1, such as snoRNA levels, the degree to which lariat accumulation occurs in the absence of TTDN1 is less than that of DBR1. This correlates with the degree of gene expression changes we observe upon loss of TTDN1 versus DBR1.
Why is TTDN1 required to tether DBR1 and the IBC? The TTDN1 N-terminus has several putative phosphorylation sites, and previous studies indicate that TTDN1 interacts with the Polo-like Kinase 1 (Plk1) and Cdk1 in a phosphorylation-dependent manner during mitosis69. Thus, TTDN1 phosphorylation may regulate its interactions with DBR1 or the IBC; indeed, TTDN1 phosphorylation is cell cycle regulated and is significantly increased in G2/M phase69. The fact that our DBR1TTDN1-IDR fusion does not fully rescue the gene expression defects seen in TTDN1 deficiency may be due to the need to regulate the interactions between these factors. While DBR1 and IBC members have homologs in S. pombe, no apparent TTDN1 functional homologs have been described outside of metazoans. Increased intronic burden is a well-characterized phenomenon that coincides with the evolution of higher eukaryotes. Therefore, coordinating lariat processing and intron splicing by TTDN1 may represent an adaptive strategy to regulate genomic demands seen in multicellular eukaryotes70,71.
Our mouse model of TTDN1 deficiency recapitulates certain features of the neurodevelopmental phenotypes associated with NP-TTD. Patients with this syndrome have varying degrees of intellectual impairment and many, although certainly not all, demonstrate autistic-like behaviors34. The Ttdn1Δ/Δ mice have significantly smaller brain weights, but this is only observed in males; why this phenotype is sex-specific is not clear. They also have significantly reduced swimming speeds in the cued and place trials of the Morris Water Maze test, which may be due to reduced motivation or coordination. An impaired response to auditory conditioning was also observed in the knockout mice, as well as poorer performance on the accelerating rotarod test, suggesting selective cognitive impairment and fine motor coordination deficits, respectively, both of which are observed in NP-TTD. However a battery of other behavioral analysis were normal in these mice. It is certainly possible that TTDN1 in humans is more important for DBR1 function than in the mouse, which could be why there is a greater lariat increase in our human TTDN1 KO cells than in the mouse model.
Limitations of study
While we provide evidence that TTDN1 associates with the intron binding complex as well as DBR1, how this promotes lariat processing is not clear. Although we favor a model where TTDN1 brings DBR1 to the IBC to promote lariat processing, it remains possible that TTDN1 functions to directly promote DBR1 debranching activity. In addition, the mechanistic basis of how loss of either TTDN1 or DBR1 leads to transcriptional alterations in a length-dependent manner is not yet clear. In a related question, whether lariat accumulation is itself potentially toxic to the splicing or transcriptional machineries is unknown. Future studies will test implications of the role of TTDN1 to tether DBR1 and the IBC and further elucidate these mechanistic questions and their connections to TTD pathology.
STAR Methods
RESOURCE AVAILABILITY
Lead Contact
Further information and requests for resources and reagents should be directed to and will be fulfilled by the Lead Contact, Nima Mosammaparast (nima@wustl.edu).
Materials Availability
All reagents generated in this study are available from the Lead Contact without restriction.
Data and Code availability
RNA-seq (including PRO-seq) data has been deposited at GEO and are publicly available as of the date of publication. Proteomics data has been deposite at PRIDE and are publicly available as of the date of publication. The accession numbers are listed in the key resources table. All other data generated in this study have been deposited at Mendeley and are publicly available as of the date of publication. The DOI is listed in the key resources table.
All original code has been deposited at Zenodo and is publicly available as of the date of publication. DOIs are listed in the key resources table.
Any additional information required to reanalyze the data reported in this paper is available from the lead contact upon reasonable request.
| REAGENT or RESOURCE | SOURCE | IDENTIFIER |
|---|---|---|
| Antibodies | ||
| TTDN1 (Rabbit) | Novus | CAT#NBP2-31718 |
| DBR1 (Rabbit) | Invitrogen | CAT#PA5-57244; RRID:AB_2640394 |
| GAPDH (Rabbit) | Abcam | CAT#ab9485; RRID:AB_307275 |
| Flag (Rabbit) | Sigma | CAT#F7425; RRID:AB_439687 |
| HA (Mouse) | BioLegend | CAT#901501; RRID:AB_2565006 |
| AQR (Rabbit) | Bethyl Labs | CAT#A302-546A; RRID:AB_1998969 |
| XAB2 (Rabbit) | Bethyl Labs | CAT#A303-638A; RRID:AB_11205112 |
| ZNF830 (Rabbit) | Bethyl Labs | CAT#A301-419A; RRID:AB_960966 |
| PRP8 (Rabbit) | Bethyl | CAT#A303-922A; RRID:AB_2620271 |
| PRP19 (Rabbit) | Sigma | CAT#SAB4501215; RRID:AB_10745273 |
| PRP43 (Rabbit) | Abcam | CAT#ab254591 RRID:AB_2892059 |
| SF3A1 (Rabbit) | Bethyl Labs | CAT#A301-601A; RRID:AB_1078817 |
| IgG (Rabbit) | Santa Cruz | CAT#sc-2027; RRID:AB_737197 |
| Chemicals, peptides, recombinant proteins | ||
| GST | (Soll et al., 2018) | N/A |
| GST-TTDN1 | This study | N/A |
| GST-TTDN1-Aro>Ala | This study | N/A |
| GST-ASCC1 | (Soll et al., 2018) | N/A |
| Flag-MBP-TTDN1-mCherry | This study | N/A |
| Flag-MBP-TTDN1-Aro>Ala-mCherry | This study | N/A |
| mCherry | Biovision | 4993 |
| His-prp-DBR1-GFP | This study | N/A |
| His-Flag-DBR1 | This study | N/A |
| His-AQR | This study | N/A |
| Recombinant intron binding complex (IBC) | This study | N/A |
| Murine Rnase Inhibitor | NEB | M0314L |
| Rnase-free Dnase | Qiagen | 79256 |
| Flag peptide | Sigma | F3290 |
| Anti-Flag M2 agarose beads | Sigma | A2220 |
| Anti-HA agarose beads | Santa Cruz | sc-7392 AC |
| Anti-mCherry Nanobody Affinity Gel | Biolegend | 689502 |
| Pladienolide-B | Cayman Chemical Company | 16538 |
| Puromycin | Sigma | P8833 |
| Blasticidin S | Sigma | 15205 |
| Protease & phosphatase inhibitor cocktail | Thermo Fisher Scientific | A32961 |
| Ni-NTA beads | Qiagen | 88221 |
| Hoechst 33342 | BD Bioscience | 561908 |
| ProLong Gold | Invitrogen | P36930 |
| Critical Commercial Assays | ||
| miRNeasy mini kit | Qiagen | 217004 |
| High capacity cDNA synthesis kit | Thermo Fisher Scientific | 4368814 |
| SYBR Green JumpStart Taq Ready Mix | Sigma | S9194 |
| SuperScript VILO cDNA synthesis kit | Thermo Fisher Scientific | 11754050 |
| DreamTaq Green PCR Master Mix | Thermo Fisher Scientific | KK1081 |
| Deposited Data | ||
| RNA sequencing data | This paper | GEO (Accession: GSE233383) |
| Proteomics data | This paper | PRIDE (Accession: PXD042563, PXD042580, PXD042581) |
| Source images and original blots | This paper | Mendeley (DOI: 10.17632/prgb7kwjz8.1) |
| Experimental models: Cell lines | ||
| 293T | ATCC | N/A |
| HeLa-S | ATCC | N/A |
| U2OS | ATCC | N/A |
| U2OS TTDN1 KO | This study | N/A |
| HeLa-S TTDN1 KO | This study | N/A |
| U2OS WT/WT | This study | N/A |
| U2OS Ala/KO | This study | N/A |
| HeLa-S DBR1 KO | This study | N/A |
| Fibroblast: Male TTDN1 2BP DEL, 187GG | Coriell Institute for Medical Research | GM06331 |
| Fibroblast: Female TTDN1 2BP DEL, 187GG | Coriell Institute for Medical Research | GM06332 |
| Fibroblast: Female TTDN1 2BP DEL, 187GG | Coriell Institute for Medical Research | GM06333 |
| Fibroblast: Female unaffected | Coriell Institute for Medical Research | GM016648 |
| Fibroblast: male unaffected | Coriell Institute for Medical Research | GM016650 |
| Experimental models: Mouse | ||
| Ttdn1 Δ/Δ | This Study | N/A |
| Ttdn1 M143V/M143V | This Study | N/A |
| Oligonucleotides | ||
| POU6F2 (forward): 5’-CAAGCATCCATGTCTCAAAGTC-3’ | IDT | N/A |
| POU6F2 (reverse): 5’-ATTAACCCCATCCACCTCAC-3’ | IDT | N/A |
| TLL1 (forward): 5’-AAAGAAGTGATGAAGAGAGTTACATTG-3’ | IDT | N/A |
| TLL1 (reverse): 5’-GCCGATAGAGATTGCCTGAG-3’ | IDT | N/A |
| BCR (forward): 5’-AATGGCTGAGAAGTGCTGT-3’ | IDT | N/A |
| BCR (reverse): 5’-CTTGTAGAGCAGAGTTTCCAGAG-3’ | IDT | N/A |
| DHRS2 (forward): 5’-TGAGACCATCACCAAGCG-3’ | IDT | N/A |
| DHRS2 (reverse): 5’-TCACAGAAAGCCTAGCACAG-3’ | IDT | N/A |
| MLPH (forward): 5’-CGGAAGTGCCAAGGTCATC-3’ | IDT | N/A |
| MLPH (reverse): 5’-GTTCTCCATCCTCATCTGTCTG-3’ | IDT | N/A |
| SRGN (forward): 5’-GAAGCTACTCAAATGCAGTCG-3’ | IDT | N/A |
| SRGN (reverse): 5’-ACCCATTGGTACCTGGCT-3’ | IDT | N/A |
| STMN2 (forward): 5’-CCACGAACTTTAGCTTCTCCA-3’ | IDT | N/A |
| STMN2 (reverse): 5’-GCCAATTGTTTCAGCACCTG-3’ | IDT | N/A |
| β-actin (forward): 5’-CCAACCGCGAGAAGATGA-3’ | IDT | N/A |
| β-actin (reverse): 5’-CCAGAGGCGTACAGGGATAG-3’ | IDT | N/A |
| UBA1–1st run (forward): 5’-GGCTTCCCCACTTCCAG-3’ | IDT | N/A |
| UBA1–1st run (reverse): 5’-GAAGTGAGGGAGGGAGG-3’ | IDT | N/A |
| UBA1–2nd run (forward): 5’- CTGTGCGCCTTGTACTT-3’ | IDT | N/A |
| UBA1–2nd run (reverse): 5’-TCTTACACTTAGGCATGCAAC-3’ | IDT | N/A |
| RPL29–1st run (forward): 5’- GGTATTTCCACATTTGAGGTTG-3’ | IDT | N/A |
| RPL29–1st run (reverse): 5’-AGGAATTGCAGGCTTTGG-3’ | IDT | N/A |
| RPL29–2nd run (forward): 5’-ATGCTGTCTTTAGAATGCTGG-3’ | IDT | N/A |
| RPL29–2nd run (reverse): 5’-GCCAGTTAGGCTGTGC-3’ | IDT | N/A |
| Recombinant DNA | ||
| pET-28a-Flag-DBR1 | This study | N/A |
| pFastBac-GST-TTDN1 | This study | N/A |
| pGEX-ASCC1 | (Soll et al., 2018) | N/A |
| pGEX-TTDN1 | This study | N/A |
| pGEX-TTDN1-Aro>Ala | This study | N/A |
| MacroBac438-Flag-MBP-TTDN1-mCherry | This study | N/A |
| MacroBac438-Flag-MBP-TTDN1-Aro>Ala-mCherry | This study | N/A |
| His-prp-DBR1-GFP | This study | N/A |
| His-AQR | This study | N/A |
| pHAGE-3xHA-GFP | This study | N/A |
| pHAGE-3xHA-TTDN1 | This study | N/A |
| pHAGE-Flag-TTDN1 | This study | N/A |
| pHAGE-Flag-TTDN1 NΔ20 | This study | N/A |
| pHAGE-Flag-TTDN1 NΔ60 | This study | N/A |
| pHAGE-Flag-TTDN1 CR1–2 | This study | N/A |
| pHAGE-Flag-TTDN1 ΔCR1–2 | This study | N/A |
| pHAGE-Flag-TTDN1 ΔCR2 | This study | N/A |
| pHAGE-Flag-TTDN1 E135K, E137K | This study | N/A |
| pHAGE-Flag-TTDN1 K141E | This study | N/A |
| pHAGE-Flag-TTDN1 E146K, D147K | This study | N/A |
| pHAGE-Flag-TTDN1 E153K | This study | N/A |
| pMSCV-Flag-HA-DBR1 | This study | N/A |
| pMSCV-Flag-HA-TTDN1 | This study | N/A |
| pHAGE-Flag-TTDN1 Aro>Ala | This study | N/A |
| pHAGE-Flag-DBR1-TTDN1 IDR | This study | N/A |
| pHAGE-Flag-AQR | This study | N/A |
| pLentiCRISPR-V2 -TTDN1 | This study | N/A |
| pLentiCRISPR-V2 -DBR1 | This study | N/A |
| pLentiCRISPR-V2 -NTC | Tsao et al., 2021 | N/A |
| Software and algorithms | ||
| ImageLab | BioRad | N/A |
| ImageJ | https://imagej.nih.gov | N/A |
| rMATS turbo v4.1.1 | https://zenodo.org/badge/latestdoi/644252407 | N/A |
| Gene length | https://zenodo.org/record/7947667 | N/A |
| Branchpoint detection algorithm | Pineda et al., 2018 | N/A |
| Photoshop | Adobe | N/A |
| GraphPad Prism | N/A | N/A |
| Stereo Investigator Software | Version 2020.2.3, MBF Bioscience, Williston, VT | N/A |
| Sequest software | Eng et al., 1994 | N/A |
EXPERIMENTAL MODEL AND STUDY PARTICIPANT DETAILS
Cell culture
Human cell lines (293T, HeLa-S, and U2OS; all originally from ATCC) were cultured in Dulbecco’s modified eagle medium (Invitrogen), supplemented with 10% fetal bovine serum (FBS; Sigma or Cytiva), 100 U/ml of penicillin-streptomycin (Gibco) at 37°C and 5% CO2. Unaffected control and NP-TTD patient fibroblast cell lines (obtained from the Coriell Institute for Medical Research) were maintained in Eagle’s Minimum Essential Medium with Earle’s salts and non-essential amino acids supplemented with 15% FBS and 1% penicillin-streptomycin.
Mice
C57BL/6 mice were bred and maintained in our animal facility according to institutional guidelines and with protocols approved by the Animal Studies Committee of Washington University in St. Louis. The sex and age of the mice used for each experiment are noted in the figure legends.
METHOD DETAILS
Plasmids
For mammalian cell expression, human TTDN1 or DBR1 were isolated by PCR from human cDNA, cloned into pENTR-3C (Invitrogen), and subcloned into pMSCV-FLAG-HA, pHAGE-CMV-FLAG, pMSCV (no tag), or pHAGE-CMV-3XHA by Gateway recombination36,72. TTDN1 deletions were created by PCR and cloned as above. TTDN1 point mutations and the DBR1TTDN1-NTD fusion were synthesized as gBlocks (IDT) using codon sequences optimal for human cell expression, and cloned into pENTR-3C. For recombinant protein expression in bacteria, cDNAs were subcloned into pET28a-Flag or pGEX-4T1. For expression of AQR, the AQR cDNA was produced as a synthetic gene, codon optimized for insect cell expression, fused to a His-tag at its C-terminus, inserted into the pIDK donor vector, and subsequently fused with an acceptor vector (pFL) using Cre-lox recombination. For expression of other components of the IBC, XAB2 (SYF1) and ISY1 were inserted into pFL whereas the genes encoding PPIE and ZNF830 (CCDC16) were cloned into a donor vector (pSPL). The two constructs were fused using Cre-lox recombination. The AQR and IBC constructs were transformed into DH10MultiBacY cells. For expressing His-GFP-DBR1 or Flag-MBP-TTDN1-mCherry and its derivatives in insect cells, cDNAs were subcloned into MacroBac 438 series vectors73. All constructs derived by PCR or from synthetic gene blocks were verified by Sanger sequencing.
Cell culture and viral transduction
293T, HeLa-S, and U2OS cells (all originally from ATCC) were cultured and maintained as previously described36. Unaffected control and NP-TTD patient fibroblast cell lines were obtained from the Coriell Institute for Medical Research and were maintained in Eagle’s Minimum Essential Medium with Earle’s salts and non-essential amino acids supplemented with 15% FBS and 1% penicillin-streptomycin41. Preparation of viruses, transfection, and viral transduction were performed as described previously36. Knockout experiments (using lentiviral-based CRISPR/Cas9) were performed by infecting cells with the indicated lentivirus and selecting with puromycin (1 μg/ml) for 48–72 hours. For experiments with pladienolide-B, cells were treated with 250 nM of the inhibitor for 24 hours.
CRISPR/Cas9-mediated knockouts
The U2OS TTDN1 KO cells were created using RNP-based CRISPR/Cas9 genome editing at the Genome Engineering and iPSC Center (GEiC) at Washington University, using the gRNA sequence 5’-ACTCCCGTACCCGTCTCGAG-3’. For CRISPR/Cas9 mediated lentiviral knockout of TTDN1 and DBR1 in HeLa-S cells, gRNA sequences were cloned into pLentiCRISPR-V2 (Addgene #52961). The gRNA sequences used to generate the HeLa-S knockouts were: TTDN1, 5’-TGGCTATTATTATTACCTGG-3’; DBR1 5’-AGGCGGCAAACTTCACATGA-3’. For CRISPR/Cas9 substitution of TTDN1 exon 1, the N-terminal aromatics mutant containing 13 alanine subsitutions for the aromatics residues (TTDN1φ→Ala) was cloned into an rAAV donor. The following guide RNAs were used to cleave the endogenous WT exon 1 sequence: 5’-AAATTCTGTCGCTGCATATC-3’ and 5-’ATATGCAGCGACAGAATTTT-3’. All knockout/knock-in clones were verified by deep sequencing and by western blot analysis.
Purification of Flag-HA-TTDN1 and Flag-HA-DBR1 complexes and MS/MS analysis
Affinity purification of TTDN1 and DBR1 were performed as previously described, with minor modifications74. pMSCV-Flag-HA-empty vector, TTDN1 or DBR1 retrovirus was transduced into HeLa-S cells to achieve stable expression of Flag-HA-TTDN1 or DBR1, respectively. Nuclear extract was prepared from the stable cell lines and the TTDN1 or DBR1 complexes were purified using anti-Flag resin (M2; Sigma) in TAP buffer (50 mM Tris-HCl pH 7.9, 100 mM KCl, 5 mM MgCl2, 10% glycerol, 0.1% NP-40, 1 mM DTT, and protease inhibitors). After elution in 1.0 mL TAP buffer plus 0.4 mg/mL Flag peptide (Sigma), the complexes were TCA precipitated, and associated proteins were identified by liquid chromatography-MS/MS at the Taplin Mass Spectrometry Facility (Harvard Medical School) using an LTQ Orbitrap Velos Pro ion-trap mass spectrometer (Thermo Fisher Scientific) and Sequest software72.
Immunoprecipitation and western blotting
Immunoprecipitation of Flag- or HA-tagged proteins was performed by expression of constructs into 293T or HeLa-S cells using Transit293 reagent (Mirus Bio). Cells were collected, washed in 1X PBS, and frozen at −80 °C. Pellets were resuspended in IP lysis buffer (50 mM Tris, pH 7.9, 300 mM NaCl, 10% glycerol, 1% Triton X-100, 1 mM DTT, and protease inhibitors), lysed by sonication, incubated at 4°C with rotation, and spun at 20,000 × g for 30 minutes at 4°C. An equal volume of IP lysis buffer containing no salt was added (final concentration of NaCl was 150 mM). Lysates were then incubated with anti-Flag (M2; Sigma) resin or anti-HA resin (Santa Cruz sc-7392) for 3–4 hrs at 4°C with rotation. The beads were washed extensively with IP lysis buffer containing 150 mM NaCl, and bound material was eluted with 0.4 mg/ml Flag peptide (Sigma) or with Laemmli buffer and analyzed by SDS-PAGE. For DBR1TTDN1-NTD rescue experiments, cells were transduced with the indicated pHAGE-CMV lentiviral vectors. For immunoprecipitation of Flag-tagged GFP and DBR1TTDN1-NTD fusion proteins from HeLa-S cells, virally transduced cells were selected with 5 μg/ml blasticidin for 48–72 hours, then collected, washed in 1X PBS, and frozen at −80 °C. Immunoprecipitation was then performed as above.
Endogenous immunoprecipitation of DBR1 was carried out from 293T cells by collecting and freezing the cells at −80 °C as above75. Cell pellets were resuspended in TAP buffer containing 300 mM KCl, lysed by sonication, and spun at 20,000 × g for 10 minutes at 4°C. IP lysis buffer containing no salt was added to bring the final concentration of KCl to 100 mM. Samples were pre-cleared by incubation with protein A/G beads (Santa Cruz Biotechnology) with rotation at 4°C. After centrifugation, the supernatant was then incubated with equal amounts of control IgG or DBR1 antibodies at 4°C overnight with rotation. Protein A/G beads were then added and rotated at 4°C for 1 hr. The samples were then centrifuged and washed extensively with TAP buffer. Bound material was eluted with Laemmli buffer and analyzed by western blotting.
Size exclusion chromatography
Nuclear extracts from control or TTDN1 KO HeLa-S cells were directly applied to a Superose 6 Increase 10/300 GL column on an AKTA Pure or AKTA go FPLC (Cytiva) equilibrated with TAP buffer. Fractions (1.0 mL each) were collected and concentrated using StrataClean Resin (Agilent). Proteins were then eluted with Laemmli buffer and analyzed by western blotting.
Recombinant protein purification
For recombinant purification of GST-TTDN1, the baculovirus vector was produced using the Bac-to-Bac expression system (ThermoFisher Scientific). Amplified baculovirus was used to infect Sf9 cells and harvested after 72 hours. The cells were lysed by resuspending in Buffer L (20 mM Tris pH 7.3, 150mM NaCl, 8% glycerol, 0.2% NP-40, 0.1% TritonX-100, 2mM β-Mercaptoethanol plus protease inhibitors). Cells were lysed by sonication, then rotated at 4°C for 30 minutes. Extract was cleared by centrifugation, then added to washed Glutathione-Sepharose beads. After rotation 4°C for 2h, beads were extensively washed in Buffer L, and eluted in Buffer L plus 10mM Glutathione for 20min 4°C with rotation. Protein was dialyzed into TAP Wash buffer overnight at 4°C.
Rosetta (DE3) cells expressing His-Flag-DBR1 were resuspended in His-lysis buffer (50 mM Tris-HCl pH 7.3, 250 mM NaCl, 0.05% Triton X-100, 3 mM β–ME, 30 mM imidazole, and protease inhibitors) and lysed by sonication 3x for 30sec at 20% power. Extract was centrifuged at 12,300 × g for 15min 4°C, then supernatant was incubated with Nickel-NTA beads and eluted for 20 minutes at 4°C with 300 μl His-lysis buffer containing 400 mM imidazole. Protein was dialyzed into TAP wash buffer overnight at 4°C.
Sf9 cells expressing Flag-MBP-TTDN1-mCherry and Flag-MBP-TTDN1 Aro>Ala-mCherry were harvested and frozen at −80°C. Pellets were resuspended in MBP Lysis buffer (50mM Tris-HCl pH 7.9, 500mM NaCl, 5% glycerol, 0.5mM DTT, 1mM PMSF, and protease inhibitors). After douncing, the cell extracts were further lysed by sonication on ice at 25% amplitude for 3 minutes (30 seconds on, 30 seconds off) and centrifuged at 12,000 × g for 30 minutes at 4°C. The supernatant was incubated with Hi-Flow amylose resin (NEB) for 1hour at 4°C, then washed extensively in MBP Lysis Buffer. Elution using MBP lysis buffer was performed in the presence of 12.5 μl Precission protease (ThermoFisher, 2U/μl) at room temperature for 1 hour with rotation. Washed glutathione-Sepharose resin (Sigma) were added for 15 minutes to remove remaining Precission protease. For in vitro droplet assays performed in the absence of PEG, TTDN1-mCHerry eluates were concentrated using Amicon Ultra-15 Centrifugal Filters (Millipore). Sf9 cells expressing His-GFP-prp-DBR1 were harvested and frozen at −80°C. Pellets were resuspended in 30 mL Buffer L (50 mM Tris pH 7.3, 500 mM NaCl, 8% glycerol, 0.2% NP-40, 0.1% Triton X-100, 25 mM Imidazole, 1 mM β-Mercaptoethanol). An additional 30 mL Buffer L was added prior to 30 minutes of rotation at 4°C to complete cell lysis. Extract was centrifuged at 12,300 × g for 10 minutes, then supernatant was incubated with Ni-NTA beads and eluted with Buffer L containing 400 mM imidazole. After dialysis into TAP buffer, protein was concentrated using Amicon Ultra-15 Centrifugal Filters (Millipore), and then sample was directly applied to a Superose 6 Increase 10/300 GL column on an AKTA Pure FPLC (Cytiva) equilibrated with TAP buffer. 1 mL fractions were collected and analyzed by Coomassie Blue staining. Peak fractions were kept and stored at −80°C.
For purification of His-tagged AQR, Hi5 insect cells expressing AQR-His were lysed in the lysis buffer (50 mM HEPES-KOH pH 7.5, 200 mM KCl, 10% glycerol, 2 mM 2-mercaptoethanol, and 20 mM imidazole, supplemented with EDTA-free protease inhibitors), followed by sonication. The cell lysate was centrifuged at 17000×g for 60 min at 4°C, and the soluble fraction was loaded onto a Ni-NTA column pre-equilibrated with 50 mM HEPES-KOH pH 7.5, 150 mM KCl, 10 % glycerol, 2 mM 2-mercaptoethanol, and 20 mM imidazole. After washing the unbound proteins, the bound protein was eluted with a linear imidazole gradient of 20–300 mM and analyzed by SDS-PAGE. Peak fractions were added to the HiPrep 26/10 desalting column equilibrated with 50 mM HEPES-KOH pH 7.5, 150 mM KCl, 10% glycerol, and 2 mM DTT. Peaked fractions were added to a Q column equilibrated with the same buffer as the desalting column, and the bound proteins were eluted with a linear gradient of 150 mM to 1 M KCl. Subsequently, the peak fractions were pooled, concentrated to 1 ml, and loaded on a gel filtration column (HiLoad Superdex 200 pg) equilibrated with 20 mM HEPES-KOH pH 7.5, 100 mM KCl, 5 % glycerol, 2mM MgCl2, and 2 mM DTT. The peak fractions were concentrated with centrifugal filters, and purified protein was flash-frozen in liquid nitrogen and stored at −80°C.
For purification of IBC, Hi5 insect cells were co-infected with the AQR-His virus and another expressing hSyf1, CCDC16, Isy1, and PPIE. After three days, the Hi5 cells were collected and lysed in the lysis buffer containing 25 mM HEPES-KOH pH 7.5, 200 mM KCl, 10% glycerol, 2 mM 2-mercaptoethanol, and 20 mM imidazole, supplemented with EDTA-free protease inhibitors, and then sonicated. The cell lysate was centrifuged at 17000×g for 60 min at 4°C, and the supernatant was loaded onto a Ni-NTA column pre-equilibrated with the lysis buffer. The bound proteins were eluted with a linear imidazole gradient of 20 to 300 mM and analyzed by SDS-PAGE. Peak fractions were added to the HiPrep 26/10 desalting column equilibrated with 20 mM HEPES-KOH pH 7.5, 150 mM KCl, 10% glycerol, and 5 mM DTT to remove the imidazole. The peak fractions were then added to a Q column equilibrated with the same buffer as the desalting column, and a linear gradient from 150 mM to 1 M KCl was used to elute the bound proteins. The peak fractions were pooled, concentrated to 2 ml, and loaded on a gel filtration column (HiLoad Superdex 200 pg) equilibrated with 25 mM HEPES-KOH pH 7.5, 150 mM KCl, 5 % glycerol, 2mM MgCl2, and 5 mM DTT. The peak fractions were analyzed by SDS-PAGE and concentrated, flash-frozen in liquid nitrogen, and stored at −80 °C.
In vitro condensate formation assays
Recombinant mCherry (Biovision; #4993), TTDN1-mCherry, TTDN1 Aro>Ala-mCherry, and/or GFP-DBR1 were rapidly thawed at 37°C, then diluted in buffer containing 50 mM Tris-HCl pH 7.9, 5% glycerol, and the indicated NaCl and PEG-8000 concentrations. Samples were mixed by brief vortexing, incubated at room temperature for 10 minutes, and visualized using an Olympus fluorescence microscope (BX-53) using an UPlanS-Apo 100×/1.4 numerical aperture oil immersion lens and cellSens Dimension software.
Protein binding assays
All in vitro GST-protein and Flag binding assays were performed as described previously with minor modifications 76. For testing GST-TTDN1 binding to DBR1, 6 μg of the indicated GST-tagged protein was incubated with 30 μl of blocked glutathione-Sepharose beads and 2 μg of His6-Flag-DBR1 in TAP buffer containing 1% BSA in a total volume of 100 μl. After incubation at 4°C with rotation for 1 hour, beads were washed extensively using TAP buffer, followed by a final wash in 1X PBS. Bound material was eluted using Laemmli buffer and analyzed by SDSPAGE and western blotting. For testing TTDN1 and DBR1 binding to AQR or IBC, the same method was followed using the indicated amount of immobilized protein.
RNA-Seq and data analysis
RNA was purified from cell lines using the Qiagen miRNeasy mini kit to accomodate small RNA isolation (#217004). Samples for small RNA-sequencing were prepped with TruSeq Small RNA library preparations kits; otherwise all other samples were prepared according to library kit manufacturer’s protocol, indexed, pooled, and sequenced on an Illumina NovaSeq 6000 2×150bp with the Genome Technology Access Center at Washington University in St. Louis, typically yielding 200 million paired-end reads per sample.
Total RNA isolation from mouse cortex was carried out as previously described 77. In brief, cerebral cortex was dissected in ice-cold PBS from 5 female Ttdn1Δ/Δ and 5 WT littermates at 8 weeks of age. RNA was purified from cortex using the Qiagen miRNeasy mini kit. Samples were prepared according to library kit manufacturer’s protocol, indexed, pooled, and sequenced on an Illumina NovaSeq 6000 2×150bp with the Genome Technology Access Center at Washington University in St. Louis, typically yielding 200 million paired-end reads per sample.
Basecalls and de-multiplexing were performed with Illumina’s bcl2fastq software and a custom Python demultiplexing program with a maximum of one mismatch in the indexing read. RNA-Seq reads were then aligned to Ensembl GRCh38.76 or Ensembl GRCm38.76 assembly for human or mouse samples, respectively, with STAR version 2.7.9a 78. Gene counts were derived from the number of uniquely aligned unambiguous reads by Subread:featureCount version 2.0.3 79. Isoform expression of known Ensembl transcripts were quantified with Salmon version 1.5.2 80. Sequencing performance was assessed for the total number of aligned reads, total number of uniquely aligned reads, and features detected. The ribosomal fraction, known junction saturation, and read distribution over known gene models were quantified with RSeQC version 4.0 81.
All gene counts were then imported into the R/Bioconductor package EdgeR 82 and TMM normalization size factors were calculated to adjust for samples for differences in library size. Ribosomal genes and genes not expressed in the smallest group size minus one sample greater than one count-per-million were excluded from further analysis. The TMM size factors and the matrix of counts were then imported into the R/Bioconductor package Limma 83. Weighted likelihoods based on the observed mean-variance relationship of every gene and sample were then calculated for all samples and the count matrix was transformed to moderated log 2 counts-per-million with Limma’s voomWithQualityWeights 84,85. The performance of all genes was assessed with plots of the residual standard deviation of every gene to their average log-count with a robustly fitted trend line of the residuals. Differential expression analysis was then performed to analyze for differences between conditions and the results were filtered for only those genes with Benjamini-Hochberg false-discovery rate adjusted p-values less than or equal to 0.05. For each contrast extracted with Limma, global perturbations in known Gene Ontology (GO) terms, MSigDb, and KEGG pathways were detected using the R/Bioconductor package GAGE 85 to test for changes in expression of the reported log 2 fold-changes reported by Limma in each term versus the background log 2 fold-changes of all genes found outside the respective term.
qRT-qPCR
RNA was extracted using the QIAGEN miRNeasy Mini Kit (#217004). Reverse transcription was performed on 2μg purified RNA using the High-capacity cDNA reverse transcription kit with RNase inhibitor (ThermoFisher) using poly(dT) primers. SYBR Green JumpStart Taq Ready Mix (Sigma S9194) with used with qPCR using the QuantStudio 6 Flex Real-Time PCR System (Applied Biosystems). Relative quantification was performed using the 2−ΔΔCt method.
rMATS:
rMATS turbo v4.1.1 was used to detect the splicing events and significant splicing differences between TTDN1 or DBR1 knockout and control samples, including patient fibroblast samples and mouse samples. “Positive” and “negative” indicates inclusion and exclusion of splicing event relative to control transcript. For an event to be considered for any downstream analysis we required that each isoform was supported by at least 5 reads in half of the samples. Differentially spliced events were required to have an absolute difference in inclusion level greater than 10% and a false discovery rate less than 10% 86 (https://github.com/Xinglab/rmats-turbo).
Gene length analysis
Lengths of transcripts (CDSs plus UTRs) and numbers of exons for the human genome assembly were obtained by intersecting the information from file knownGene.txt (https://hgdownload.soe.ucsc.edu/goldenPath/hg38/database/, June 2020) with a custom BioMart Ensembl file of GRCh38 (May 2020) using in-house scripts. One-exon transcripts were excluded. The log10 of both transcript length and exon number were used for the analyses. RNA-Seq data were taken from the list of differentially expressed transcripts displaying significant Benjamini-Hochberg false-discovery rates, using various log2 fold-changes cutoffs as specified, and comparing with the remaining transcripts. For the line plots of transcript length or exon number versus log2 fold-changes we binned the ranked data with stride = 200 (i.e. 200 transcripts per bin) and displacement = 40 (overlap) unless otherwise specified. For each data point, error range corresponds to the standard error. For the mouse genome assembly, we used Ensembl GRCm38.76. We obtained transcript lengths and exon numbers using Daren Card’s utility “genestats.sh” at https://gist.github.com/darencard/fcb32168c243b92734e85c5f8b59a1c3. The “bgzip” and “tabix” utilities were downloaded from http://www.htslib.org/download/ (version htslib-1.12); “bedtools” was version 2.29.2. The R libraries “ggplot2”, “ggpubr”, and “grid” along with the Wilcoxon test were used to construct box plots. These show the median (unless specified otherwise), interquartile range (IQR) from Q1 (25th percentile) to Q3 (75th percentile), whiskers extending from Q1 − 1.5xIQR (minimum) to Q3 + 1.5xIQR (maximum), and outliers as dots.
Lariat identification by splice site matching
A lariat mapping pipeline was developed based on a previously described method42. First, reads are filtered out if they contain >5% ambiguous characters. Then, reads are mapped to the genome, and aligned reads are discarded. A mapping index is then created based on the unaligned reads, and a FASTA file containing the first 20nt of each annotated intron in the transcriptome is mapped to the unaligned reads. Reads are then identified where only one 5’ splice site maps to them and the alignment has no mismatches or indels. These reads are then trimmed of the sequence from the start of the 5’ SS alignment to the end of the read, and reads were the trimmed portion is <20nt are filtered out. The remaining trimmed reads are mapped to an index built from the last 250nt of every annotated intron. The trimmed read alignments are then filtered to only consider those with <=5 mismatches, <=10% mismatch rate, and no more than one indel of <=3nt. Then, for each trimmed read the highest scoring alignment was chosen after restricting to alignments in the same gene as the 5’ SS alignment and those with the expected inverted mapping order of the 5’ and 3’ segments. The end of this highest scoring alignment is then taken to be the branchpoint of the lariat the read is derived from.
PRO-seq library construction
PRO-Seq library construction and data analysis was performed by the Nascent Transcriptomics Core at Harvard Medical School, Boston, MA. Aliquots of frozen (−80°C) permeabilized cells were thawed on ice and pipetted gently to fully resuspend. Aliquots were removed and permeabilized cells were counted using a Luna II, Logos Biosystems instrument. For each sample, 1 million permeabilized cells were used for nuclear run-on, with 50,000 permeabilized Drosophila S2 cells added to each sample for normalization. Nuclear run-on assays and library preparation were performed essentially as described in 87 with modifications noted: 2X nuclear run-on buffer consisted of 10 mM Tris (pH 8), 10 mM MgCl2, 1 mM DTT, 300mM KCl, 20μM of each biotin-11-NTPs (Perkin Elmer), 0.8U/uL SuperaseIN (Thermo), and 1% sarkosyl. Run-on reactions were performed at 37°C. Random hexamer extensions (UMIs) were added to the 3’ end of the 5’ adapter and 5’ end of the 3’ adapter. Adenylated 3’ adapter was prepared using the 5’ DNA adenylation kit (NEB) and ligated using T4 RNA ligase 2, truncated KQ (NEB, per manufacturers instructions with 15% PEG-8000 final) and incubated at 16°C overnight. 180uL of betaine buffer (1.42g of betaine brought to 10mL) was mixed with ligations and incubated 5 min at 65°C and 2 min on ice prior to addition of streptavidin beads. After T4 polynucleotide kinase (NEB) treatment, beads were washed once each with high salt, low salt, and 0.25X T4 RNA ligase buffer (NEB) and resuspended in 5’ adapter mix (10 pmol 5’ adapter and 30 pmol blocking oligonucleotide in water). 5’ adapter ligation was per Reimer but with 15% PEG-8000 final. Eluted cDNA was amplified 5-cycles (NEBNext Ultra II Q5 master mix (NEB) with Illumina TruSeq PCR primers RP-1 and RPI-X following the manufacturer’s suggested cycling protocol for library construction. A portion of preCR was serially diluted and for test amplification to determine optimal amplification of final libraries. Pooled libraries were sequenced using the Illumina NovaSeq platform.
PRO-seq data analysis
All custom scripts described herein are available on the AdelmanLab GitHub (https://github.com/AdelmanLab/NIH_scripts). Dual, 6nt Unique Molecular Identifiers (UMIs) were extracted from read pairs using UMI-tools [10.1101/gr.209601.116]. Read pairs were trimmed using cutadapt 1.14 to remove adapter sequences (-O 1 --match-read-wildcards -m {20,26}). The UMI length was trimmed off the end of both reads to prevent read-through into the mate’s UMI, which will happen for shorter fragments. An additional nucleotide was removed from the end of read 1 (R1), using seqtk trimfq (https://github.com/lh3/seqtk), to preserve a single mate orientation during alignment. The paired end reads were then mapped to a combined genome index, including both the spike (dm6) and primary (hg38) genomes, using bowtie2 [10.1038/nmeth.1923]. Properly paired reads were retained. These read pairs were then separated based on the genome (i.e. spike-in vs primary) to which they mapped, and both these spike and primary reads were independently deduplicated, again using UMI-tools. Reads mapping to the reference genome were separated according to whether they were R1 or R2, sorted via samtools 1.3.1 (−n), and subsequently converted to bedGraph format using a custom script (bowtie2stdBedGraph.pl). We note that this script counts each read once at the exact 3’ end of the nascent RNA. Because R1 in PRO-seq reveals the position of the RNA 3’ end, the “+” and “−“ strands were swapped to generate bedGraphs representing 3’ end positions at single nucleotide resolution. Samples displayed highly comparable recovery of spike-in reads, thus samples were normalized based on the DESeq2 size factors (see below). Combined bedGraphs were generated by summing counts per nucleotide across replicates for each condition. Annotated transcription start sites were obtained from or human (GRCh38.99) GTFs from Ensembl. After removing transcripts with {immunoglobulin, Mt, Mt_tRNA, rRNA} biotypes, PRO-seq signal in each sample was calculated in the window from the annotated TSS to +150 nt downstream, using a custom script, make_heatmap.pl. This script counts each read one time, at the exact 3’ end location of the nascent RNA. Given good agreement between replicates and similar return of spike-in reads, bedGraphs were merged within conditions, and depthnormalized, to generate bigWig files binned at 10bp.
Paired-end RNA-seq reads were mapped to the hg38 reference genome via HISAT2 v2.2.1 (--known-splicesite-infile). To select gene-level features for differential expression analysis, and for pairing with PRO-seq data, we assigned a single, dominant TSS and transcription end site (TES) to each active gene. This was accomplished using a custom script, get_gene_annotations.sh (available at https://github.com/AdelmanLab/GetGeneAnnotation_GGA), which uses RNA-seq read abundance and PRO-seq R2 reads (RNA 5’ ends) to identify dominant TSSs, and RNA-seq profiles to define most commonly used TESs. RNA-seq and PRO-seq data from all conditions were used for this analysis, to comprehensively capture gene activity in these samples.
For differential expression analysis, reads were summed within the TSS to TES window for each active gene using the using the make_heatmap script (https://github.com/AdelmanLab/NIH_scripts), which counts each read one time, at the exact 3’ end location of the nascent RNA. DEseq2, using the Wald test, was used to determine statistically significant differentially expressed genes. Unless otherwise noted, the default size factors determined by DEseq2 were used. Average metagene plots of PRO-seq read density from TSS to TES of indicated gene groups were generated using make_heatmap as described above. Each gene was divided from TSS to TES positions into 200 bins of equal length, and read density calculated in each length scaled bin, as reads per kilobase. Read density flanking each gene were also calculated (2kb upstream of TSS and 2kb downstream of TES), in 20bins of 50pb each. Average values for each gene group are shown.
Lariat RNA immunoprecipitation and amplification
WT and TTDN1 KO U2OS cells expressed with Flag-AQR in 150 mm dishes were harvested and cell pellets were suspended with 2 volumes of Lysis Buffer (10 mM HEPES pH 7.5, 150 mM KCl, 0.5% NP-40, 2 mM EDTA supplemented with 10 mM β-Me, 400 U/mL RNase inhibitor and protease inhibitors). After rapid freezing at −80°C, lysates were spun down and the supernatants were diluted with 2 volumes of NT2 Buffer (50 mM HEPES pH7.5, 200 mM NaCl, 0.1% NP-40, 2 mM EDTA supplemented with 10 mM β-Me, 200 U/mL RNase inhibitor and protease inhibitors) and incubated with Anti-FLAG M2 affinity gel (Millipore Sigma) at 4°C with rotation for 4 hours. After extensive washing, the immuno-complexes were eluted with NT2 Buffer containing 400 mg/mL Flag peptide (Millipore Sigma) prior to RNA extraction. RNA extraction was performed using the QIAGEN miRNeasy Mini Kit and reverse transcribed using SuperScript VILO cDNA synthesis kit (Thermo Fisher Scientific). Selected intron lariats (UBA1 and RPL29) were amplified with nested primer sets (primer sequences are listed below) using DreamTaq Green PCR Master Mix (Thermo Fisher Scientific # KK1081) and PCR products were visualized in 2% agarose gel with ethidium bromide staining. For UBA1 amplification, the first-run PCR was amplified for 20 cycles with 1st primer sets (forward: 5’-GGCTTCCCCACTTCCAG-3’; reverse: 5’-GAAGTGAGGGAGGGAGG-3’) and 1 μL of first-run PCR product was used for second amplification for 25 cycles with 2nd primer sets (forward: 5’-CTGTGCGCCTTGTACTT-3’; reverse: 5’-TCTTACACTTAGGCATGCAAC-3’). For RPL29 amplification, the first-run PCR was amplified for 18 cycles with 1st primer sets (forward: 5’-GGTATTTCCACATTTGAGGTTG-3’; reverse: 5’-AGGAATTGCAGGCTTTGG-3’) and 1 μL of first-run PCR product was used for second amplification for 21 cycles with 2nd primer sets (forward: 5’-ATGCTGTCTTTAGAATGCTGG-3’; reverse: 5’-GCCAGTTAGGCTGTGC-3’).
Immunofluorescent microscopy
U2OS cells expressing pHAGE-CMV-3XHA-TTDN1 were washed with 1X PBS before fixation with 3.2% paraformaldehyde. For AQR and XAB2 localization, U2OS cells were washed with 1X PBS, extracted with 0.2% Triton X-100 in 1X PBS on ice, washed again with PBS before fixation with 3.2% paraformaldehyde. The cells were then washed with immunofluorescence wash buffer (1× PBS, 0.5% NP-40, and 0.02% NaN3), then blocked with immunofluorescence blocking buffer (immunofluorescence wash buffer plus 10% FBS) for 30 minutes. HA (Santa Cruz sc-805) antibody was diluted in immunofluorescence blocking buffer at 1:300 overnight at 4°C. After staining with Alexa Fluor 488 secondary antibody (Millipore) and Hoechst 33342 (Sigma-Aldrich), samples were mounted using Prolong Gold mounting medium (Invitrogen). Epifluorescence microscopy was performed on an Olympus fluorescence microscope (BX-53) using an UPlanS-Apo 100×/1.4 numerical aperture oil immersion lens and cellSens Dimension software. Raw images were exported into Adobe Photoshop, and for any adjustments in image contrast or brightness, the levels function was applied.
Targeting mouse Ttdn1 locus and animal husbandry
Ttdn1Δ/Δ and Ttdn1M143V/M143V mice were created using CRISPR/Cas9 technology at the Washington University Genome Engineering and iPSC Center as previously described 88. Female C57BL/6 mice were super-ovulated using 5 IU of Pregnant Mares Serum Gonadotropin followed by 5 IU of Human Chorionic Gonadotropin 48 hours later. The females were then mated to C57BL/6 male mice and day 0.5 embryos were isolated the morning after mating. The fertile single cell embryos underwent pronuclear micro-injection delivering the CRISPR gRNA (5’-TTCAATGCTTGAAGACCCTTNGG-3’) mixed with RNA encoding Cas9 and donor DNA. The concentration of the injection mix was 5 ng/μl gRNA with 10 ng/μl Cas9 RNA. Tail samples were taken from pups and deep sequencing was performed to identify animals carrying indels, and the exact modification that occurred. The founder male mouse with the Δ34 allele, or the M143V knockin allele, was selected and mated to a C57BL/6 female to isolate the allele, and heterozygous progeny were mated to generate the homozygous mutant mice.
All animal protocols were approved by the Institutional Animal Care and Use Committee and the Animal Studies Committee of Washington University in St. Louis, and in accordance with guidelines from the National Institutes of Health (NIH). Mice were housed in a room on a 12:12 hour light/dark cycle, with controlled room temperature (20–22°C) and relative humidity (50%). Home cages measured 28.5 cm × 17.5 cm × 12 cm and were supplied with corncob bedding and standard laboratory chow and water. All mice were group-housed and adequate measures were taken to minimize animal pain or discomfort.
Behavioral analysis
All mice were assessed on the same behavioral testing procedures and test sequence. The behavioral procedures were similar to previously described methods 89, except for the marble burying test, for which the general procedures described in 90 were used. All behavioral testing was conducted during the light cycle, by an experimenter “blinded” to experimental group status of each mouse. The order of the tests was the same as described below, which reflects attempts to minimize “carry-over” effects across measures by conducting the most stressfμl measures last in the series. Only one test was conducted per day. All equipment was cleaned with 2% chlorhexidine diacetate or 70% ethanol between animals. Behavioral studies were conducted in two different cohorts of mice: cohort 1 – Ttdn1+/+ =10 (4M; 6F); Ttdn1Δ/Δ =10 (4M; 6F); and cohort 2 - Ttdn1+/+ =8 (4M; 4F); Ttdn1Δ/Δ =9 (4M; 5F). Results presented are from analyzing the combined data set from the two different cohorts of mice. Analysis of the combined data set was carried out to increase statistical power for evaluating main effects of Genotype and Sex and their interactions. Behavioral testing involved using identical protocols and test sequences for each cohort. Moreover, we conducted “analysis screens” on all the behavioral data using an ANOVA model containing Genotype and Cohort as between-subjects variables. These models were used to determine whether any Genotype x Cohort interactions were present in order to judge the appropriateness of combining the data sets. These analyses did not produce any significant Genotype x Cohort interactions per se. However, in two instances, stationary rod (rotarod) and place path length (Morris water maze), 3-way interactions including a Genotype x Cohort along with the main dependent variable were observed, but this was of no consequence since there were no differences between groups with regard to these two variables. Note that there was one difference between the testing of the two cohorts. Specifically, only the Ttdn1Δ/Δ and Control mice from cohort 2 were evaluated on acoustic startle and prepulse inhibition of startle (PPI). This test was conducted one week after the mice were assessed on conditioned fear to determine the likelihood that the significant impairment on the auditory cue test exhibited by the TTDN1 mice was due to severe auditory deficits
Rotarod.
The Ttdn1Δ/Δ and WT mice were tested on the rotarod (Economex, Columbus Instruments, Columbus, OH) to assess fine motor control. Each mouse was placed on a 9.5 cm section of grooved rod measuring 3.81 cm in diameter surrounded by plastic walls and elevated 52 cm from the floor. Mice received five trials on three test days, where each test session was separated by 4 days to minimize motor learning. The rod was stationary for trial 1 and continuously rotating at 2.5 rpm for trials 2 and 3 for 60 s. The rod accelerated by 0.13 rpm per second for trials 4 and 5 for 180 s. Time the mouse remained on the rod served as the dependent variable. Note that the one-hour locomotor activity test, sensorimotor battery, and marble burying test were conducted during days intervening between rotarod test sessions, although only one test was scheduled for a given day.
One-hour locomotor activity and sensorimotor battery.
Mice were placed in transparent polystyrene enclosures (47.6×25.4×20.6cm) and movements were monitored using computerized photobeam instrumentation. General activity variables (total ambulations, number of vertical rearings) were collected along with emotionality indices (time spent, distance traveled, and entries made in a 33 × 11 cm central zone, as well as distance traveled within a 5.5 cm contiguous area around the periphery. The following day, mice were run on a battery of sensorimotor tests (walking initiation, ledge platform; pole, 60° and 90° inclined screens, inverted screens) to assess movement initiation, balance, strength, and coordination. For walking initiation, mice were placed in the center of a 21 × 21 cm square marked with tape, and the amount of time mice took to leave the square was recorded. In the ledge and platform tests, mice were placed on an elevated Plexiglas ledge (0.75 cm wide) or small circular wooden platform (3.0 cm diameter) elevated to 30 or 47 cm, respectively, and the amount of time they could remain on either apparatus was recorded. In the pole test, mice were oriented head-up with forepaws on top of a textured rod (8 mm × 55 cm) and the amount of time the mouse took to turn around and climb down the pole was measured. If the mouse fell off the pole, it was assigned a maximum score of 120 s. Inclined screen tests were performed by placing mice head-oriented down on a wire mesh grid (16 × 10 cm) elevated 47 cm and inclined at 60° or 90°. The time taken for the mouse to turn 180° and climb to the top of the wire mesh was then measured. Inverted screen tests began identically to inclined screen tests described above, except that the screen was inverted 180° after ensuring the mouse had a secure grip. The amount of time the mouse could remain on the screen was recorded. Each test lasted a maximum of 60 s, except for the pole measure (120 s). Means from two trials per test per mouse were used in all analyses.
Marble burying.
Species-specific, compulsive digging behavior was evaluated in the mice using the marble burying test employing a procedure generally similar to previously-described methods (Maloney et al., 2018). A rat cage was filled with aspen bedding to a depth of 3 cm served as the apparatus. Twenty marbles were placed on top of the bedding in a 5 × 4 evenly spaced configuration. The test began by placing a mouse in the center of the chamber and allowing it to freely explore and dig for 30 min under normal laboratory lighting conditions. An acrylic lid containing air holes was placed on top of the cage to prevent mice from escaping. After 30 min, the mouse was returned to its home cage. Two observers counted the number of marbles not buried (less than two-thirds of the marble was covered with bedding). The number of marbles buried was then determined, and the average of the two scores was used in the analysis. After the marbles were counted, the bedding was disposed of and the cage and marbles were cleaned with 2% chlorhexidine diacetate.
Morris Water Maze (MWM).
Spatial learning and memory were assessed using the MWM three days after completion of the sensorimotor battery. A computerized tracking system (ANY-maze; Stoelting) recorded the swim path of the mouse to the escape platform and quantified path length and latency to the escape platform, and swimming speeds during cued, place, and probe trials conducted in a pool of opaque water. Mice were first tested on the cued condition to assess whether they had any demonstrable nonassociative deficits (e.g., visual or sensorimotor disturbances) that might affect subsequent performance during the place (spatial learning) trials. For the cued trials, the escape platform was submerged beneath the surface of the water, but its location was denoted by a red tennis ball atop a rod, which was attached to the escape platform and served as a visual cue. Cued trials were conducted four times per day for two consecutive days, for a total of eight trials with an inter-trial interval (ITI) of 30 min and a 60 s maximum per trial. To limit spatial learning during cued trials, the location of the platforms was varied across trials in the presence of very few distal spatial cues. Cued trial performance was analyzed as four blocks of two trials each. Three days after completing the cued trials, spatial learning was assessed during the place condition. For the place trials, the platform was hidden beneath the surface of the opaque water and its location was kept constant across all trials in the target quadrant, with several salient distal cues being present. Acquisition training involved releasing a mouse from each of the pool quadrants for each trial, with the sequence of quadrants being pseudorandomly determined for each test session. Two blocks of 2 consecutive trials each were performed over five days, with 60 s maximum per trial and an ITI of 30 s, during which time a mouse was allowed to remain on the platform. Blocks were separated by approximately 2 h. The place trials data were analyzed over five blocks of four trials, each block representing one day of training. A 60 s probe trial was administered about 1 h after the last place trial on the fifth day when the platform was removed, and the mouse was released into the maze from the quadrant opposite where the platform had been located. The amount of time the mouse spent searching in each quadrant of the pool, as well as the number of times it crossed over the exact location where the platform had been located (platform crossings) were recorded.
Conditioned fear.
Three days after completing testing in the MWM, the mice were assessed on Pavlovian fear conditioning. The procedure involved placing a mouse into a Plexiglas conditioning chamber (26cm×18cm ×18cm; Med-Associates), that contained distinct visual, tactile, and olfactory cues. Freezing behavior was assessed for a 2-min baseline period prior to tone-shock training. Three minutes after being placed in the conditioning chamber, and every 60 s thereafter, mice were exposed to 3, tone-shock pairings. Each pairing consisted of 20 s of broadband white noise presented at 80 dB (conditioned stimulus; CS), with a 1.0 mA continuous foot shock (unconditioned stimulus; UCS) presented during the last second of the tone. Mice were placed back into the same conditioning chamber the following day and freezing behavior was measured over an 8-min period. One day later, mice were placed into a chamber that contained a different set of cues. Freezing behavior was recorded for a 2-min altered context baseline period, after which mice were assessed on the auditory cue test, which involved the presentation of the tone (CS) over an 8 min period. Freezing behavior was quantified using FreezeFrame image analysis software (Actimetrics), where freezing was defined as no movement beyond that associated with breathing. Data are presented as a percentage of time spent freezing, relative to the total duration of the trial. Shock sensitivity was evaluated after fear conditioning using previously described procedures.
Acoustic startle/prepulse inhibition of startle (PPI).
After the completion of testing the second cohort of mice, the decision was made to evaluate the second cohort on the acoustic startle response and prepulse inhibition of the startle response (PPI) to provide some information on the possibility that deafness or severe auditory deficits were responsible for the impaired auditory cue performance during conditioned fear testing (day 3) of the Ttdn1Δ/Δ mice. Thus, one week after completing the conditioned fear test for cohort 2, sensorimotor reactivity and gating and the general intactness of the auditory system were evaluated in the mice by quantifying the magnitude of their acoustic startle response and PPI (Hamilton Kinder, LLC), using methods similar to those previously described 91. Specifically, responses to a 120 dB auditory stimulus pulse (40 ms broadband burst) and PPI (response to a prepulse plus the startle pulse) were measured concurrently in the mice using Kinder Scientific Startle Reflex chambers (Poway, CA, USA). A total of 20 startle trials were presented over a 20 min test period during which the first 5 min served as an acclimation period when no stimuli above the 65 dB white noise background were presented. The session began and ended by presenting 5 consecutive startle (120 db pulse alone) trials unaccompanied by other trial types. The middle 10 startle trials are interspersed with PPI trials (consisting of an additional 30 presentations of 120 dB startle stimuli preceded by pre-pulse stimuli of either 4, 12, or 16 dB above background (10 trials for each PPI trial type). Following pseudorandom presentation of all PPI and startle trials, responses to 40 ms broadband bursts at 80, 90, 100,110 and 120 dB were measured to screen for differences in auditory thresholds. A %PPI score for each trial was calculated using the following equation: %PPI = 100*(ASRstartle pulse alone − ASRprepulse+startle pulse)/ASRstartle pulse alone.
Neurohistology
At around 4.5 months of age, animals were perfused using 4% paraformaldehyde and brains sectioned on a vibratome at 75 microns. Sections were then stained with hematoxylin by immersing in two five-minute exchanges of 100% ethanol, 2 minutes in 95% ethanol, 2 minutes in 70% ethanol, five dips in deionized water, and eight minutes in hematoxylin (Gill’s hematoxylin stock solution, Sigma-Aldrich, GHS132–1L). This was followed by two exchanges of five dips in deionized water, ten seconds in 0.2% ammonia water, and a final five dips in deionized water. Mounted sections were then coverslipped using an aqueous mounting medium (Permanent Aqueous Mounting Medium, Bio-Rad, BUF058A). Regional volumes were then quantified using Stereo Investigator Software (Version 2020.2.3, MBF Bioscience, Williston, VT) running on a Dell Precision Tower 5810 computer connected to a QImaging 2000R camera and a Labophot-2 Nikon microscope with electronically driven motorized stage.
Quantification and statistical analysis
The quantifications and statistical analysis were performed as indicated in the figure legends using GraphPad Prism or Microsoft Excel.
Supplementary Material
Table S1. Summary of proteomics data for TTDN1/MPLKIP interactors purified from HeLa-S cells, related to Figure 1. Unique and total peptide numbers are shown for two independent runs.
Table S2. Summary of proteomics data for DBR1 and control (GFP) interactors, related to Figure 2. Unique and total peptide numbers are shown (Sheet 1); sum intensities are also provided (Sheet 2).
Table S3. Summary of proteomics data for DBR1 and control (vector only) interactors, purified from control or TTDN1 KO cells, related to Figure 2. Unique and total peptide numbers are shown for two independent runs.
Highlights.
TTDN1 associates with DBR1 and promotes RNA lariat debranching in cells
TTDN1 links DBR1 to the intron binding complex (IBC)
Loss of TTDN1 causes defects in splicing and in length-dependent gene expression
Ttdn1Δ/Δ mice recapitulate neurodevelopmental phenotypes of trichothiodystrophy
Acknowledgments
We thank Zhongsheng You, Hani Zaher, Chaorui Duan, Harrison Gabel, and Diana Christian for suggestions during the course of these studies. We thank John Schultz (UC Davis) for amino acid analysis, Ross Tomaino (Harvard Medical School Taplin Core) for proteomics, the Genome Technology Access Center (GTAC), and the Genome Engineering and iPSC (GEiC) Center at Washington University, the Nascent Transcriptomics Core (Harvard Medical School) for performing PRO-seq library construction and for assistance with data analysis. We acknowledge the Extreme Science and Engineering Discovery Environment (XSEDE, PSC allocations TG-BIO160040 and TG-MCB170053), which is supported by NSF grant ACI-1548562, and the Texas Advanced Computing Center (TACC, http://www.tacc.utexas.edu) at The University of Texas at Austin for providing HPC resources. This work was supported by the NIH (F31 CA0254143 to B.A.T., R35 CA220430 to J.A.T., R01 GM105681 and R01 GM127472 to W.G.F., R01 CA193318 to N.M., and P01 CA092584 to J.A.T. and N.M.), the Wellcome Trust (220300Z/20/Z to V. P.), the Edward P. Evans Foundation (M.J.W.), the Foundation for Barnes-Jewish Hospital Cancer Frontier Fund (M.J.W.), an American Cancer Society Research Scholar award (RSG-18-156-01-DMC to N.M.), the Barnard Foundation (N.M.), Centene Corporation (N.M.), and the Siteman Cancer Center (N.M. and M.J.W.). J.A.T. is also supported by Cancer Prevention Research Institute of Texas (CPRIT) grant RP180813 and the Robert A. Welch Chemistry Chair. A.S.H. is supported by a Longer Life Foundation grant (a collaboration between RGA and Washington University). Partial support for the mouse behavioral studies was provided by the Intellectual and Developmental Disabilities Research Center at the Washington University School of Medicine (P50 HD10342 to D.W.).
Inclusion and Diversity
We support inclusive, diverse, and equitable conduct of research. We worked to ensure sex balance in the selection of non-human subjects. While citing references scientifically relevant for this work, we actively worked to promote gender balance in our reference list.
Footnotes
Declaration of Interests
The authors declare no competing financial interests.
Publisher's Disclaimer: This is a PDF file of an unedited manuscript that has been accepted for publication. As a service to our customers we are providing this early version of the manuscript. The manuscript will undergo copyediting, typesetting, and review of the resulting proof before it is published in its final form. Please note that during the production process errors may be discovered which could affect the content, and all legal disclaimers that apply to the journal pertain.
References
- 1.Merkhofer EC, Hu P, and Johnson TL (2014). Introduction to cotranscriptional RNA splicing. Methods Mol Biol 1126, 83–96. 10.1007/978-1-62703-980-2_6. [DOI] [PMC free article] [PubMed] [Google Scholar]
- 2.Naftelberg S, Schor IE, Ast G, and Kornblihtt AR (2015). Regulation of alternative splicing through coupling with transcription and chromatin structure. Annu Rev Biochem 84, 165–198. 10.1146/annurev-biochem-060614-034242. [DOI] [PubMed] [Google Scholar]
- 3.Wissink EM, Vihervaara A, Tippens ND, and Lis JT (2019). Nascent RNA analyses: tracking transcription and its regulation. Nat Rev Genet 20, 705–723. 10.1038/s41576-019-0159-6. [DOI] [PMC free article] [PubMed] [Google Scholar]
- 4.Neugebauer KM (2019). Nascent RNA and the Coordination of Splicing with Transcription. Cold Spring Harb Perspect Biol 11. 10.1101/cshperspect.a032227. [DOI] [PMC free article] [PubMed] [Google Scholar]
- 5.Custodio N, and Carmo-Fonseca M (2016). Co-transcriptional splicing and the CTD code. Crit Rev Biochem Mol Biol 51, 395–411. 10.1080/10409238.2016.1230086. [DOI] [PubMed] [Google Scholar]
- 6.Harlen KM, and Churchman LS (2017). The code and beyond: transcription regulation by the RNA polymerase II carboxy-terminal domain. Nat Rev Mol Cell Biol 18, 263–273. 10.1038/nrm.2017.10. [DOI] [PubMed] [Google Scholar]
- 7.Hirose Y, and Manley JL (1998). RNA polymerase II is an essential mRNA polyadenylation factor. Nature 395, 93–96. 10.1038/25786. [DOI] [PubMed] [Google Scholar]
- 8.Hirose Y, Tacke R, and Manley JL (1999). Phosphorylated RNA polymerase II stimulates pre-mRNA splicing. Genes Dev 13, 1234–1239. 10.1101/gad.13.10.1234. [DOI] [PMC free article] [PubMed] [Google Scholar]
- 9.Ho CK, and Shuman S (1999). Distinct roles for CTD Ser-2 and Ser-5 phosphorylation in the recruitment and allosteric activation of mammalian mRNA capping enzyme. Mol Cell 3, 405–411. 10.1016/s1097-2765(00)80468-2. [DOI] [PubMed] [Google Scholar]
- 10.Zaborowska J, Egloff S, and Murphy S (2016). The pol II CTD: new twists in the tail. Nat Struct Mol Biol 23, 771–777. 10.1038/nsmb.3285. [DOI] [PubMed] [Google Scholar]
- 11.Dujardin G, Lafaille C, de la Mata M, Marasco LE, Munoz MJ, Le Jossic-Corcos C, Corcos L, and Kornblihtt AR (2014). How slow RNA polymerase II elongation favors alternative exon skipping. Mol Cell 54, 683–690. 10.1016/j.molcel.2014.03.044. [DOI] [PubMed] [Google Scholar]
- 12.Schor IE, Fiszbein A, Petrillo E, and Kornblihtt AR (2013). Intragenic epigenetic changes modulate NCAM alternative splicing in neuronal differentiation. EMBO J 32, 2264–2274. 10.1038/emboj.2013.167. [DOI] [PMC free article] [PubMed] [Google Scholar]
- 13.Hnilicova J, Hozeifi S, Stejskalova E, Duskova E, Poser I, Humpolickova J, Hof M, and Stanek D (2013). The C-terminal domain of Brd2 is important for chromatin interaction and regulation of transcription and alternative splicing. Mol Biol Cell 24, 3557–3568. 10.1091/mbc.E13-06-0303. [DOI] [PMC free article] [PubMed] [Google Scholar]
- 14.Luco RF, Allo M, Schor IE, Kornblihtt AR, and Misteli T (2011). Epigenetics in alternative pre-mRNA splicing. Cell 144, 16–26. 10.1016/j.cell.2010. [DOI] [PMC free article] [PubMed] [Google Scholar]
- 15.Munoz MJ, Perez Santangelo MS, Paronetto MP, de la Mata M, Pelisch F, Boireau S, Glover-Cutter K, Ben-Dov C, Blaustein M, Lozano JJ, et al. (2009). DNA damage regulates alternative splicing through inhibition of RNA polymerase II elongation. Cell 137, 708–720. 10.1016/j.cell.2009.03.010. [DOI] [PubMed] [Google Scholar]
- 16.Fong N, Kim H, Zhou Y, Ji X, Qiu J, Saldi T, Diener K, Jones K, Fu XD, and Bentley DL (2014). Pre-mRNA splicing is facilitated by an optimal RNA polymerase II elongation rate. Genes Dev 28, 2663–2676. 10.1101/gad.252106.114. [DOI] [PMC free article] [PubMed] [Google Scholar]
- 17.Caizzi L, Monteiro-Martins S, Schwalb B, Lysakovskaia K, Schmitzova J, Sawicka A, Chen Y, Lidschreiber M, and Cramer P (2021). Efficient RNA polymerase II pause release requires U2 snRNP function. Mol Cell 81, 1920–1934 e1929. 10.1016/j.molcel.2021.02.016. [DOI] [PubMed] [Google Scholar]
- 18.Chathoth KT, Barrass JD, Webb S, and Beggs JD (2014). A splicing-dependent transcriptional checkpoint associated with prespliceosome formation. Mol Cell 53, 779–790. 10.1016/j.molcel.2014.01.017. [DOI] [PMC free article] [PubMed] [Google Scholar]
- 19.Lin S, Coutinho-Mansfield G, Wang D, Pandit S, and Fu XD (2008). The splicing factor SC35 has an active role in transcriptional elongation. Nat Struct Mol Biol 15, 819–826. 10.1038/nsmb.1461. [DOI] [PMC free article] [PubMed] [Google Scholar]
- 20.Zhang S, Aibara S, Vos SM, Agafonov DE, Luhrmann R, and Cramer P (2021). Structure of a transcribing RNA polymerase II-U1 snRNP complex. Science 371, 305–309. 10.1126/science.abf1870. [DOI] [PubMed] [Google Scholar]
- 21.Clark NE, Katolik A, Roberts KM, Taylor AB, Holloway SP, Schuermann JP, Montemayor EJ, Stevens SW, Fitzpatrick PF, Damha MJ, and Hart PJ (2016). Metal dependence and branched RNA cocrystal structures of the RNA lariat debranching enzyme Dbr1. Proc Natl Acad Sci U S A 113, 14727–14732. 10.1073/pnas.1612729114. [DOI] [PMC free article] [PubMed] [Google Scholar]
- 22.Cheng Z, and Menees TM (2011). RNA splicing and debranching viewed through analysis of RNA lariats. Mol Genet Genomics 286, 395–410. 10.1007/s00438-011-0635-y. [DOI] [PubMed] [Google Scholar]
- 23.Montemayor EJ, Katolik A, Clark NE, Taylor AB, Schuermann JP, Combs DJ, Johnsson R, Holloway SP, Stevens SW, Damha MJ, and Hart PJ (2014). Structural basis of lariat RNA recognition by the intron debranching enzyme Dbr1. Nucleic Acids Res 42, 10845–10855. 10.1093/nar/gku725. [DOI] [PMC free article] [PubMed] [Google Scholar]
- 24.Wahl MC, Will CL, and Luhrmann R (2009). The spliceosome: design principles of a dynamic RNP machine. Cell 136, 701–718. 10.1016/j.cell.2009.02.009. [DOI] [PubMed] [Google Scholar]
- 25.Sakharkar MK, Perumal BS, Sakharkar KR, and Kangueane P (2005). An analysis on gene architecture in human and mouse genomes. In Silico Biol 5, 347–365. [PubMed] [Google Scholar]
- 26.Ouchane S, Picaud M, and Astier C (1995). A new mutation in the pufL gene responsible for the terbutryn resistance phenotype in Rubrivivax gelatinosus. FEBS Lett 374, 130–134. 10.1016/0014-5793(95)01055-j. [DOI] [PubMed] [Google Scholar]
- 27.Okamura K, Hagen JW, Duan H, Tyler DM, and Lai EC (2007). The mirtron pathway generates microRNA-class regulatory RNAs in Drosophila. Cell 130, 89–100. 10.1016/j.cell.2007.06.028. [DOI] [PMC free article] [PubMed] [Google Scholar]
- 28.Hirose T, Shu MD, and Steitz JA (2003). Splicing-dependent and -independent modes of assembly for intron-encoded box C/D snoRNPs in mammalian cells. Mol Cell 12, 113–123. 10.1016/s1097-2765(03)00267-3. [DOI] [PubMed] [Google Scholar]
- 29.Han B, Park HK, Ching T, Panneerselvam J, Wang H, Shen Y, Zhang J, Li L, Che R, Garmire L, and Fei P (2017). Human DBR1 modulates the recycling of snRNPs to affect alternative RNA splicing and contributes to the suppression of cancer development. Oncogene 36, 5382–5391. 10.1038/onc.2017.150. [DOI] [PMC free article] [PubMed] [Google Scholar]
- 30.Dvinge H, Guenthoer J, Porter PL, and Bradley RK (2019). RNA components of the spliceosome regulate tissue- and cancer-specific alternative splicing. Genome Res 29, 1591–1604. 10.1101/gr.246678.118. [DOI] [PMC free article] [PubMed] [Google Scholar]
- 31.Li Z, Wang S, Cheng J, Su C, Zhong S, Liu Q, Fang Y, Yu Y, Lv H, Zheng Y, and Zheng B (2016). Intron Lariat RNA Inhibits MicroRNA Biogenesis by Sequestering the Dicing Complex in Arabidopsis. PLoS Genet 12, e1006422. 10.1371/journal.pgen.1006422. [DOI] [PMC free article] [PubMed] [Google Scholar]
- 32.Zhang SY, Clark NE, Freije CA, Pauwels E, Taggart AJ, Okada S, Mandel H, Garcia P, Ciancanelli MJ, Biran A, et al. (2018). Inborn Errors of RNA Lariat Metabolism in Humans with Brainstem Viral Infection. Cell 172, 952–965 e918. 10.1016/j.cell.2018.02.019. [DOI] [PMC free article] [PubMed] [Google Scholar]
- 33.Kuschal C, Botta E, Orioli D, Digiovanna JJ, Seneca S, Keymolen K, Tamura D, Heller E, Khan SG, Caligiuri G, et al. (2016). GTF2E2 Mutations Destabilize the General Transcription Factor Complex TFIIE in Individuals with DNA Repair-Proficient Trichothiodystrophy. Am J Hum Genet 98, 627–642. 10.1016/j.ajhg.2016.02.008. [DOI] [PMC free article] [PubMed] [Google Scholar]
- 34.Faghri S, Tamura D, Kraemer KH, and Digiovanna JJ (2008). Trichothiodystrophy: a systematic review of 112 published cases characterises a wide spectrum of clinical manifestations. Journal of medical genetics 45, 609–621. 10.1136/jmg.2008.058743. [DOI] [PMC free article] [PubMed] [Google Scholar]
- 35.Botta E, Offman J, Nardo T, Ricotti R, Zambruno G, Sansone D, Balestri P, Raams A, Kleijer WJ, Jaspers NG, et al. (2007). Mutations in the C7orf11 (TTDN1) gene in six nonphotosensitive trichothiodystrophy patients: no obvious genotype-phenotype relationships. Hum Mutat 28, 92–96. 10.1002/humu.20419. [DOI] [PubMed] [Google Scholar]
- 36.Brickner JR, Soll JM, Lombardi PM, Vagbo CB, Mudge MC, Oyeniran C, Rabe R, Jackson J, Sullender ME, Blazosky E, et al. (2017). A ubiquitin-dependent signalling axis specific for ALKBH-mediated DNA dealkylation repair. Nature 551, 389–393. 10.1038/nature24484. [DOI] [PMC free article] [PubMed] [Google Scholar]
- 37.Tsao N, Brickner JR, Rodell R, Ganguly A, Wood M, Oyeniran C, Ahmad T, Sun H, Bacolla A, Zhang L, et al. (2021). Aberrant RNA methylation triggers recruitment of an alkylation repair complex. Mol Cell 81, 4228–4242 e4228. 10.1016/j.molcel.2021.09.024. [DOI] [PMC free article] [PubMed] [Google Scholar]
- 38.Corbett MA, Dudding-Byth T, Crock PA, Botta E, Christie LM, Nardo T, Caligiuri G, Hobson L, Boyle J, Mansour A, et al. (2015). A novel X-linked trichothiodystrophy associated with a nonsense mutation in RNF113A. J Med Genet 52, 269–274. 10.1136/jmedgenet-2014-102418. [DOI] [PubMed] [Google Scholar]
- 39.Mendelsohn BA, Beleford DT, Abu-El-Haija A, Alsaleh NS, Rahbeeni Z, Martin PM, Rego S, Huang A, Capodanno G, Shieh JT, et al. (2020). A novel truncating variant in ring finger protein 113A (RNF113A) confirms the association of this gene with X-linked trichothiodystrophy. Am J Med Genet A 182, 513–520. 10.1002/ajmg.a.61450. [DOI] [PMC free article] [PubMed] [Google Scholar]
- 40.Tessarech M, Gorce M, Boussion F, Bault JP, Triau S, Charif M, Khiaty S, Delorme B, Guichet A, Ziegler A, et al. (2020). Second report of RING finger protein 113A (RNF113A) involvement in a Mendelian disorder. Am J Med Genet A 182, 565–569. 10.1002/ajmg.a.61384. [DOI] [PubMed] [Google Scholar]
- 41.Nakabayashi K, Amann D, Ren Y, Saarialho-Kere U, Avidan N, Gentles S, MacDonald JR, Puffenberger EG, Christiano AM, Martinez-Mir A, et al. (2005). Identification of C7orf11 (TTDN1) gene mutations and genetic heterogeneity in nonphotosensitive trichothiodystrophy. American journal of human genetics 76, 510–516. 10.1086/428141. [DOI] [PMC free article] [PubMed] [Google Scholar]
- 42.Pineda JMB, and Bradley RK (2018). Most human introns are recognized via multiple and tissue-specific branchpoints. Genes Dev 32, 577–591. 10.1101/gad.312058.118. [DOI] [PMC free article] [PubMed] [Google Scholar]
- 43.Masaki S, Yoshimoto R, Kaida D, Hata A, Satoh T, Ohno M, and Kataoka N (2015). Identification of the specific interactors of the human lariat RNA debranching enzyme 1 protein. Int J Mol Sci 16, 3705–3721. 10.3390/ijms16023705. [DOI] [PMC free article] [PubMed] [Google Scholar]
- 44.De I, Bessonov S, Hofele R, dos Santos K, Will CL, Urlaub H, Luhrmann R, and Pena V (2015). The RNA helicase Aquarius exhibits structural adaptations mediating its recruitment to spliceosomes. Nat Struct Mol Biol 22, 138–144. 10.1038/nsmb.2951. [DOI] [PubMed] [Google Scholar]
- 45.Hirose T, Ideue T, Nagai M, Hagiwara M, Shu MD, and Steitz JA (2006). A spliceosomal intron binding protein, IBP160, links position-dependent assembly of intron-encoded box C/D snoRNP to pre-mRNA splicing. Mol Cell 23, 673–684. 10.1016/j.molcel.2006.07.011. [DOI] [PubMed] [Google Scholar]
- 46.Martin EW, Holehouse AS, Peran I, Farag M, Incicco JJ, Bremer A, Grace CR, Soranno A, Pappu RV, and Mittag T (2020). Valence and patterning of aromatic residues determine the phase behavior of prion-like domains. Science 367, 694–699. 10.1126/science.aaw8653. [DOI] [PMC free article] [PubMed] [Google Scholar]
- 47.Vermeij WP, Dolle ME, Reiling E, Jaarsma D, Payan-Gomez C, Bombardieri CR, Wu H, Roks AJ, Botter SM, van der Eerden BC, et al. (2016). Restricted diet delays accelerated ageing and genomic stress in DNA-repair-deficient mice. Nature 537, 427–431. 10.1038/nature19329. [DOI] [PMC free article] [PubMed] [Google Scholar]
- 48.Shostak K, Jiang Z, Charloteaux B, Mayer A, Habraken Y, Tharun L, Klein S, Xu X, Duong HQ, Vislovukh A, et al. (2020). The X-linked trichothiodystrophy-causing gene RNF113A links the spliceosome to cell survival upon DNA damage. Nat Commun 11, 1270. 10.1038/s41467-020-15003-7. [DOI] [PMC free article] [PubMed] [Google Scholar]
- 49.Vermeij WP, Hoeijmakers JH, and Pothof J (2016). Genome Integrity in Aging: Human Syndromes, Mouse Models, and Therapeutic Options. Annu Rev Pharmacol Toxicol 56, 427–445. 10.1146/annurev-pharmtox-010814-124316. [DOI] [PubMed] [Google Scholar]
- 50.de Boer J, de Wit J, van Steeg H, Berg RJ, Morreau H, Visser P, Lehmann AR, Duran M, Hoeijmakers JH, and Weeda G (1998). A mouse model for the basal transcription/DNA repair syndrome trichothiodystrophy. Mol Cell 1, 981–990. 10.1016/s1097-2765(00)80098-2. [DOI] [PubMed] [Google Scholar]
- 51.Heller ER, Khan SG, Kuschal C, Tamura D, DiGiovanna JJ, and Kraemer KH (2015). Mutations in the TTDN1 gene are associated with a distinct trichothiodystrophy phenotype. J Invest Dermatol 135, 734–741. 10.1038/jid.2014.440. [DOI] [PMC free article] [PubMed] [Google Scholar]
- 52.Theil AF, Mandemaker IK, van den Akker E, Swagemakers SMA, Raams A, Wust T, Marteijn JA, Giltay JC, Colombijn RM, Moog U, et al. (2017). Trichothiodystrophy causative TFIIEbeta mutation affects transcription in highly differentiated tissue. Hum Mol Genet 26, 4689–4698. 10.1093/hmg/ddx351. [DOI] [PMC free article] [PubMed] [Google Scholar]
- 53.Kuo ME, Theil AF, Kievit A, Malicdan MC, Introne WJ, Christian T, Verheijen FW, Smith DEC, Mendes MI, Hussaarts-Odijk L, et al. (2019). Cysteinyl-tRNA Synthetase Mutations Cause a Multi-System, Recessive Disease That Includes Microcephaly, Developmental Delay, and Brittle Hair and Nails. Am J Hum Genet 104, 520–529. 10.1016/j.ajhg.2019.01.006. [DOI] [PMC free article] [PubMed] [Google Scholar]
- 54.Botta E, Theil AF, Raams A, Caligiuri G, Giachetti S, Bione S, Accadia M, Lombardi A, Smith DEC, Mendes MI, et al. (2021). Protein instability associated with AARS1 and MARS1 mutations causes trichothiodystrophy. Hum Mol Genet 30, 1711–1720. 10.1093/hmg/ddab123. [DOI] [PMC free article] [PubMed] [Google Scholar]
- 55.Theil AF, Botta E, Raams A, Smith DEC, Mendes MI, Caligiuri G, Giachetti S, Bione S, Carriero R, Liberi G, et al. (2019). Bi-allelic TARS Mutations Are Associated with Brittle Hair Phenotype. Am J Hum Genet 105, 434–440. 10.1016/j.ajhg.2019.06.017. [DOI] [PMC free article] [PubMed] [Google Scholar]
- 56.Haselbach D, Komarov I, Agafonov DE, Hartmuth K, Graf B, Dybkov O, Urlaub H, Kastner B, Luhrmann R, and Stark H (2018). Structure and Conformational Dynamics of the Human Spliceosomal B(act) Complex. Cell 172, 454–464 e411. 10.1016/j.cell.2018.01.010. [DOI] [PubMed] [Google Scholar]
- 57.Cretu C, Agrawal AA, Cook A, Will CL, Fekkes P, Smith PG, Luhrmann R, Larsen N, Buonamici S, and Pena V (2018). Structural Basis of Splicing Modulation by Antitumor Macrolide Compounds. Mol Cell 70, 265–273 e268. 10.1016/j.molcel.2018.03.011. [DOI] [PubMed] [Google Scholar]
- 58.Mahat DB, Kwak H, Booth GT, Jonkers IH, Danko CG, Patel RK, Waters CT, Munson K, Core LJ, and Lis JT (2016). Base-pair-resolution genome-wide mapping of active RNA polymerases using precision nuclear run-on (PRO-seq). Nat Protoc 11, 1455–1476. 10.1038/nprot.2016.086. [DOI] [PMC free article] [PubMed] [Google Scholar]
- 59.Williamson L, Saponaro M, Boeing S, East P, Mitter R, Kantidakis T, Kelly GP, Lobley A, Walker J, Spencer-Dene B, et al. (2017). UV Irradiation Induces a Non-coding RNA that Functionally Opposes the Protein Encoded by the Same Gene. Cell 168, 843–855 e813. 10.1016/j.cell.2017.01.019. [DOI] [PMC free article] [PubMed] [Google Scholar]
- 60.Konarska MM, Grabowski PJ, Padgett RA, and Sharp PA (1985). Characterization of the branch site in lariat RNAs produced by splicing of mRNA precursors. Nature 313, 552–557. 10.1038/313552a0. [DOI] [PubMed] [Google Scholar]
- 61.Ruskin B, Krainer AR, Maniatis T, and Green MR (1984). Excision of an intact intron as a novel lariat structure during pre-mRNA splicing in vitro. Cell 38, 317–331. 10.1016/0092-8674(84)90553-1. [DOI] [PubMed] [Google Scholar]
- 62.Yoshimoto R, Kataoka N, Okawa K, and Ohno M (2009). Isolation and characterization of post-splicing lariat-intron complexes. Nucleic Acids Res 37, 891–902. 10.1093/nar/gkn1002. [DOI] [PMC free article] [PubMed] [Google Scholar]
- 63.Chapman KB, and Boeke JD (1991). Isolation and characterization of the gene encoding yeast debranching enzyme. Cell 65, 483–492. 10.1016/0092-8674(91)90466-c. [DOI] [PubMed] [Google Scholar]
- 64.Nam K, Lee G, Trambley J, Devine SE, and Boeke JD (1997). Severe growth defect in a Schizosaccharomyces pombe mutant defective in intron lariat degradation. Mol Cell Biol 17, 809–818. 10.1128/MCB.17.2.809. [DOI] [PMC free article] [PubMed] [Google Scholar]
- 65.Findlay GM, Boyle EA, Hause RJ, Klein JC, and Shendure J (2014). Saturation editing of genomic regions by multiplex homology-directed repair. Nature 513, 120–123. 10.1038/nature13695. [DOI] [PMC free article] [PubMed] [Google Scholar]
- 66.International Human Genome Sequencing, C. (2004). Finishing the euchromatic sequence of the human genome. Nature 431, 931–945. 10.1038/nature03001. [DOI] [PubMed] [Google Scholar]
- 67.Lander ES, Linton LM, Birren B, Nusbaum C, Zody MC, Baldwin J, Devon K, Dewar K, Doyle M, FitzHugh W, et al. (2001). Initial sequencing and analysis of the human genome. Nature 409, 860–921. 10.1038/35057062. [DOI] [PubMed] [Google Scholar]
- 68.Ruby JG, Jan CH, and Bartel DP (2007). Intronic microRNA precursors that bypass Drosha processing. Nature 448, 83–86. 10.1038/nature05983. [DOI] [PMC free article] [PubMed] [Google Scholar]
- 69.Zhang Y, Tian Y, Chen Q, Chen D, Zhai Z, and Shu HB (2007). TTDN1 is a Plk1-interacting protein involved in maintenance of cell cycle integrity. Cell Mol Life Sci 64, 632–640. 10.1007/s00018-007-6501-8. [DOI] [PMC free article] [PubMed] [Google Scholar]
- 70.Verta JP, and Jacobs A (2022). The role of alternative splicing in adaptation and evolution. Trends Ecol Evol 37, 299–308. 10.1016/j.tree.2021.11.010. [DOI] [PubMed] [Google Scholar]
- 71.Frumkin I, Yofe I, Bar-Ziv R, Gurvich Y, Lu YY, Voichek Y, Towers R, Schirman D, Krebber H, and Pilpel Y (2019). Evolution of intron splicing towards optimized gene expression is based on various Cis- and Trans-molecular mechanisms. PLoS Biol 17, e3000423. 10.1371/journal.pbio.3000423. [DOI] [PMC free article] [PubMed] [Google Scholar]
- 72.Sowa ME, Bennett EJ, Gygi SP, and Harper JW (2009). Defining the human deubiquitinating enzyme interaction landscape. Cell 138, 389–403. 10.1016/j.cell.2009.04.042. [DOI] [PMC free article] [PubMed] [Google Scholar]
- 73.Gradia SD, Ishida JP, Tsai MS, Jeans C, Tainer JA, and Fuss JO (2017). MacroBac: New Technologies for Robust and Efficient Large-Scale Production of Recombinant Multiprotein Complexes. Methods Enzymol 592, 1–26. 10.1016/bs.mie.2017.03.008. [DOI] [PMC free article] [PubMed] [Google Scholar]
- 74.Dango S, Mosammaparast N, Sowa ME, Xiong LJ, Wu F, Park K, Rubin M, Gygi S, Harper JW, and Shi Y (2011). DNA unwinding by ASCC3 helicase is coupled to ALKBH3-dependent DNA alkylation repair and cancer cell proliferation. Mol Cell 44, 373–384. 10.1016/j.molcel.2011.08.039. [DOI] [PMC free article] [PubMed] [Google Scholar]
- 75.Soll JM, Brickner JR, Mudge MC, and Mosammaparast N (2018). RNA ligase-like domain in activating signal cointegrator 1 complex subunit 1 (ASCC1) regulates ASCC complex function during alkylation damage. J Biol Chem 293, 13524–13533. 10.1074/jbc.RA117.000114. [DOI] [PMC free article] [PubMed] [Google Scholar]
- 76.Mosammaparast N, Kim H, Laurent B, Zhao Y, Lim HJ, Majid MC, Dango S, Luo Y, Hempel K, Sowa ME, et al. (2013). The histone demethylase LSD1/KDM1A promotes the DNA damage response. The Journal of cell biology 203, 457–470. 10.1083/jcb.201302092. [DOI] [PMC free article] [PubMed] [Google Scholar]
- 77.Christian DL, Wu DY, Martin JR, Moore JR, Liu YR, Clemens AW, Nettles SA, Kirkland NM, Papouin T, Hill CA, et al. (2020). DNMT3A Haploinsufficiency Results in Behavioral Deficits and Global Epigenomic Dysregulation Shared across Neurodevelopmental Disorders. Cell Rep 33, 108416. 10.1016/j.celrep.2020.108416. [DOI] [PMC free article] [PubMed] [Google Scholar]
- 78.Dobin A, Davis CA, Schlesinger F, Drenkow J, Zaleski C, Jha S, Batut P, Chaisson M, and Gingeras TR (2013). STAR: ultrafast universal RNA-seq aligner. Bioinformatics 29, 15–21. 10.1093/bioinformatics/bts635. [DOI] [PMC free article] [PubMed] [Google Scholar]
- 79.Liao Y, Smyth GK, and Shi W (2014). featureCounts: an efficient general purpose program for assigning sequence reads to genomic features. Bioinformatics 30, 923–930. 10.1093/bioinformatics/btt656. [DOI] [PubMed] [Google Scholar]
- 80.Patro R, Duggal G, Love MI, Irizarry RA, and Kingsford C (2017). Salmon provides fast and bias-aware quantification of transcript expression. Nat Methods 14, 417–419. 10.1038/nmeth.4197. [DOI] [PMC free article] [PubMed] [Google Scholar]
- 81.Wang L, Wang S, and Li W (2012). RSeQC: quality control of RNA-seq experiments. Bioinformatics 28, 2184–2185. 10.1093/bioinformatics/bts356. [DOI] [PubMed] [Google Scholar]
- 82.Robinson MD, McCarthy DJ, and Smyth GK (2010). edgeR: a Bioconductor package for differential expression analysis of digital gene expression data. Bioinformatics 26, 139–140. 10.1093/bioinformatics/btp616. [DOI] [PMC free article] [PubMed] [Google Scholar]
- 83.Ritchie ME, Phipson B, Wu D, Hu Y, Law CW, Shi W, and Smyth GK (2015). limma powers differential expression analyses for RNA-sequencing and microarray studies. Nucleic Acids Res 43, e47. 10.1093/nar/gkv007. [DOI] [PMC free article] [PubMed] [Google Scholar]
- 84.Liu R, Holik AZ, Su S, Jansz N, Chen K, Leong HS, Blewitt ME, Asselin-Labat ML, Smyth GK, and Ritchie ME (2015). Why weight? Modelling sample and observational level variability improves power in RNA-seq analyses. Nucleic Acids Res 43, e97. 10.1093/nar/gkv412. [DOI] [PMC free article] [PubMed] [Google Scholar]
- 85.Luo W, Friedman MS, Shedden K, Hankenson KD, and Woolf PJ (2009). GAGE: generally applicable gene set enrichment for pathway analysis. BMC Bioinformatics 10, 161. 10.1186/1471-2105-10-161. [DOI] [PMC free article] [PubMed] [Google Scholar]
- 86.Shen S, Park JW, Lu ZX, Lin L, Henry MD, Wu YN, Zhou Q, and Xing Y (2014). rMATS: robust and flexible detection of differential alternative splicing from replicate RNA-Seq data. Proc Natl Acad Sci U S A 111, E5593–5601. 10.1073/pnas.1419161111. [DOI] [PMC free article] [PubMed] [Google Scholar]
- 87.Reimer KA, Mimoso CA, Adelman K, and Neugebauer KM (2021). Cotranscriptional splicing regulates 3’ end cleavage during mammalian erythropoiesis. Mol Cell 81, 998–1012 e1017. 10.1016/j.molcel.2020.12.018. [DOI] [PMC free article] [PubMed] [Google Scholar]
- 88.Zhao Y, Mudge MC, Soll JM, Rodrigues RB, Byrum AK, Schwarzkopf EA, Bradstreet TR, Gygi SP, Edelson BT, and Mosammaparast N (2018). OTUD4 Is a Phospho-Activated K63 Deubiquitinase that Regulates MyD88-Dependent Signaling. Mol Cell 69, 505–516 e505. 10.1016/j.molcel.2018.01.009. [DOI] [PMC free article] [PubMed] [Google Scholar]
- 89.Maloney SE, Yuede CM, Creeley CE, Williams SL, Huffman JN, Taylor GT, Noguchi KN, and Wozniak DF (2019). Repeated neonatal isoflurane exposures in the mouse induce apoptotic degenerative changes in the brain and relatively mild long-term behavioral deficits. Sci Rep 9, 2779. 10.1038/s41598-019-39174-6. [DOI] [PMC free article] [PubMed] [Google Scholar]
- 90.Cheng C, Deng PY, Ikeuchi Y, Yuede C, Li D, Rensing N, Huang J, Baldridge D, Maloney SE, Dougherty JD, et al. (2018). Characterization of a Mouse Model of Borjeson-Forssman-Lehmann Syndrome. Cell Rep 25, 1404–1414 e1406. 10.1016/j.celrep.2018.10.043. [DOI] [PMC free article] [PubMed] [Google Scholar]
- 91.Cheng C (2018). A Mouse Model of Börjeson-Forssman-Lehmann Syndrome reveals a potential link with Autism Spectrum Disorder (Washington University in St. Louis). [Google Scholar]
Associated Data
This section collects any data citations, data availability statements, or supplementary materials included in this article.
Supplementary Materials
Table S1. Summary of proteomics data for TTDN1/MPLKIP interactors purified from HeLa-S cells, related to Figure 1. Unique and total peptide numbers are shown for two independent runs.
Table S2. Summary of proteomics data for DBR1 and control (GFP) interactors, related to Figure 2. Unique and total peptide numbers are shown (Sheet 1); sum intensities are also provided (Sheet 2).
Table S3. Summary of proteomics data for DBR1 and control (vector only) interactors, purified from control or TTDN1 KO cells, related to Figure 2. Unique and total peptide numbers are shown for two independent runs.
Data Availability Statement
RNA-seq (including PRO-seq) data has been deposited at GEO and are publicly available as of the date of publication. Proteomics data has been deposite at PRIDE and are publicly available as of the date of publication. The accession numbers are listed in the key resources table. All other data generated in this study have been deposited at Mendeley and are publicly available as of the date of publication. The DOI is listed in the key resources table.
All original code has been deposited at Zenodo and is publicly available as of the date of publication. DOIs are listed in the key resources table.
Any additional information required to reanalyze the data reported in this paper is available from the lead contact upon reasonable request.
| REAGENT or RESOURCE | SOURCE | IDENTIFIER |
|---|---|---|
| Antibodies | ||
| TTDN1 (Rabbit) | Novus | CAT#NBP2-31718 |
| DBR1 (Rabbit) | Invitrogen | CAT#PA5-57244; RRID:AB_2640394 |
| GAPDH (Rabbit) | Abcam | CAT#ab9485; RRID:AB_307275 |
| Flag (Rabbit) | Sigma | CAT#F7425; RRID:AB_439687 |
| HA (Mouse) | BioLegend | CAT#901501; RRID:AB_2565006 |
| AQR (Rabbit) | Bethyl Labs | CAT#A302-546A; RRID:AB_1998969 |
| XAB2 (Rabbit) | Bethyl Labs | CAT#A303-638A; RRID:AB_11205112 |
| ZNF830 (Rabbit) | Bethyl Labs | CAT#A301-419A; RRID:AB_960966 |
| PRP8 (Rabbit) | Bethyl | CAT#A303-922A; RRID:AB_2620271 |
| PRP19 (Rabbit) | Sigma | CAT#SAB4501215; RRID:AB_10745273 |
| PRP43 (Rabbit) | Abcam | CAT#ab254591 RRID:AB_2892059 |
| SF3A1 (Rabbit) | Bethyl Labs | CAT#A301-601A; RRID:AB_1078817 |
| IgG (Rabbit) | Santa Cruz | CAT#sc-2027; RRID:AB_737197 |
| Chemicals, peptides, recombinant proteins | ||
| GST | (Soll et al., 2018) | N/A |
| GST-TTDN1 | This study | N/A |
| GST-TTDN1-Aro>Ala | This study | N/A |
| GST-ASCC1 | (Soll et al., 2018) | N/A |
| Flag-MBP-TTDN1-mCherry | This study | N/A |
| Flag-MBP-TTDN1-Aro>Ala-mCherry | This study | N/A |
| mCherry | Biovision | 4993 |
| His-prp-DBR1-GFP | This study | N/A |
| His-Flag-DBR1 | This study | N/A |
| His-AQR | This study | N/A |
| Recombinant intron binding complex (IBC) | This study | N/A |
| Murine Rnase Inhibitor | NEB | M0314L |
| Rnase-free Dnase | Qiagen | 79256 |
| Flag peptide | Sigma | F3290 |
| Anti-Flag M2 agarose beads | Sigma | A2220 |
| Anti-HA agarose beads | Santa Cruz | sc-7392 AC |
| Anti-mCherry Nanobody Affinity Gel | Biolegend | 689502 |
| Pladienolide-B | Cayman Chemical Company | 16538 |
| Puromycin | Sigma | P8833 |
| Blasticidin S | Sigma | 15205 |
| Protease & phosphatase inhibitor cocktail | Thermo Fisher Scientific | A32961 |
| Ni-NTA beads | Qiagen | 88221 |
| Hoechst 33342 | BD Bioscience | 561908 |
| ProLong Gold | Invitrogen | P36930 |
| Critical Commercial Assays | ||
| miRNeasy mini kit | Qiagen | 217004 |
| High capacity cDNA synthesis kit | Thermo Fisher Scientific | 4368814 |
| SYBR Green JumpStart Taq Ready Mix | Sigma | S9194 |
| SuperScript VILO cDNA synthesis kit | Thermo Fisher Scientific | 11754050 |
| DreamTaq Green PCR Master Mix | Thermo Fisher Scientific | KK1081 |
| Deposited Data | ||
| RNA sequencing data | This paper | GEO (Accession: GSE233383) |
| Proteomics data | This paper | PRIDE (Accession: PXD042563, PXD042580, PXD042581) |
| Source images and original blots | This paper | Mendeley (DOI: 10.17632/prgb7kwjz8.1) |
| Experimental models: Cell lines | ||
| 293T | ATCC | N/A |
| HeLa-S | ATCC | N/A |
| U2OS | ATCC | N/A |
| U2OS TTDN1 KO | This study | N/A |
| HeLa-S TTDN1 KO | This study | N/A |
| U2OS WT/WT | This study | N/A |
| U2OS Ala/KO | This study | N/A |
| HeLa-S DBR1 KO | This study | N/A |
| Fibroblast: Male TTDN1 2BP DEL, 187GG | Coriell Institute for Medical Research | GM06331 |
| Fibroblast: Female TTDN1 2BP DEL, 187GG | Coriell Institute for Medical Research | GM06332 |
| Fibroblast: Female TTDN1 2BP DEL, 187GG | Coriell Institute for Medical Research | GM06333 |
| Fibroblast: Female unaffected | Coriell Institute for Medical Research | GM016648 |
| Fibroblast: male unaffected | Coriell Institute for Medical Research | GM016650 |
| Experimental models: Mouse | ||
| Ttdn1 Δ/Δ | This Study | N/A |
| Ttdn1 M143V/M143V | This Study | N/A |
| Oligonucleotides | ||
| POU6F2 (forward): 5’-CAAGCATCCATGTCTCAAAGTC-3’ | IDT | N/A |
| POU6F2 (reverse): 5’-ATTAACCCCATCCACCTCAC-3’ | IDT | N/A |
| TLL1 (forward): 5’-AAAGAAGTGATGAAGAGAGTTACATTG-3’ | IDT | N/A |
| TLL1 (reverse): 5’-GCCGATAGAGATTGCCTGAG-3’ | IDT | N/A |
| BCR (forward): 5’-AATGGCTGAGAAGTGCTGT-3’ | IDT | N/A |
| BCR (reverse): 5’-CTTGTAGAGCAGAGTTTCCAGAG-3’ | IDT | N/A |
| DHRS2 (forward): 5’-TGAGACCATCACCAAGCG-3’ | IDT | N/A |
| DHRS2 (reverse): 5’-TCACAGAAAGCCTAGCACAG-3’ | IDT | N/A |
| MLPH (forward): 5’-CGGAAGTGCCAAGGTCATC-3’ | IDT | N/A |
| MLPH (reverse): 5’-GTTCTCCATCCTCATCTGTCTG-3’ | IDT | N/A |
| SRGN (forward): 5’-GAAGCTACTCAAATGCAGTCG-3’ | IDT | N/A |
| SRGN (reverse): 5’-ACCCATTGGTACCTGGCT-3’ | IDT | N/A |
| STMN2 (forward): 5’-CCACGAACTTTAGCTTCTCCA-3’ | IDT | N/A |
| STMN2 (reverse): 5’-GCCAATTGTTTCAGCACCTG-3’ | IDT | N/A |
| β-actin (forward): 5’-CCAACCGCGAGAAGATGA-3’ | IDT | N/A |
| β-actin (reverse): 5’-CCAGAGGCGTACAGGGATAG-3’ | IDT | N/A |
| UBA1–1st run (forward): 5’-GGCTTCCCCACTTCCAG-3’ | IDT | N/A |
| UBA1–1st run (reverse): 5’-GAAGTGAGGGAGGGAGG-3’ | IDT | N/A |
| UBA1–2nd run (forward): 5’- CTGTGCGCCTTGTACTT-3’ | IDT | N/A |
| UBA1–2nd run (reverse): 5’-TCTTACACTTAGGCATGCAAC-3’ | IDT | N/A |
| RPL29–1st run (forward): 5’- GGTATTTCCACATTTGAGGTTG-3’ | IDT | N/A |
| RPL29–1st run (reverse): 5’-AGGAATTGCAGGCTTTGG-3’ | IDT | N/A |
| RPL29–2nd run (forward): 5’-ATGCTGTCTTTAGAATGCTGG-3’ | IDT | N/A |
| RPL29–2nd run (reverse): 5’-GCCAGTTAGGCTGTGC-3’ | IDT | N/A |
| Recombinant DNA | ||
| pET-28a-Flag-DBR1 | This study | N/A |
| pFastBac-GST-TTDN1 | This study | N/A |
| pGEX-ASCC1 | (Soll et al., 2018) | N/A |
| pGEX-TTDN1 | This study | N/A |
| pGEX-TTDN1-Aro>Ala | This study | N/A |
| MacroBac438-Flag-MBP-TTDN1-mCherry | This study | N/A |
| MacroBac438-Flag-MBP-TTDN1-Aro>Ala-mCherry | This study | N/A |
| His-prp-DBR1-GFP | This study | N/A |
| His-AQR | This study | N/A |
| pHAGE-3xHA-GFP | This study | N/A |
| pHAGE-3xHA-TTDN1 | This study | N/A |
| pHAGE-Flag-TTDN1 | This study | N/A |
| pHAGE-Flag-TTDN1 NΔ20 | This study | N/A |
| pHAGE-Flag-TTDN1 NΔ60 | This study | N/A |
| pHAGE-Flag-TTDN1 CR1–2 | This study | N/A |
| pHAGE-Flag-TTDN1 ΔCR1–2 | This study | N/A |
| pHAGE-Flag-TTDN1 ΔCR2 | This study | N/A |
| pHAGE-Flag-TTDN1 E135K, E137K | This study | N/A |
| pHAGE-Flag-TTDN1 K141E | This study | N/A |
| pHAGE-Flag-TTDN1 E146K, D147K | This study | N/A |
| pHAGE-Flag-TTDN1 E153K | This study | N/A |
| pMSCV-Flag-HA-DBR1 | This study | N/A |
| pMSCV-Flag-HA-TTDN1 | This study | N/A |
| pHAGE-Flag-TTDN1 Aro>Ala | This study | N/A |
| pHAGE-Flag-DBR1-TTDN1 IDR | This study | N/A |
| pHAGE-Flag-AQR | This study | N/A |
| pLentiCRISPR-V2 -TTDN1 | This study | N/A |
| pLentiCRISPR-V2 -DBR1 | This study | N/A |
| pLentiCRISPR-V2 -NTC | Tsao et al., 2021 | N/A |
| Software and algorithms | ||
| ImageLab | BioRad | N/A |
| ImageJ | https://imagej.nih.gov | N/A |
| rMATS turbo v4.1.1 | https://zenodo.org/badge/latestdoi/644252407 | N/A |
| Gene length | https://zenodo.org/record/7947667 | N/A |
| Branchpoint detection algorithm | Pineda et al., 2018 | N/A |
| Photoshop | Adobe | N/A |
| GraphPad Prism | N/A | N/A |
| Stereo Investigator Software | Version 2020.2.3, MBF Bioscience, Williston, VT | N/A |
| Sequest software | Eng et al., 1994 | N/A |