

Abstract
Background
Although recent sequencing studies have revealed that 10% of childhood gliomas are caused by rare germline mutations, the role of common variants is undetermined and no genome-wide significant risk loci for pediatric central nervous system tumors have been identified to date.
Methods
Meta-analysis of 3 population-based genome-wide association studies comprising 4069 children with glioma and 8778 controls of multiple genetic ancestries. Replication was performed in a separate case–control cohort. Quantitative trait loci analyses and a transcriptome-wide association study were conducted to assess possible links with brain tissue expression across 18 628 genes.
Results
Common variants in CDKN2B-AS1 at 9p21.3 were significantly associated with astrocytoma, the most common subtype of glioma in children (rs573687, P-value of 6.974e-10, OR 1.273, 95% CI 1.179–1.374). The association was driven by low-grade astrocytoma (P-value of 3.815e-9) and exhibited unidirectional effects across all 6 genetic ancestries. For glioma overall, the association approached genome-wide significance (rs3731239, P-value of 5.411e-8), while no significant association was observed for high-grade tumors. Predicted decreased brain tissue expression of CDKN2B was significantly associated with astrocytoma (P-value of 8.090e-8).
Conclusions
In this population-based genome-wide association study meta-analysis, we identify and replicate 9p21.3 (CDKN2B-AS1) as a risk locus for childhood astrocytoma, thereby establishing the first genome-wide significant evidence of common variant predisposition in pediatric neuro-oncology. We furthermore provide a functional basis for the association by showing a possible link to decreased brain tissue CDKN2B expression and substantiate that genetic susceptibility differs between low- and high-grade astrocytoma.
Keywords: Childhood brain tumors, genetic susceptibility, glioma, GWAS, pediatric neuro-oncology
Key Points.
- 9p21.3 identified as the first common risk locus in pediatric neuro-oncology by a genome-wide association study.
- Risk variants were associated with reduced expression of the tumor suppressor gene CDKN2B.
- Genetic susceptibility differs between low- and high-grade astrocytoma in children.
Importance of the Study.
Several germline sequencing studies support that a substantial fraction of children with glioma harbor rare pathogenic variants. The role of common risk variants, however, remains undetermined and no genome-wide significant risk loci for pediatric central nervous system tumors have been reported. We performed a genome-wide association study (GWAS) meta-analysis of 3 case–control studies comprising 4069 children with glioma and 8778 controls of different genetic ancestries. Here, we show that common variants in CDKN2B-AS1 are associated with the most frequent type of childhood glioma, namely astrocytoma. The association was replicated in a separate case–control dataset. Based on a transcriptome-wide association study and quantitative trait loci analyses, we present a functional basis for the reported association by decreased brain tissue expression of the neighboring CDKN2B tumor suppressor gene. Through broad international collaboration, this population-based GWAS provides the first genome-wide significant evidence of common variant predisposition in pediatric neuro-oncology.
Glioma is the most common type of central nervous system (CNS) tumor in children, with the subtype astrocytoma making up the vast majority (~80%).1 The last decade has brought major insights into glioma molecular biology. Still, our understanding of the etiology of childhood glioma is incomplete. Empirical observations indicate significant unexplained heritability,2 while studies of non-genetic risk factors, other than iatrogenic ionizing radiation, have not identified underlying causes.3
We have previously shown that rare high-penetrance pathogenic germline variants in known cancer genes explain at least 10% of childhood glioma.4,5 Whether and to what degree childhood glioma risk may be influenced by common variants has been less extensively investigated. Genome-wide association studies (GWASs) have uncovered several risk loci for adult glioma,6–18 which in combination explain ~30% of the proportion in incidence variance attributable to genetic factors.7,19 However, adult and childhood glioma differ markedly both in tumor molecular biology and clinical course. Therefore, direct transferability of adult findings may be questioned.
GWASs have led to deeper understanding of genetic risk across most common diseases where large cohorts are available.20 Due to the rarity of pediatric CNS tumors, GWASs in the field have generally been underpowered and no genome-wide significant risk associations have been identified. Potential approaches to overcome this challenge include international collaboration and meta-analyses of multiple cohorts. Here, we present our US-Scandinavian population-based GWAS meta-analysis comprising 4069 children (<15 years) with glioma and 8778 controls (Figure 1).
Figure 1.

Overview of the included cohorts, genetic ancestries, and genotyping arrays used.
Material and Methods
US Cases and Controls
Californian glioma cases and controls (ncases = 3150, ncontrols = 3154) were selected from the California Childhood Cancer Record Linkage Project, a matched case–control study previously described in detail.21 In short, cases were born in California between 1982 and 2009, with a primary glioma diagnosis made before the age of 15 years registered from 1988 to 2011. California-born cancer-free controls were matched to cases based on date of birth, sex, and self-reported maternal race and/or ethnicity via the California Vital Statistics records. A total of 3150 cases and 3154 controls were included; European-Americans (ncases = 1583, ncontrols = 1592), African-Americans (ncases = 215, ncontrols = 217,), Latino-Americans (ncases = 1208, ncontrols = 1222), and Asian-Americans (ncases = 238, ncontrols = 245). Archived neonatal dried blood spot samples for cases and controls were provided by the California Biobank Program (CBP SIS#311). DNA extraction and processing were performed on the Affymetrix Axiom Precision Medicine Diversity Array. Affymetrix Powertools were used to make genotype calls as previously described.22 This study was approved by the State of California Committee for the Protection of Human Subjects, the University of Southern California, and University of California, Berkeley review board (CPHS IRB Project number 15-05-2005).
Swedish Cases and Controls
The Swedish cohort was taken from our previous GWAS of glioma in children, adolescents, and young adults,23 restricted to cases ≤15 years (ncases = 352). In brief, children diagnosed with glioma from 1976 to 2004 were identified through the Swedish Cancer Registry and archived neonatal dried blood spot samples were collected from the Swedish Phenylketonuria Screening Registry. Histopathological diagnoses were available from the Swedish Pediatric Brain Tumor Quality Registry. For controls, we included Swedish population-based control subjects from a previous GWAS of adult glioma (the Glioma International Case–Control Study, ncontrols = 874).7 Procedures for DNA extraction, whole-genome amplification and genotyping using the Illumina BeadChips (Illumina, San Diego, CA, USA) have previously been described in detail.7,23,24 HumanOmni2.5Exome and Infinium OncoArray-500K were used for genotyping of cases and controls, respectively. This study was approved by the Regional Ethical Review Board in Umea (06-025M, 06-124M) and the Swedish Ethical Review Authority (2019-06408).
Danish Cases and Controls
Archived neonatal dried blood spot samples were retrieved for all children born in Denmark registered with glioma before the age of 15 years in the Danish Childhood Cancer Registry25 from 1985 to 2017 (ncases=567). Registry diagnosis data were cross-validated using the Danish National Pathology Registry. Controls (ncontrols=4750) were selected at random from an existing Danish population-based case-cohort sample (iPSYCH2015, n = 18 518) representative of the entire Danish population born in the same period, previously described in detail.26 The case–control cohort, procedures for DNA extraction, whole-genome amplification and genotyping using the Infinium Global Screening Array-24 v2.0 (Illumina, San Diego, CA, USA) have previously been described.27–29 This Danish study was reported to the Danish Data Protection Agency and approved by the Regional Health Research Ethics Committee (H-17002304)
The different cohort contributions are illustrated in Figure 1.
Diagnostic Selection Criteria
Glioma was defined according to the International Classification of Childhood Cancer (ICCC-3) category III “CNS and miscellaneous intracranial and intraspinal neoplasms” groups “b) astrocytoma,” “d) other glioma,” and “e.4) neuronal and mixed neuronal-glial tumors” and corresponding SNOMED/ICD-O-3 codes (detailed in Supplementary Methods). If SNOMED/ICD-O codes were not available, cases were included when the registered histopathology diagnosis directly corresponded with the diagnostic entities listed above. Glioma subtype and WHO grade distribution are detailed in Supplementary Table 1.
Glioma Grading and Assignment of Low- and High-Grade Status
World Health Organization (WHO) grades were retrieved from the respective disease registers, and for Danish cases also through the Danish National Pathology Registry. Low- and high-grade glioma status were assigned to tumors with reported WHO grade I–II and III–IV, respectively. For cases without registered WHO grade, grading was assigned if the tumor entity in question corresponded to a specific WHO grade, or to grade intervals I–II or III–IV, as per the WHO Classification of CNS tumors summarized by Louis et al.30,31
Subject and Variant Filtering, Imputation, and Phasing
Quality control was performed using PLINK1.932 and a customized common pipeline for all three cohorts and is detailed in Supplementary Methods and Figure 1. The term genetic ancestry refers to each of the 6 included population groups (ie, Swedes, Danes, European-, African-, Asian-, and Latino-Americans) after the exclusion of genetic outliers identified by principal component (PC) analysis. When combined, European Americans, Swedes, and Danes are referred to as individuals of European descent. Protocols for imputation and phasing are described in detail in Supplementary Methods.
Statistics
Regression analyses were performed using PLINK2,33 and were done separately for the Danish cohort, the Swedish cohort, and the US subcohorts including European-, Latino-, Asian- and African-American, respectively. Sex and significant PCs were included as covariates. PCs were calculated separately for each independently analyzed tumor subtype. The meta-analysis was performed both by random-effect modeling using metafor34 and with a fixed-effect model using METAL.35 We performed 2 separate meta-analyses; one limited to cohorts of European descent (Swedish and Danish samples together with European–Americans from the US cohort, ncases= 2473 and ncontrols = 7183) and one for all 4069 cases and 8778 controls of all genetic ancestries combined. In the following, results from the fixed-effect model are presented, while random-effect model results are available in Supplementary Figures 2B–T and Tables 11–12. Conditional analysis was performed by including the genotype of lead variant in the regression model. Results from each cohort were then meta-analyzed. Genome-wide significant associations were defined by P-values of <5e-8.
Replication
Replication was performed in a separate germline genetic dataset (ncases = 270; 210 low-grade and 54 high-grade gliomas, ncontrols = 2080) including cases from the Children’s Brain Tumor Network study, the Gabriella Miller Kids First study (BASIC3), the Pacific Pediatric Neuro-Oncology Consortium36 and controls from the Glioma International Case–Control Study.24 A formal replication P-value of .05 was used for the single detected genome-wide significant locus. As an exploratory investigation, variants with P-values of <1e-5 in the meta-analysis also underwent targeted lookup in the replication cohort. Replication was restricted to findings from the meta-analysis of cases and controls of European descent, as the replication cohort consisted of European individuals. Additional details are provided in Supplementary Methods.
A secondary comparative analysis of genome-wide significant findings in children of European descent with astrocytoma was performed in nonoverlapping cases from a separate population-based Danish germline WGS cohort of children diagnosed with astrocytoma years 2016–2021 (n = 54) previously described in detail5 Population-based controls from the Danish GWAS cohort (n = 4750) were used for this analysis due to the lack of a suitable separate control-cohort.
Transcriptome-Wide Association Study
As the effects of individual single nucleotide polymorphisms (SNPs) can be low and hard to detect, a gene-based transcriptome-wide association study was performed using pre-calculated expression models from The Genotype-Tissue Expression V8 project37 (further detailed in Supplementary Methods). Any gene exhibiting expression associated with the phenotype with a Bonferroni adjusted P-value, accounting for all 18 628 tested genes, below .05 was considered significant.
GWAS-quantitative Trait Loci Colocalization Analyses
Colocalization analyses were performed to investigate correlations between genome-wide association signals at 9p21.3 and brain tissue expression of nearby genes (CDKN2B and CDKN2A) and splice QTLs (sQTL) responsible for alternative mRNA splicing events of nearby genes. Colocalization of the results from the current study with that of adult glioma for the CDKN2B-AS1 locus was also investigated. Full details are provided in Supplementary Methods.
Gene Set Enrichment Analysis
Functional interaction, gene set (GSEA) and gene ontology (GO) enrichment analyses were performed for genes with variants with P-values of <1e-5 using the String Database (String-dB v.11),38 the GO knowledgebase39 and the Molecular Signature Database (MSigDB).40 The reported P-values were corrected for multiple comparisons using the Benjamini-Hochberg procedure by the respective analysis tools.
Ethics
This study was approved by the relevant data protection and research ethics committee systems of the respective involved academic institutions (detailed for each cohort above).
Data Availability
Summary statistics of this study may be made available at reasonable request from the corresponding authors. The raw genotype data are not publicly available due to data privacy legislation applicable in the 3 participating study locations (the US [California], Sweden & Denmark).
Results
A total of 11 212 017 variants were analyzed across 3998 children with glioma and 8233 controls passing quality control.
CDKN2B-AS1 Association
Meta-analysis of the 3 independent cohorts revealed 36 variants, all mapping to CDKN2B-AS1 at 9p21.3, to be significantly associated with childhood astrocytoma (P-values of <5e-8) (Figures 2 and 3 and Supplementary Table 2). The association signal was led by rs573687 (P-value of 6.974e-10, OR 1.273, 95% CI 1.179–1.374) and was tailed by the 2 known adult glioma risk variants, rs634537 (P-value of 5.349e-9) and rs2157719 (P-value 5.809e-9). Conditional analysis did not support multiple independent associations within the locus (Supplementary Figure 3). With few exceptions, genome-wide significant variants mapping to 9p21.3 exhibited unidirectional effects for astrocytoma across all genetic ancestries (Supplementary Table 2).
Figure 2.
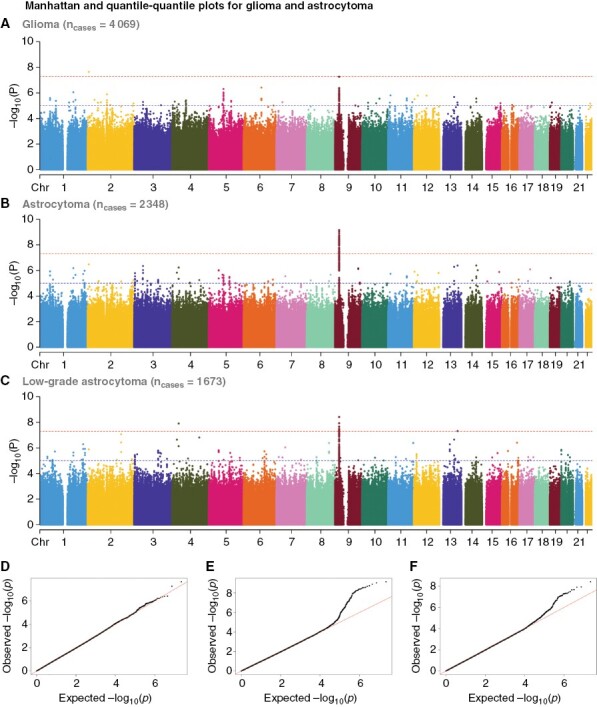
Association plots for glioma, astrocytoma, and low-grade astrocytoma. Manhattan and quantile–quantile plots–plots for children with glioma (A–D), astrocytoma (B–E), and low-grade astrocytoma (C–F).
Figure 3.

Detailed locus plot for the 9p21.3 astrocytoma association. (A) Locus plot detailing the 9p21.3 region with detected variants colored by degree of linkage disequilibrium with the lead single nucleotide polymorphism rs573687. (B) Tentative biological mechanism behind the observed genotype–phenotype association.
Further stratification by WHO grade and tumor type revealed that the observed CDKN2B-AS1 signal was significant also for low-grade glioma (P-value of 2.087e-8, OR 1.254, 95% CI 1.158–1.357, Supplementary Figure 2 E and Table 9 E) and driven by low-grade astrocytoma (P-value of 3.815e-9, OR 1.294, 95% CI 1.187–1.409, Figure 2). Near genome-wide significant association was also seen for pilocytic and optic pathway glioma (P-value of 5.036e-8, OR 1.298, 1.182–1.426, Supplementary Figure 2Q and Supplementary Table 9I). The same direction and magnitude were apparent for glioma overall (lead variant: rs3731239, P-value of 5.411e-8, OR 1.197, 95% CI 1.122–1.277, Figure 2 and Supplementary Table 9A).
Notably, no genome-wide significant variants mapping to the 9p21.3 (CDKN2A/B/B-AS1) locus were observed for high-grade glioma in general, nor for high-grade astrocytoma or glioblastoma when analyzed separately (Supplementary Figure 2I–M and Table 9C—F–G). The detected CDKN2B-AS1 variants exhibited significant colocalization with previously reported adult glioma risk SNPs within the same locus (Supplementary Figure 6). No findings were made in any of the other 26 risk loci established for adult glioma7(Supplementary Table 13), not even when applying a more liberal P-value cutoff of <1e-5.
Stratification by Genetic Ancestry, Age, Sex, and Tumor Location
Assuming that European–Americans and Scandinavians (Swedes and Danes) represented a group with relatively more genetic homogeneity, we restricted analyses to individuals of these populations (ncases = 2473, ncontrols = 7183 combined)—in the following referred to as of European descent. The CDKN2B-AS1 association signal was also found significant for astrocytoma cases of European descent alone (rs2811713, P-value of 3.356e-9, OR 1.299, 95% CI 1.191–1.416). The mean Δminor allele frequency between cases and controls for the associated CDKN2B-AS1 variants (P-values of < 5e-8) was significantly higher for individuals of European compared to those of non-European descent (African-, Latino-, and Asian–American, ncases = 1596, ncontrols = 1595 combined) (mean Δminor allele frequency 0.041 vs. 0.029, P-value of <.001, Mann–Whitney U test, Supplementary Tables 3 and 4), although all 6 groups exhibited unidirectional association effects. Bonferroni-corrected pairwise comparison of children of European descent with Latino- and Asian–Americans also showed significant differences (P-values of <.001), but not for African–Americans (P-value = .392). The CDKN2B-AS1 association was furthermore significant for children of European descent with low-grade astrocytoma, for whom 2 ABCD3 variants also exhibited P-values of <5e-8 (Supplementary Table 10D).
No other genome-significant associations with unidirectional effects were observed for the subset of European descent alone (Supplementary Table 10A). Restricting the meta-analysis to cases of non-European descent did not result in any significant associations (Supplementary Figure 2U).
Higher age at diagnosis was observed for females homozygous for the lead rs573687 variant (G/G) but only in 1 out of the 3 cohorts. No other differences were seen when stratifying genotype by age of onset, sex, or tumor location (Supplementary Figures 4–5). Performing the meta-analysis based on fixed- and mixed-effect models returned highly comparable results (Supplementary Figures 2A–U).
Replication
Variants from the discovery cohort with P-values of <1e-5 were evaluated for consistency of association in an independent case–control cohort including 270 European children with glioma and 2080 controls. Eight out of 139 variants with P-values of <1e-5 identified for children of European descent with glioma in the meta-analysis were associated with glioma risk in the replication cohort. Of these, all but one were located in CDKN2B-AS1, making this the only confidently replicated association. The CDKN2B-AS1 association was also significantly replicated when restricting the replication to children with low-grade glioma (Supplementary Tables 5A–C). Further subtype stratification of the primary replication cohort was not possible due to the level of diagnostic data.
All genome-wide significant variants in children of European descent with astrocytoma mapping to CDKN2B-AS1 were furthermore compared and successfully replicated in a separate Danish astrocytoma cohort (Supplementary Tables 6A–B). The only other genome-wide significant findings in the latter group, 2 ABCD3 variants with meta-analysis P-values of <5e-8 for low-grade astrocytoma, were not found to be significantly associated in the second comparative analysis.
Transcriptome-Wide Association Study
A transcriptome-wide association (TWAS) study was performed for glioma and glioma subtypes using gene expression models from 13 types of brain tissue and summary statistics from the cross-ancestry fixed-effect meta-analysis. Single tissue TWASs were then integrated into one on account of similarities of gene expression between the tissues. Of the 18 628 genes tested, only CDKN2B exhibited significant association between case status and predicted brain tissue expression. Similar to the CDKN2B-AS1 GWAS finding, the decreased CDKN2B expression in brain tissue identified by our TWAS was associated with astrocytoma in childhood (P-value 8.09e-8, mean z-score −5.37). Several other genes (NUTM2D for all glioma, UBN2 for glioblastoma, MEIOC for low-grade gliomas) also had Bonferroni-corrected P-values of <.05, however, exhibited nonuniform effect directionality across the tested individual tissues (Supplementary Table 7). CDKN2B-AS1 was not included in the pre-calculated expression models and its expression was therefore not available for testing in the TWAS.
Quantitative Trait Loci Colocalization Analyses
To further investigate potential correlation between the genome-wide significant CDKN2B-AS1 variants and brain tissue expression quantitative trait loci (eQTLs) within the CDKN2B–CDKN2A tumor suppressor gene cluster, a colocalization analysis was performed (Supplementary Figures 7–20). High probability of a shared functional SNP was seen with CDKN2B eQTLs in cerebral cortex (0.94, Figure 4 and Supplementary Figure 7), while significant colocalization was also evident in the dorsolateral prefrontal cortex (0.86, Supplementary Figure 11). The most significant GWAS association signals for astrocytoma thus coincide with eQTLs for CDKN2B, indicating an association between decreased cerebral CDKN2B mRNA levels and childhood astrocytoma. Of note, no colocalization was seen when comparing GWAS variants with CDKN2B eQTLs for blood (0.00, Supplementary Figure 9) and no significant colocalization was seen for CDKN2A (Supplementary Figures 21–34).
Figure 4.
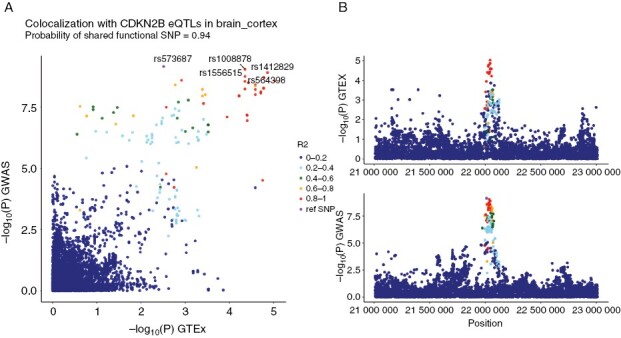
Colocalization between genome-wide significant CDKN2B-AS1 variants and CDKN2B brain tissue eQTLs. (A) Y-axis: meta-analysis P-values; X-axis: P-values for eQTLs from GTEx for brain cortex tissue for CDKN2B. The 5 single nucleotide polymorphisms (SNPs) with the lowest meta-analysis P-values are labeled. SNPs are colored with r2 relative to the lead SNP rs573687. (B) Y-axis: P-values from GTEx eQTLs and meta-analysis, respectively; X-axis: Position on chromosome 9.
When investigating potential links between CDKN2B-AS1 variants from our GWAS and SNPs known to significantly affect alternative mRNA splicing in brain tissue (sQTLs), the only tissue having significant sQTLs for CDKN2B-AS1 was the pituitary (Figure 5A). Here, the sQTL for the 21995161–22046751 (GRCh38) exon–exon junction in CDKN2B-AS1 was shown to colocalize with genome-wide significant variants with a probability of 77%. The top 5 GWAS variants all reside within this genomic region. Comparing the effects from the GWAS variants with P-values of <1e-5 with the sQTL in pituitary tissue, the variants uniformly coincide with either a positive or negative effect on the intron excision ratio for this exon–exon junction (Figure 5B).
Figure 5.

Colocalization between genome-wide significant CDKN2B-AS1 variants and sQTLs in pituitary tissue. (A) Y-axis: Meta-analysis P-values; X-axis: P-values for sQTLs from GTEx pituitary tissue for CDKN2B-AS1 exon–exon junction 21995161-22046751. The 5 single nucleotide polymorphisms (SNPs) with lowest meta-analysis P-values are labeled. SNPs are colored with r2 relative to the lead SNP rs573687. (B) Y-axis: Meta-analysis effect (Beta); X-axis: Slope for sQTL. The plot only includes SNPs with meta-analysis P-value of <1e-5. SNPs are colored according to meta-analysis P-values.
Gene Enrichment Analyses
To identify biological pathways underlying glioma risk caused by common germline variants, we performed a gene enrichment analysis for genes with variants with P-values of <1e-5 using String-dB. For glioma overall, enrichment of genes binding to nuclear factor-κB (P-valueBenjamini-Hochberg-adjusted (adj) of .0085) and to the p53 family of proteins (P-valueadj of .0417) was observed, while the WNT signaling pathway was enriched for low-grade astrocytoma (P-valueadj of .0202)—all of which were corroborated by subsequent GO and gene set enrichment analyses.
Furthermore, GO analysis revealed distal axonal cellular component enrichment for high-grade astrocytoma genes (P-valueadj of .021), while pilocytic astrocytoma, oligodendroglioma, and glioblastoma genes showed increased brain tissue expression (P-valueadj of .0148, .0028, and .0375, respectively) in String-dB. Overview of tested genes and full GSEA and GO results are available in Supplementary Tables 8A–C.
Discussion
In this population-based GWAS, meta-analysis we associated common variants in CDKN2B-AS1 at 9p21.3 with development of astrocytoma in children and replicated this finding in two separate case–control cohorts. Finally, we provide a potential functional basis for the association by showing a possible link to decreased brain tissue CDKN2B expression.
CDKN2B-AS1, also known as ANRIL, is a long noncoding RNA located within the CDKN2B–CDKN2A tumor suppressor gene cluster. Its functional RNA molecule promotes epigenetic silencing of CDKN2B and CDKN2A through interactions with polycomb repressive complexes 1 and 2. Rare germline 9p21.3 structural deletions, spanning the entire CDKN2B-AS1 gene, have been reported to cause melanoma-astrocytoma syndrome in children.41 Also, common variants in the same locus are well known to be associated with glioma risk in adults.42 Candidate gene studies have reported association between genetic variants in 9p21.3 and risk of childhood brain tumors, including glioma.23,43 However, previous studies in children and young adults have not been powered for genome-wide significant discoveries.
It is well established that gliomas in children differ somatically fundamentally from their adult counterparts.44 Still, our findings indicate both similarities and discrepancies between common variant associated risk of glioma in children and adults. On one side, the CDKN2B-AS1 variants detected in our study exhibited significant colocalization with adult glioma risk variants within the same locus. On the contrary, there is a relative overabundance with 27 different risk loci established for adults.7 The latter may result from higher detection power due to larger sample sizes. However, most risk variants associated with adult glioma were primarily found in case–control cohorts no larger in size than the meta-analysis presented here. Several possible explanations for the higher number of risk loci for adult glioma exist. The larger molecular heterogeneity of adult glioma may reflect a more diverse etiology, at least when compared to low-grade astrocytoma in children. Differences in heritability patterns, with a larger role for low-effect size common variants and rare high-penetrance heritability in adult glioma and childhood glioma, respectively, could also be a contributing factor. While only a few percent of adult gliomas are believed to be caused by rare germline variants,45 we have recently reported such findings in at least 10% of children with glioma.4,5 Also, segregation studies have previously found polygenic models to best account for the incidence pattern of adult glioma,46 an observation which may further be corroborated by the adult glioma GWAS findings as recently reviewed by Ostrom et al.47
Childhood gliomas differ markedly in molecular biology from their adult counterparts. Still, in studies of adult glioma, common 9p21.3 risk variants have been found to be specific for tumors without IDHI mutations48,49 and independent of somatic homozygous loss of the 9p21.3 locus,50 2 somatic aberrations which are extremely rare in childhood glioma.44,51
Recently, Ali et al.52 used an in vitro model of adult glioma to show a proposed link between common genetic variants in the CDKN2B-AS1 risk locus and increased expression of CDKN2B-AS1. Our investigations of CDKN2B-AS1 levels in brain tissue are limited by the low expression of this gene, but indicated a possible relation between glioma risk variants and levels of different CDKN2B-AS1 splicing variants. We also found an association between glioma risk variants and a decreased expression of the tumor suppressor CDKN2B, which is in line with another recent study that identified CDKN2B as a likely target gene for many of the glioma risk variants in this locus.53 Based on the above observations, we speculate that the increased risk of glioma in carriers of CDKN2B-AS1 risk variants is caused by the lower level of tumor suppressor CDKN2B (Figure 3B), either mediated by a direct effect on CDKN2B expression or indirectly by effects on CDKN2B-AS1 expression and/or splicing.
The CDKN2B-AS1 association was significant for children with astrocytoma, but did not reach genome-wide significance for glioma overall. As glioma constituted a larger combined sample size, this observation most likely reflects increased diagnostic heterogeneity. The complete absence of 9p21.3 variants, even when employing a more liberal P-value cutoff of <1e-5 among children with high-grade glioma is also worth noting. This supports the notion that low- and high-grade glioma in children are distinct diagnostic entities with differences also in molecular etiology. A similar pattern of differences in genetic predisposition between high- and low-grade glioma in children has also been reported for germline risk attributable to rare highly penetrant pathogenic variants.54 The lack of risk loci at CDKN2B-AS1 in high-grade pediatric glioma also highlights the difference between high-grade glioma in children and adults, as CDKN2B-AS1 risk variants have been shown to mediate larger effect sizes for glioblastoma than lower-grade gliomas in adults.7
Although CDKN2B-AS1 variants associated with astrocytoma exhibited unilateral effects across all 6 genetic ancestries, the mean difference in case–control allele frequencies was significantly higher among children of European descent. Moreover, the CDKN2B-AS1 association signal was genome-wide significant for all genetic ancestries combined and for children of European descent alone, but not when limited to those of non-European descent. The minor allele frequency reported by gnomAD for our lead variant (rs573687) is also notably higher for European populations (39%) compared to Asians–, Latinos–, and African–Americans (<20%).55 These observations may contribute to the excess incidence of glioma in children of European genetic ancestry.56
A key strength of this multinational study is its population-based design, which minimizes the risk of selection bias. The meta-analysis of three separate cohorts including 6 different genetic ancestries furthermore adds to its robustness and the validity of our findings. The fact that ~40% of the overall case sample was composed of individuals of non-European descent increases the generalizability of our results. Our results are further strengthened by their detection across several different genotyping platforms and more importantly by their subsequent replication in a separate case–control cohort. Moreover, our TWAS and QTL analysis findings provide a tentative explanatory biological mechanism.
Our finding of a risk locus at 9p21.3 that is largely driven by low-grade astrocytoma highlights that future studies in this field should benefit from more detailed tumor diagnostics, which unfortunately, were not available in this study as its 30-year inclusion was based on historical disease registries. In particular, replication of our findings across recently defined childhood glioma molecular subtypes is recommended to investigate whether CDKN2B-AS1-related risk is shared or specific to certain sub-entities. Glioma, even when limited to astrocytoma, comprises several molecular subtypes which might have negatively affected the homogeneity of the case sample. Conversely, the majority of low-grade gliomas, which represent the largest tumor subtype category, are somatically characterized by upregulation of the same RAS/MAP kinase pathway even when histopathologically distinct.51 Although several updates to the classification of CNS tumors have been made over the last 3 decades, we do not expect this to have had a major impact on our overall results as most of the adjustments pertain to subtype specifications (eg, H3K27M status), and not alterations in-between major tumor type categories. On the other hand, availability of such modern tumor classification data would have made stratification based on more homogenous molecular subtypes possible.
In summary, this cross-ancestry population-based GWAS meta-analysis of 4069 children with glioma and 8778 controls identifies and replicates 9p21.3 (CDKN2B-AS1) as a risk locus for childhood astrocytoma. This is the first genome-wide significant association of common variants with pediatric CNS tumor risk. We also suggest a functional basis for the reported association through decreased brain tissue CDKN2B expression. Our findings substantiate that genetic susceptibility differs between low- and high-grade astrocytoma.
Supplementary Material
Contributor Information
Jon Foss-Skiftesvik, Department of Neurosurgery, Rigshospitalet University Hospital, Copenhagen, Denmark; Department of Pediatrics and Adolescent Medicine, Rigshospitalet University Hospital, Copenhagen, Denmark; Section for Neonatal Genetics, Statens Serum Institute, Copenhagen, Denmark.
Shaobo Li, Center for Genetic Epidemiology, Department of Population and Public Health Sciences, University of Southern California, Los Angeles, California, USA.
Adam Rosenbaum, Department of Radiation Sciences, Oncology, Umeå University, Umeå, Sweden.
Christian Munch Hagen, Section for Neonatal Genetics, Statens Serum Institute, Copenhagen, Denmark.
Ulrik Kristoffer Stoltze, Department of Pediatrics and Adolescent Medicine, Rigshospitalet University Hospital, Copenhagen, Denmark; Department of Clinical Genetics, Rigshospitalet University Hospital, Copenhagen, Denmark.
Sally Ljungqvist, Department of Radiation Sciences, Oncology, Umeå University, Umeå, Sweden.
Ulf Hjalmars, Department of Radiation Sciences, Oncology, Umeå University, Umeå, Sweden.
Kjeld Schmiegelow, Department of Pediatrics and Adolescent Medicine, Rigshospitalet University Hospital, Copenhagen, Denmark.
Libby Morimoto, Center for Personalized Medicine, Children’s Hospital of Los Angeles, Los Angeles, California, USA.
Adam J de Smith, Center for Genetic Epidemiology, Department of Population and Public Health Sciences, University of Southern California, Los Angeles, California, USA.
René Mathiasen, Department of Pediatrics and Adolescent Medicine, Rigshospitalet University Hospital, Copenhagen, Denmark.
Catherine Metayer, School of Public Health, University of California, Berkeley, Berkeley, California, USA.
David Hougaard, Section for Neonatal Genetics, Statens Serum Institute, Copenhagen, Denmark.
Beatrice Melin, Department of Radiation Sciences, Oncology, Umeå University, Umeå, Sweden.
Kyle M Walsh, Division of Neuro-Epidemiology, Department of Neurosurgery, Duke University, Durham, North Carolina, USA.
Jonas Bybjerg-Grauholm, Section for Neonatal Genetics, Statens Serum Institute, Copenhagen, Denmark.
Anna M Dahlin, Department of Radiation Sciences, Oncology, Umeå University, Umeå, Sweden.
Joseph L Wiemels, Center for Genetic Epidemiology, Department of Population and Public Health Sciences, University of Southern California, Los Angeles, California, USA.
Funding and acknowledgments
JFS, UKS, RM, and KS were supported by the Danish Cancer Society (R-257-A14720), the Danish Childhood Cancer Foundation (2019-5934), and the Danish Childhood Brain Tumor Foundation. The study was also supported by the Dagmar Marshall Foundation (JFS), the Harboe Foundation (JFS), the Swedish Childhood Cancer Fund (BM & AMD), the Cancer Research Foundation in Northern Sweden (BM, AMD, & AR), the Swedish Research Council (BM), the Swedish Cancer Foundation (BM), and NCI grant R01CA139020/CA/NCI (BM). California genotyping was funded by the National Cancer Institute (NCI) of National Institutes of Health (NIH) R01CA194189 to JLW and KMW. The content is solely the responsibility of the authors and does not necessarily represent the official views of the National Institutes of Health. The collection of cancer incidence data used in this study was supported by the California Department of Public Health as part of the statewide cancer reporting program mandated by California Health and Safety Code Section 103885; the National Cancer Institute’s Surveillance, Epidemiology and End Results Program under contract HHSN261201000140C awarded to the Cancer Prevention Institute of California, contract HHSN261201000035C awarded to the University of Southern California, and contract HHSN261201000034C awarded to the Public Health Institute; and the Centers for Disease Control and Prevention’s National Program of Cancer Registries, under agreement U58DP003862-01 awarded to the California Department of Public Health. The biospecimens and/or data used in this study (for California data) were obtained from the California Biobank Program, (SIS request #311), Section 6555(b), 17 CCR. The California Department of Public Health is not responsible for the results or conclusions drawn by the authors of this publication. SNIC/UPPMAX: Computations were enabled by resources in project sens2021508 provided by the Swedish National Infrastructure for Computing (SNIC) at UPPMAX, partially funded by the Swedish Research Council through grant agreement no. 2018-05973.
GICC: The results published here include data generated by the Glioma International Case–Control Study established by the Gliogene Consortium and funded by NCI (R01CA139020) (dbGaP accession number phs001319.v1.p1).
CBTN/PNOC: This research was conducted using data made available by The Children’s Brain Tumor Tissue Consortium (CBTTC).
BASIC3: Data utilized from the Incorporation of Genomic Sequencing into Pediatric Cancer Care study (phs001683) was funded by NHGRI/NCI grant U01HG006485 performed at Baylor College of Medicine. Additional data used in this analysis was generated by the Gabriella Miller Kids First Pediatric Research Program projects (phs001878), and was accessed from the Kids First Data Resource Portal (https://kidsfirstdrc.org/) and/or dbGaP (www.ncbi.nlm.nih.gov/gap)
HRC: Results in this study were generated using data from the Haplotype Reference Consortium (EGA accession number EGAD00001002729).
GTEx: This project utilized data from the Genotype-Tissue Expression project, supported by the Common Fund of the Office of the Director of the National Institutes of Health, and by NCI, National Human Genome Research Institute (NHGRI), National Heart, Lung, and Blood Institute (NHLBI), National Institute on Drug Abuse (NIDA), National Institute of Mental Health (NIMH), and National Institute of Neurological Disorders and Stroke (NINDS).
CommonMind consortium: Data were generated as part of the CommonMind Consortium supported by funding from Takeda Pharmaceuticals Company Limited, F. Hoffman-La Roche Ltd and NIH grants R01MH085542, R01MH093725, P50MH066392, P50MH080405, R01MH097276, RO1-MH-075916, P50M096891, P50MH084053S1, R37MH057881, AG02219, AG05138, MH06692, R01MH110921, R01MH109677, R01MH109897, U01MH103392, and contract HHSN271201300031C through IRP NIMH. Brain tissue for the study was obtained from the following brain bank collections: The Mount Sinai NIH Brain and Tissue Repository, the University of Pennsylvania Alzheimer’s Disease Core Center, the University of Pittsburgh NeuroBioBank and Brain and Tissue Repositories, and the NIMH Human Brain Collection Core. CMC Leadership: Panos Roussos, Joseph Buxbaum, Andrew Chess, Schahram Akbarian, Vahram Haroutunian (Icahn School of Medicine at Mount Sinai), Bernie Devlin, David Lewis (University of Pittsburgh), Raquel Gur, Chang-Gyu Hahn (University of Pennsylvania), Enrico Domenici (University of Trento), Mette A. Peters, Solveig Sieberts (Sage Bionetworks), Thomas Lehner, Stefano Marenco, Barbara K. Lipska (NIMH).
Conflicts of Interest
None to declare.
Author Contribution
Conceptualization & design of the meta-analysis: JFS, AMD, JLW, SL, JBG. Sample & data acquisition SL, JFS, AR, CMH, UKS, SLj, UH, CMM, LM, DH, JBG, AMD, JLW. Bioinformatic analyses: SL, CMH, AR, AMD, UKS, JFS. Interpretation of data: All authors. Drafting of the manuscript: JFS, UKS, SL, AR, AMD, JBG, JLW. All authors contributed to and approved the final manuscript.
References
- 1. Ostrom QT, De Blank PM, Kruchko C, et al. Alex’s Lemonade stand foundation infant and childhood primary brain and central nervous system tumors diagnosed in the United States in 2007-2011. Neuro-Oncol. 2014;16(Suppl 10):x1–x36. [DOI] [PMC free article] [PubMed] [Google Scholar]
- 2. Hemminki K, Tretli S, Sundquist J, Johannesen TB, Granström C.. Familial risks in nervous-system tumours: A histology-specific analysis from Sweden and Norway. Lancet Oncol. 2009;10(5):481–488. [DOI] [PubMed] [Google Scholar]
- 3. Ostrom QT, Adel Fahmideh M, Cote DJ, et al. Risk factors for childhood and adult primary brain tumors. Neuro-Oncol. 2019;21(11):1357–1375. [DOI] [PMC free article] [PubMed] [Google Scholar]
- 4. Muskens IS, De Smith AJ, Zhang C, et al. Germline cancer predisposition variants and pediatric glioma: A population-based study in California. Neuro-Oncol. Published online 2020;22(6):864–874. [DOI] [PMC free article] [PubMed] [Google Scholar]
- 5. Stoltze UK, Foss-Skiftesvik J, van Overeem Hansen T, et al. Genetic predisposition & evolutionary traces of pediatric cancer risk: A prospective 5-year population-based genome sequencing study of children with CNS tumors. Neuro-Oncol. 2023;25(4):761–773. [DOI] [PMC free article] [PubMed] [Google Scholar]
- 6. Kinnersley B, Labussière M, Holroyd A, et al. Genome-wide association study identifies multiple susceptibility loci for glioma. Nat Commun. 2015;6:8559. doi: 10.1038/ncomms9559 [DOI] [PMC free article] [PubMed] [Google Scholar]
- 7. Melin BS, Barnholtz-Sloan JS, Wrensch MR, et al. ; GliomaScan Consortium. Genome-wide association study of glioma subtypes identifies specific differences in genetic susceptibility to glioblastoma and non-glioblastoma tumors. Nat Genet. 2017;49(5):789–794. [DOI] [PMC free article] [PubMed] [Google Scholar]
- 8. Rajaraman P, Melin BS, Wang Z, et al. Genome-wide association study of glioma and meta-analysis. Hum Genet. 2012;131(12):1877–1888. [DOI] [PMC free article] [PubMed] [Google Scholar]
- 9. Sanson M, Hosking FJ, Shete S, et al. Chromosome 7p11.2 (EGFR) variation influences glioma risk. Hum Mol Genet. 2011;20(14):2897–2904. [DOI] [PMC free article] [PubMed] [Google Scholar]
- 10. Shete S, Hosking FJ, Robertson LB, et al. Genome-wide association study identifies five susceptibility loci for glioma. Nat Genet. 2009;41(8):899–904. [DOI] [PMC free article] [PubMed] [Google Scholar]
- 11. Wrensch M, Jenkins RB, Chang JS, et al. Variants in the CDKN2B and RTEL1 regions are associated with high-grade glioma susceptibility. Nat Genet. 2009;41(8):905–908. [DOI] [PMC free article] [PubMed] [Google Scholar]
- 12. Walsh KM, Codd V, Smirnov IV, et al. ; ENGAGE Consortium Telomere Group. Variants near TERT and TERC influencing telomere length are associated with high-grade glioma risk. Nat Genet. 2014;46(7):731–735. [DOI] [PMC free article] [PubMed] [Google Scholar]
- 13. Chen H, Chen G, Li G, et al. Two novel genetic variants in the STK38L and RAB27A genes are associated with glioma susceptibility. Int J Cancer. 2019;145(9):2372–2382. [DOI] [PubMed] [Google Scholar]
- 14. Yanchus C, Drucker KL, Kollmeyer TM, et al. A noncoding single-nucleotide polymorphism at 8q24 drives IDH1-mutant glioma formation. Science. 2022;378(6615):68–78. [DOI] [PMC free article] [PubMed] [Google Scholar]
- 15. Yang TH, Kon M, Hung JH, DeLisi C.. Combinations of newly confirmed Glioma-Associated loci link regions on chromosomes 1 and 9 to increased disease risk. BMC Med Genomics. 2011;4(1):63. [DOI] [PMC free article] [PubMed] [Google Scholar]
- 16. Eckel-Passow JE, Drucker KL, Kollmeyer TM, et al. Adult diffuse glioma GWAS by molecular subtype identifies variants in D2HGDH and FAM20C. Neuro-Oncol. 2020;22(11):1602–1613. [DOI] [PMC free article] [PubMed] [Google Scholar]
- 17. Ostrom QT, Kinnersley B, Armstrong G, et al. ; GliomaScan consortium. Age-specific genome-wide association study in glioblastoma identifies increased proportion of ’lower grade glioma’-like features associated with younger age. Int J Cancer. 2018;143(10):2359–2366. [DOI] [PMC free article] [PubMed] [Google Scholar]
- 18. Ostrom QT, Kinnersley B, Wrensch MR, et al. ; GliomaScan consortium. Sex-specific glioma genome-wide association study identifies new risk locus at 3p21.31 in females, and finds sex-differences in risk at 8q24.21. Sci Rep. 2018;8(1):7352. [DOI] [PMC free article] [PubMed] [Google Scholar]
- 19. Kinnersley B, Mitchell JS, Gousias K, et al. Quantifying the heritability of glioma using genome-wide complex trait analysis. Sci Rep. 2015;5:17267. doi: 10.1038/srep17267 [DOI] [PMC free article] [PubMed] [Google Scholar]
- 20. Visscher PM, Wray NR, Zhang Q, et al. 10 years of GWAS discovery: Biology, function, and translation. Am J Hum Genet. 2017;101(1):5–22. [DOI] [PMC free article] [PubMed] [Google Scholar]
- 21. Zhang C, Ostrom QT, Semmes EC, et al. ; Glioma International Case-Control Study (GICC). Genetic predisposition to longer telomere length and risk of childhood, adolescent and adult-onset ependymoma. Acta Neuropathol Commun. 2020;8(1):173. [DOI] [PMC free article] [PubMed] [Google Scholar]
- 22. Zhang C, Ostrom QT, Hansen HM, et al. European genetic ancestry associated with risk of childhood ependymoma. Neuro-Oncol. 2020;22(11):1637–1646. [DOI] [PMC free article] [PubMed] [Google Scholar]
- 23. Dahlin AM, Wibom C, Andersson U, et al. Genetic variants in the 9p21.3 locus associated with glioma risk in children, adolescents, and young adults: a case-control study. Cancer Epidemiol Biomarkers Prev. 2019;28(7):1252–1258. [DOI] [PubMed] [Google Scholar]
- 24. Amirian ES, Armstrong GN, Zhou R, et al. The Glioma international case-control study: A report from the Genetic Epidemiology of Glioma International Consortium. Am J Epidemiol. 2016;183(2):85–91. [DOI] [PMC free article] [PubMed] [Google Scholar]
- 25. Schrøder H, Rechnitzer C, Wehner PS, et al. Danish childhood cancer registry. Clin Epidemiol. 2016;8:461–464. doi: 10.2147/CLEP.S99508 [DOI] [PMC free article] [PubMed] [Google Scholar]
- 26. Pedersen CB, Bybjerg-Grauholm J, Pedersen MG, et al. The iPSYCH2012 case–cohort sample: New directions for unravelling genetic and environmental architectures of severe mental disorders. Mol Psychiatry. 2018;23(1):6–14. [DOI] [PMC free article] [PubMed] [Google Scholar]
- 27. Hollegaard MV, Grauholm J, Børglum A, et al. Genome-wide scans using archived neonatal dried blood spot samples. BMC Genomics. 2009;10:297. doi: 10.1186/1471-2164-10-297 [DOI] [PMC free article] [PubMed] [Google Scholar]
- 28. Bækvad-Hansen M, Bybjerg-Grauholm J, Poulsen JB, et al. Evaluation of whole genome amplified DNA to decrease material expenditure and increase quality. Mol Genet Metab Rep. 2017;11:36–45. doi: 10.1016/j.ymgmr.2017.04.002 [DOI] [PMC free article] [PubMed] [Google Scholar]
- 29. Foss-Skiftesvik J, Hagen CM, Mathiasen R, et al. Genome-wide association study across pediatric central nervous system tumors implicates shared predisposition and points to 1q25.2 (PAPPA2) and 11p12 (LRRC4C) as novel candidate susceptibility loci. Childs Nerv Syst. 2021;37(3):819–830. [DOI] [PubMed] [Google Scholar]
- 30. Louis DN, Perry A, Reifenberger G, et al. The 2016 World Health Organization classification of tumors of the central nervous system: A summary. Acta Neuropathol. 2016;131(6):803–820. [DOI] [PubMed] [Google Scholar]
- 31. Louis DN, Ohgaki H, Wiestler OD, et al. The 2007 WHO classification of tumours of the central nervous system. Acta Neuropathol. 2007;114(2):97–109. [DOI] [PMC free article] [PubMed] [Google Scholar]
- 32. Purcell S, Neale B, Todd-Brown K, et al. PLINK: a tool set for whole-genome association and population-based linkage analyses. Am J Hum Genet. 2007;81(3):559–575. [DOI] [PMC free article] [PubMed] [Google Scholar]
- 33. Chang CC, Chow CC, Tellier LC, et al. Second-generation PLINK: Rising to the challenge of larger and richer datasets. GigaScience. 2015;4(1):7. [DOI] [PMC free article] [PubMed] [Google Scholar]
- 34. Viechtbauer W. Conducting meta-analyses in R with the metafor package. J Stat Softw. 2010;36(3):1–48. [Google Scholar]
- 35. Willer CJ, Li Y, Abecasis GR.. METAL: fast and efficient meta-analysis of genomewide association scans. Bioinformatics. 2010;26(17):2190–2191. [DOI] [PMC free article] [PubMed] [Google Scholar]
- 36. Felmeister AS, Masino AJ, Rivera TJ, Resnick AC, Pennington JW.. The biorepository portal toolkit: an honest brokered, modular service oriented software tool set for biospecimen-driven translational research. BMC Genomics. 2016;17(Suppl 4):434. [DOI] [PMC free article] [PubMed] [Google Scholar]
- 37. Barbeira AN, Bonazzola R, Gamazon ER, et al. ; GTEx GWAS Working Group. Exploiting the GTEx resources to decipher the mechanisms at GWAS loci. Genome Biol. 2021;22(1):49. [DOI] [PMC free article] [PubMed] [Google Scholar]
- 38. Szklarczyk D, Gable AL, Lyon D, et al. STRING v11: Protein-protein association networks with increased coverage, supporting functional discovery in genome-wide experimental datasets. Nucleic Acids Res. 2019;47(D1):D607–D613. [DOI] [PMC free article] [PubMed] [Google Scholar]
- 39. Gene Ontology Consortium. The Gene Ontology resource: Enriching a GOld mine. Nucleic Acids Res. 2021;49(D1):D325–D334. doi: 10.1093/nar/gkaa1113 [DOI] [PMC free article] [PubMed] [Google Scholar]
- 40. Subramanian A, Tamayo P, Mootha VK, et al. Gene set enrichment analysis: a knowledge-based approach for interpreting genome-wide expression profiles. Proc Natl Acad Sci U S A. 2005;102(43):15545–15550. [DOI] [PMC free article] [PubMed] [Google Scholar]
- 41. Jensen MR, Stoltze U, Hansen TVO, et al. 9p21.3 Microdeletion involving CDKN2A/2B in a young patient with multiple primary cancers and review of the literature. Cold Spring Harb Mol Case Stud. 2022;8(4):a006164. [DOI] [PMC free article] [PubMed] [Google Scholar]
- 42. Kinnersley B, Houlston RS, Bondy ML.. Genome-wide association studies in glioma. Cancer Epidemiol Biomarkers Prev. 2018;27(4):418–428. [DOI] [PMC free article] [PubMed] [Google Scholar]
- 43. Adel Fahmideh M, Lavebratt C, Schüz J, et al. CCDC26, CDKN2BAS, RTEL1 and TERT Polymorphisms in pediatric brain tumor susceptibility. Carcinogenesis. 2015;36(8):876–882. [DOI] [PubMed] [Google Scholar]
- 44. Sturm D, Pfister SM, Jones DTW.. Pediatric gliomas: current concepts on diagnosis, biology, and clinical management. J Clin Oncol. 2017;35(21):2370–2377. [DOI] [PubMed] [Google Scholar]
- 45. Malmer B, Iselius L, Holmberg E, et al. Genetic epidemiology of glioma. Br J Cancer. 2001;84(3):429–434. [DOI] [PMC free article] [PubMed] [Google Scholar]
- 46. de Andrade M, Barnholtz JS, Amos CI, et al. Segregation analysis of cancer in families of glioma patients. Genet Epidemiol. 2001;20(2):258–270. [DOI] [PubMed] [Google Scholar]
- 47. Ostrom QT, Bauchet L, Davis FG, et al. The epidemiology of glioma in adults: A “state of the science” review. Neuro-Oncol. 2014;16(7):896–913. [DOI] [PMC free article] [PubMed] [Google Scholar]
- 48. Ghasimi S, Wibom C, Dahlin AM, et al. Genetic risk variants in the CDKN2A/B, RTEL1 and EGFR genes are associated with somatic biomarkers in glioma. J Neurooncol. 2016;127(3):483–492. [DOI] [PMC free article] [PubMed] [Google Scholar]
- 49. Wu WYY, Johansson G, Wibom C, et al. The genetic architecture of gliomagenesis-genetic risk variants linked to specific molecular subtypes. Cancers. 2019;11(12):2001E2001. [DOI] [PMC free article] [PubMed] [Google Scholar]
- 50. Di Stefano AL, Enciso-Mora V, Marie Y, et al. Association between glioma susceptibility loci and tumour pathology defines specific molecular etiologies. Neuro-Oncol. 2013;15(5):542–547. [DOI] [PMC free article] [PubMed] [Google Scholar]
- 51. Ryall S, Zapotocky M, Fukuoka K, et al. Integrated molecular and clinical analysis of 1,000 pediatric low-grade gliomas. Cancer Cell. 2020;37(4):569–583.e5. [DOI] [PMC free article] [PubMed] [Google Scholar]
- 52. Ali MW, Patro CPK, Devall M, et al. A functional variant on 9p21.3 related to glioma risk affects enhancer activity and modulates expression of CDKN2B-AS1. Hum Mutat. 2021;42(10):1208–1214. [DOI] [PMC free article] [PubMed] [Google Scholar]
- 53. Gazal S, Weissbrod O, Hormozdiari F, et al. Combining SNP-to-gene linking strategies to identify disease genes and assess disease omnigenicity. Nat Genet. 2022;54(6):827–836. [DOI] [PMC free article] [PubMed] [Google Scholar]
- 54. Muskens IS, Zhang C, de Smith AJ, et al. Germline genetic landscape of pediatric central nervous system tumors. Neuro Oncol. 2019;21(11):1376–1388. [DOI] [PMC free article] [PubMed] [Google Scholar]
- 55. Karczewski KJ, Francioli LC, Tiao G, et al. ; Genome Aggregation Database Consortium. The mutational constraint spectrum quantified from variation in 141,456 humans. Nature. 2020;581(7809):434–443. [DOI] [PMC free article] [PubMed] [Google Scholar]
- 56. Muskens IS, Feng Q, Francis SS, et al. Pediatric glioma and medulloblastoma risk and population demographics: A Poisson regression analysis. Neurooncol Adv. 2020;2(1):vdaa089. [DOI] [PMC free article] [PubMed] [Google Scholar]
Associated Data
This section collects any data citations, data availability statements, or supplementary materials included in this article.
Supplementary Materials
Data Availability Statement
Summary statistics of this study may be made available at reasonable request from the corresponding authors. The raw genotype data are not publicly available due to data privacy legislation applicable in the 3 participating study locations (the US [California], Sweden & Denmark).