Abstract
In recent years, tractography based on diffusion magnetic resonance imaging (dMRI) has become a popular tool for studying microstructural changes resulting from brain diseases like Parkinson’s Disease (PD). Quantitative anisotropy (QA) is a parameter that is used in deterministic fiber tracking as a measure of connection between brain regions. It remains unclear, however, if microstructural changes caused by lesioning the median forebrain bundle (MFB) to create a Parkinsonian rat model can be resolved using tractography based on ex-vivo diffusion MRI. This study aims to fill this gap and enable future mechanistic research on structural changes of the whole brain network rodent models of PD. Specifically, it evaluated the ability of correlational tractography to detect structural changes in the MFB of 6-hydroxydopamine (6-OHDA) lesioned rats. The findings reveal that correlational tractography can detect structural changes in lesioned MFB and differentiate between the 6-OHDA and control groups. Imaging results are supported by behavioral and histological evidence demonstrating that 6-OHDA lesioned rats were indeed Parkinsonian. The results suggest that QA and correlational tractography is appropriate to examine local structural changes in rodent models of neurodegenerative disease. More broadly, we expect that similar techniques may provide insight on how disease alters structure throughout the brain, and as a tool to optimize therapeutic interventions.
Keywords: Parkinson’s disease, 6-OHDA, ex-vivo magnetic resonance imaging, diffusion tensor imaging, quantitative anisotropy, deterministic tractography
I. Introduction
Parkinson’s disease (PD) is caused by degeneration of neurons in the substantia nigra parts compacta (SNc) that leads to striatal dopamine deficiency [1]. Degeneration of SNc neurons trigger motor symptoms that include bradykinesia, resting tremor, rigidity, slowness of movement, freezing of gait and non-motor symptoms sleep problems, depression, anxiety, pain, and fatigue [2].
The 6-hydroxydopamine (6-OHDA) rat model is one of the most commonly used models to study PD because injection of the neurotoxin lesions nigro-striatal dopaminergic (DA) neurons [3]. Furthermore, rats with 6-OHDA lesions experience similar motor symptoms as those seen in patients with PD. While some studies have reported changes in measures of water diffusion using diffusion tensor imaging (DTI) after 6-OHDA lesions [4], [5], it remains unclear whether tractography based on diffusion magnetic resonance imaging (dMRI) can resolve changes in structural connectivity resulting from creation of the lesion.
In this study, we utilized tractography based on ex-vivo dMRI to assess microstructural changes in rats with unilateral lesions of the median forebrain bundle (MFB) caused by 6-OHDA injection. We performed behavioral tests and qualitative histology to evaluate 6-OHDA induced Parkinsonian phenotype. We then used dMRI and correlational tractography to evaluate differences in structural connectivity between lesioned and non-lesioned rats. Our work shows, via correlational tractography, significant structural changes in nigro striatal pathway consistent with toxin injection in the MFB. Furthermore, it suggests that connectomic measures may be appropriate tools to evaluate the effects of neurodegenerative disease and subsequent therapeutic interventions on structural connectivity across the whole brain network.
II. Methods
A. Surgical Procedures
Two groups of animals were used in the study: a 6-OHDA group (n=5) and a vehicle group (n=5). The experiments in the present study were performed on adult male Long-Evans rats (313-403g). All animal procedures were reviewed and approved by the Institutional Animal Care and Use Committee (IACUC) at the University of Wisconsin-Madison. Rats were housed on a 12-hour light/dark cycle with ad libitum access to food and water. The rats were anaesthetized with isoflurane. Also, the rats received an intraperitoneal injection of 20mg/kg desipramine HCL, governed 30 min before the 6-OHDA to prevent damage to noradrenergic neurons [6]. The animals received a 6-OHDA (n=5) injection (8 μg in 4 μL of saline with 0.02% ascorbate over 8 min) into the left medial forebrain bundle (MFB). Based on the atlas [7], stereotactic injections were placed anterior-posterior (AP) − 4.3 mm, −1.6 mm lateral to the midline (ML) and − 8.6 mm (bregma) ventral to the surface of the skull (DV). After each injection, the needle was left in place for 5 min and then withdrawn slowly to prevent backtracking of the drug. Heart rate and blood oxygen saturation and body temperature were monitored throughout the surgery (PhysioSuite, Kent Scientific). A heating blanket was implemented to regulate body temperature.
B. Behavioral Tests
The forelimb use asymmetry (cylinder test) and apomorphine (APO) rotational behavior tests were performed on day 19 and 20 for the vehicle and 6-OHDA group to confirm the 6-OHDA model. A cylinder test was used for the assessment of forelimb use asymmetry for weight shifting, induced by unilateral 6-OHDA lesion, during vertical exploration [8]. This behavioral test is a commonly used for evaluating pathologic behavior in the 6-OHDA rat model. Rats were placed in a glass cylinder (160 mm in diameter and 395 mm in height) without prior acclimatization and videorecorded for 5 min. The number of wall touches during a full rear of the ipsilateral and contralateral to the 6-OHDA lesioned hemisphere, and simultaneous use of both forelimbs for contacting the wall were counted during slow-motion replay in VLC media player. Touches were quantified as a percentage of ipsilateral, contralateral, and both computed as: (ipsilateral touches)/(ipsilateral touches + contralateral touches + both)*100; (contralateral touches)/(ipsilateral touches + contralateral touches + both)*100, both/(ipsilateral touches + contralateral touches +both)*100.
The apomorphine rotational behavior test is a predictive test that is used to confirm the PD in the rat model [9],[10],[11]. During this test, it is expected that after APO injection 6-OHDA lesioned rats rotate away from the lesion side (contralateral rotations). After injection of APO or saline, rats were placed in a plexiglass open arena (303x303x303 mm), and video recorded for 30 min. The number of full ipsilateral and contralateral rotations was counted manually for each minute during slow-motion replay in VLC media player by an observer.
C. Perfusion and Histology
Perfusions were completed on the 21st day following the injection surgery. The rats were anaesthetized with isoflurane (2-5%) and sequential transcardial perfusion was made with ice-cold PBS and 4% paraformaldehyde (PFA). After fixation in 4% PFA for 48 hours, brains were washed and transferred to 1x PBS. For assessment of the 6-OHDA lesion, tyrosine hydroxylase (TH) positive expression was implemented. Tissue was cryoprotected then sectioned on a freezing microtome. Sections were washed in 1X TBS followed by antigen retrieval at 80°C in Tris-EDTA pH 9.0 and endogenous peroxidase quenching in TBS with 3% H2O2 and 10% Methanol. Sections were blocked in TBS with 0.05% Triton X-100 (TBST; Sigma-Aldrich, Burlington, MA) with 5% normal goat serum, incubated overnight in TBST with 1% bovine serum albumin (BSA; Calbiochem by Millipore Sigma, St. Louis, MO) and primary antiserum (Millipore Sigma MAB318; 1:5,000). After washes in TBST, sections were incubated in Alexa Fluor 594 secondary IgG (Invitrogen A11032; 1:750), followed by TBS rinses, mounted on gelatin coated slides and coverslipped with Prolong Gold antifade reagent with DAPI (Invitrogen by Thermo Fisher Scientific, Waltham, MA). Coronal slices were imaged using the Axio Imager Z2 microscope and ZEN 3.3 software (Carl Zeiss).
D. Diffusion Tensor Imaging and Connectomic Analysis
To assess the white matter degeneration, multi-slice, diffusion-weighted, spin echo images were obtained in the 6-OHDA lesioned and the vehicle animal brains. Brains were scanned with a 4.7 T Agilent MRI system and a 3.5-cm diameter quadrature volume RF coil. These scanning parameters were used: TR= 2500 ms, TE = 28 ms, acquisition matrix size = 128x128, FOV= 32x32, voxel size 250 microns in-plane, section thickness = 0.35 mm, NEX = 2, two shell acquisition with 10 directions at b=0 s/mm2, 25 directions at b=816 s/mm2, and 50 directions at b=2,041 s/mm2. Matrix = 128 × 128 reconstructed to 256 × 256 for an isotropic voxel size of 0.25 mm over two signal averages (Δ=12.20 ms, δ=6 ms). All imaging was performed in a temperature-controlled room with imaging performed between 20-21°C. Raw data files were converted to NIFTY(Neuroimaging Informatics Technology Initiative) format for use with the DTI-TK software package and eddy currents were calculated for image correction.
A connectomety database was created from the diffusion MRI scans of each animal in DSI Studio. The diffusion data were reconstructed using generalized q-sampling imaging [12] with a diffusion sampling length ratio of 0.2. QA was extracted as the local connectome fingerprint [13] and used in the connectometry analysis. A nonparametric Spearman correlation was used to derive the correlation between the two groups. A T-score threshold of 2.5 was assigned and tracked using a deterministic fiber tracking algorithm [14] to obtain correlational tractography. A seeding region was placed at whole brain (36,69,24). The tracks were filtered by topology-informed pruning [15] with 4 iteration(s). An FDR threshold of 0.05 was used to select tracks. To estimate the false discovery rate, a total of 4000 randomized permutations were applied to the group label to obtain the null distribution of the track length.
III. Results
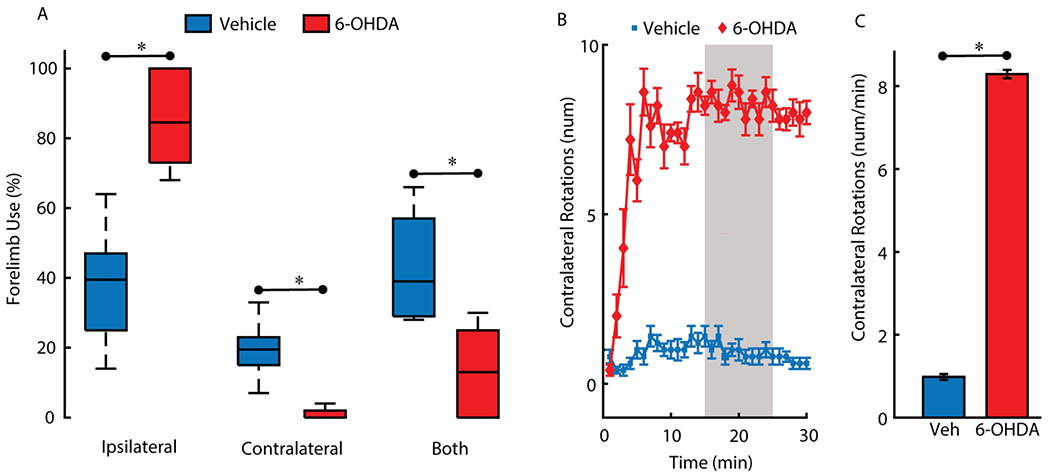
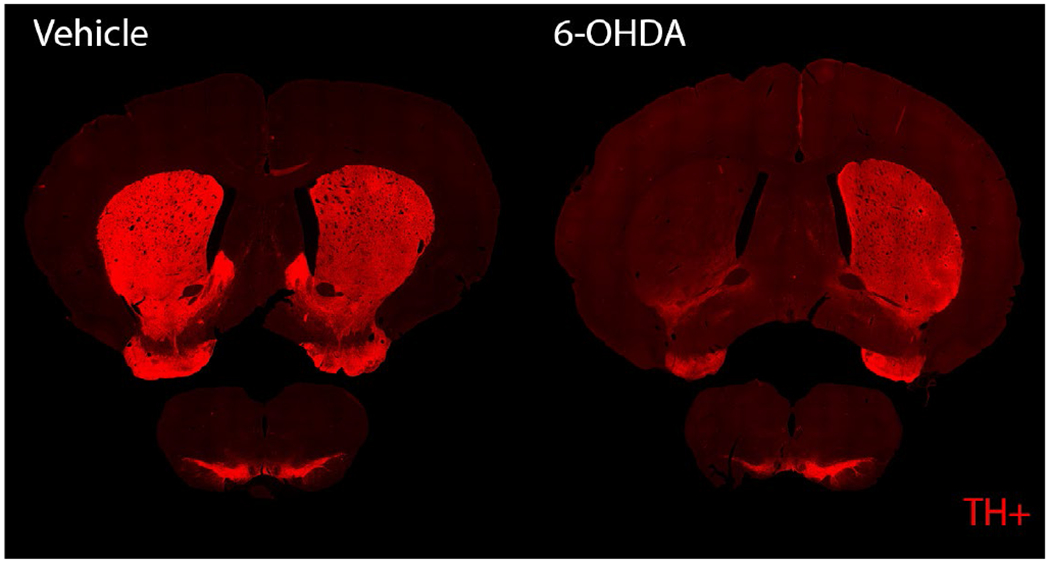
Here we focus on quantifying the effects on structural brain networks resulting from the creation of a Parkinsonian animal model. Two behavioral assays and histological examination of the brain were used to verify creation of the Parkinsonian model. Limb use changed significantly in the 6-OHDA lesioned cohort compared to the vehicle cohort. Figure 1A demonstrates that 6-OHDA lesioned animals had a significant decrease in the proportion of contralateral and both forelimb use ( *p<0.005 - two-sided Wilcoxon rank sum test), and a significant increase in the proportion of ipsilateral forelimb use (*p <0.005- two-sided Wilcoxon rank sum test) compared to vehicle. Similarly, in the PO test, contralateral rotations per minute were plotted against time (Fig 1B). The peak rotational rate was compared in 10 min interval between 15-25 min (Fig 1C). The APO test indicates significantly higher rotational speed in the 6-OHDA group (Fig 1C; p < 0.005, Two-sample t-test) compared to the vehicle group (apomorphine dose 0.1 mg/kg). Differences in behavior were corroborated by qualitative histology. Sections through the striatum and SNc from 6-OHDA lesioned and vehicle groups were examined for the presence of dopaminergic neurons via TH staining (see Fig 2 for representative sample). The number of neurons stained by TH were drastically reduced in the 6-OHDA group compared to vehicle.
Fig. 1.

Behavioral Tests. A) Forelimb use asymmetry test. Percentage ipsilateral, contralateral, and both paw touches for the vehicle and the 6-OHDA groups. Data represented as median, lower/upper quartiles, and extremities, repeated measures of two-sided Wilcoxon rank sum test, indicating greater ipsilateral limb-use in the 6-OHDA group (p<0.005), and less use contralateral and both limbs in the 6-OHDA lesioned animals (p<0.005). B) Rotation curves for the vehicle (Veh) and the 6-OHDA group after receiving 0.1mg/kg apomorphine (APO). Each curve represents the mean rotational speed and standard error of mean (+/− SEM) per minute for 30 min period. C) The peak rotational rate comparison demonstrating greater contralateral rotations per minute in the 6-OHDA group (*p<0.005).
Fig. 2.

Coronal slices of the striatum (top) and SNc (bottom). Histology results show substantial reduction of DA neurons in the striatum and SNc of the 6-OHDA group based on TH positive representation (red fluorescence).
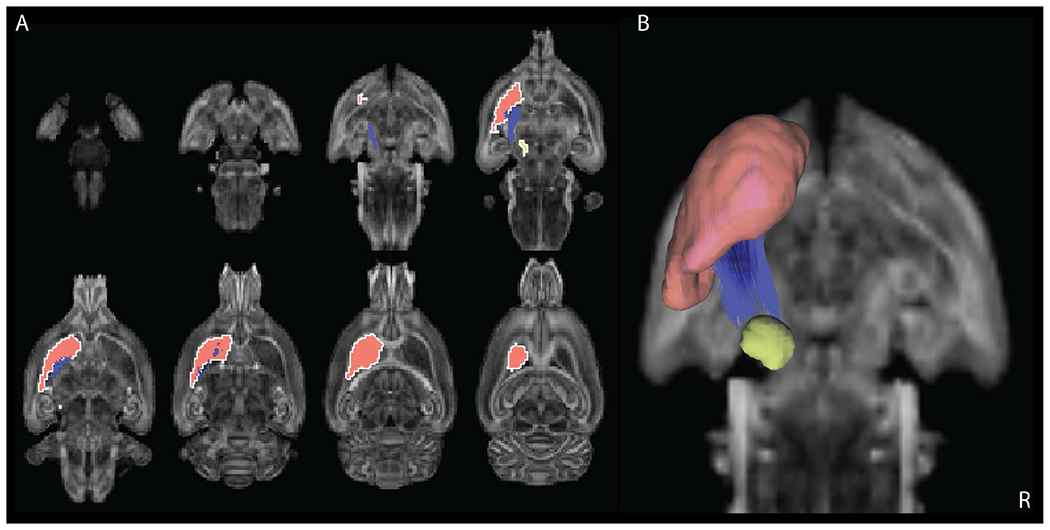
Diffusion MRI connectometry [16] was used to derive the local connectome fingerprint for each group. Correlational tractography found a significant negative correlation (FDR < 0.05, preserving a P < 0.05 significance threshold) between the 6-OHDA and vehicle cohorts in the QA of fibers (Fig3, blue fibers) that directly connect the SNc and striatum (Fig 3, yellow and red regions). This is consistent with the location of the lesioned MFB.
Fig. 3.

Tracks (blue lines) with QA negatively correlated with group variable (FDR <= 0.05). A and B) Slices through the averaged brain showing location of negatively correlated tracks with respect to the striatum (red region) and substantia nigra pars compacta (yellow region).
IV. Discussion
This work demonstrates the ability of correlational tractography to detect structural changes in the basal ganglia following disruption of the MFB via injection of 6-OHDA. Estimation of local structural connectivity via QA and correlational tractography showed differences in QA between the 6-OHDA and vehicle groups. This finding was corroborated using standard behavioral and histological assays suggesting that 6-OHDA injection caused perturbation consistent with a > 96% depletion of DA neurons of ipsilateral MFB [8]. Taken together, these results highlight the ability of tractography to sense the perturbation of local brain networks resulting from creation of a lesion. More broadly, we expect that these techniques could be expanded to examine changes in structural connectivity throughout the brain. Importantly, similar techniques have been employed in human subjects on readily available 3T MRI scanners [13, 16] making this a potentially translatable methodology that could be used as an early biomarker of neurodegenerative disease or as a tool to select and optimize therapeutic interventions.
Contributor Information
Mikhail Moshchin, University of Wisconsin-Madison, Madison, WI USA.
Kevin P. Cheng, University of Wisconsin-Madison, Madison, WI USA
Susan Osting, University of Wisconsin-Madison, Madison, WI USA.
Matthew Laluzerne, University of Wisconsin-Madison, Madison, WI USA.
Samuel A. Hurley, University of Wisconsin-Madison, Madison, WI USA
Ajay Paul Singh, University of Wisconsin-Madison, Madison, WI USA.
James K. Trevathan, University of Wisconsin-Madison, Madison, WI USA
Andrea Brzeczkowski, University of Wisconsin-Madison, Madison, WI USA.
John-Paul J Yu, University of Wisconsin-Madison, Madison, WI USA.
Wendell B. Lake, University of Wisconsin-Madison, Madison, WI USA
Kip A. Ludwig, University of Wisconsin-Madison, Madison, WI USA
Aaron J. Suminski, University of Wisconsin-Madison, Madison, WI USA
References
- [1].Poewe W, “Nature Reviews Disease Primers,” Nature Reviews Disease Primers, p. 52. [Google Scholar]
- [2].Lee A and Gilbert RM, “Epidemiology of Parkinson Disease,” Neurologic Clinics, vol. 34, no. 4, pp. 955–965, Nov. 2016, doi: 10.1016/j.ncl.2016.06.012. [DOI] [PubMed] [Google Scholar]
- [3].Ungerstedt U, “6-hydroxy-dopamine induced degeneration of central monoamine neurons,” European Journal of Pharmacology, vol. 5, no. 1, pp. 107–110, Dec. 1968, doi: 10.1016/0014-2999(68)90164-7 [DOI] [PubMed] [Google Scholar]
- [4].Soria G, Aguilar E, Tudela R, Mullol J, Planas AM, and Marin C, “In vivo magnetic resonance imaging characterization of bilateral structural changes in experimental Parkinson’s disease: a T2 relaxometry study combined with longitudinal diffusion tensor imaging and manganese-enhanced magnetic resonance imaging in the 6-: Bilateral structural changes in a PD model,” European Journal of Neuroscience, vol. 33, no. 8, pp. 1551–1560, Apr. 2011, doi: 10.1111/j.1460-9568.2011.07639.x. [DOI] [PubMed] [Google Scholar]
- [5].Zhang W, Zhang L, Liu L, and Wang X, “Time course study of fractional anisotropy in the substantia nigra of a parkinsonian rat model induced by 6-OHDA,” Behavioural Brain Research, vol. 328, pp. 130–137, Jun. 2017, doi: 10.1016/j.bbr.2017.03.046. [DOI] [PubMed] [Google Scholar]
- [6].Breese GR and Traylor TD, “Depletion of brain noradrenaline and dopamine by 6-hydroxydopamine,” British Journal of Pharmacology, vol. 42, no. 1, pp. 88–99, May 1971, doi: 10.1111/j.1476-5381.1971.tb07089.x [DOI] [PMC free article] [PubMed] [Google Scholar]
- [7].Paxinos G, Watson C, The Rat Brain in Stereotaxic Coordinates, Compact 6th ed., Academic Press, 2006 [Google Scholar]
- [8].Schallert T and Tillerson JL, “Intervention Strategies for Degeneration of Dopamine Neurons in Parkinsonism: Optimizing Behavioral Assessment of Outcome,” in Central Nervous System Diseases, Emerich DF, Dean RL, and Sanberg PR, Eds. Totowa, NJ: Humana Press, 2000, pp. 131–151. doi: 10.1007/978-1-59259-691-1_8. [DOI] [Google Scholar]
- [9].Ungerstedt U and Arbuthnott GW, “Quantitative recording of rotational behavior in rats after 6-hydroxy-dopamine lesions of the nigrostriatal dopamine system,” Brain Research, vol. 24, no. 3, pp. 485–93, Dec. 1970, doi: 10.1016/0006-8993(70)90187-3 [DOI] [PubMed] [Google Scholar]
- [10].Schwarting RKW and Huston JP, “THE UNILATERAL 6-HYDROXYDOPAMINE LESION MODEL IN BEHAVIORAL BRAIN RESEARCH. ANALYSIS OlF FUNCTIONAL DEFICITS, RECOVERY AND TREATMENTS,” p. 57. [DOI] [PubMed] [Google Scholar]
- [11].Cenci MA and Lundblad M, “Utility of 6-Hydroxydopamine Lesioned Rats in the Preclinical Screening of Novel Treatments for Parkinson Disease,” in Animal Models of Movement Disorders, Elsevier, 2005, pp. 193–208. doi: 10.1016/B978-012088382-0/50016-5. [DOI] [Google Scholar]
- [12].Fang-Cheng Yeh, Wedeen VJ, and Tseng W-YI, “Generalized q-Sampling Imaging,” IEEE Trans. Med. Imaging, vol. 29, no. 9, pp. 1626–1635, Sep. 2010, doi: 10.1109/TMI.2010.2045126 [DOI] [PubMed] [Google Scholar]
- [13].Yeh F-C et al. , “Quantifying Differences and Similarities in Whole-Brain White Matter Architecture Using Local Connectome Fingerprints,” PLoS Comput Biol, vol. 12, no. 11, p. e1005203, Nov. 2016, doi: 10.1371/journal.pcbi.1005203 [DOI] [PMC free article] [PubMed] [Google Scholar]
- [14].Yeh F-C, Verstynen TD, Wang Y, Fernández-Miranda JC, and Tseng W-YI, “Deterministic Diffusion Fiber Tracking Improved by Quantitative Anisotropy,” PLoS ONE, vol. 8, no. 11, p. e80713, Nov. 2013, doi: 10.1371/journal.pone.0080713 [DOI] [PMC free article] [PubMed] [Google Scholar]
- [15].Yeh F-C et al. , “Automatic Removal of False Connections in Diffusion MRI Tractography Using Topology-Informed Pruning (TIP),” Neurotherapeutics, vol. 16, no. 1, pp. 52–58, Jan. 2019, doi: 10.1007/s13311-018-0663-y [DOI] [PMC free article] [PubMed] [Google Scholar]
- [16].Yeh F-C, Badre D, and Verstynen T, “Connectometry: A statistical approach harnessing the analytical potential of the local connectome,” NeuroImage, vol. 125, pp. 162–171, Jan. 2016, doi: 10.1016/j.neuroimage.2015.10.053 [DOI] [PubMed] [Google Scholar]


