Abstract
Background
Nonalcoholic fatty liver disease (NAFLD) is the main reason for cirrhosis and hepatocellular carcinoma. As a starting point for NAFLD, the treatment of nonalcoholic fatty liver (NAFL) is receiving increasing attention. Mice fed a high‐fat diet (HFD) and hereditary leptin deficiency (ob/ob) mice are important NAFL animal models. However, the comparison of these mouse models with human NAFL is still unclear.
Methods
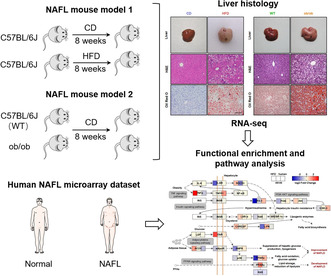
In this study, HFD‐fed mice and ob/ob mice were used as NAFL animal models. Liver histopathological characteristics were compared, and liver transcriptome from both mouse models was performed using RNA sequencing (RNA‐seq). RNA‐seq data obtained from the livers of NAFL patients was downloaded from the GEO database. Global gene expression profiles in the livers were further analyzed using functional enrichment analysis and the Kyoto Encyclopedia of Genes and Genomes (KEGG) pathway.
Results
Our results showed that the biochemical parameters of both mouse models and human NAFL were similar. Compared with HFD‐fed mice, ob/ob mice were more similar in histologic appearance to NAFL patients. The liver transcriptome characteristics partly overlapped in mice and humans. Furthermore, in the NAFL pathway, most genes showed similar trends in mice and humans, thus demonstrating that both types of mice can be used as models for basic research on NAFL, considering the differences.
Conclusion
Our findings show that HFD‐fed mice and ob/ob mice can mimic human NAFL partly in pathophysiological process. The comparative analysis of liver transcriptome profile in mouse models and human NAFL presented here provides insights into the molecular characteristics across these NAFL models.
Keywords: animal model, high‐fat diet, nonalcoholic fatty liver disease, ob/ob mice, transcriptomics
We provide global gene expression profiles in the livers of mouse and human NAFL. Our findings show that mice fed on HFD and ob/ob mice can mimic human NAFL partly in pathophysiological process. The comparative analysis of liver transcriptome profile in mice models and human NAFL presented here offers insights into the molecular features across these NAFL models.
1. INTRODUCTION
Nonalcoholic fatty liver disease (NAFLD) is a disease continuum from nonalcoholic fatty liver (NAFL) to nonalcoholic steatohepatitis (NASH). 1 The global prevalence of NAFLD is up to 30% and still increasing. 2 Its incidence rate increased more than threefold between 2000 and 2015. 3 Due to its high prevalence, NAFLD is emerging as the leading cause of hepatocellular carcinoma, liver transplantation, and end‐stage liver disease, causing a substantial burden on global public health. 4 , 5 NAFL, as a starting point for NAFLD, usually manifests as simple hepatic steatosis with or without mild inflammation. 6 When lobular inflammation and liver cell ballooning are present, the lesion is usually defined as NASH. 7 On the contrary, NAFL is not necessarily benign and confers a risk of disease progression and the development of comorbidities. 8 Therefore, NAFL deserves more attention.
Establishing an appropriate animal model is indispensable to study the pathogenesis and treatment strategies of diseases. Because obesity is closely associated with the increasing prevalence of NAFLD, obese mice are used as common NAFLD animal models, as well as NAFL animal models. 9 , 10 Diet‐induced (high‐fat diet [HFD]) mice 11 and genetically obese (ob/ob) mice 12 are extensively used mouse models mimicking the conditions of obesity. A HFD is known to develop insulin resistance with marked panlobular steatosis. 13 , 14 The phenotype of the model correlates with dietary composition and the feeding time of HFD. 15 Increased levels of leptin are directly associated with obesity and cardiometabolic health. 16 Due to lack of leptin genetically, leptin‐deficient ob/ob mice accumulate fat in the liver and rarely develop NASH, 17 , 18 and therefore can be used as animal models to study NAFL. Although other models, ranging from methionine and choline–deficient diet 19 and choline‐deficient l‐amino‐defined diet 20 to the other genetic animal models, have also been studied for NAFLD, the translatability of results from these models to humans limits their utility. 18 In addition, a systematic review of animal models of NAFLD finds that high‐fat, high‐fructose diets most closely resemble human NAFLD. 21
With the aim of assessing the validity of HFD‐fed mouse and ob/ob mouse models, we established both models separately and compared the similarities and differences with humans using transcriptomic analysis to explore if there is a broad concordance between the human and mouse transcriptomic characteristics.
2. MATERIALS AND METHODS
2.1. Mouse experiments
C57BL/6J male mice were provided by the Laboratory Animal Center, Xi'an Jiaotong University, and ob/ob mice were provided by the Laboratory Animal Resources Center, Tsinghua University. All mice used were housed under a 12‐h light–dark cycle in a pathogen‐free animal facility at the Laboratory Animal Center, Xi'an Jiaotong University. C57BL/6J male mice, aged 8 weeks, were fed a HFD (D12109C, Research Diets) or chow diet (CD) for 8 weeks and water ad libitum; ob/ob mice, aged 8 weeks, were used in this study.
2.2. Liver histology
After 8 weeks on a HFD or CD, the mice were weighed, and tissues were obtained for histological analysis. For ob/ob and control (wild type [WT]) mice, tissues were obtained at age 8 weeks. Livers were excised and weighed, and their structures were observed in detail. Liver samples were fixed in 4% formalin for 48 h and embedded in paraffin. Then the samples were cut into 4‐μm sections and stained with hematoxylin and eosin (H&E). The frozen liver samples were cut into 7‐μm sections and stained with 0.5% Oil Red O and then counterstained with hematoxylin. Images were obtained using a microscope (Nikon). Images of the sections stained with Oil Red O were analyzed using WinROOF 6.5.
2.3. Serum lipid and liver enzyme evaluation
Until the end of the study, whole blood was collected from all mice, and serum was isolated to assess serum lipids (total cholesterol [TC] and triglycerides [TG]) and liver enzymes (alanine aminotransferase [ALT] and aspartate aminotransferase [AST]); 2.5 μL of the sample and 250 μL of the working solution per well were taken in a clean 96‐well plate, mixed gently on a shaker, and incubated in a 37°C constant temperature incubator for 10 min. The multifunction microplate reader was used to measure and record the absorbance values. Finally, concentration was calculated.
2.4. RNA sequencing
Total RNA was extracted from liver tissues using TRIzol reagent (Invitrogen). RNA integrity was evaluated using an RNA Nano 6000 Assay Kit and an Agilent Bioanalyzer 2100 system (Agilent Technologies). Messenger RNA (mRNA) was isolated from total RNA using poly‐T oligo‐attached magnetic beads. RNA libraries were generated using a NEBNext Ultra RNA Library Prep Kit (NEB) following Illumina's recommendations. Library quality was assessed on an Agilent Bioanalyzer 2100 system. The index‐coded samples were clustered using a cBot Cluster Generation System with a TruSeq PE Cluster Kit v4‐cBot‐HS (Illumina) according to the manufacturer's instructions. Libraries were then sequenced on an Illumina NovaSeq 6000 platform (Illumina).
2.5. Quantitative real‐time polymerase chain reaction
Reverse transcription was performed with 1 μg of total RNA using a reverse transcription kit (Accurate Biology). Quantitative polymerase chain reaction (qPCR) was carried out in triplicate, and the values were normalized to β‐actin. The complementary DNA obtained was mixed with specific forward and reverse primer pairs and SYBR Green PCR Master Mix (Accurate Biology). Each PCR was performed using a Thermal Cycler Dice Real Time System TP‐800 (Takara Bio). The primers are presented in Table S1.
2.6. Human NAFL microarray data set
The microarray data set of human liver, including 14 normal and 15 NAFL, was downloaded from NCBI GEO database GSE126848.
2.7. Functional enrichment analysis
The gene counts obtained from RNA sequencing (RNA‐Seq) were screened using the R package DESseq2 to screen differential expression genes (DEGs, p < 0.05, logFC > 0.5) for further pathway analysis. The Morpheus online tool was used to plot a heat map (https://software.broadinstitute.org/morpheus/). The Database for Annotation, Visualization, and Integrated Discovery, v6.8, was used for gene ontology (GO) biological process analysis of DEGs. The KEGG (Kyoto Encyclopedia of Genes and Genomes) pathway database (https://www.genome.jp/kegg/pathway.html) was used as a reference for the pathway map.
2.8. Statistical analysis
Quantitative data were analyzed using GraphPad Prism software, v.7.04. Data are expressed as mean ± standard error of the mean (SEM). Statistical comparison between groups was performed using Student's t‐test, and differences were considered statistically significant at p < 0.05, whereas p < 0.01 and p < 0.001 represent more significant change.
3. RESULTS
3.1. Liver histological characteristics
WT mice on the C57BL/6J background were fed a CD or HFD (40 kcal%) for 8 weeks. Compared with the CD group, the HFD group developed severe hepatic steatosis with increased body weight, liver weight, and liver‐to‐body weight ratio (Figure 1A–C). Similar hepatic steatosis with increased body weight, liver weight, and liver‐to‐body weight ratio was found in ob/ob mice than control mice on a CD (Figure 1D–F). H&E and Oil Red O staining revealed a remarkable accumulation of lipid in hepatocytes (Figure 1G,H).
FIGURE 1.
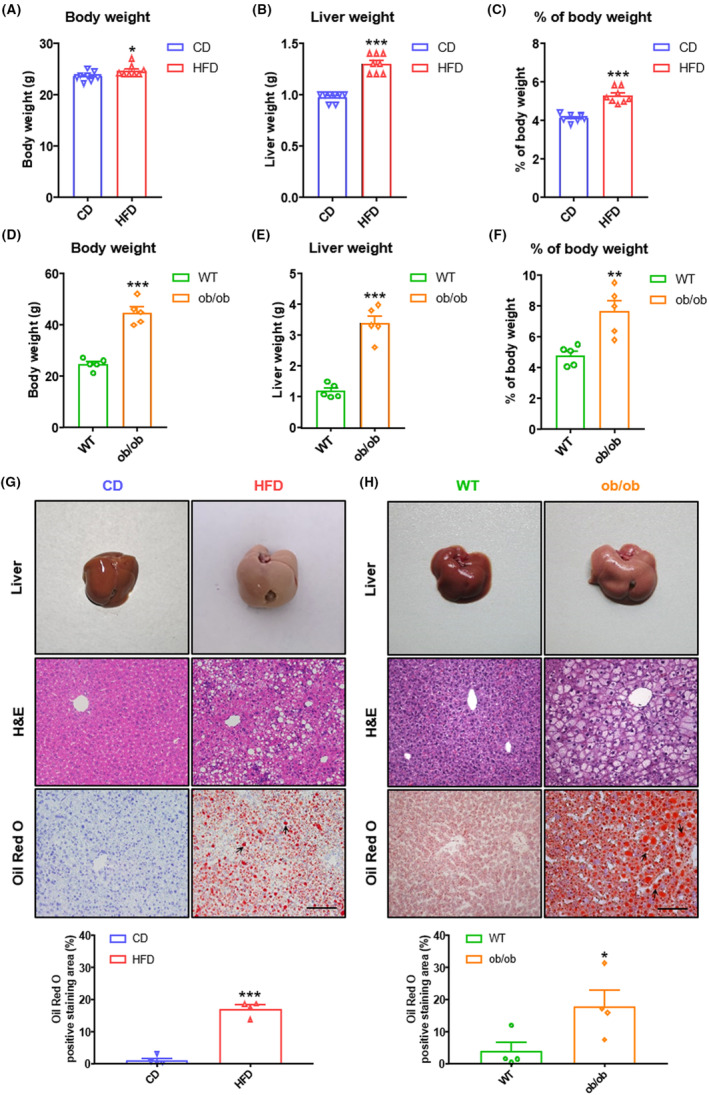
Basic parameters and histology in NAFL (nonalcoholic fatty liver) mice. (A) Body weight, (B) liver weight, and (C) percentage of body weight of C57BL/6J male mice fed on chow diet (CD) or high‐fat diet (HFD) for 8 weeks (n = 8 per group). (D) Body weight, (E) liver weight, and (F) percentage of body weight of C57BL/6J (wild type [WT]) or ob/ob mice at age 8 weeks (n = 5 per group). (G) Representative images of livers, H&E (hematoxylin and eosin) staining of livers, and Oil Red O staining of livers from mice fed 8 weeks on CD or HFD (n = 8 per group). Scale bar = 50 μm for H&E and Oil Red O staining. Arrows represent lipid droplets. Quantitative analysis of Oil Red O staining (n = 4 per group). (H) Representative images of livers, H&E staining of livers, and Oil Red O staining of livers from WT or ob/ob mice at age 8 weeks (n = 5 per group). Scale bar = 50 μm for H&E and Oil Red O staining. Arrows represent lipid droplets. Quantitative analysis of Oil Red O staining (n = 4 per group). All quantitative data for mice were presented as mean ± SEM (standard error of the mean). Statistical comparison between groups was performed using Student's t‐test. *p < 0.05, **p < 0.01, and ***p < 0.001.
Interestingly, we found that steatosis distribution was different in the HFD and ob/ob groups. In the HFD group, hepatocyte steatosis was mainly concentrated in large regions of the liver (Figure 1G). However, steatosis in ob/ob mice occurred around the central vein predominantly (Figure 1H). In the initial stages in adults, steatosis is centered on the central veins and concentrated in the perivenular, zone 3 region of the acini. 22 , 23 , 24 The distribution of lipids in the liver of ob/ob mice is more similar to human NAFL.
3.2. Serum lipid profile and liver damage characteristics
Compared with the CD group, serum TC and TG were significantly elevated in the HFD group (Figure 2A). In addition, similar increases in TC and TG were detected in ob/ob mice when compared with the corresponding control mice (Figure 2B). Additionally, the HFD group showed higher levels of serum AST and ALT levels compared to the CD group (Figure 2C), whereas there were no differences in serum AST between ob/ob mice and WT mice (Figure 2D). In humans, NAFL patients usually have persistently elevated ALT or AST levels. 25 But sometimes AST and ALT are not useful in the diagnosis of NAFLD due to poor sensitivity and specificity. Even in patients with NASH, AST and ALT levels may be normal. 26
FIGURE 2.
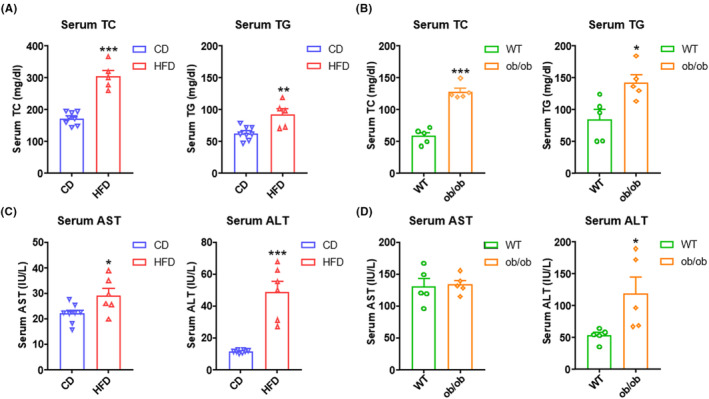
Serum lipids and biochemical parameters in NAFL (nonalcoholic fatty liver) mice. (A) Serum total cholesterol (TC) and triglyceride (TG) levels in C57BL/6J male mice fed 8 weeks with CD (chow diet) or HFD (high‐fat diet) (n = 5–8 per group). (B) Serum TC and TG levels in WT (wild type) or ob/ob mice at age 8 weeks (n = 5 per group). (C) Serum aspartate aminotransferase (AST) and alanine aminotransferase (ALT) levels in mice fed 8 weeks with CD or HFD (n = 6–8 per group). (D) Serum AST and ALT levels in WT or ob/ob mice at age 8 weeks (n = 5 per group). All quantitative data for mice were presented as mean ± SEM (standard error of the mean). Statistical comparison between groups was performed using Student's t‐test. *p < 0.05, **p < 0.01, and ***p < 0.001.
3.3. Liver transcriptome profiles
With the aim of exploring the similarities and differences in both models in molecular mechanisms underlying the progression of NAFL, we conducted RNA‐seq analysis of livers obtained from CD‐fed and HFD‐fed mice, WT mice, and ob/ob mice. We selected several genes to confirm the reliability of the transcriptome data (Figure S1A–E). Meanwhile, human DEGs were obtained from a human liver microarray data set (GSE126848). 27 This data set contains the results of microarrays from 14 healthy livers and 15 liver samples from NAFL patients. In total, 6078 DEGs (3343 upregulated and 2735 downregulated) in the HFD‐fed and CD‐fed groups were obtained. Similarly, there were 502 DEGs in the ob/ob mice group versus WT group, of which 328 were upregulated and 174 were downregulated genes. For the GSE126848 data set, 1908 DEGs were screened from the NAFL patients versus samples of healthy individuals, including 923 upregulated and 985 downregulated genes (Figure 3A,B). Interestingly, the number of DEGs in the HFD‐fed mouse group was as high as 6078, whereas that of the ob/ob mouse group was as low as 502. And the number of DEGs in the human NAFL group was somewhere in between (Figure 3A).
FIGURE 3.
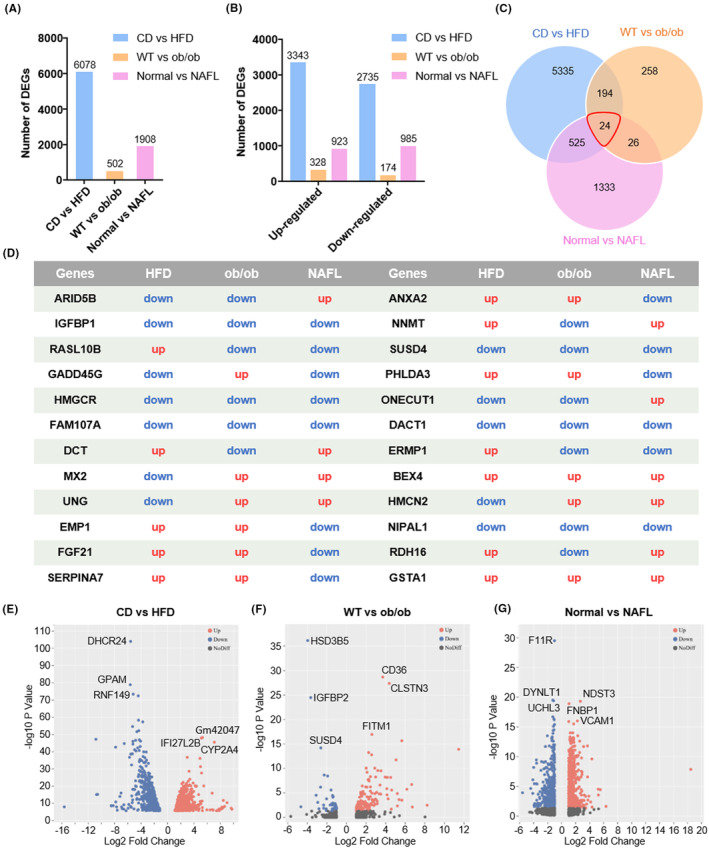
Overview of hepatic gene expression profiles in CD (chow diet) versus HFD (high‐fat diet) mice, WT (wild type) versus ob/ob mice, and normal versus NAFL (nonalcoholic fatty liver) patients. (A) Numbers of DEGs (differential expression genes) in the livers of three groups. (B) Numbers of upregulated and downregulated genes in the livers of three groups. (C) Venn diagrams of DEGs. The cutoff for the differential expression is onefold. (D) The expression changes in 24 common DEGs in three groups. Volcano plots of mRNAs (messenger RNA) between (E) CD and HFD mice, (F) WT and ob/ob mice, and (G) normal people and NAFL patients. The plots were constructed by plotting –log10 adjusted p‐value on the y‐axis and log2 fold change on the x‐axis. Blue blots represent downregulated genes, red dots represent upregulated genes, and black blots represent mRNAs without significant difference.
DEGs in these three models were screened to conduct a Venn analysis. Figure 3C,D shows that 24 common DEGs were obtained. Although these genes are shared in three pairs, the 24 common DEGs exhibited differential expression. Eight genes, namely IGFBP1, HMGCR, FAM107A, SUSD4, DACT1, BEX4, NIPAL1, and GSTA1, showed similar trends in two mouse models and human NAFL. Apart from BEX4 and GSTA1, the rest were downregulated. Besides, genes such as GADD45G, DCT, NNMT, and RDH16 exhibited similar expression in the HFD‐fed model and human NAFL. RASL10B, MX2, UNG, ERMP1, and HMCN2 showed similar trends in ob/ob mice and human NAFL. The remaining seven common DEGs were expressed similarly in both mouse models but differently in human NAFL (Figure 3D). Volcano plots demonstrated hepatic transcriptome differences in CD‐fed versus HFD‐fed mouse groups, WT versus ob/ob mouse groups, and normal control versus NAFL patients (Figure 3E–G). The top three genes with the most significant changes in each group are shown in Figure 3E–G.
Collectively, these data indicate that HFD feeding induced distinct hepatic transcriptomic changes compared to ob/ob mice, and both mouse models have a certain gap with the real situation of NAFL patients.
3.4. Enrichment analysis of differences in mouse and human NAFL
To obtain a systematic overview of biological pathway perturbations, we conducted GO enrichment and KEGG pathway analyses and showed the top 10 enrichment pathways. In the HFD feeding group, the GO terms identified a significant enrichment of inflammation and immunity‐related genes compared to the CD controls, such as lymphocyte differentiation, negative regulation of immune system process, leukocyte cell–cell adhesion, regulation of T‐cell activation, and myeloid leukocyte activation among the top 10 biological processes. Top 10 KEGG pathways significantly altered by HFD feeding were mainly associated with metabolism, such as carbon metabolism, steroid hormone biosynthesis, glycolysis/gluconeogenesis, and steroid biosynthesis (Figure 4A). In the WT versus ob/ob mouse group, genes involved in lipid metabolism were enriched by both analyses, which is different from the CD versus HFD group. Compared to the WT mouse group, fatty acid metabolic process, lipid localization, lipid transport, steroid metabolic processes, and regulation of lipid localization were the top five biological processes. Consistently, the top 10 enriched pathways revealed by KEGG were also related to metabolism primarily, including steroid hormone biosynthesis, PPAR signaling pathway, AMPK signaling pathway, cholesterol metabolism, and regulation of lipolysis in adipocytes (Figure 4B).
FIGURE 4.
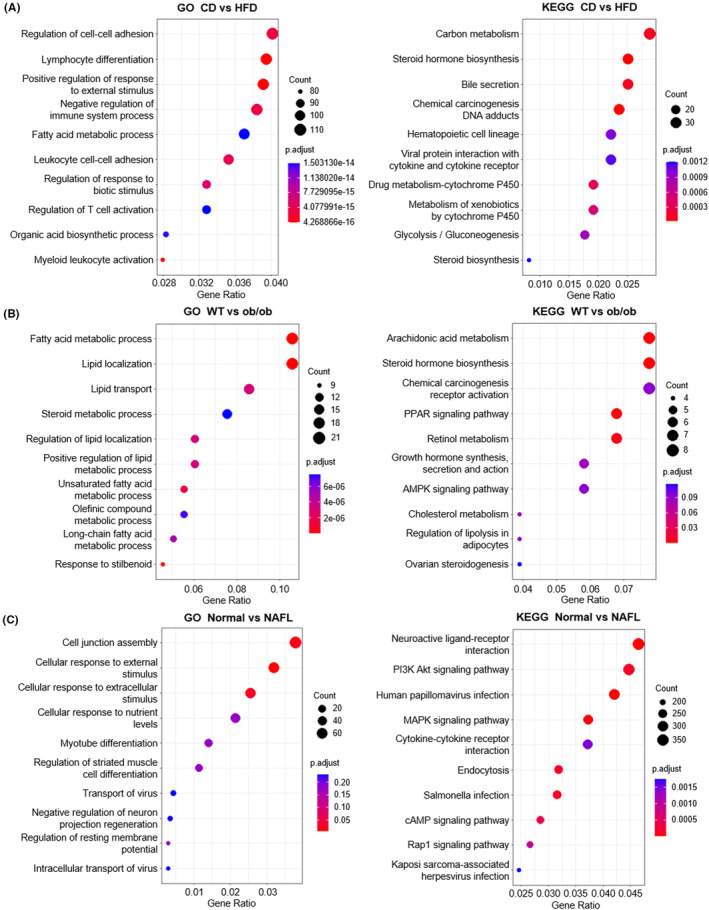
Enrichment analysis of differences in two mouse models and NAFL (nonalcoholic fatty liver) patients. (A–C) The top 10 enriched GO (gene ontology) terms and KEGG (Kyoto Encyclopedia of Genes and Genomes) pathways of DEGs (differential expression genes). The left figure shows GO enrichment, and the right figure shows KEGG pathway analysis. (A) CD (chow diet) versus HFD (high‐fat diet), (B) WT (wild type) versus ob/ob mice, and (C) normal people versus NAFL patients.
In normal control versus NAFL patients, the top five biological processes significantly different between healthy individuals and NAFL patients were cell junction assembly, cellular response to external stimulus, cellular response to extracellular stimulus, cellular response to nutrient levels, and myotube differentiation. KEGG pathway analysis demonstrated that, compared to healthy people, PI3K Akt signaling pathway, MAPK signaling pathway, cAMP signaling pathway, and Rap1 signaling pathway were significantly altered in NAFL patients (Figure 4C).
3.5. Gene set analysis of differences in mouse and human NAFL
To reveal the key gene signatures in mice and human NAFL, we developed different heat maps for NAFL‐relevant gene sets in both mouse models and human NAFL.
3.5.1. Lipid metabolism
Lipid metabolism genes exhibited differential expression in two mouse models and human NAFL. Several key genes, ACACB, CPT1A, CSAD, and LPIN1, were only downregulated in ob/ob mice. FABP1, RARRES2, and CPT1C were only upregulated in ob/ob mice. CPT1B was downregulated in ob/ob mice but upregulated in the other two groups. Genes such as ACCS2, SCARB1, SQLE, FXR1, and HMGCS1 were upregulated in human NAFL but unchanged or downregulated in both mouse models (Figure 5A).
FIGURE 5.
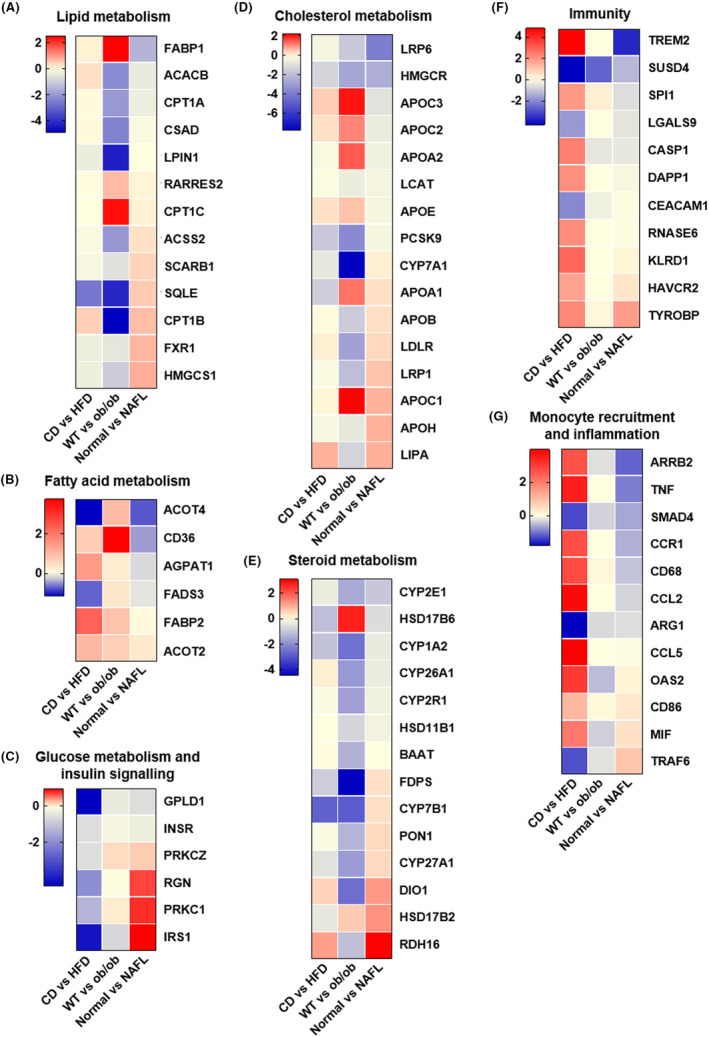
Gene set analysis of differences in two mouse models and NAFL (nonalcoholic fatty liver) patients. Heat maps of log2 fold change for significantly regulated (A) lipid metabolism‐related genes, (B) fatty acid metabolism‐related genes, (C) glucose metabolism and insulin signaling‐related genes, (D) cholesterol metabolism‐related genes, (E) steroid metabolism‐related genes, (F) immunity‐related genes, and (G) monocyte recruitment and inflammation‐related genes in two mouse models and NAFL patients.
3.5.2. Fatty acid metabolism
ACOT4 and FADS3 were downregulated in HFD‐fed mice and human NAFL but upregulated in ob/ob mice. CD36, AGPAT1, and FABP2 showed similar trends in both mouse models but not in human NAFL. A key gene of fatty acid metabolism, ACOT2, was upregulated in three groups (Figure 5B).
3.5.3. Glucose metabolism and insulin signaling
GPLD1 was substantially downregulated in HFD‐fed mice but not in ob/ob mice and NAFL patients. PRKCZ was slightly upregulated in ob/ob mice and NAFL patients but not in HFD‐fed mice. INSR showed no obvious change in the three groups. Several genes showed different trends in three groups, including RGN, PRKC1, and IRS1; these were upregulated in NAFL patients, downregulated in HFD‐fed mice, and almost unchanged in ob/ob mice (Figure 5C).
3.5.4. Cholesterol metabolism
Genes such as LRP6 and HMGCR showed similar trends in the three groups and slightly in HFD‐fed mice. APOC3, APOC2, and APOE were upregulated in both mouse models but not in human NAFL. PCSK9 and CYP7A1 were downregulated in both mouse models but not in human NAFL. The level of APOA2 was only upregulated in ob/ob mice. APOC1 and APOA1 were upregulated in the three groups but stronger in ob/ob mice. Furthermore, APOB, LRP1, and APOH were downregulated in ob/ob mice but upregulated in human NAFL. LPLR and LIPA were upregulated in HFD‐fed mice and NAFL patients but downregulated in ob/ob mice (Figure 5D).
3.5.5. Steroid metabolism
The level of HSD17B6 was only upregulated in ob/ob mice. Genes such as CYP26A1, CYP2R1, HSD11B1, and BAAT were upregulated in ob/ob mice but showed almost no change in HFD‐fed mice and NAFL patients. CYP2E1 and CYP1A2 were downregulated in the three groups to varying degrees. Several genes, including FDPS, CYP7B1, PON1, and CYP27A1, showed opposite trends between mouse models and NAFL patients. Genes such as DIO1 and RDH16 were upregulated in HFD‐fed mice and human NAFL but not in ob/ob mice. However, HSD17B2 was upregulated in ob/ob mice and human NAFL but not in HFD‐fed mice (Figure 5E).
3.5.6. Immunity
Among immunity‐related genes, TREM2 was substantially downregulated in NAFL patients but was significantly upregulated in HFD‐fed mice. The level of SUSD4 showed similar trends in the three groups. One of the key genes, SPI1, was upregulated in both mouse groups but slightly downregulated in NAFL patients. Genes such as LGALS9 and CEACAM1 were downregulated in HFD‐fed mice but slightly or not altered in ob/ob mice and NAFL patients. CASP1, DAPP1, and RNASE6 were upregulated only in HFD‐fed mice. KLRD1, HAVCR2, and TYROBP were upregulated in HFD‐fed mice, which showed similar trends in human NAFL but slightly (Figure 5F).
3.5.7. Monocyte recruitment and inflammation
Among inflammation‐related genes, ARRB2, TNF, CCR1, CD68, CCL2, and CCL5 were significantly upregulated in HFD‐fed mice but unchanged or even downregulated in ob/ob mice and NAFL patients. OAS2, CD68, and MIF were also upregulated in HFD‐fed mice and only moderately upregulated in NAFL patients. Genes such as SMAD4 and ARG1 were downregulated in the three groups but slightly in ob/ob mice and NAFL patients. One of the key genes, TRAF6, was downregulated in both mouse groups but stronger in HFD‐fed mice, which was different from NAFL patients (Figure 5G).
3.6. Similarities and differences in NAFL pathway in two mouse models and NAFL patients
Next, we compared the differences in the key pathway related with NAFLD in mice and humans (Figure 6). In the NAFL pathway, as we expected, most genes, such as IL‐6, NF‐кB, INSR, RXR, SREBP‐1c, LEP, and p38, showed similar trends in mice and human NAFL, and most of them were downregulated slightly. Additionally, several genes, including SOCS3, TNFα, TNFR1, IRS‐1, AKT, GSK‐3, ACDC, and AMPK, exhibited different trends in mice and human NAFL. Besides, these genes showed some differences between the two mouse models, some genes showed similar trends in just one mouse model group and the human NAFL group, and the degrees of change were different. The results may guide us in selecting research targets in the future.
FIGURE 6.
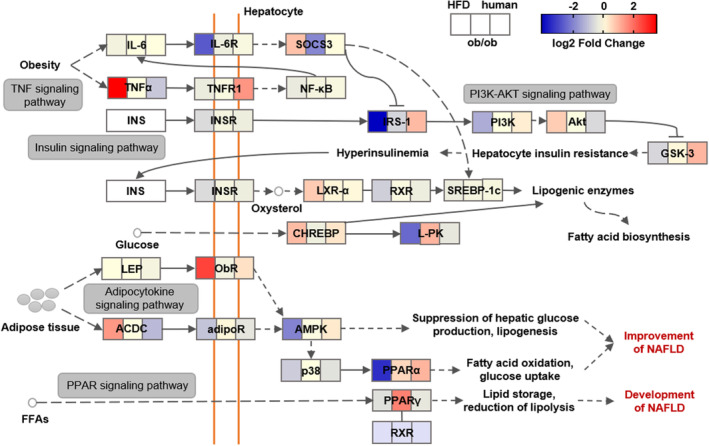
Comparison of differential expression response for NAFL (nonalcoholic fatty liver) pathway‐related genes in two mouse models and NAFL patients. Color scale of log2 fold changes: the lowest (blue) to the highest (red).
4. DISCUSSION
Here, we provided an overview of changes in NAFL improvement in two common mouse models and human NAFL, and compared the key histologic and metabolic changes in the HFD‐fed mouse model and ob/ob mouse model.
An ideal animal model of NAFL should display a phenotype as close to human disease as possible, which can be assessed through genetics, diet, physiological requirements, histological requirements, cell signaling requirements, transcriptomic validation, and metabolomic validation. 18 , 28 To realistically mimic human NAFL, the rational use of models that best reflect the pathogenic aspect targeted as the most appropriate approach is the best choice. 29 , 30 Our findings suggest that although the biochemical parameters of both models are similar to human NAFL, the histologic appearance and transcriptomic characteristics of the liver may not be similar. It would be better to evaluate models based on transcriptomic characteristics, rather than on histology alone, to assess their relevance to human NAFL.
The liver transcriptome features partly overlapped in mice and humans, yet gene expression signatures in both mouse models were still distinguished from humans, suggesting that the pathophysiology of mouse models does not replicate human NAFL completely. Given the diversity and range of gene expression changes, this indicates widespread alterations in hepatic molecular signaling in both mouse models and NAFL patients.
In terms of the number of DEGs, HFD induced a greater number of genes changing the expression, whether upregulated or downregulated. The number of DEGs in the HFD mouse model was far greater than that in the ob/ob mouse model, suggesting that the stimulation of HFD may have a wider impact on the body, which not only leads to fat accumulation in the liver but also causes other phenotypes, which does not meet our expectations. The other model, hereditary leptin deficiency, can lead to lipid accumulation in the liver but may not do so by pathways known to be relevant to human NAFL and therefore does not completely recreate the phenotype of human NAFL. On the contrary, this is also confirmed by ob/ob mice having fewer DEGs than patients with NAFL. Clinical studies have shown that serum leptin levels in patients with NAFL and NASH are normal or elevated compared to healthy controls. 12 , 31 Therefore, ob/ob mouse models used for NAFLD studies are limited.
Some transcriptomic characteristics include altered immune signaling and altered lipid and glucose metabolism. Previous research has also shown that human genetic variants linked to NAFLD risk are heavily biased toward genes related to lipid metabolism, 32 which is consistent with our findings. Take oxysterol 7α‐hydroxylase (CYP7B1) as an example; CYP7B1 controls the levels of intracellular regulatory oxysterols. An inability to upregulate CYP7B1 results in the accumulation of toxic cholesterol metabolites that promote the transition from NAFL to NASH. 33 This is also confirmed by transcriptomic and lipidomic analyses in the early stage of fatty liver. 34
Besides, HFD‐induced NAFL mice had not only lipid metabolism disorders resulting in the development of NAFL disease but also more inflammation and immune responses, and these characteristics were more inclined to NASH than simple steatosis. Though ob/ob mice did not show obvious inflammatory and immune responses, the expression of lipid metabolism–related genes changed more significantly than human NAFL. Furthermore, several functionally relevant genes exhibited directional (upregulated vs. downregulated) differences between mice and human NAFL.
In conclusion, these results showed that both NAFL mouse models can only partially simulate the occurrence and development of human NAFL and cannot fully approximate the physiological and pathological characteristics of real human NAFL disease. This leads us to use a combination of multiple animal models to study diseases in basic research to avoid one‐sided or even opposite conclusions.
AUTHOR CONTRIBUTIONS
Yiming Ding and Liang Bai conceived and designed the research. Yiming Ding, Xulei Dai, and Miaoye Bao conducted all the experiments. Yiming Ding, Xulei Dai, Miaoye Bao, and Yuanming Xing analyzed the data. Yiming Ding and Liang Bai drafted the manuscript. Junhui Liu, Sihai Zhao, Enqi Liu, and Zuyi Yuan revised the manuscript; all the authors reviewed the manuscript.
FUNDING INFORMATION
This work was supported by grants from the National Natural Science Foundation of China (82070 470 to L.B.), Innovation Capability Support Program of Shaanxi (2022PT‐37 to L.B.), and Basic‐Clinical Joint & Innovative Project of the First Affiliated Hospital of Xi’an Jiaotong University (YXJLRH2022025 to J.L.).
CONFLICT OF INTEREST STATEMENT
The authors declare no conflicts of interest.
ETHICS STATEMENT
All animal experiments were approved by the Institutional Animal Care and Use Committee of Xi'an Jiaotong University (approval no.: XJTULAC2017.581). According to the criteria outlined in the Guide for the Care and Use of Laboratory Animals prepared by the National Academy of Sciences and published by the National Institutes of Health, mice received humane care.
Supporting information
Figure S1.
Table S1.
ACKNOWLEDGMENTS
The authors thank Zeyu Dong (Xi'an Jiaotong University, China) for experiment data assistance. They thank the Laboratory Animal Center of Xi'an Jiaotong University for animal technical support.
Ding Y, Dai X, Bao M, et al. Hepatic transcriptome signatures in mice and humans with nonalcoholic fatty liver disease. Anim Models Exp Med. 2023;6:317‐328. doi: 10.1002/ame2.12338
Contributor Information
Zuyi Yuan, Email: zuyiyuan@mail.xjtu.edu.cn.
Liang Bai, Email: bailiang0922@mail.xjtu.edu.cn.
REFERENCES
- 1. Powell EE, Wong VW, Rinella M. Non‐alcoholic fatty liver disease. Lancet. 2021;397(10290):2212‐2224. [DOI] [PubMed] [Google Scholar]
- 2. Younossi ZM, Golabi P, Paik JM, Henry A, van Dongen C, Henry L. The global epidemiology of nonalcoholic fatty liver disease (NAFLD) and nonalcoholic steatohepatitis (NASH): a systematic review. Hepatology. 2023;77(4):1335‐1347. [DOI] [PMC free article] [PubMed] [Google Scholar]
- 3. Le MH, Le DM BTC, et al. Global incidence of non‐alcoholic fatty liver disease: a systematic review and meta‐analysis of 63 studies and 1,201,807 persons. J Hepatol. 2023;79:287‐295. [DOI] [PubMed] [Google Scholar]
- 4. Lazarus JV, Mark HE, Anstee QM, et al. Advancing the global public health agenda for NAFLD: a consensus statement. Nat Rev Gastroenterol Hepatol. 2022;19(1):60‐78. [DOI] [PubMed] [Google Scholar]
- 5. Younossi Z, Anstee QM, Marietti M, et al. Global burden of NAFLD and NASH: trends, predictions, risk factors and prevention. Nat Rev Gastroenterol Hepatol. 2018;15(1):11‐20. [DOI] [PubMed] [Google Scholar]
- 6. Friedman SL, Neuschwander‐Tetri BA, Rinella M, Sanyal AJ. Mechanisms of NAFLD development and therapeutic strategies. Nat Med. 2018;24(7):908‐922. [DOI] [PMC free article] [PubMed] [Google Scholar]
- 7. Bedossa P. Pathology of non‐alcoholic fatty liver disease. Liver Int. 2017;37(Suppl 1):85‐89. [DOI] [PubMed] [Google Scholar]
- 8. Mazzolini G, Sowa JP, Atorrasagasti C, Kücükoglu Ö, Syn WK, Canbay A. Significance of simple steatosis: an update on the clinical and molecular evidence. Cell. 2020;9(11):2458. [DOI] [PMC free article] [PubMed] [Google Scholar]
- 9. Quek J, Chan KE, Wong ZY, et al. Global prevalence of non‐alcoholic fatty liver disease and non‐alcoholic steatohepatitis in the overweight and obese population: a systematic review and meta‐analysis. Lancet Gastroenterol Hepatol. 2023;8(1):20‐30. [DOI] [PubMed] [Google Scholar]
- 10. Polyzos SA, Kountouras J, Mantzoros CS. Obesity and nonalcoholic fatty liver disease: from pathophysiology to therapeutics. Metabolism. 2019;92:82‐97. [DOI] [PubMed] [Google Scholar]
- 11. Hao YY, Cui WW, Gao HL, et al. Jinlida granules ameliorate the high‐fat‐diet induced liver injury in mice by antagonising hepatocytes pyroptosis. Pharm Biol. 2022;60(1):274‐281. [DOI] [PMC free article] [PubMed] [Google Scholar]
- 12. Boutari C, Mantzoros CS. Adiponectin and leptin in the diagnosis and therapy of NAFLD. Metabolism. 2020;103:154028. [DOI] [PubMed] [Google Scholar]
- 13. Asgharpour A, Cazanave SC, Pacana T, et al. A diet‐induced animal model of non‐alcoholic fatty liver disease and hepatocellular cancer. J Hepatol. 2016;65(3):579‐588. [DOI] [PMC free article] [PubMed] [Google Scholar]
- 14. Clapper JR, Hendricks MD, Gu G, et al. Diet‐induced mouse model of fatty liver disease and nonalcoholic steatohepatitis reflecting clinical disease progression and methods of assessment. Am J Physiol Gastrointest Liver Physiol. 2013;305(7):G483‐G495. [DOI] [PubMed] [Google Scholar]
- 15. Nakamura A, Terauchi Y. Lessons from mouse models of high‐fat diet‐induced NAFLD. Int J Mol Sci. 2013;14(11):21240‐21257. [DOI] [PMC free article] [PubMed] [Google Scholar]
- 16. Li LJ, Rifas‐Shiman SL, Aris IM, Mantzoros C, Hivert MF, Oken E. Leptin trajectories from birth to mid‐childhood and cardio‐metabolic health in early adolescence. Metabolism. 2019;91:30‐38. [DOI] [PMC free article] [PubMed] [Google Scholar]
- 17. Suriano F, Vieira‐Silva S, Falony G, et al. Novel insights into the genetically obese (ob/ob) and diabetic (db/db) mice: two sides of the same coin. Microbiome. 2021;9(1):147. [DOI] [PMC free article] [PubMed] [Google Scholar]
- 18. Santhekadur PK, Kumar DP, Sanyal AJ. Preclinical models of non‐alcoholic fatty liver disease. J Hepatol. 2018;68(2):230‐237. [DOI] [PMC free article] [PubMed] [Google Scholar]
- 19. Pierce AA, Pickens MK, Siao K, Grenert JP, Maher JJ. Differential hepatotoxicity of dietary and DNL‐derived palmitate in the methionine‐choline‐deficient model of steatohepatitis. BMC Gastroenterol. 2015;15:72. [DOI] [PMC free article] [PubMed] [Google Scholar]
- 20. Kodama Y, Kisseleva T, Iwaisako K, et al. c‐Jun N‐terminal kinase‐1 from hematopoietic cells mediates progression from hepatic steatosis to steatohepatitis and fibrosis in mice. Gastroenterology. 2009;137(4):1467‐1477.e5. [DOI] [PMC free article] [PubMed] [Google Scholar]
- 21. Im YR, Hunter H, de Gracia Hahn D, et al. A systematic review of animal models of NAFLD finds high‐fat, high‐fructose diets Most closely resemble human NAFLD. Hepatology. 2021;74(4):1884‐1901. [DOI] [PubMed] [Google Scholar]
- 22. Brunt EM, Kleiner DE, Carpenter DH, et al. NAFLD: reporting histologic findings in clinical practice. Hepatology. 2021;73(5):2028‐2038. [DOI] [PubMed] [Google Scholar]
- 23. Bedossa P. Histological assessment of NAFLD. Dig Dis Sci. 2016;61(5):1348‐1355. [DOI] [PubMed] [Google Scholar]
- 24. Hall Z, Bond NJ, Ashmore T, et al. Lipid zonation and phospholipid remodeling in nonalcoholic fatty liver disease. Hepatology. 2017;65(4):1165‐1180. [DOI] [PMC free article] [PubMed] [Google Scholar]
- 25. Cusi K, Isaacs S, Barb D, et al. American association of clinical endocrinology clinical practice guideline for the diagnosis and management of nonalcoholic fatty liver disease in primary care and endocrinology clinical settings: Co‐sponsored by the American Association for the Study of Liver Diseases (AASLD). Endocr Pract. 2022;28(5):528‐562. [DOI] [PubMed] [Google Scholar]
- 26. Duell PB, Welty FK, Miller M, et al. Nonalcoholic fatty liver disease and cardiovascular risk: a scientific statement from the American Heart Association. Arterioscler Thromb Vasc Biol. 2022;42(6):e168‐e185. [DOI] [PubMed] [Google Scholar]
- 27. Suppli MP, Rigbolt KTG, Veidal SS, et al. Hepatic transcriptome signatures in patients with varying degrees of nonalcoholic fatty liver disease compared with healthy normal‐weight individuals. Am J Physiol Gastrointest Liver Physiol. 2019;316(4):G462‐g472. [DOI] [PubMed] [Google Scholar]
- 28. Oseini AM, Cole BK, Issa D, Feaver RE, Sanyal AJ. Translating scientific discovery: the need for preclinical models of nonalcoholic steatohepatitis. Hepatol Int. 2018;12(1):6‐16. [DOI] [PMC free article] [PubMed] [Google Scholar]
- 29. Rinella ME, Tacke F, Sanyal AJ, Anstee QM, Participants of the AASLD/EASL Workshop . Report on the AASLD/EASL joint workshop on clinical trial endpoints in NAFLD. J Hepatol. 2019;71(4):823‐833. [DOI] [PubMed] [Google Scholar]
- 30. Reimer KC, Wree A, Roderburg C, Tacke F. New drugs for NAFLD: lessons from basic models to the clinic. Hepatol Int. 2020;14(1):8‐23. [DOI] [PubMed] [Google Scholar]
- 31. Polyzos SA, Kountouras J, Mantzoros CS. Leptin in nonalcoholic fatty liver disease: a narrative review. Metabolism. 2015;64(1):60‐78. [DOI] [PubMed] [Google Scholar]
- 32. Bence KK, Birnbaum MJ. Metabolic drivers of non‐alcoholic fatty liver disease. Mol Metab. 2021;50:101143. [DOI] [PMC free article] [PubMed] [Google Scholar]
- 33. Kakiyama G, Marques D, Martin R, et al. Insulin resistance dysregulates CYP7B1 leading to oxysterol accumulation: a pathway for NAFL to NASH transition. J Lipid Res. 2020;61(12):1629‐1644. [DOI] [PMC free article] [PubMed] [Google Scholar]
- 34. Zhai R, Feng L, Zhang Y, Liu W, Li S, Hu Z. Combined transcriptomic and lipidomic analysis reveals dysregulated genes expression and lipid metabolism profiles in the early stage of fatty liver disease in rats. Front Nutr. 2021;8:733197. [DOI] [PMC free article] [PubMed] [Google Scholar]
Associated Data
This section collects any data citations, data availability statements, or supplementary materials included in this article.
Supplementary Materials
Figure S1.
Table S1.


