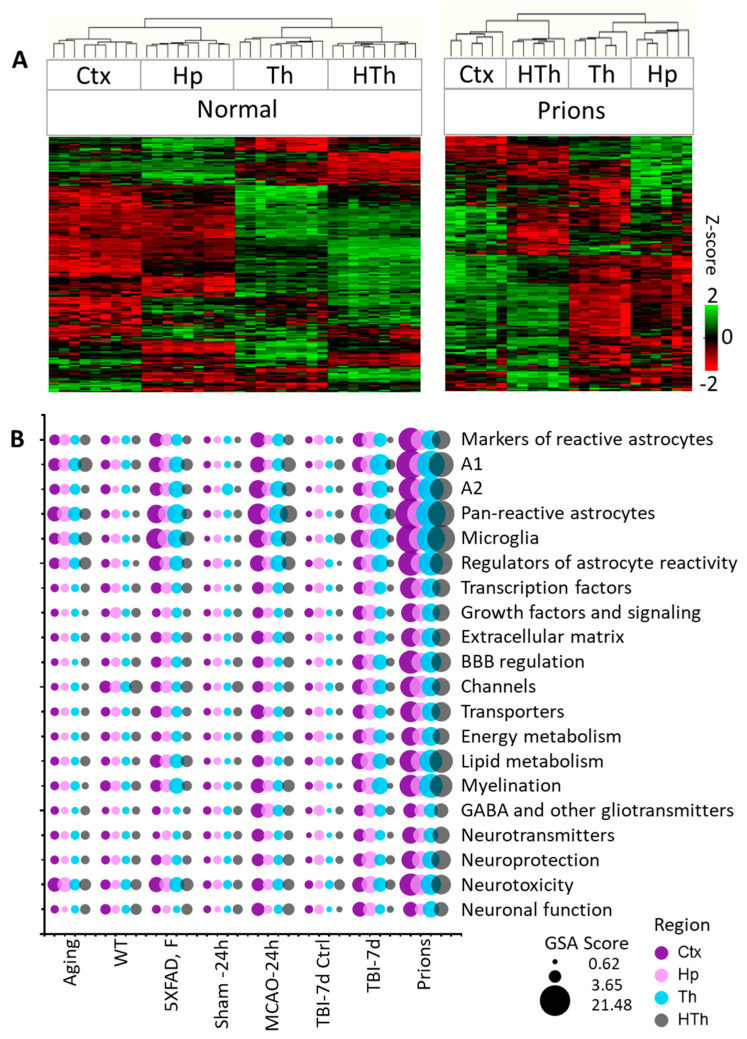
Figure 1.
Analysis of gene expression in different brain regions. (A) Hierarchical clustering of mock-inoculated samples from the Normal group (left) and Prions group (right) showing high reproducibility of the astrocyte panel and regional specificity of astrocyte function genes, which is maintained at the terminal stage of prion infection. Clustering was performed using genes related to BBB regulation, lipid and energy metabolism, extracellular matrix, junction, myelination, channels, transporters, gliotransmitters and neurotransmitters, neuroprotection and neurotoxicity, and astrocyte-specific markers (Table S2). (B) Bubble plot of undirected global significance scores obtained with NanoString Gene Set Analysis (GSA) by comparing all experimental and corresponding control groups, with the Normal group used as a reference (Table 1). TBI-7d is represented by ipsilateral Ctx, Hp and Th, and whole HTh. The size of the bubbles reflects the degree of regional changes for individual gene sets with different insults. Ctx—cortex, Hp—hippocampus, Th—thalamus, HTh—hypothalamus.

