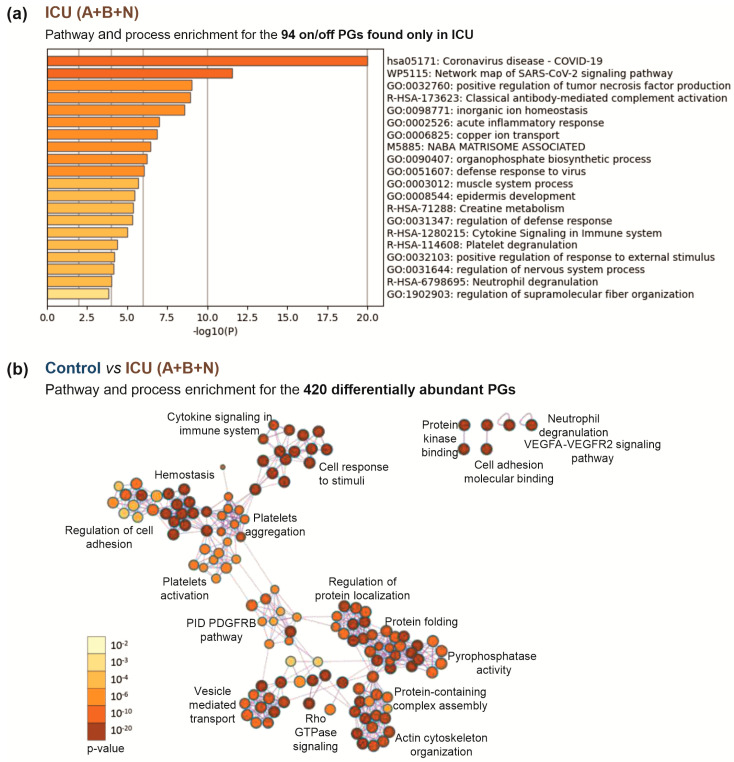
Figure 5.
Comparison of the ICU patient group (A+B+N) with the healthy controls. (a) The top 20 enriched biological processes across 94 PGs exclusively found in ICU. Each bar represents a statistically ranked enrichment term. The proteins selectively present in the patient group showed associations with SARS-CoV-2 and COVID-19 and the further involvement of the immune response in pathway and process enrichment analysis. (b) Network of enriched terms for the 420 differentially abundant proteins in controls and ICU patients (p < 0.05) colored by p-value. Terms containing more genes tend to have a more significant p-value; the darker the color, the more statistically significant the node (see legend for p-value ranges). Pathway and process analysis of regulated and exclusively expressed proteins showed correlation with various mechanisms, especially hemostasis, platelet aggregation and activation, and protein folding and localization. ICU: intensive care unit (ICU A: non-survivors, ICU B: survivors, ICU N: unknown); NW: normal ward.

