

Abstract

Lipid metabolism is implicated in a variety of diseases, including cancer, cell death, and inflammation, but lipidomics has proven to be challenging due to the vast structural diversity over a narrow range of mass and polarity of lipids. Isotope labeling is often used in metabolomics studies to follow the metabolism of exogenously added labeled compounds because they can be differentiated from endogenous compounds by the mass shift associated with the label. The application of isotope labeling to lipidomics has also been explored as a method to track the metabolism of lipids in various disease states. However, it can be difficult to differentiate a single isotopically labeled lipid from the rest of the lipidome due to the variety of endogenous lipids present over the same mass range. Here we report the development of a dual-isotope deuterium labeling method to track the metabolic fate of exogenous polyunsaturated fatty acids, e.g., arachidonic acid, in the context of ferroptosis using hydrophilic interaction–ion mobility–mass spectrometry (HILIC-IM-MS). Ferroptosis is a type of cell death that is dependent on lipid peroxidation. The use of two isotope labels rather than one enables the identification of labeled species by a signature doublet peak in the resulting mass spectra. A Python-based software, D-Tracer, was developed to efficiently extract metabolites with dual-isotope labels. The labeled species were then identified with LiPydomics based on their retention times, collision cross section, and m/z values. Changes in exogenous AA incorporation in the absence and presence of a ferroptosis inducer were elucidated.
Introduction
The rise of genomics, proteomics, and metabolomics over the last 20 years has brought a wealth of information to the field of biochemistry and greatly advanced our understanding of human health and diseases. Lipidomics is a branch of metabolomics that studies lipids and their metabolites within a biological system.1 Lipidomics has revealed the many roles of lipids beyond simple energy storage molecules, including as signaling molecules in inflammation and the immune response, metabolic regulation, and cell death.2 Altered lipid metabolism is a hallmark of many types of cancer,3 as cancer cells often change their lipid metabolism to keep up with their need for energy, alter signaling pathways, and evade cell death.4,5 Altered lipid metabolism has also been implicated in cardiac dysfunction,6 liver disease,7 and neurodegeneration.8 Therefore, the advancement of the lipidomics field could yield important insights into these diseases and others.
In recent years, altered lipid metabolism and increased lipid peroxidation were found to play a critical role in the iron-dependent cell death form, i.e., ferroptosis.9−12 Polyunsaturated fatty acids (PUFAs) are crucial to the process of lipid peroxidation because the hydrogen atoms at the bis-allylic position between two double bonds are especially labile and subject to hydrogen atom abstraction by a radical (Figure 1).13 Arachidonic acid (AA) is a biologically relevant omega-6 PUFA with 20 carbon atoms and 4 double bonds at the 5, 8, 11, and 14 positions. It is found at a concentration of approximately 400 μM in human plasma.14 Previous work has shown that AA treatment can sensitize cells to ferroptotic death, enhancing the lethality of canonical ferroptosis inducer RSL3 in cancer cells.15 RSL3 inhibits the lipid peroxide-reducing enzyme glutathione peroxidase 4.10,12 However, the exact species and biochemical events that lead to peroxide buildup and eventual cell death are unclear.
Figure 1.

Scheme of free-radical peroxidation of PUFAs via a hydrogen atom transfer (HAT) mechanism.
Despite its biological importance, lipidomics has several inherent difficulties that hinder its advancement. There are upward of 47 000 observed and computational lipids in the Lipid MAPs database, which continues to expand.16 Most of these cellular lipids occur in a relatively narrow mass range, from 500 to 1200 Da. Within this range, there are many isomeric and isobaric lipids that are impossible to identify by mass alone. These traits make the separation, resolution, and identification of lipids quite challenging. Mass spectrometry is the primary tool used in lipidomics due to its resolving power, throughput, and customizability.1 The use of chromatography and ion mobility, along with soft ionization techniques such as electrospray ionization (ESI), has greatly improved our ability to resolve many of these compounds.17
Most lipids within a cell share the same structural pattern of two or three fatty acid tails attached to a polar or semipolar headgroup. The headgroup structures have enough variation in their polarity that they can be separated using hydrophilic interaction liquid chromatography (HILIC).18 In addition, lipid ions can adopt different conformations while in the gas phase. Depending on the headgroup and the degree and location of double bonds within the fatty acid tails, a lipid may be more or less compact in space.19−21 Ion mobility (IM) spectrometry can measure the apparent surface area, i.e., collision cross section (CCS), of an ion as it traverses an inert background gas.22 CCS values are shown to be highly reproducible across different IM platforms23−25 and have been used to enhance the confidence of lipid identification.26 While these advances have significantly improved the utility of lipidomics, some challenges remain.
One of these challenges is the ability to trace lipid metabolites, as is commonly done in other areas of metabolomics.2713C and deuterium labeling can be used to trace the metabolism of many compounds, including lipids,28−30 amino acids,31 and xenobiotics.32,33 Labeling a compound with 13C or deuterium results in an increase in mass that differentiates it from the endogenous, unlabeled analog. This mass shift can be detected with analytical methods including mass spectrometry and nuclear magnetic resonance and can be used to identify the compounds into which the molecule is metabolized.27 Applying this tool to lipidomics has been challenging because the mass shift associated with the isotopic label is often not enough to differentiate it from other lipids in the lipidome, since most lipids occur in a narrow mass range.34 It is likely that labeled peaks could be missed or incorrectly identified because they may be indistinguishable from other lipids in the same sample.
To overcome this challenge, we developed a dual-isotope labeling technique that uses an equimolar mix of two different deuterated fatty acids (referred to as dAAs). These fatty acids are incorporated into the lipidome equally by the cells, resulting in mass spectra with a signature doublet or triplet peak. These signature spectra, along with the same retention time and CCS values, can be used to recognize the features associated with the metabolites of the labeled fatty acids with confidence. We then developed a Python software, D-Tracer, to automatically pick out labeled metabolite pairs and correct the isotope shift to generate the m/z values of the corresponding nonlabeled lipids. We integrated this program with our previously developed Python package, LiPydomics, to identify the mass-corrected lipids using three-dimensional data that includes m/z, chromatographic retention time (RT), and CCS values.35 Subsequently, we applied this method to characterize the metabolic fate of labeled AA in HT-1080 endothelial cancer cells in the context of ferroptosis.
Experimental Section
Materials
Mass spectrometry-related materials were previously described.26,36 Briefly, HPLC-grade solvents (water, acetonitrile, methylene chloride, chloroform, and methanol) were purchased from Thermo Fisher Scientific. Optima LC/MS-grade ammonium acetate and sodium chloride were also obtained from a Thermo Fisher. d5- and d11-AA were purchased from Cayman Chemical (9000477 and 10006758, respectively). MS analysis of these dAA standards found that they do not contain d0-AA, but small amounts of d4-AA (<5%) and d10-AA (∼18%) are present in d5-AA and d11-AA standards, respectively (Figure S1).
Lipid Internal Standards
Phosphatidylethanolamine (PE) (15:0/15:0), ceramide (Cer) (d-18:1/17:0), PG (15:0/15:0), phosphatidylcholine (PC) (15:0/15:0), phosphatidic acid (PA) (12:0/12:0), phosphatidylserine (PS) (12:0/12:0), sphingomyelin (SM) (d-18:1/17:0), LysoPC (15:0/0:0), LysoPE (13:0/0:0), glucosylceramide (GluCer) (d-18:1/17:0), and d7-phosphatidylinositol (d7-PI) (15:0/18:1) were purchased from Avanti Polar Lipids. Diacylglycerol (DG) (13:0/13:0) and triglycerides (TG) (15:0/15:0/15:0) were purchased from NuChek. Table S1 lists the catalog numbers of all internal standards used. All standards were dissolved in LC/MS-grade methanol at a concentration of 10 mg/mL. To make the internal standard mix, the dissolved internal standards were diluted in DMSO such that each standard was dissolved at a final concentration of 240 μM.
Cell Culture
HT-1080 cells (ATCC) were cultured in a DMEM high-glucose medium containing 10% fetal bovine serum and 1% penicillin-streptomycin (Gibco). 5.0 × 10⁵ cells were plated in 10 cm dishes and incubated at 37 °C. Twenty-four hours later, the medium was exchanged to a medium containing 80 μM of each deuterated arachidonic acid, 0.03 μM RSL3, or both. The cells were harvested after another 24 h of incubation. To harvest the cells, we first placed cell culture dishes on ice. To retain any dead cell debris, the media was collected into labeled glass centrifuge tubes and centrifuged at 1000 rpm for 5 min. The medium was then aspirated, leaving behind a pellet of cell debris. The remaining cells were then rinsed with PBS, scraped off the plates, and placed in the corresponding centrifuge tube. Another round of centrifugation afforded the final cell pellets.
Lipid Extraction
Lipid extraction from treated cells took place as previously described.36 Briefly, cells were collected as described above. The cell pellet was resuspended in 300 μL of ice-cold PBS and sonicated for 30 min to lyse the cells. Protein levels were quantified using the Bio-Rad BSA Protein Quantification assay and a BioTek Synergy Microplate Reader. To each tube were added 1 mL of ice-cold 0.9% (w/v) NaCl aqueous solution, 4 mL of ice-cold Folch (2:1 v/v chloroform/methanol), and 12 μL of the 240 μM internal standard mix. The tubes were vortexed and centrifuged at 1000 rpm for 5 min. Using a glass Pasteur pipet with a mechanical pipet pump, the resulting lower organic layer was recovered from each tube and placed in a fresh tube. The solution was dried by using a speed vacuum concentrator (Thermo Fisher Savant SpeedVac). The dried extract was reconstituted in 300 μL of methylene chloride and transferred to HPLC screw-top vials. Immediately prior to MS analysis, 25 μL of each sample was transferred to an HPLC vial with an insert and dried under nitrogen, then reconstituted in 100 μL of acetonitrile/methanol (2:1) for injection.
HILIC-IM-MS Method
The samples were run on a Waters Synapt XS ion mobility-QTOF mass spectrometer with ESI as previously described.36 The instrument was calibrated for CCS using PC and PE standards before use.37 Sodium formate was used for mass calibration in both positive and negative modes. The HILIC A mobile phase is 95% acetonitrile, 5% water, and 5 mM ammonium acetate, while the HILIC B mobile phase is 50% acetonitrile, 50% water, and 5 mM ammonium acetate. The stationary phase used was a HILIC Phenomenex Kinetex 2.1 mm × 100 mm, 1.7 μm, column. Leucine enkephalin was used as a lock mass and CCS calibrant in both modes. The injection volume was 5 μL, and the solvent flow rate was 0.5 mL/min. The TriWave settings were as described in Table S2.36 The samples were injected in order with a blank and a pooled sample between each treatment group. Each run lasted 12 min starting with 100% HILIC A and dropping to 70% HILIC A by 8 min.
CCS Calibration
CCS calibration was carried out as previously described.37 Briefly, a mixture of phosphatidylcholine (PC) and phosphatidylethanolamine (PE) standards was directly infused into the ESI source of the mass spectrometer at 15 μL/min while m/z and CCS values were acquired. PE lipids were used as negative-mode calibrants, while PC lipids were used for the positive mode. See Table S3 for a complete list of lipids used.
Data Analysis
Data analysis was carried out using Waters Progenesis QI, EZ Info, and two in-house Python programs. First, Progenesis is used to align spectra, perform lock-mass calibration, and pick peaks. Treatment groups are compared to each other using ANOVA. Compounds that are significantly (corrected P-value <0.05) different between dAA-treated and untreated groups are exported to EZinfo for OPLS-DA analysis. Significantly increased features in the treatment group relative to controls are selected from the resulting S-plot and exported as a.csv file.
To find labeled lipid species, we developed Python software, D-Tracer, with a web interface. The software searches for species that have an RT within 0.01 min, a CCS within 3%, and an m/z separated by (D2 – D1) times the mass of deuterium. D1 and D2 are user inputs that can be customized. In our case, D2 is 11 and D1 is 5. The mass of the deuterium is then subtracted from each identified species, and the output.csv contains the original m/z, adjusted m/z, RT, CCS, and normalized intensities for each lipid. The number of samples is also a user input that can be customized. The software has been tested on peaklists containing up to 6000 compounds and can complete analysis of these large data sets in less than 5 min. The source code is available on GitHub under the name D-Tracer (https://github.com/nreimers99/d-tracer).
To identify lipid species, we used LiPydomics, which is a Python software developed by our group.35 LiPydomics identifies lipids by comparing their RT, m/z, and CCS to known values in a database. Identifications are further confirmed using the LipidMaps database. To quantify each lipid species, the intensities of individual lipid species were compared with an internal standard from the same class (Table S1).
Results and Discussion
Development of D-Tracer
There are existing programs commonly used to analyze lipidomics data and identify lipids based on their m/z, RT, and CCS values, including LipidIMMS,38 MS-Dial 4,39,40 and LiPydomics.35 However, these programs could not be used to identify isotope-labeled lipids due to the isotopic mass shift from deuterium incorporation. To identify the lipids using established databases, the mass of deuterium-containing lipids must first be adjusted to the mass of the corresponding nonlabeled lipid. Some programs can analyze single-isotope labeling experiments41−43 but, to our knowledge, no program is currently available for dual-isotope labeling lipidomics. To address this, we developed a web-based Python program called D-Tracer to find and adjust the mass of deuterated lipids. The program was designed to be intuitive and accessible to those without prior coding experience. The simple web version can be accessed by a URL (https://nreimers99-d-tracer-original-d-tracerapplication-xji04u.streamlit.app/; see the Supporting Information for detailed instructions), whereas the full version can be used in the terminal. The program can analyze dual isotope deuterium labeling experiments with any degree of deuteration from 0 to 80 and any .csv peaklist if it contains RT, CCS, and m/z columns. A schematic of the D-Tracer is shown in Figure 2A.
Figure 2.
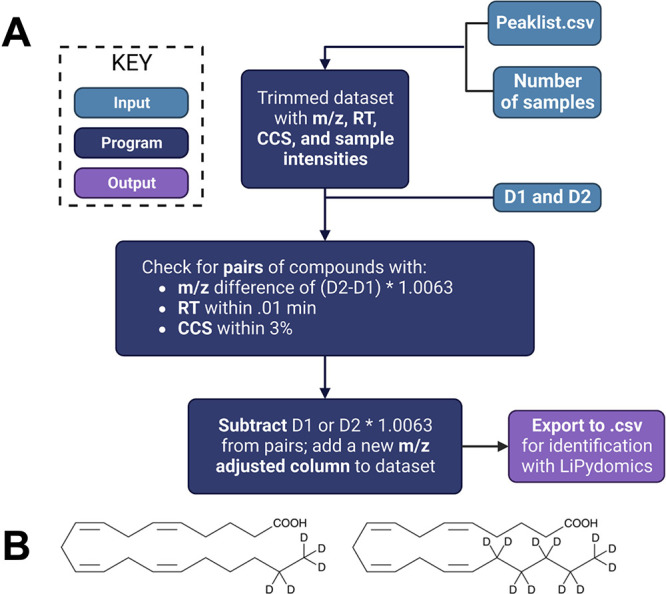
(A) Schematic of Python-based software D-Tracer. User inputs into the program are shown in light blue, functions are shown in dark blue, and outputs are shown in purple. Detailed information on D-Tracer can be found in Supporting Information. Figure created using BioRender.com. (B) Structures of d5-AA and d11-AA.
To use the program, the user first uploads a peaklist and specifies the types of deuterium labels used in their experiments. The labels can be separated in mass by any number of deuterium atoms. D1 refers to the smaller number of atoms (0 is the smallest possible), and D2 refers to the larger one. The program will then scan through the peaklist and search for all species with a mass difference of the two masses, as calculated below.
In our case, this value is 6 × 1.0063 or 6.0378 Da. Once a match is identified, the program checks that the retention time is within 0.01 min and that the CCS values are within 3% of each other. These tolerance values are hard-coded into the web version but can be manipulated in the source code available on Github. If all three criteria are fulfilled, the feature pair is added to a new data set. The program will then subtract the mass of the deuterium from the pairs so they can be identified using existing software for nonlabeled lipids. To do this, the program subtracts the specified D1 and D2 masses from the smaller and larger masses, respectively, for each pair. The adjusted masses are added as a separate column to the pairs.csv file, which can then be exported for further analysis.
Deuterated lipids were first identified from peak lists containing features that were significantly different between the dAA-treated and untreated groups using D-Tracer. The lipids were then validated by a manual inspection of the mass spectra. Correctly identified deuterated lipids appear as a doublet or triplet peak on the mass spectra. The doublet peak is formed when d5- and d11-AA (Figure 2B) are incorporated into the species at a higher concentration than unlabeled AA from the media (Figure 3A). The triplet peak is observed when two AAs are incorporated, giving lipid species with two d5-AA, one d5-AA and one d11-AA, and two d11-AA, separated by 6 Da each (Figure 3A, bottom panel). The m/z values of the nonlabeled version of such lipid species are then calculated manually accordingly.
Figure 3.

(A) Examples of signature doublet and triplet peaks from lipids that incorporate d5-AA and d11-AA. Peaks labeled d0-AA represent the lipid incorporating unlabeled AA. PC (42:8) and PC (44:8) each incorporate two AA, so they form triplets corresponding to two d5-AAs, one d5-AA and one d11-AA, and two d11-AAs. (B) Targeted MS/MS fragmentation of PE (22:4/18:0) incorporating d5-AA and d11-AA, respectively.
Once dAA-containing lipids were extracted from the peaklists with D-Tracer, the resulting mass-adjusted lipid species were processed further using LiPydomics, which identifies lipids based on RT, CCS, and m/z values.35 The identifications were cross-validated using the Lipid MAPS MS bulk data search, which searches for m/z matches in its lipid database.
Dual-Isotope Labeling Reveals Differential Incorporation of Exogenous AAs into Various Lipid Classes
Using the workflow described above, we carried out comprehensive dAA-tracing in the cancer cell line, HT-1080, in the presence of a vehicle (control or C), the ferroptosis inducer RSL3 (R), dAA only (D), or cotreatment with dAA and RSL3 (DR). HT-1080 is a well-established cell line that is susceptible to ferroptosis when treated with various ferroptosis inducers, including RSL3.9 We first confirmed increased lipid peroxidation using flow cytometry after treatment with C11-BODIPY,44,45 which specifically reacts with peroxyl radicals, suggesting the occurrence of ferroptosis when the cells were cotreated with dAA and RSL3 (see Figure S1). After analysis using D-Tracer and LiPydomics, we found that dAAs were incorporated into triglycerides (TG), phosphatidylinositol (PI), phosphatidylethanolamine (PE), phosphatidylserine (PS), and phosphatidylcholine (PC) species. The list of dAA-containing lipids is summarized in Tables S2 and S3. Representative doublet (one AA chain) and triplet (two AA chains) mass spectra are shown in Figure 3A. Untargeted fragmentation of various lipid classes using MSE (Figure S2) allowed the confirmation of the incorporation of d5- or d11-AA. Interestingly, elongation of dAA to 22:4 followed by incorporation to phospholipids was also observed, as confirmed by targeted fragmentation, supporting the utility of dual-isotope tracking of AA metabolism (Figure 3B).
Quantification of the lipid classes was carried out by comparison with an internal standard from each class with a known concentration (Figure 4). The highest level of dAA incorporation was that into TG (69% of total dAA-containing lipid quantity), followed by PI (14% of total lipid). Incorporation into PS, PC, and PE lipids comprised 10% or less of the total quantity in the dAA-only treatment group (Figure 4A). In the dAA + RSL3 treatment group, the level of incorporation into TG decreased from 69% to 64%, while incorporation into PI increased from 14% to 20% (Figure 4B). Incorporation into other classes did not change significantly in the cotreatment group from the dAA-only group. The high degree of incorporation into TG species is likely due to the increased formation of lipid droplets in response to high levels of exogenous fatty acids.46,47 The alterations in the dAA-containing lipid composition in the presence of RSL3 may be a result of ongoing ferroptosis. For example, TGs may be preferentially oxidized in lipid droplets, while PIs may not readily undergo lipid peroxidation. However, the elucidation of the detailed roles of these lipids in ferroptosis may involve quantification of these lipids in specific organelles.
Figure 4.

Percent of total dAA incorporation by lipid species. The quantity of lipid incorporation was determined by comparison with an internal standard of a known concentration. The quantity of each class was divided by the total to determine the percent of each class. This process was completed for (A) the dAA-only treatment group and (b) the dAA + RSL3 treatment group.
Figure 5 depicts the phospholipid biosynthetic pathway and highlights the lipid classes that incorporated dAAs. As seen from the Figure, not all lipid classes incorporated dAA in detectable quantities. Phosphatidic acid (PA) and diacylglycerol (DG) are precursors for PI, PE, PC, and PS phospholipids (Figure 5), but they were not found to incorporate dAA. In addition, dAAs were not found in sphingolipids, suggesting sphingolipids do not readily incorporate AAs or promote ferroptosis. PUFA-containing ether lipids have been previously found to promote ferroptosis susceptibility.48 Indeed, we found that dAA was incorporated into plasmanyl ether lipids, including PE, PS, and PC ether lipids. The individual species that incorporated dAA and their normalized intensities are shown in a heatmap (Figure 6). As expected, the normalized intensities of all dAA-containing lipids are the highest in dAA-treated groups D and RD.
Figure 5.

Scheme of the biosynthetic pathway of phospholipids via the cytidine diphosphate diacylglycerol (CDP-DAG) intermediate. Species found to incorporate dAAs are shown in yellow. Darker yellow indicates more incorporation; lighter yellow indicates less incorporation as measured by quantitation. Abbreviations are as follows: DHAP, dihydroxyacetone phosphate; CMP, cytidine monophosphate; G3PDH, glycerol-3-phosphate dehydrogenase; GNPAT, glycerone phosphate O-acyltransferase; AGPS, alkylglycerone phosphate synthase; and FAR1, fatty acyl-CoA reductase. Figure created using BioRender.com.
Figure 6.

Heatmap of identified dAA-incorporating lipid species and their relative abundances. Rows are centered; unit variance scaling is applied to rows. Rows are clustered using the correlation distance and average linkage. Columns are clustered using the Euclidean distance and average linkage. Figure created using ClustVis.
In addition, the abundances of lipids in each class, as determined by comparison with the internal standards, were found to be higher in the dAA-only group than in the dAA + RSL3 group, although not every class of lipids displayed statistical significance (Figure 7). This could be due to the reduced viability of cells in the cotreatment group, which could lead to overall decreased lipid levels, and/or the oxidation of the parent lipids. Indeed, by manually inspecting the data, we were able to identify an oxidized PE species, PE (38:4) + 14 Da, which corresponds to +O-2H of PE (38:4) (Figure 8 and S4).
Figure 7.

Approximate quantity of dAA-incorporating lipids across classes in dAA-only and dAA + RSL3-treated cells. Significance was determined by Student’s t test; *P value <0.05. Abbreviations are as follows: TG, triglycerides; PE, phosphatidylethanolamine; PI, phosphatidylinositol; PS, phosphatidylserine; and PC, phosphatidylcholine. A plus (+) or minus (−) signs in the title indicates that the species was detected in the positive or negative mode, respectively.
Figure 8.

Ratio of the abundance of PE (38:4) + 14 over total abundance of PE (38:4) and PE (38:4) + 14 in dAA-only and dAA + RSL3 treatment groups. P-values computed using Student’s t test; **P < 0.002.
Interestingly, the ratio of oxidized lipid to parent lipid was higher in the dAA + RSL3 group than in the dAA-only group, despite the overall lower lipid abundance in the cotreatment group (Figure 8). The identification of the oxidized PE demonstrates the utility of dual-isotope labeling in the confident detection of low-abundance metabolites. The observation of a higher level of oxidized PE supports the important roles of PE peroxidation in the execution of ferroptosis, which is consistent with a previous report by Kagan et al.11 We note that there are a number of other dAA-containing lipids that were not identified through LiPydomics and LIPID MAPS. We speculate that these unidentified lipids are also likely oxidized lipids.
However, due to the low abundance of these species, targeted fragmentation is not possible to obtain the fatty acid composition. Thus, a limitation of LiPydomics is the lack of coverage of the oxidized lipids in its RT and CCS database, and a future direction of this work is to expand the three-dimensional database to include such lipids.
Conclusion
Here we report the development and application of dual-isotope labeling lipidomics to the study of in vitro AA metabolism during ferroptosis. We developed a Python software, D-Tracer, to automatically analyze deuterium isotope-labeled mass spectra with a user-friendly web interface. Combining this software and LiPydomics for lipid identification, we found that deuterated AA is incorporated into several lipid classes in HT-1080 cells, with TG being the predominant one. The abundances of nonoxidized lipids were lower in dAA + RSL3-treated cells relative to dAA-treated cells, while the oxidized lipids display an opposite trend, supporting the role of lipid peroxidation in ferroptosis. Thus, dual isotope labeling combined with three-dimensional HILIC-IM-MS can effectively elucidate lipid metabolic changes associated with biological processes and disease states. The D-Tracer program can also be easily modified to characterize the metabolism of other biological molecules, such as sugar and peptides, potentially expanding its utility.
Acknowledgments
This work was supported by grants from the National Science Foundation (CHE-1664851) and the National Institutes of Health (R01HD092659). N.R. was supported by the Pharmacological Sciences Training Program funded by the National Institutes of Health (T32GM007750).
Data Availability Statement
The raw mass spectrometry data can be found on MassIVE under MSV000092288 (https://doi.org/10.25345/C5RF5KR70).
Supporting Information Available
The Supporting Information is available free of charge at https://pubs.acs.org/doi/10.1021/jasms.3c00181.
List of lipid standards, MS parameters, flow cytometry data, untargeted fragmentation mass spectra, examples of mass spectra of dAA-labeled peaks, mass spectra of oxidized lipids, and instructions on using D-Tracer software (PDF)
List of dAA-containing lipids in the positive mode (XLSX)
List of dAA-containing lipids in the negative mode (XLSX)
Author Present Address
∇ Fred Hutchinson Cancer Center, Seattle, WA 98109
Author Contributions
L.X. conceptualized the study; N.R. and L.X. designed the experiments; N.R. carried out most of the experiments and analyzed the data; N.R., R.O., A.S., and C.V. developed D-Tracer; A.G. contributed to cell culture; Q.D. and R.Z. contributed to lipidomics analysis; N.R. drafted the manuscript; and L.X. revised the manuscript. All authors have given approval to the submitted version of the manuscript.
The authors declare no competing financial interest.
Special Issue
Published as part of the Journal of the American Society for Mass Spectrometryvirtual special issue “Focus: Next Generation Mass Spectrometry Omics Technologies”.
Supplementary Material
References
- Han X.; Gross R. W. Global Analyses of Cellular Lipidomes Directly from Crude Extracts of Biological Samples by ESI Mass Spectrometry: A Bridge to Lipidomics. J. Lipid Res. 2003, 44 (6), 1071–1079. 10.1194/jlr.R300004-JLR200. [DOI] [PubMed] [Google Scholar]
- Han X. Lipidomics for Studying Metabolism. Nat. Rev. Endocrinol 2016, 12 (11), 668–679. 10.1038/nrendo.2016.98. [DOI] [PubMed] [Google Scholar]
- Koundouros N.; Poulogiannis G. Reprogramming of Fatty Acid Metabolism in Cancer. Br. J. Cancer 2020, 122 (1), 4–22. 10.1038/s41416-019-0650-z. [DOI] [PMC free article] [PubMed] [Google Scholar]
- Vriens K.; Christen S.; Parik S.; Broekaert D.; Yoshinaga K.; Talebi A.; Dehairs J.; Escalona-Noguero C.; Schmieder R.; Cornfield T.; Charlton C.; Romero-Pérez L.; Rossi M.; Rinaldi G.; Orth M. F.; Boon R.; Kerstens A.; Kwan S. Y.; Faubert B.; Méndez-Lucas A.; Kopitz C. C.; Chen T.; Fernandez-Garcia J.; Duarte J. A. G.; Schmitz A. A.; Steigemann P.; Najimi M.; Hägebarth A.; Van Ginderachter J. A.; Sokal E.; Gotoh N.; Wong K.-K.; Verfaillie C.; Derua R.; Munck S.; Yuneva M.; Beretta L.; DeBerardinis R. J.; Swinnen J. V.; Hodson L.; Cassiman D.; Verslype C.; Christian S.; Grünewald S.; Grünewald T. G. P.; Fendt S.-M. Evidence for an Alternative Fatty Acid Desaturation Pathway Increasing Cancer Plasticity. Nature 2019, 566 (7744), 403–406. 10.1038/s41586-019-0904-1. [DOI] [PMC free article] [PubMed] [Google Scholar]
- Yi J.; Zhu J.; Wu J.; Thompson C. B.; Jiang X. Oncogenic Activation of PI3K-AKT-MTOR Signaling Suppresses Ferroptosis via SREBP-Mediated Lipogenesis. Proc. Natl. Acad. Sci. U.S.A. 2020, 117 (49), 31189–31197. 10.1073/pnas.2017152117. [DOI] [PMC free article] [PubMed] [Google Scholar]
- Goldberg I. J.; Trent C. M.; Schulze P. C. Lipid Metabolism and Toxicity in the Heart. Cell Metabolism 2012, 15 (6), 805–812. 10.1016/j.cmet.2012.04.006. [DOI] [PMC free article] [PubMed] [Google Scholar]
- Reddy J. K.; Sambasiva Rao M. Lipid Metabolism and Liver Inflammation. II. Fatty Liver Disease and Fatty Acid Oxidation. American Journal of Physiology-Gastrointestinal and Liver Physiology 2006, 290 (5), G852–G858. 10.1152/ajpgi.00521.2005. [DOI] [PubMed] [Google Scholar]
- Adibhatla R. M.; Hatcher J. F.. Altered Lipid Metabolism in Brain Injury and Disorders. In Lipids in Health and Disease; Quinn P. J., Wang X., Eds.; Subcellular Biochemistry, Vol. 49; Springer Netherlands: Dordrecht, Netherlands, 2008; pp 241–268. 10.1007/978-1-4020-8831-5_9. [DOI] [PMC free article] [PubMed] [Google Scholar]
- Dixon S. J.; Lemberg K. M.; Lamprecht M. R.; Skouta R.; Zaitsev E. M.; Gleason C. E.; Patel D. N.; Bauer A. J.; Cantley A. M.; Yang W. S.; Morrison B.; Stockwell B. R. Ferroptosis: An Iron-Dependent Form of Nonapoptotic Cell Death. Cell 2012, 149 (5), 1060–1072. 10.1016/j.cell.2012.03.042. [DOI] [PMC free article] [PubMed] [Google Scholar]
- Doll S.; Proneth B.; Tyurina Y. Y.; Panzilius E.; Kobayashi S.; Ingold I.; Irmler M.; Beckers J.; Aichler M.; Walch A.; Prokisch H.; Trümbach D.; Mao G.; Qu F.; Bayir H.; Füllekrug J.; Scheel C. H.; Wurst W.; Schick J. A.; Kagan V. E.; Angeli J. P. F.; Conrad M. ACSL4 Dictates Ferroptosis Sensitivity by Shaping Cellular Lipid Composition. Nat. Chem. Biol. 2017, 13 (1), 91–98. 10.1038/nchembio.2239. [DOI] [PMC free article] [PubMed] [Google Scholar]
- Kagan V. E.; Mao G.; Qu F.; Angeli J. P. F.; Doll S.; Croix C. S.; Dar H. H.; Liu B.; Tyurin V. A.; Ritov V. B.; Kapralov A. A.; Amoscato A. A.; Jiang J.; Anthonymuthu T.; Mohammadyani D.; Yang Q.; Proneth B.; Klein-Seetharaman J.; Watkins S.; Bahar I.; Greenberger J.; Mallampalli R. K.; Stockwell B. R.; Tyurina Y. Y.; Conrad M.; Bayır H. Oxidized Arachidonic and Adrenic PEs Navigate Cells to Ferroptosis. Nat. Chem. Biol. 2017, 13 (1), 81–90. 10.1038/nchembio.2238. [DOI] [PMC free article] [PubMed] [Google Scholar]
- Yang W. S.; Kim K. J.; Gaschler M. M.; Patel M.; Shchepinov M. S.; Stockwell B. R. Peroxidation of Polyunsaturated Fatty Acids by Lipoxygenases Drives Ferroptosis. Proc. Natl. Acad. Sci. U. S. A. 2016, 113 (34), E4966–E4975. 10.1073/pnas.1603244113. [DOI] [PMC free article] [PubMed] [Google Scholar]
- Yin H.; Xu L.; Porter N. A. Free Radical Lipid Peroxidation: Mechanisms and Analysis. Chem. Rev. 2011, 111 (10), 5944–5972. 10.1021/cr200084z. [DOI] [PubMed] [Google Scholar]
- Abdelmagid S. A.; Clarke S. E.; Nielsen D. E.; Badawi A.; El-Sohemy A.; Mutch D. M.; Ma D. W. L. Comprehensive Profiling of Plasma Fatty Acid Concentrations in Young Healthy Canadian Adults. PLoS One 2015, 10 (2), e0116195 10.1371/journal.pone.0116195. [DOI] [PMC free article] [PubMed] [Google Scholar]
- Do Q.; Zhang R.; Hooper G.; Xu L. Differential Contributions of Distinct Free Radical Peroxidation Mechanisms to the Induction of Ferroptosis. JACS Au 2023, 3, 1100. 10.1021/jacsau.2c00681. [DOI] [PMC free article] [PubMed] [Google Scholar]
- Sud M.; Fahy E.; Cotter D.; Brown A.; Dennis E. A.; Glass C. K.; Merrill A. H.; Murphy R. C.; Raetz C. R. H.; Russell D. W.; Subramaniam S. LMSD: LIPID MAPS Structure Database. Nucleic Acids Res. 2007, 35 (Database), D527–D532. 10.1093/nar/gkl838. [DOI] [PMC free article] [PubMed] [Google Scholar]
- Blanksby S. J.; Mitchell T. W. Advances in Mass Spectrometry for Lipidomics. Annual Rev. Anal. Chem. 2010, 3 (1), 433–465. 10.1146/annurev.anchem.111808.073705. [DOI] [PubMed] [Google Scholar]
- Schwalbe-Herrmann M.; Willmann J.; Leibfritz D. Separation of Phospholipid Classes by Hydrophilic Interaction Chromatography Detected by Electrospray Ionization Mass Spectrometry. Journal of Chromatography A 2010, 1217 (32), 5179–5183. 10.1016/j.chroma.2010.05.014. [DOI] [PubMed] [Google Scholar]
- Kyle J. E.; Zhang X.; Weitz K. K.; Monroe M. E.; Ibrahim Y. M.; Moore R. J.; Cha J.; Sun X.; Lovelace E. S.; Wagoner J.; Polyak S. J.; Metz T. O.; Dey S. K.; Smith R. D.; Burnum-Johnson K. E.; Baker E. S. Uncovering Biologically Significant Lipid Isomers with Liquid Chromatography, Ion Mobility Spectrometry and Mass Spectrometry. Analyst 2016, 141 (5), 1649–1659. 10.1039/C5AN02062J. [DOI] [PMC free article] [PubMed] [Google Scholar]
- Zhou Z.; Tu J.; Xiong X.; Shen X.; Zhu Z.-J. LipidCCS: Prediction of Collision Cross-Section Values for Lipids with High Precision To Support Ion Mobility-Mass Spectrometry-Based Lipidomics. Anal. Chem. 2017, 89 (17), 9559–9566. 10.1021/acs.analchem.7b02625. [DOI] [PubMed] [Google Scholar]
- Leaptrot K. L.; May J. C.; Dodds J. N.; McLean J. A. Ion Mobility Conformational Lipid Atlas for High Confidence Lipidomics. Nat. Commun. 2019, 10 (1), 985. 10.1038/s41467-019-08897-5. [DOI] [PMC free article] [PubMed] [Google Scholar]
- Mason E. A.; Schamp H. W. Mobility of Gaseous Lons in Weak Electric Fields. Annals of Physics 1958, 4 (3), 233–270. 10.1016/0003-4916(58)90049-6. [DOI] [Google Scholar]
- Hinz C.; Liggi S.; Griffin J. L. The Potential of Ion Mobility Mass Spectrometry for High-Throughput and High-Resolution Lipidomics. Curr. Opin. Chem. Biol. 2018, 42, 42–50. 10.1016/j.cbpa.2017.10.018. [DOI] [PubMed] [Google Scholar]
- Ross D. H.; Cho J. H.; Xu L. Breaking Down Structural Diversity for Comprehensive Prediction of Ion-Neutral Collision Cross Sections. Anal. Chem. 2020, 92 (6), 4548–4557. 10.1021/acs.analchem.9b05772. [DOI] [PubMed] [Google Scholar]
- Hinnenkamp V.; Klein J.; Meckelmann S. W.; Balsaa P.; Schmidt T. C.; Schmitz O. J. Comparison of CCS Values Determined by Traveling Wave Ion Mobility Mass Spectrometry and Drift Tube Ion Mobility Mass Spectrometry. Anal. Chem. 2018, 90 (20), 12042–12050. 10.1021/acs.analchem.8b02711. [DOI] [PubMed] [Google Scholar]
- Hines K. M.; Herron J.; Xu L. Assessment of Altered Lipid Homeostasis by HILIC-Ion Mobility-Mass Spectrometry-Based Lipidomics. J. Lipid Res. 2017, 58 (4), 809–819. 10.1194/jlr.D074724. [DOI] [PMC free article] [PubMed] [Google Scholar]
- Jang C.; Chen L.; Rabinowitz J. D. Metabolomics and Isotope Tracing. Cell 2018, 173 (4), 822–837. 10.1016/j.cell.2018.03.055. [DOI] [PMC free article] [PubMed] [Google Scholar]
- Kamphorst J. J.; Cross J. R.; Fan J.; De Stanchina E.; Mathew R.; White E. P.; Thompson C. B.; Rabinowitz J. D. Hypoxic and Ras-Transformed Cells Support Growth by Scavenging Unsaturated Fatty Acids from Lysophospholipids. Proc. Natl. Acad. Sci. U.S.A. 2013, 110 (22), 8882–8887. 10.1073/pnas.1307237110. [DOI] [PMC free article] [PubMed] [Google Scholar]
- Donnelly K. L.; Smith C. I.; Schwarzenberg S. J.; Jessurun J.; Boldt M. D.; Parks E. J. Sources of Fatty Acids Stored in Liver and Secreted via Lipoproteins in Patients with Nonalcoholic Fatty Liver Disease. J. Clin Invest 2005, 115 (5), 1343–1351. 10.1172/JCI23621. [DOI] [PMC free article] [PubMed] [Google Scholar]
- Louie S. M.; Roberts L. S.; Mulvihill M. M.; Luo K.; Nomura D. K. Cancer Cells Incorporate and Remodel Exogenous Palmitate into Structural and Oncogenic Signaling Lipids. Biochimica et Biophysica Acta (BBA) - Molecular and Cell Biology of Lipids 2013, 1831 (10), 1566–1572. 10.1016/j.bbalip.2013.07.008. [DOI] [PMC free article] [PubMed] [Google Scholar]
- Ducker G. S.; Chen L.; Morscher R. J.; Ghergurovich J. M.; Esposito M.; Teng X.; Kang Y.; Rabinowitz J. D. Reversal of Cytosolic One-Carbon Flux Compensates for Loss of the Mitochondrial Folate Pathway. Cell Metabolism 2016, 23 (6), 1140–1153. 10.1016/j.cmet.2016.04.016. [DOI] [PMC free article] [PubMed] [Google Scholar]
- Hu L.; Zeng Z.; Xia Q.; Liu Z.; Feng X.; Chen J.; Huang M.; Chen L.; Fang Z.; Liu Q.; Zeng H.; Zhou X.; Liu J. Metformin Attenuates Hepatoma Cell Proliferation by Decreasing Glycolytic Flux through the HIF-1α/PFKFB3/PFK1 Pathway. Life Sciences 2019, 239, 116966. 10.1016/j.lfs.2019.116966. [DOI] [PubMed] [Google Scholar]
- Suthers P. F.; Burgard A. P.; Dasika M. S.; Nowroozi F.; Van Dien S.; Keasling J. D.; Maranas C. D. Metabolic Flux Elucidation for Large-Scale Models Using 13C Labeled Isotopes. Metabolic Engineering 2007, 9 (5), 387–405. 10.1016/j.ymben.2007.05.005. [DOI] [PMC free article] [PubMed] [Google Scholar]
- Triebl A.; Wenk M. R. Analytical Considerations of Stable Isotope Labelling in Lipidomics. Biomolecules 2018, 8 (4), 151. 10.3390/biom8040151. [DOI] [PMC free article] [PubMed] [Google Scholar]
- Ross D. H.; Cho J. H.; Zhang R.; Hines K. M.; Xu L. LiPydomics: A Python Package for Comprehensive Prediction of Lipid Collision Cross Sections and Retention Times and Analysis of Ion Mobility-Mass Spectrometry-Based Lipidomics Data. Anal. Chem. 2020, 92 (22), 14967–14975. 10.1021/acs.analchem.0c02560. [DOI] [PMC free article] [PubMed] [Google Scholar]
- Li A.; Hines K. M.; Xu L.. Lipidomics by HILIC-Ion Mobility-Mass Spectrometry. In Ion Mobility-Mass Spectrometry; Paglia G., Astarita G., Eds.; Methods in Molecular Biology, Vol. 2084; Springer: New York, NY, 2020; pp 119–132. 10.1007/978-1-0716-0030-6_7. [DOI] [PMC free article] [PubMed] [Google Scholar]
- Hines K. M.; May J. C.; McLean J. A.; Xu L. Evaluation of Collision Cross Section Calibrants for Structural Analysis of Lipids by Traveling Wave Ion Mobility-Mass Spectrometry. Anal. Chem. 2016, 88 (14), 7329–7336. 10.1021/acs.analchem.6b01728. [DOI] [PMC free article] [PubMed] [Google Scholar]
- Zhou Z.; Shen X.; Chen X.; Tu J.; Xiong X.; Zhu Z.-J. LipidIMMS Analyzer: Integrating Multi-Dimensional Information to Support Lipid Identification in Ion Mobility-Mass Spectrometry Based Lipidomics. Bioinformatics 2019, 35 (4), 698–700. 10.1093/bioinformatics/bty661. [DOI] [PubMed] [Google Scholar]
- Tsugawa H.; Cajka T.; Kind T.; Ma Y.; Higgins B.; Ikeda K.; Kanazawa M.; VanderGheynst J.; Fiehn O.; Arita M. MS-DIAL: Data-Independent MS/MS Deconvolution for Comprehensive Metabolome Analysis. Nat. Methods 2015, 12 (6), 523–526. 10.1038/nmeth.3393. [DOI] [PMC free article] [PubMed] [Google Scholar]
- Tsugawa H.; Ikeda K.; Takahashi M.; Satoh A.; Mori Y.; Uchino H.; Okahashi N.; Yamada Y.; Tada I.; Bonini P.; Higashi Y.; Okazaki Y.; Zhou Z.; Zhu Z.-J.; Koelmel J.; Cajka T.; Fiehn O.; Saito K.; Arita M.; Arita M. A Lipidome Atlas in MS-DIAL 4. Nat. Biotechnol. 2020, 38 (10), 1159–1163. 10.1038/s41587-020-0531-2. [DOI] [PubMed] [Google Scholar]
- Millard P.; Letisse F.; Sokol S.; Portais J.-C. IsoCor: Correcting MS Data in Isotope Labeling Experiments. Bioinformatics 2012, 28 (9), 1294–1296. 10.1093/bioinformatics/bts127. [DOI] [PubMed] [Google Scholar]
- Huang X.; Chen Y.-J.; Cho K.; Nikolskiy I.; Crawford P. A.; Patti G. J. X13CMS: Global Tracking of Isotopic Labels in Untargeted Metabolomics. Anal. Chem. 2014, 86 (3), 1632–1639. 10.1021/ac403384n. [DOI] [PMC free article] [PubMed] [Google Scholar]
- Isotope Distribution Calculator and Mass Spec Plotter. Scientific Instrument Services, Adaptas Solutions: Palmer, MA, n.d. https://www.sisweb.com/mstools/isotope.htm (accessed 2023-04-19).
- Martinez A. M.; Kim A.; Yang W. S.. Detection of Ferroptosis by BODIPYTM 581/591 C11. In Immune Mediators in Cancer; Vancurova I., Zhu Y., Eds.; Methods in Molecular Biology, Vol. 2108; Springer: New York, NY, 2020; pp 125–130. 10.1007/978-1-0716-0247-8_11. [DOI] [PubMed] [Google Scholar]
- Drummen G. P. C.; van Liebergen L. C. M.; Op den Kamp J. A. F.; Post J. A. C11-BODIPY(581/591), an Oxidation-Sensitive Fluorescent Lipid Peroxidation Probe: (Micro)Spectroscopic Characterization and Validation of Methodology. Free Radic Biol. Med. 2002, 33 (4), 473–490. 10.1016/S0891-5849(02)00848-1. [DOI] [PubMed] [Google Scholar]
- Magtanong L.; Ko P.-J.; To M.; Cao J. Y.; Forcina G. C.; Tarangelo A.; Ward C. C.; Cho K.; Patti G. J.; Nomura D. K.; Olzmann J. A.; Dixon S. J. Exogenous Monounsaturated Fatty Acids Promote a Ferroptosis-Resistant Cell State. Cell Chemical Biology 2019, 26 (3), 420–432. 10.1016/j.chembiol.2018.11.016. [DOI] [PMC free article] [PubMed] [Google Scholar]
- von Krusenstiern A. N.; Robson R. N.; Qian N.; Qiu B.; Hu F.; Reznik E.; Smith N.; Zandkarimi F.; Estes V. M.; Dupont M.; Hirschhorn T.; Shchepinov M. S.; Min W.; Woerpel K. A.; Stockwell B. R. Identification of Essential Sites of Lipid Peroxidation in Ferroptosis. Nat. Chem. Biol. 2023, 19, 719. 10.1038/s41589-022-01249-3. [DOI] [PMC free article] [PubMed] [Google Scholar]
- Zou Y.; Henry W. S.; Ricq E. L.; Graham E. T.; Phadnis V. V.; Maretich P.; Paradkar S.; Boehnke N.; Deik A. A.; Reinhardt F.; Eaton J. K.; Ferguson B.; Wang W.; Fairman J.; Keys H. R.; Dančík V.; Clish C. B.; Clemons P. A.; Hammond P. T.; Boyer L. A.; Weinberg R. A.; Schreiber S. L. Plasticity of Ether Lipids Promotes Ferroptosis Susceptibility and Evasion. Nature 2020, 585 (7826), 603–608. 10.1038/s41586-020-2732-8. [DOI] [PMC free article] [PubMed] [Google Scholar]
Associated Data
This section collects any data citations, data availability statements, or supplementary materials included in this article.
Supplementary Materials
Data Availability Statement
The raw mass spectrometry data can be found on MassIVE under MSV000092288 (https://doi.org/10.25345/C5RF5KR70).