Abstract
Yellow phosphorus slag (YPS) is a byproduct from the production of yellow phosphorus. It has potential pozzolanic activity and can be used as a supplementary cementitious material. However, the early strength of cement mortar decreases significantly with increasing YPS dosage, which restricts the utilization of YPS in cement and concrete. This study aimed to increase the pozzolanic activity of YPS ash by thermal activation. The strength method, alkali dissolution method and polymerization degree method were used to evaluate the effect of thermal activation at different temperatures on the pozzolanic activity of YPS ash. The results showed that YPS ash calcined at 800 °C helps to enhance the early strength because the fluorine in cuspidine (Ca4Si2O7F2) is insoluble, reducing the retarding effect on the mortar. The higher late strength of YPS ash calcined at 100 °C was due to the low polymerization degree of [SiO4]. The pozzolanic activity of YPS ash is positively correlated with the dissolution concentration of (Si + Al) and the compressive strength and negatively associated with the polymerization degree. This paper shows a possibility for the large-scale utilization of YPS.
Keywords: yellow phosphorus slag, thermal activation, pozzolanic activity, compressive strength, alkali dissolution, polymerization degree
1. Introduction
Yellow phosphorus slag (YPS) is a byproduct from the production of yellow phosphorus using phosphorus ore by the electric furnace method [1,2]. Phosphate ore reacts with coke to form phosphorus, and its impurities react with silica to obtain YPS [3]. Each ton of yellow phosphorus will produce approximately 8–12 tons of YPS [4]. China, as the largest yellow phosphorus producer, produces approximately 8 million tons of YPS annually, but the comprehensive utilization rate of YPS is lower than 50% [4]. Most YPS is stacking-treated by the factory, which not only takes up land resources but also damages the environment and affects human health by dissolving the phosphorus and fluorine components in rainwater [5,6]. Therefore, it is essential and urgent to find ways to dispose of YPS.
Meanwhile, cement is one of the three basic materials in the construction industry and has high carbon emissions and energy consumption in its production [7]. In recent decades, CO2 emission reduction, environmental protection and energy conservation have been major concerns for the cement industry [8,9]. A large number of industrial solid wastes have been widely applied in cement and concrete as cementitious materials or mineral admixtures [10,11,12]. This not only reduces the cost of solid waste dam management and operation and cement production but also decreases the environmental pollution problems caused by solid waste storage [13].
The chemical composition of YPS varies depending on the raw materials and manufacturing process. Molten YPS is rapidly cooled by water quenching from high temperature to room temperature. CaO and SiO2 are the main components of YPS, and the glassy-phase content can reach 85–90% in YPS [14]. Therefore, YPS has potential pozzolanic activity and can be applied to the field of building materials such as cement, concrete, supplementary cementitious materials, road base materials and backfill materials [15,16]. A small amount of YPS replacing silicate cement in concrete can decrease the dosage of silicate cement. YPS reacts with calcium hydroxide in cement and produces C-S-H gel during cementitious reaction, which can refine the microstructure of concrete, reduce harmful pores and improve the mechanical properties of concrete. Wang et al. [17] investigated the impact of YPS on the durability and mechanical properties of concrete. The results indicated that the activity of YPS was greater than that of fly ash. The high-volume electric furnace nickel slag-YPS concrete showed similar or even better mechanical properties and chloride ion permeability than high-volume fly ash concrete at later stages. Yang et al. [18] found that adding YPS significantly improved the flowability and reduced the autogenous shrinkage in the early stage of ultrahigh performance concrete. Although it decreases the early compressive strength of ultrahigh performance concrete, it still promotes long-term strength development.
The strength of cement mortar at an early age decreases significantly with increasing YPS dosage, which restricts the utilization of YPS in cement and concrete [19]. The early activity of YPS is comparatively poor, and the fluorine and phosphorus in YPS will delay the hardening and setting of cement [20]. The phosphorus is uniformly distributed in YPS. The distribution pattern of P is very similar to that of Si. P is mainly present in the solid solution of 3CaO·P2O5 and 2CaO·SiO2 [21]. Therefore, it is vital to improve the pozzolanic activity of YPS and enhance the early strength of high-value YPS-based cementitious materials. Mechanical, chemical and thermal activation methods are applied to enhance the pozzolanic activity of YPS [22,23,24,25,26]. He et al. [27] noted that the slurry pH, activity index and uniformity of YPS particle sizes significantly increased with increasing YPS granularity, and the impact on the strength and setting time of cement paste was significantly reduced. Hu et al. [28] found that superfine YPS refined the microstructure of concrete, which helped to improve the resistance to chloride ion penetration and carbonation of concrete in the later stage. In addition, superfine YPS is helpful for the late development on the splitting tensile strength and compressive strength of concrete. Allahverdi et al. [29] reported that an improvement in the specific surface area of YPS with mechanical activation significantly reduced the amount of water absorption and the total open pore volume of mortars. The synergistic combination of mechanical activation and chemical activation can enhance the quality of high YPS cement. Additionally, chemically activated YPS-based composite cement has a superior resistance to sodium sulfate [30]. Zhang et al. [31] found that the application of YPS retarded the early hydration of cement, but increasing the curing temperature tended to decrease this retarding effect. Wang et al. [32] showed that adding YPS increased the late compressive strength of fly ash-based geopolymers. Increasing the curing temperature and NaOH concentration can improve the compressive strength of geopolymers. Heat treatment or high-temperature curing can increase strength development but may also reduce ultimate strength [33]. However, most of the scholars studied the effect of high-temperature curing on the properties of YPS-based cement. The effect of heat treatment on the pozzolanic activity and structural change in YPS has rarely been studied.
The aim of this study is to increase the pozzolanic activity of YPS by thermal activation. The strength method, alkali dissolution method and polymerization degree method were used to evaluate the effect of thermal activation at different temperatures on the pozzolanic activity of YPS. The Fourier-transform infrared spectrometry (FTIR) and X-ray diffraction (XRD) techniques were used to characterize the phases formed during the calcination process. This study explores the mechanism of YPS during calcination and lays the foundation for the large-scale utilization of YPS.
2. Materials and Methods
YPS was provided by Guizhou, China, and 42.5 grade cement was taken from the Hebei cement plant. The standard sand was obtained from the Xiamen sand plant. The NaOH (Aladdin) was an analytical grade chemical reagent. Table 1 shows the chemical compositions of the raw materials. The main components of both YPS and cement are CaO and SiO2, and less Al2O3.
Table 1.
The chemical compositions of raw materials (wt.%).
| Oxides | CaO | SiO2 | Al2O3 | Fe2O3 | MgO | Na2O | K2O | SO3 | P2O5 | F |
|---|---|---|---|---|---|---|---|---|---|---|
| YPS | 44.72 | 34.84 | 6.00 | 1.19 | 1.94 | 0.35 | 1.43 | 2.36 | 3.18 | 3.24 |
| Cement | 63.48 | 20.70 | 5.00 | 3.59 | 2.76 | 0.14 | 0.82 | 2.59 | 0.075 | 0.096 |
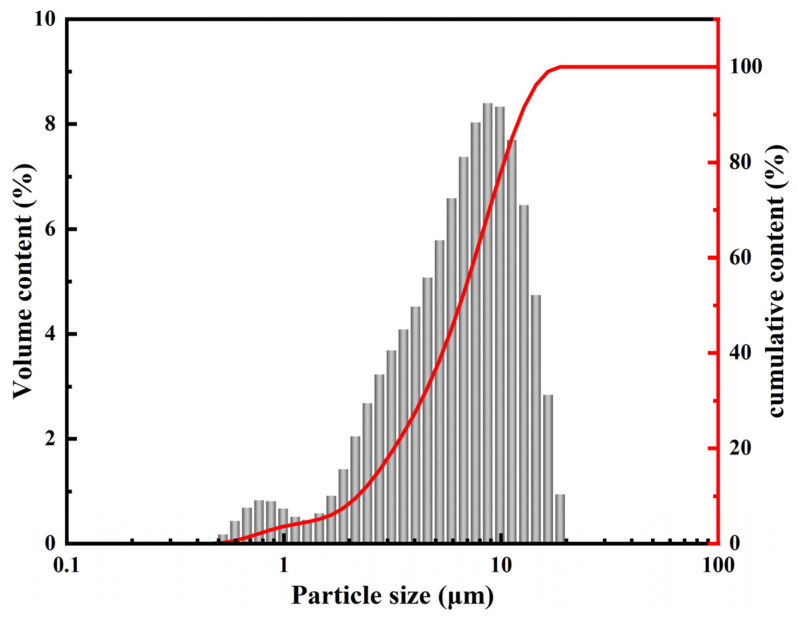
First, YPS was dried in the oven and milled in a ball mill for 90 min. The specific surface area of the ground YPS measured by the FBT-9 full automation instrument testing specific surface was 421 m2/kg, and Figure 1 shows its particle size distribution tested by a laser particle size analyzer (Mastersizer 2000, Malvern Instruments Ltd., Malvern, UK). The ground YPS particles are within the range of 0.5–18.7 μm with a mean of 7.30 μm.
Figure 1.
The particle size distribution of YPS.
Second, 300 g of ground YPS was placed in a muffle furnace, calcined at 100–1000 °C for 3 h and then cooled to room temperature. The heating speed of the muffle furnace was 5 °C/min. The YPS ash calcined at 800 °C and 1000 °C required grinding in a small ball mill for 20 min. YPS (n = 100–1000) represents the YPS ash calcined at different temperatures. Figure 2 shows the visual attributes of YPS ash. The color of YPS ash gradually changed from gray-white to flesh pink with the increase in calcination temperature. Finally, the pozzolanic activity of YPS ash was tested by the strength method, alkali dissolution method and polymerization degree method.
Figure 2.
The visual attributes of YPS ash.
The strength method was carried out according to the Chinese standard “ground granulated electric furnace phosphorus slag powder used for cement and concrete” (GB/T 26751-2022) [34]. The activity of YPS ash was evaluated by comparing the compressive strength of cement mortar with or without the addition of YPS ash. The specific steps were as follows: 225 g of water, 135 g of YPS ash, 315 g of cement and 1350 g of standard sand were mixed and stirred and then injected into a 40 × 40 × 160 cm mold with vibration; the mortar was put into a curing box with a temperature of 20 ± 1 °C and humidity of 95% for 3, 7 and 28 d. The proportion of the control group was 450 g of cement and 1350 g of standard sand. Table 2 shows the mix proportions of each sample. A press (HYE-300-10, Beijing Sanyulutong Instrument Co., Ltd., Beijing, China) was used to test the compressive strength of the mortar samples. The pozzolanic activity index (A) of YPS ash was evaluated according to Equation (1):
| (1) |
where Ri (MPa) represents the compressive strength of the YPS sample and R0 (MPa) represents the compressive strength of the control sample.
Table 2.
The mix proportions of the sample.
| Sample | YPS Ash/g | Cement/g | Standard Sand/g | Water/g | w/c Ratio |
|---|---|---|---|---|---|
| YPS sample | 135 | 315 | 1350 | 225 | 0.5 |
| Control sample | 0 | 450 | 1350 | 225 | 0.5 |
The steps of the alkali dissolution method were as follows: 1 g of YPS ash was taken into 100 mL of 1 mol/L NaOH solution, sealed and put in a curing box at 20 ± 1 °C for 7 d; then, it was filtered to obtain the filtrate. An ICP-OES (Optima 7000DV, PerkinElmer Instrument Co., Ltd., Shanghai, China) was used to test the concentrations of Si and Al in the filtrate.
The polymerization degree method used Origin software to fit and calculate the peak area of Si(Al)Qn at 800–1200 cm−1 of the FTIR spectra. Then, the polymerization degree of [SiO4] was evaluated using the concept of the relative bridging oxygen bond (RBO) according to Equation (2) [35]:
| (2) |
The chemical compositions of the YPS ash and cement were tested by X-ray fluorescence spectrometry (Shimadzu XRF-1700 series, Shanghai, China). The phase composition of YPS ash at different calcination temperatures was analyzed by an X-ray diffractometer (D8 advance, Germany). The experimental conditions were Cu target, current 40 mA, voltage 40 kV, scanning speed of 10°/min and scanning range of 10–90°.
Infrared spectra of YPS ash calcined at different temperatures were analyzed by Fourier-transform infrared spectrometry (Nicolet IS10, Thermo Nicolet Corporation, Madison, GA, USA) using the KBr pellet technique. The specific steps were as follows: 200 mg of KBr and 2 mg of sample were mixed evenly, ground to less than 5 µm and made into transparent slices. The measured wavenumber range was 400–4000 cm−1.
3. Results
3.1. XRD Analysis
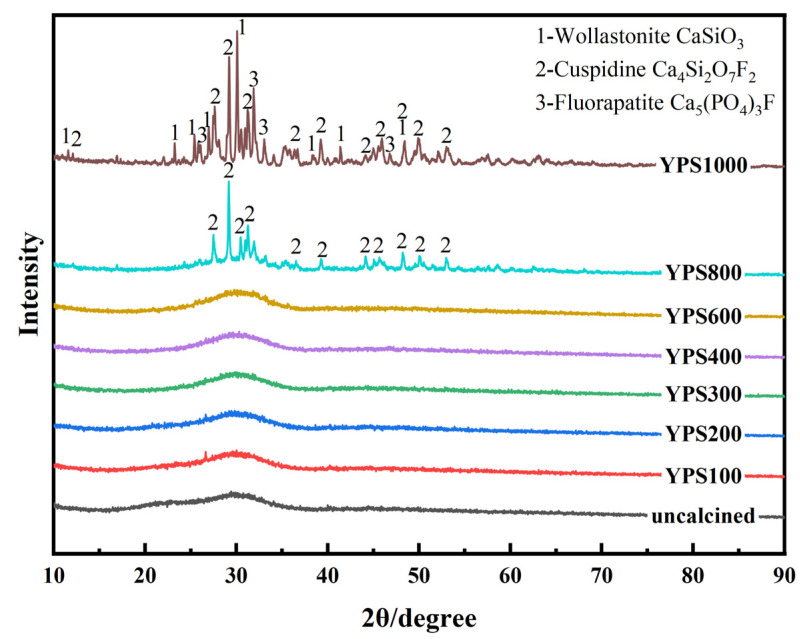
YPS is a complex industrial waste whose chemical composition and mineral phase vary greatly depending on the process and the raw materials used in its production. The main chemical compositions of YPS used in this study are calcium, silicon and aluminum, as well as small amounts of phosphorus, fluorine, sulfur, magnesium, potassium and iron. The XRD spectra of YPS ash uncalcined and calcined at 100–1000 °C are shown in Figure 3. The XRD spectra of uncalcined YPS and YPS100-600 are similar. None of them have significant diffraction peaks, and there is a major broad peak at 20–40°. This indicates that the YPS samples under these conditions are low chemically stable glassy substances, which is favorable for the pozzolanic reactions.
Figure 3.
XRD patterns of YPS ash uncalcined and calcined at different temperatures.
The phase compositions of YPS ash change gradually with increasing temperature. In the XRD spectra of YPS800, the diffraction peaks of cuspidine (Ca4Si2O7F2) appeared with the presence of bun peaks, and the area of the bun peaks decreases. The XRD spectra of YPS1000 shows that the diffraction peaks of the different phases are sharp and clear, indicating that there is little amorphous content in YPS ash and that the crystallinity of the phases is high. As the calcination temperature is raised from 800 °C to 1000 °C, the wollastonite (CaSiO3) and fluorapatite (Ca5(PO4)3F) phase appears, and the diffraction peak of cuspidine in YPS ash is enhanced. The main phase compositions of YPS1000 are wollastonite, cuspidine and fluorapatite.
3.2. Pozzolanic Activity Evaluation by Compressive Strength
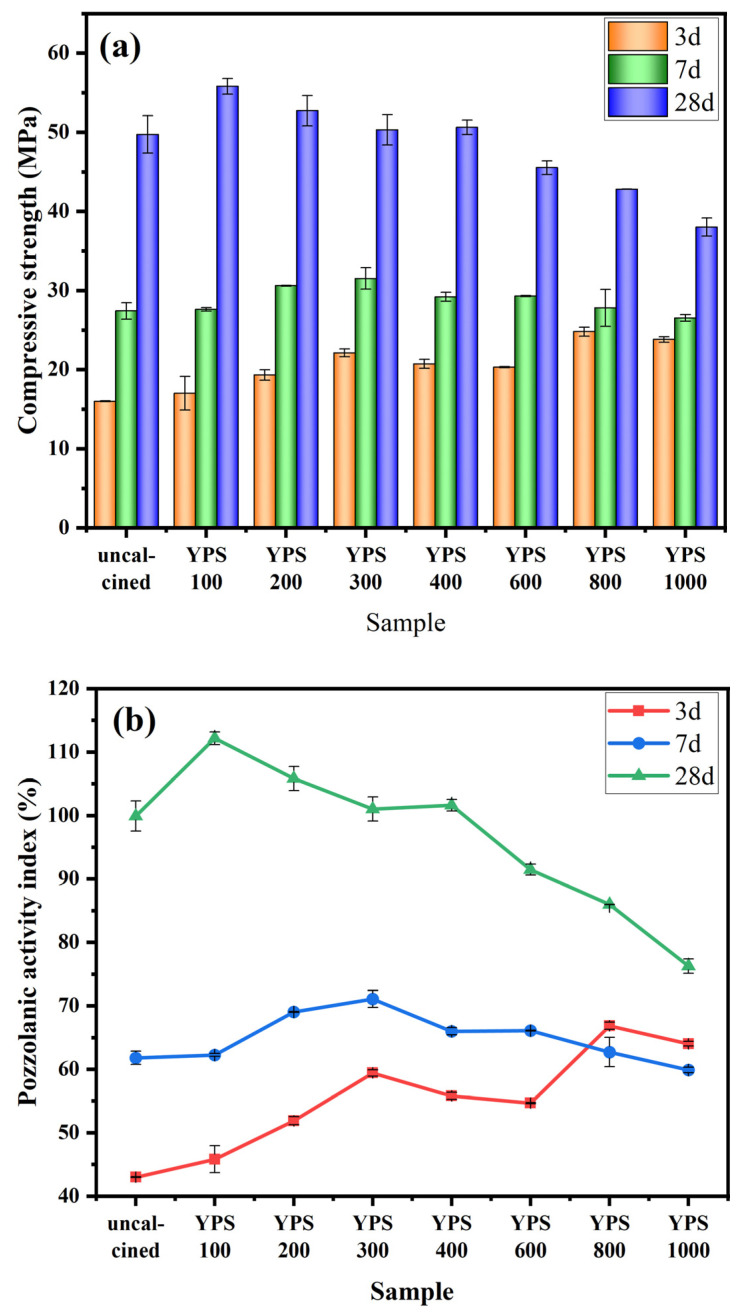
The pozzolanic activity of YPS ash can be calculated by the compressive strength of the YPS mortar. Figure 4 shows the compressive strength of YPS cement mortars and the pozzolanic activity index of YPS ash for 3, 7 and 28 d (the compressive strength of the control cement mortar is 37.1 MPa, 44.3 MPa and 49.8 MPa at 3, 7 and 28 d, respectively.). The compressive strength of the cement mortar varies with the calcination temperature, which proves that the calcination temperature has a significant effect on the cementitious properties of YPS ash. The compressive strength of YPS cement mortar probably increases and then reduces with the increasing calcination temperature. YPS800 has the highest 3 d compressive strength, with a value of 24.8 MPa, which is 55.0% higher than that of uncalcined YPS. This may be because the fluorine present in cuspidine is mainly insoluble and has little effect on the setting time of mortar [21]. However, the 28 d strength of YPS800 is relatively low, because the formation of crystalline phases makes the silica and aluminum in YPS800 difficult to dissolve at the later stage. This phenomenon illustrates that heat treatment can increase early strength but reduce ultimate strength. The 3 d compressive strength from YPS800 to YPS1000 decreases, which may be due to the generation of soluble Ca5(PO4)3F at 1000 °C, prolonging the setting time of the cement mortar and reducing its strength [21]. Compared to YPS uncalcined and YPS100-600, the 3 d compressive strength of YPS1000 is higher because a portion of fluorine in YPS1000 is present in the cuspidine, which reduces the retardation effect of fluorine on YPS1000 mortar. This also demonstrates that phosphorus and fluorine in the amorphous phase of YPS uncalcined and YPS100-600 are more easily soluble and affect the setting of YPS mortar. The 7 d compressive strength of the YPS300 mortar is the best, with a value of 31.5 MPa. The 28 d compressive strength of the YPS100 mortar is the highest, with a value of 55.8 MPa. This may be due to the gradual decrease in the amorphous substances in YPS with increasing calcination temperature.
Figure 4.
The (a) compressive strength of samples and (b) pozzolanic activity index of YPS ash uncalcined and calcined at different temperatures.
As can be seen from Figure 4b, the change in the pozzolanic activity index of YPS uncalcined and calcined at different temperatures is the same as the change in its compressive strength. The calcination of YPS can improve the pozzolanic activity index at 3 d, but it will reduce the pozzolanic activity index at 28 d, and the enhancement of the pozzolanic activity index at 7 d is less obvious. The calcination of YPS at 800 °C is favorable to enhance the compressive strength of YPS cement mortar at an early age, while YPS calcined at 100 °C is conducive to increasing the ultimate strength of YPS cement mortar.
3.3. Pozzolanic Activity Evaluation by Dissolution Concentrations of Si and Al
Reactive Si and Al dissolved in alkaline environments can take part in the hydration reaction of cement. Therefore, the pozzolanic activity of YPS ash can be evaluated by the alkaline dissolution method. The dissolution concentrations of Si and Al in a 1 mol/L NaOH solution of YPS uncalcined and calcined at different temperatures are shown in Table 3. The dissolution concentrations of Si and Al first increase and then decrease with increasing temperature. The dissolution concentrations of Si and Al in YPS100 are 41.01 mg/L and 30.08 mg/L, respectively. Its dissolution concentration of (Si + Al) is the highest, which is consistent with the 28 d compressive strength of YPS cement mortars. The lowest dissolution concentrations of Si, Al and (Si + Al) are 7.197 mg/L, 10.08 mg/L and 17.28 mg/L in YPS1000, respectively. And its 28 d compressive strength and pozzolanic activity index at 28 d are also the lowest.
Table 3.
The dissolution concentrations of Si and Al in YPS ash uncalcined and calcined at different temperatures (mg/L).
| Sample | Dissolution Concentration of Si | Dissolution Concentration of Al | Dissolution Concentration of (Si + Al) |
|---|---|---|---|
| uncalcined | 40.83 | 25.01 | 65.84 |
| YPS100 | 41.01 | 30.08 | 71.09 |
| YPS200 | 35.71 | 31.79 | 67.50 |
| YPS300 | 33.71 | 27.19 | 60.90 |
| YPS400 | 28.17 | 23.84 | 52.01 |
| YPS600 | 24.97 | 15.29 | 40.26 |
| YPS800 | 15.79 | 14.16 | 29.95 |
| YPS1000 | 7.197 | 10.08 | 17.28 |
The trend of the pozzolanic activity index for 28 d with temperature is basically consistent with that of the dissolution concentrations of Si and Al. Therefore, the relationship between the pozzolanic activity index of YPS ash at 28 d and the dissolution concentrations of Si and Al has been studied, as shown in Figure 5. The dissolution concentrations of Si, Al and (Si + Al) in YPS ash are positively related to its pozzolanic activity index for 28 d. The pozzolanic activity index for 28 d increases with increasing dissolution concentrations of Si, Al and (Si + Al). The linear fit R2 about pozzolanic activity index and dissolution concentrations of Si, Al and (Si + Al) was progressively increasing with values of 0.87, 0.91 and 0.93, respectively. This shows that the dissolution concentrations of both Si and Al have an effect on the pozzolanic activity of YPS ash. The change rule of the pozzolanic activity index for 3 and 7 d and the dissolution concentration of Si and Al is a little different, which indicates that the early strength of YPS mortar is not only affected by the dissolution concentration of Si and Al but also by the role of soluble fluorine and phosphorus.
Figure 5.
The relationship between the dissolution concentrations of (a) Si, (b) Al and (c) (Si + Al) and the pozzolanic activity index of YPS.
3.4. Pozzolanic Activity Evaluation by FTIR
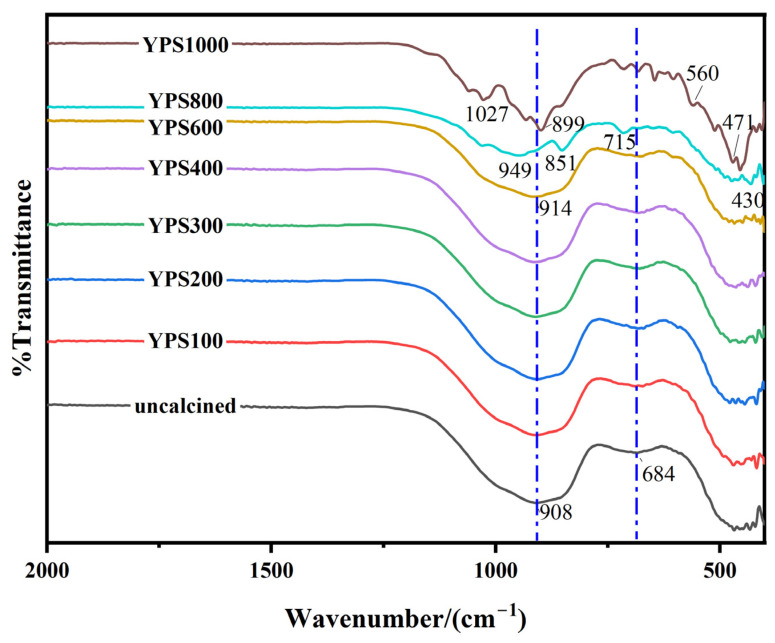
The FTIR spectra of YPS ash uncalcined and calcined at 100–1000 °C are shown in Figure 6. The FTIR spectra of YPS ash uncalcined and calcined in the range of 100–600 °C are very similar and show analogous absorption bands. The FTIR spectra can be divided into three regions of 800–1200 cm−1, 600–800 cm−1 and 400–600 cm−1. The peaks of 800–1200 cm−1 correspond to the asymmetric tensile vibrations of Si-O-(Si, Al) linked to the tetrahedral of [SiO4] or [AlO4]− [32]. The peaks at 600–800 cm−1 are the symmetric stretching vibrations of Si-O-Al or Si-O-Si in the tetrahedra of [SiO4] or [AlO4]− [35]. The peaks in the 400–600 cm−1 range are the bending vibrations of Si-O-Si(Al) [29,35]. The positions and areas of the peaks of 800–1200 cm−1 vary with temperature, indicating that the bonds between Si, Al and O in YPS ash are combined or broken. The peaks of the Si-O-Si/Al bonds move to higher wavenumbers (949 cm−1) with increasing temperature, indicating an improvement in the polymerization degree. The absorption peaks belong to PO43− bands at 471 cm−1, 560 cm−1 and 1027 cm−1, which proves the formation of fluorapatite at 1000 °C [36]. This is consistent with the results of the XRD analysis.
Figure 6.
FTIR spectra of YPS ash uncalcined and calcined at different temperatures.
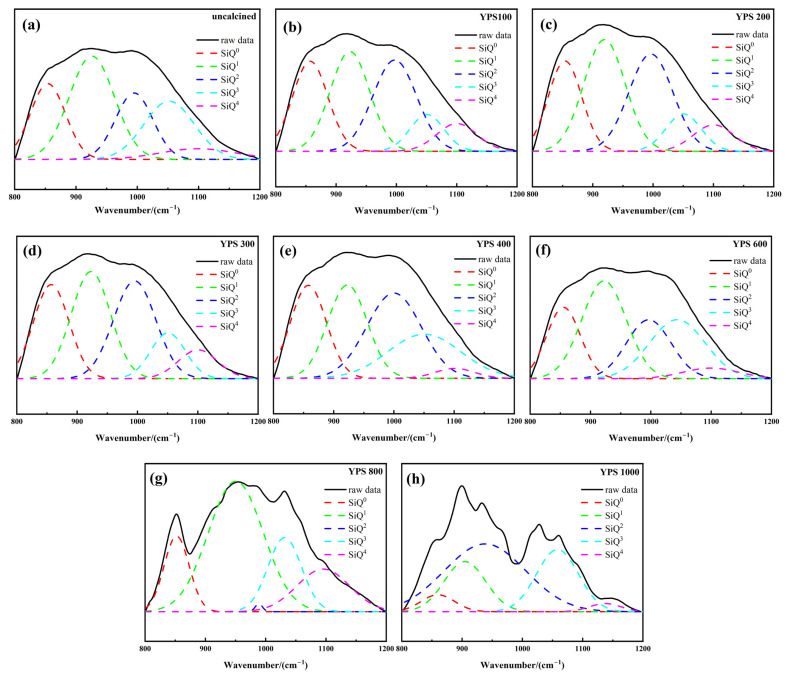
The five bands at 1200 cm−1, 1050 cm−1, 1000 cm−1, 900 cm−1 and 850 cm−1 are assigned to Q4 Si, Q3 Si, Q2 Si, Q1 Si and Q0 Si, respectively. The superscript n is the number of bridge oxygens attached to each Si. The polymerization degree of the silicate structure is higher as n increases. The peaks between 800 and 1200 cm−1 were separated and fitted with Origin software to calculate the RBO. Figure 7 shows the fitted peaks between 800 and 1200 cm−1 of YPS ash uncalcined and calcined at different temperatures. The relevant parameters of the peaks are shown in Table 4. The polymerization degree of YPS ash first decreases and then increases with increasing temperature. The high degree of polymerization indicates that silicon and aluminum are relatively stable. The lower degree of polymerization demonstrates that the Si-O-Si(Al) in YPS ash is broken, and the active silicon and active aluminum in YPS ash are increased [35]. The RBO of the YPS100 is the smallest, with a value of 0.3757. The RBO of the YPS1000 is the biggest, with a value of 0.4982. This result is consistent with the 28 d compressive strength and dissolution concentrations of Si and Al. In addition, the R2 of the infrared fitting result decreases when the temperature is more than 800 °C. This is due to the appearance of a new crystalline phase, which can also be seen from the XRD results. Therefore, the RBO evaluation method is suitable for materials with no other influence in the range of 800–1200 cm−1.
Figure 7.
The fitted peaks in the range of 800–1200 cm−1 of YPS ash uncalcined and calcined at different temperatures: (a) uncalcined; (b) YPS100; (c) YPS200; (d) YPS300; (e) YPS400; (f) YPS600; (g) YPS800; (h) YPS1000.
Table 4.
The relevant peaks parameters of YPS ash uncalcined and calcined at different temperatures.
| Sample | Relative Content/% | RBO | R2 | ||||
|---|---|---|---|---|---|---|---|
| SiQ0 | SiQ1 | SiQ2 | SiQ3 | SiQ4 | |||
| uncalcined | 19.24 | 34.83 | 18.43 | 21.78 | 5.72 | 0.3998 | 0.996 |
| YPS100 | 23.22 | 29.34 | 29.75 | 9.33 | 8.36 | 0.3757 | 0.996 |
| YPS200 | 20.63 | 32.40 | 30.14 | 9.24 | 7.59 | 0.3769 | 0.997 |
| YPS300 | 22.75 | 29.38 | 28.86 | 11.07 | 7.94 | 0.3802 | 0.997 |
| YPS400 | 21.48 | 24.35 | 30.66 | 20.95 | 2.56 | 0.3969 | 0.996 |
| YPS600 | 17.78 | 33.02 | 19.95 | 24.81 | 4.44 | 0.4128 | 0.997 |
| YPS800 | 13.68 | 51.86 | 0.42 | 17.95 | 16.09 | 0.4273 | 0.983 |
| YPS1000 | 5.14 | 19.10 | 49.46 | 23.94 | 2.36 | 0.4982 | 0.963 |
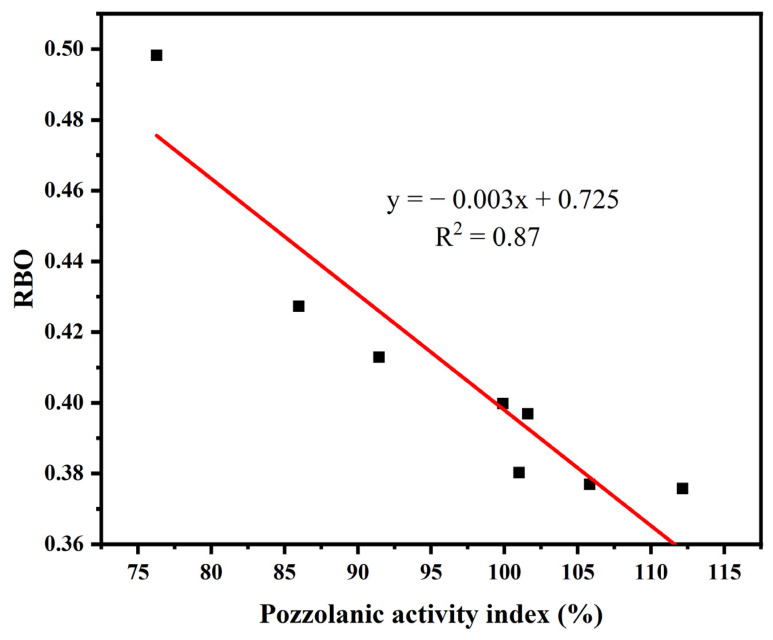
Figure 8 shows the relationship between the pozzolanic activity and RBO of YPS ash uncalcined and calcined at different temperatures. The RBO of YPS ash tends to decrease with increasing pozzolanic activity. Figure 9 shows the relationship between the RBO and the dissolution concentrations of Si, Al and (Si + Al) of YPS ash uncalcined and calcined at different temperatures. RBO has a linear relationship with the dissolution concentrations of Si and Al. The decrease in RBO promotes an increase in the dissolution concentration of Si and Al in the YPS ash. The linear fit R2 about the RBO and pozzolanic activity is 0.87. The linear fits R2 about the RBO and dissolution concentrations of Si, Al and (Si + Al) are 0.80, 0.79 and 0.83, respectively. The linear fits R2 are poor compared with that of pozzolanic activity and dissolution concentrations of Si, Al and (Si + Al). This is mainly due to the fact that the infrared peaks in the range of 800–1200 cm−1 of YPS1000 are interfered with by other functional groups and the fitting effect of RBO is weakened. This shows that the dissolution concentrations of both Si and Al have an effect on the pozzolanic activity of YPS ash. The polymerization degree method for evaluating the pozzolanic activity of YPS ash takes less time and is more convenient compared to the strength and alkali dissolution methods, but it is susceptible to the influence of the physical phase.
Figure 8.
The relationship between RBO and the pozzolanic activity index of YPS ash.
Figure 9.
The relationship between RBO and the dissolution concentrations of (a) Si; (b) Al; and (c) (Si + Al).
4. Conclusions
In this paper, the phase and structural transformations of YPS ash during calcination at 100–1000 °C were investigated, and the changes in the pozzolanic activity of YPS ash were studied by the compressive strength method, alkaline dissolution method and polymerization degree method. This study provides insight into the gelling behavior of YPS ash.
The uncalcined YPS mainly contains amorphous aluminosilicates. As the calcination temperature increases to 800 °C, crystalline phases appear in the YPS ash. Cuspidine (Ca4Si2O7F2) is formed at 800 °C. The formation of fluorapatite (Ca5(PO4)3F) and wollastonite (CaSiO3) occurs at 1000 °C. The polymerization degree decreases and then increases with increasing calcination temperature. The polymerization degree is lowest at 100 °C. Due to the change in phase and polymerization degree, the calcination temperature has a great influence on the pozzolanic activity of YPS ash. It was found that YPS ash calcined at 800 °C favored the early strength of the sample, and YPS ash calcined at 100 °C had the highest 28 d compressive strength.
The relationships between the dissolution concentration of (Si + Al), compressive strength and polymerization degree and the pozzolanic activity of YPS ash were analyzed. The pozzolanic activity of YPS ash is positively correlated with the compressive strength and the dissolution concentration of (Si + Al) and negatively associated with the polymerization degree.
This study provides a possibility for the utilization of YPS in cement and concrete, which is conducive to the use of YPS in large dosages.
Author Contributions
Conceptualization, X.L. (Xinyue Liu), X.L. (Xiaoming Liu) and Z.Z.; validation, C.W. and Q.Z.; investigation, X.L. (Xinyue Liu), C.W., Q.Z. and Y.L.; data curation, X.L. (Xinyue Liu) and S.M.; writing—original draft preparation, X.L. (Xinyue Liu); writing—review and editing, X.L. (Xiaoming Liu) and Z.Z.; supervision, X.L. (Xiaoming Liu) and Z.Z. All authors have read and agreed to the published version of the manuscript.
Institutional Review Board Statement
Not applicable.
Informed Consent Statement
Not applicable.
Data Availability Statement
Data sharing is not applicable to this article.
Conflicts of Interest
The authors declare no conflict of interest.
Funding Statement
This research was funded by the National Natural Science Foundation of China, grant number 52074035, the Young Elite Scientists Sponsorship Program by CAST, grant number 2022QNRC001, and the Fundamental Research Funds for the Central Universities, grant numbers 00007720 and 00007469.
Footnotes
Disclaimer/Publisher’s Note: The statements, opinions and data contained in all publications are solely those of the individual author(s) and contributor(s) and not of MDPI and/or the editor(s). MDPI and/or the editor(s) disclaim responsibility for any injury to people or property resulting from any ideas, methods, instructions or products referred to in the content.
References
- 1.Hassankhani-Majd Z., Anbia M. Recovery of Valuable Materials from Phosphorus Slag Using Nitric Acid Leaching Followed by Precipitation Method. Resour. Conserv. Recycl. 2021;169:105547. doi: 10.1016/j.resconrec.2021.105547. [DOI] [Google Scholar]
- 2.Akcil A., Karshigina Z.B., Bochevskaya Y.G., Abisheva Z.S. Conditions of Nitric Acid Treatment of Phosphorus Slag for Rems Recovery and Production of Precipitated Silicon Dioxide. Complex Use Miner. Resour. 2018;305:28–38. doi: 10.31643/2018/6445.4. [DOI] [Google Scholar]
- 3.Abisheva Z.S., Karshigina Z.B., Bochevskaya Y.G., Akcil A., Sargelova E.A., Kvyatkovskaya M.N., Silachyov I.Y. Recovery of Rare Earth Metals as Critical Raw Materials from Phosphorus Slag of Long-Term Storage. Hydrometallurgy. 2017;173:271–282. doi: 10.1016/j.hydromet.2017.08.022. [DOI] [Google Scholar]
- 4.Liu X., Liu X., Zhang Z. Recycling and Comprehensive Utilization of Yellow Phosphorus Slag in Building Materials: A Review. Constr. Build. Mater. 2023;396:132384. doi: 10.1016/j.conbuildmat.2023.132384. [DOI] [Google Scholar]
- 5.Nguyen V.H., Nguyen V.C., Nguyen T.C., Tran D.M.T., Nguyen T.T.T., Vu Q.T., Nguyen D.T., Thai H. Treatment of Yellow Phosphorus Slag and Reuse of It as an Absorbent of Chromium (VI) Ions and Methylene Blue. J. Chem. 2020;2020:1834829. doi: 10.1155/2020/1834829. [DOI] [Google Scholar]
- 6.Hassankhani-Majd Z., Anbia M., Tavoussi-Shirazi D.S. A Zero-Waste Process for the Extraction of Highly Pure Nanoporous Silica Particles from Phosphorus Slag. JOM. 2022;74:1002–1011. doi: 10.1007/s11837-021-05111-0. [DOI] [Google Scholar]
- 7.Naseroleslami R., Bakhshi J., Nemati Chari M., Yaghoobi M.A., Haji Mahdi M. Properties of Cement Mortars Containing Phosphorous Slag. J. Mater. Civ. Eng. 2023;35:04022384. doi: 10.1061/(ASCE)MT.1943-5533.0004564. [DOI] [Google Scholar]
- 8.Pavlíková M., Rovnaníková P., Záleská M., Pavlík Z. Diatomaceous Earth—Lightweight Pozzolanic Admixtures for Repair Mortars—Complex Chemical and Physical Assessment. Materials. 2022;15:6881. doi: 10.3390/ma15196881. [DOI] [PMC free article] [PubMed] [Google Scholar]
- 9.Maghsoodloorad H., Allahverdi A. Efflorescence Formation and Control in Alkali-Activated Phosphorus Slag Cement. Int. J. Civ. Eng. 2016;14:425–438. doi: 10.1007/s40999-016-0027-0. [DOI] [Google Scholar]
- 10.Mehdizadeh H., Shao X., Mo K.H., Ling T.C. Enhancement of Early Age Cementitious Properties of Yellow Phosphorus Slag via CO2 Aqueous Carbonation. Cem. Concr. Compos. 2022;133:104702. doi: 10.1016/j.cemconcomp.2022.104702. [DOI] [Google Scholar]
- 11.Mehdizadeh H., Kani E. Modeling the Influence of Chemical Composition on Compressive Strength Behavior of Alkali-Activated Phosphorus Slag Cement Using Statistical Design. Can. J. Civ. Eng. 2018;45:1073–1083. doi: 10.1139/cjce-2018-0132. [DOI] [Google Scholar]
- 12.Golewski G. Evaluation of Morphology and Size of Cracks of the Interfacial Transition Zone (ITZ) in Concrete Containing Fly Ash (FA) J. Hazard. Mater. 2018;357:298–304. doi: 10.1016/j.jhazmat.2018.06.016. [DOI] [PubMed] [Google Scholar]
- 13.Allahverdi A., Mahinroosta M., Pilehvar S. A Temperature–Age Model For Prediction of Compressive Strength of Chemically Activated High Phosphorus Slag Content Cement. Int. J. Civ. Eng. 2017;15:839–847. doi: 10.1007/s40999-017-0196-5. [DOI] [Google Scholar]
- 14.Shaikezhan A., Anuarova A.D., Antonovic V. Cement Slurry from Electro-Phosphoric Slag. Mag. Civ. Eng. 2020;98:9806. doi: 10.18720/MCE.98.6. [DOI] [Google Scholar]
- 15.Vafaei M., Allahverdi A., Dong P., Bassim N., Mahinroosta M. Resistance of Red Clay Brick Waste/Phosphorus Slag-Based Geopolymer Mortar to Acid Solutions of Mild Concentration. J. Build. Eng. 2021;34:102066. doi: 10.1016/j.jobe.2020.102066. [DOI] [Google Scholar]
- 16.Mahambetova U., Nuranbayeva B., Estemesov Z., Sadykov P., Mamyrbayev O., Oralbekova D. Development And Research Of The Influence Of The Composition And Concentration Of Activators On The Strength Of Phosphorus Slag Binders. East.-Eur. J. Enterp. Technol. 2021;5:54–61. doi: 10.15587/1729-4061.2021.242814. [DOI] [Google Scholar]
- 17.Wang Q., Huang Z., Wang D. Influence of High-Volume Electric Furnace Nickel Slag and Phosphorous Slag on the Properties of Massive Concrete. J. Therm. Anal. Calorim. 2018;131:873–885. doi: 10.1007/s10973-017-6576-x. [DOI] [Google Scholar]
- 18.Yang R., Yu R., Shui Z., Gao X., Xiao X., Zhang X., Wang Y., He Y. Low Carbon Design of an Ultra-High Performance Concrete (UHPC) Incorporating Phosphorous Slag. J. Clean. Prod. 2019;240:118157. doi: 10.1016/j.jclepro.2019.118157. [DOI] [Google Scholar]
- 19.Allahverdi A., Bahri Rasht Abadi M.M. Resistance of Chemically Activated High Phosphorous Slag Content Cement against Frost-Salt Attack. Cold Reg. Sci. Technol. 2014;98:18–25. doi: 10.1016/j.coldregions.2013.11.001. [DOI] [Google Scholar]
- 20.Maghsoodloorad H., Allahverdi A. Developing Low-Cost Activators for Alkali-Activated Phosphorus Slag-Based Binders. J. Mater. Civ. Eng. 2017;29:04017006. doi: 10.1061/(ASCE)MT.1943-5533.0001806. [DOI] [Google Scholar]
- 21.Wang Y., Zhang N., Xiao H., Zhao J., Zhang Y., Liu X. Structural Characterization of Phosphorous Slag Regarding Occurrence State of Phosphorus in Dicalcium Silicate. Materials. 2022;15:7450. doi: 10.3390/ma15217450. [DOI] [PMC free article] [PubMed] [Google Scholar]
- 22.Vafaei M., Allahverdi A. Strength Development and Acid Resistance of Geopolymer Based on Waste Clay Brick Powder and Phosphorous Slag. Struct. Concr. 2019;20:1596–1606. doi: 10.1002/suco.201800138. [DOI] [Google Scholar]
- 23.Mehdizadeh H., Najafi Kani E., Palomo Sanchez A., Fernandez-Jimenez A. Rheology of Activated Phosphorus Slag with Lime and Alkaline Salts. Cem. Concr. Res. 2018;113:121–129. doi: 10.1016/j.cemconres.2018.07.010. [DOI] [Google Scholar]
- 24.Salehi A., Najafi Kani E. Green Cylindrical Mesoporous Adsorbent Based on Alkali-Activated Phosphorous Slag: Synthesis, Dye Removal, and RSM Modeling. Adsorption. 2018;24:647–666. doi: 10.1007/s10450-018-9972-z. [DOI] [Google Scholar]
- 25.Mehdizadeh H., Najafi Kani E. Rheology and Apparent Activation Energy of Alkali Activated Phosphorous Slag. Constr. Build. Mater. 2018;171:197–204. doi: 10.1016/j.conbuildmat.2018.03.130. [DOI] [Google Scholar]
- 26.Maghsoodloorad H., Khalili H., Allahverdi A. Alkali-Activated Phosphorous Slag Performance under Different Curing Conditions: Compressive Strength, Hydration Products, and Microstructure. J. Mater. Civ. Eng. 2017;30:04017253. doi: 10.1061/(ASCE)MT.1943-5533.0002101. [DOI] [Google Scholar]
- 27.He X., Ye Q., Yang J., Dai F., Su Y., Wang Y., Bohumír S. Physico-Chemical Characteristics of Wet-Milled Ultrafine-Granulated Phosphorus Slag as a Supplementary Cementitious Material. J. Wuhan Univ. Technol. Mater. Sci. Ed. 2018;33:625–633. doi: 10.1007/s11595-018-1870-4. [DOI] [Google Scholar]
- 28.Hu J. Comparison between the Effects of Superfine Steel Slag and Superfine Phosphorus Slag on the Long-Term Performances and Durability of Concrete. J. Therm. Anal. Calorim. 2017;128:1251–1263. doi: 10.1007/s10973-017-6107-9. [DOI] [Google Scholar]
- 29.Allahverdi A., Mahinroosta M. Mechanical Activation of Chemically Activated High Phosphorous Slag Content Cement. Powder Technol. 2013;245:182–188. doi: 10.1016/j.powtec.2013.04.037. [DOI] [Google Scholar]
- 30.Allahverdi A., Akhondi M., Mahinroosta M. Superior Sodium Sulfate Resistance of a Chemically Activated Phosphorus Slag–Based Composite Cement. J. Mater. Civ. Eng. 2017;29:04016231. doi: 10.1061/(asce)mt.1943-5533.0001762. [DOI] [Google Scholar]
- 31.Zhang Z., Wang Q., Yang J. Hydration Mechanisms of Composite Binders Containing Phosphorus Slag at Different Temperatures. Constr. Build. Mater. 2017;147:720–732. doi: 10.1016/j.conbuildmat.2017.04.202. [DOI] [Google Scholar]
- 32.Wang Y., Xiao R., Hu W., Jiang X., Zhang X., Huang B. Effect of Granulated Phosphorus Slag on Physical, Mechanical and Microstructural Characteristics of Class F Fly Ash Based Geopolymer. Constr. Build. Mater. 2021;291:123287. doi: 10.1016/j.conbuildmat.2021.123287. [DOI] [Google Scholar]
- 33.Allahverdi A., Pilehvar S., Mahinroosta M. Influence of Curing Conditions on the Mechanical and Physical Properties of Chemically-Activated Phosphorous Slag Cement. Powder Technol. 2016;288:132–139. doi: 10.1016/j.powtec.2015.10.053. [DOI] [Google Scholar]
- 34.Administration M., Standardization A. The Chinese Standard Ground Granulated Electric Furnace Phosphorus Slag Powder Used for Cement and Concrete, in Chinese Code GB/T 26751-2022. Chinese Standard Press; Beijing, China: 2022. [Google Scholar]
- 35.Wang Y., Liu X., Xie Z., Wang H., Zhang W., Xue Y. Rapid Evaluation of the Pozzolanic Activity of Bayer Red Mud by a Polymerization Degree Method: Correlations with Alkali Dissolution of (Si + Al) and Strength. Materials. 2021;14:5546. doi: 10.3390/ma14195546. [DOI] [PMC free article] [PubMed] [Google Scholar]
- 36.Liu X., Ren Y., Zhang Z., Liu X., Wang Y. Harmless Treatment of Electrolytic Manganese Residue: Ammonia Nitrogen Recovery, Preparation of Struvite and Nonsintered Bricks. Chem. Eng. J. 2023;455:140739. doi: 10.1016/j.cej.2022.140739. [DOI] [Google Scholar]
Associated Data
This section collects any data citations, data availability statements, or supplementary materials included in this article.
Data Availability Statement
Data sharing is not applicable to this article.


